
Ecotoxicological Effects of the Anionic Surfactant Sodium Dodecyl Sulfate (SDS) in Two Marine Primary Producers: Phaeodactylum tricornutum and Ulva lactuca
 , ,
, ,  ,
,  , ,
, , 
Abstract
:1. Introduction
2. Materials and Methods
2.1. Experimental Setup
2.2. Growth Rates and Inhibition
2.3. Chlorophyll a Pulse Amplitude Modulated (PAM) Fluorometry
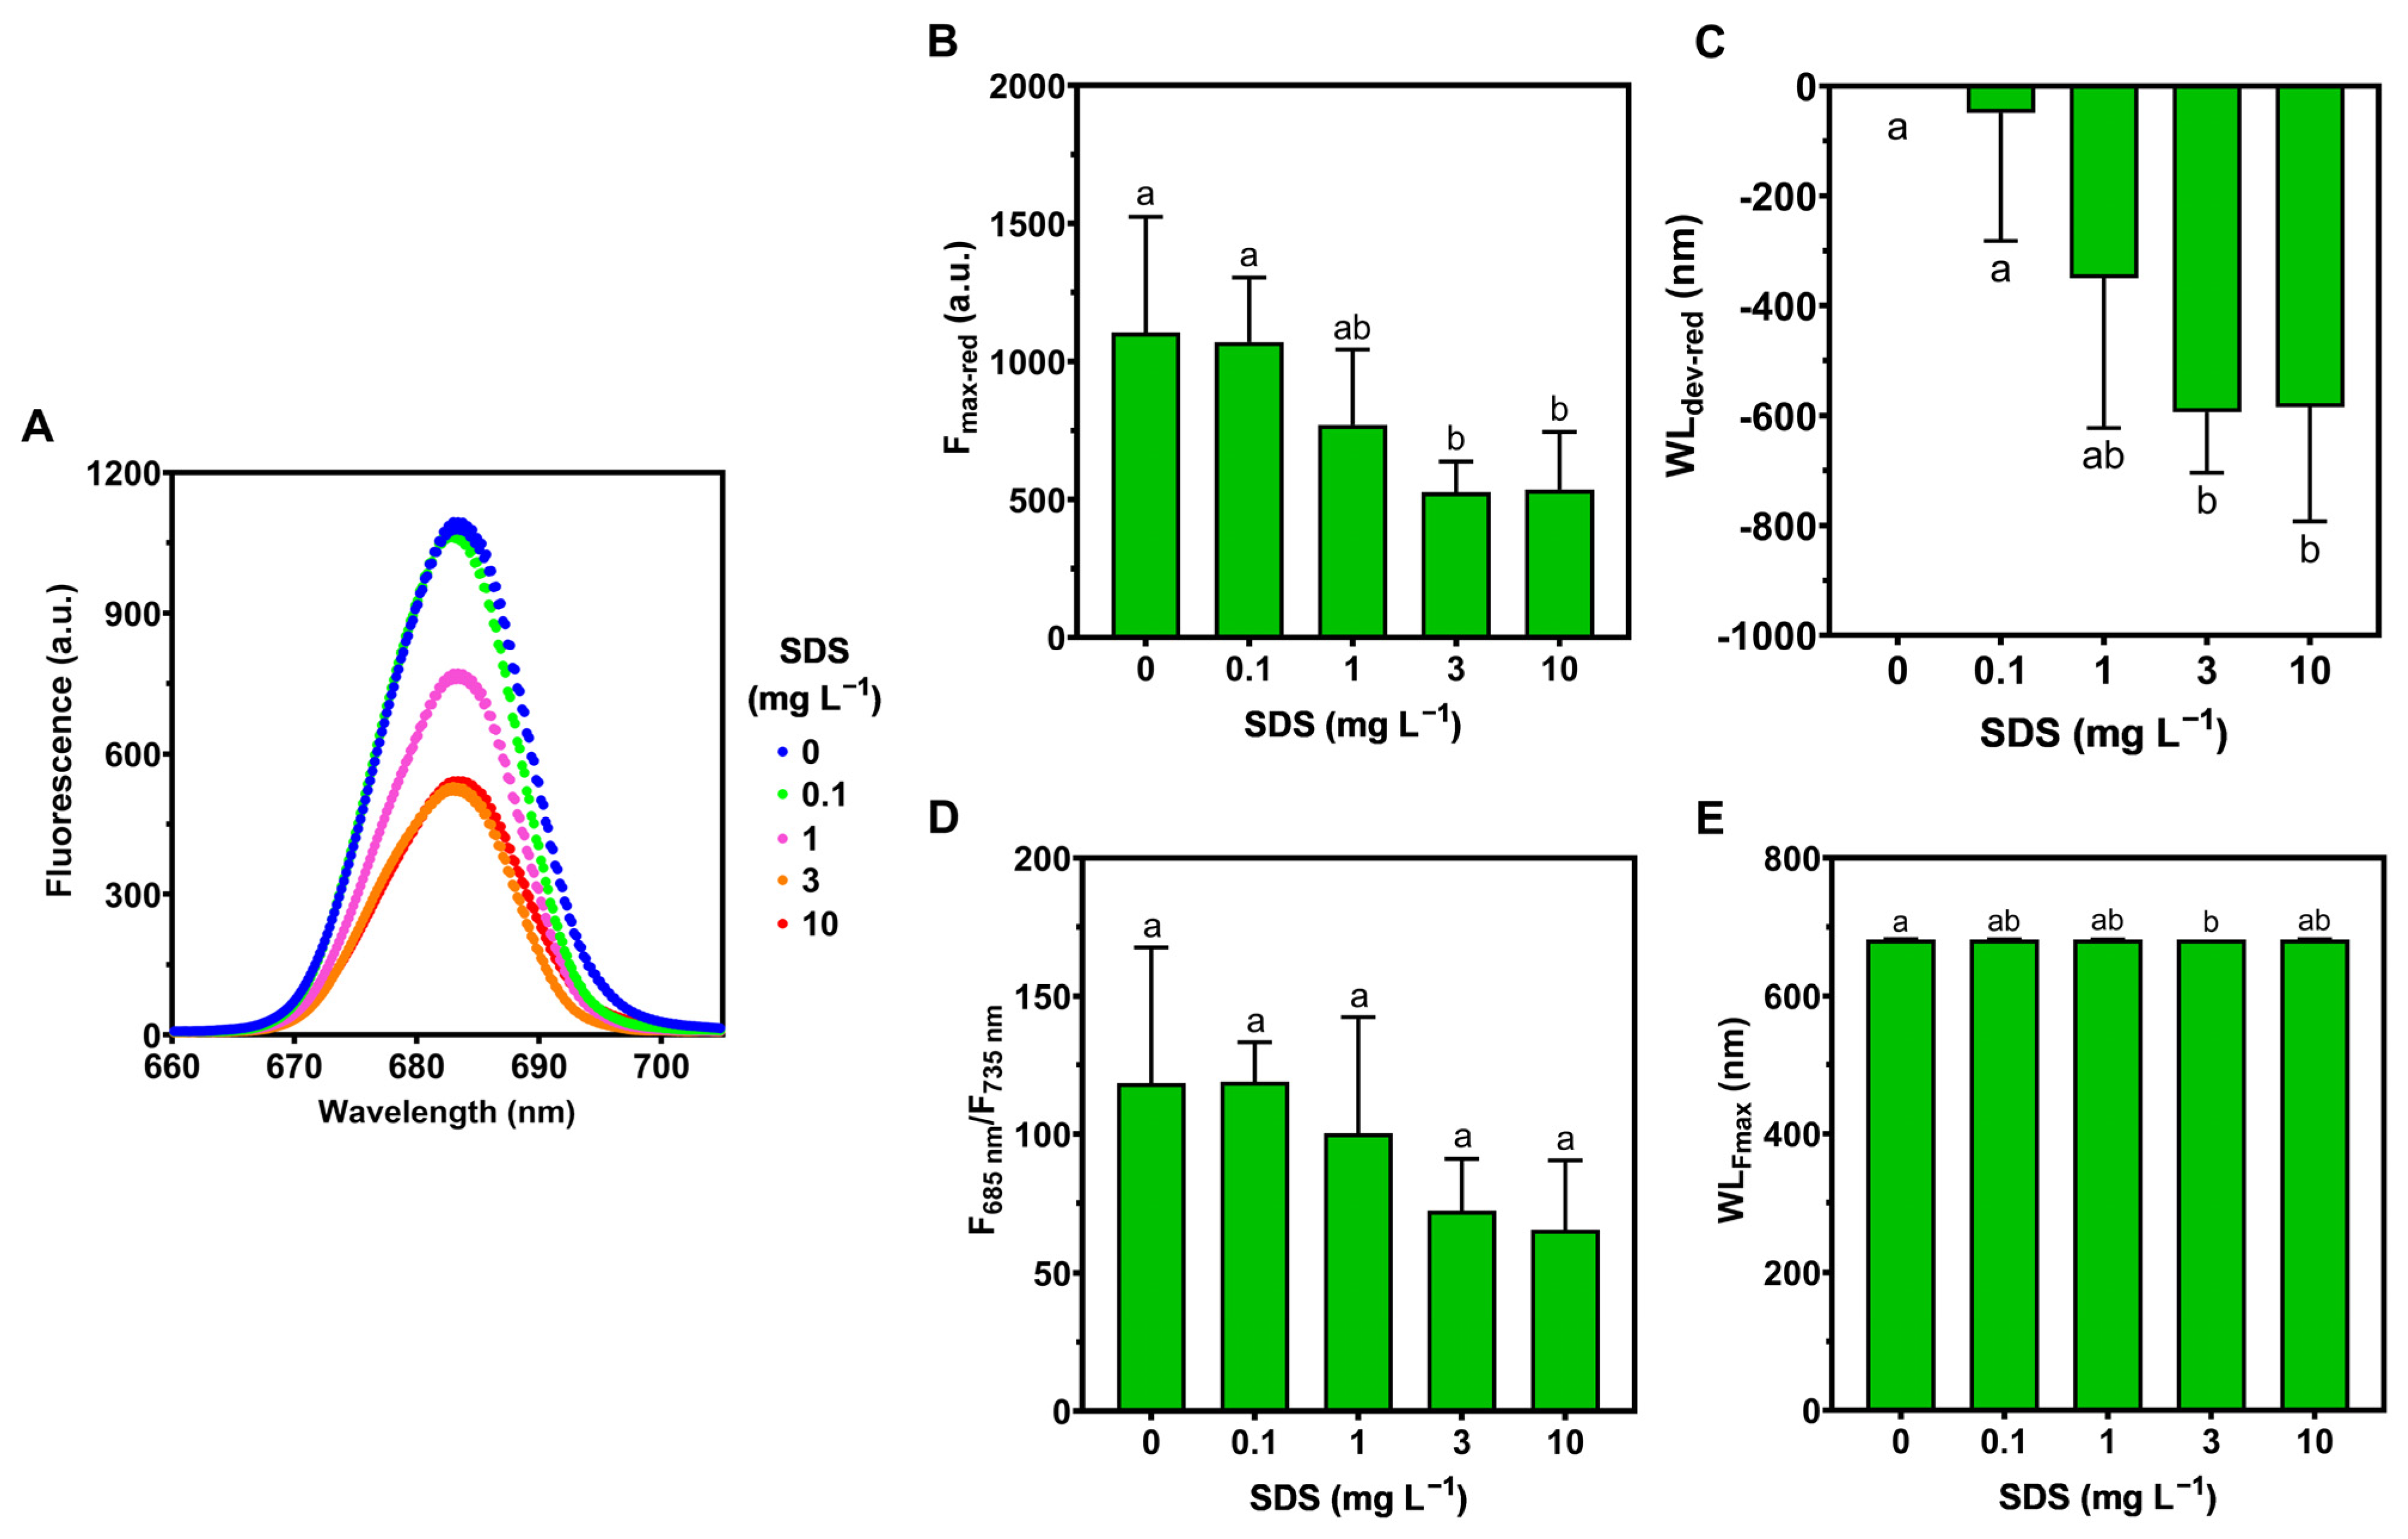
2.4. Laser-Induced Fluorescence (LIF) Analysis
2.5. Pigment Analysis
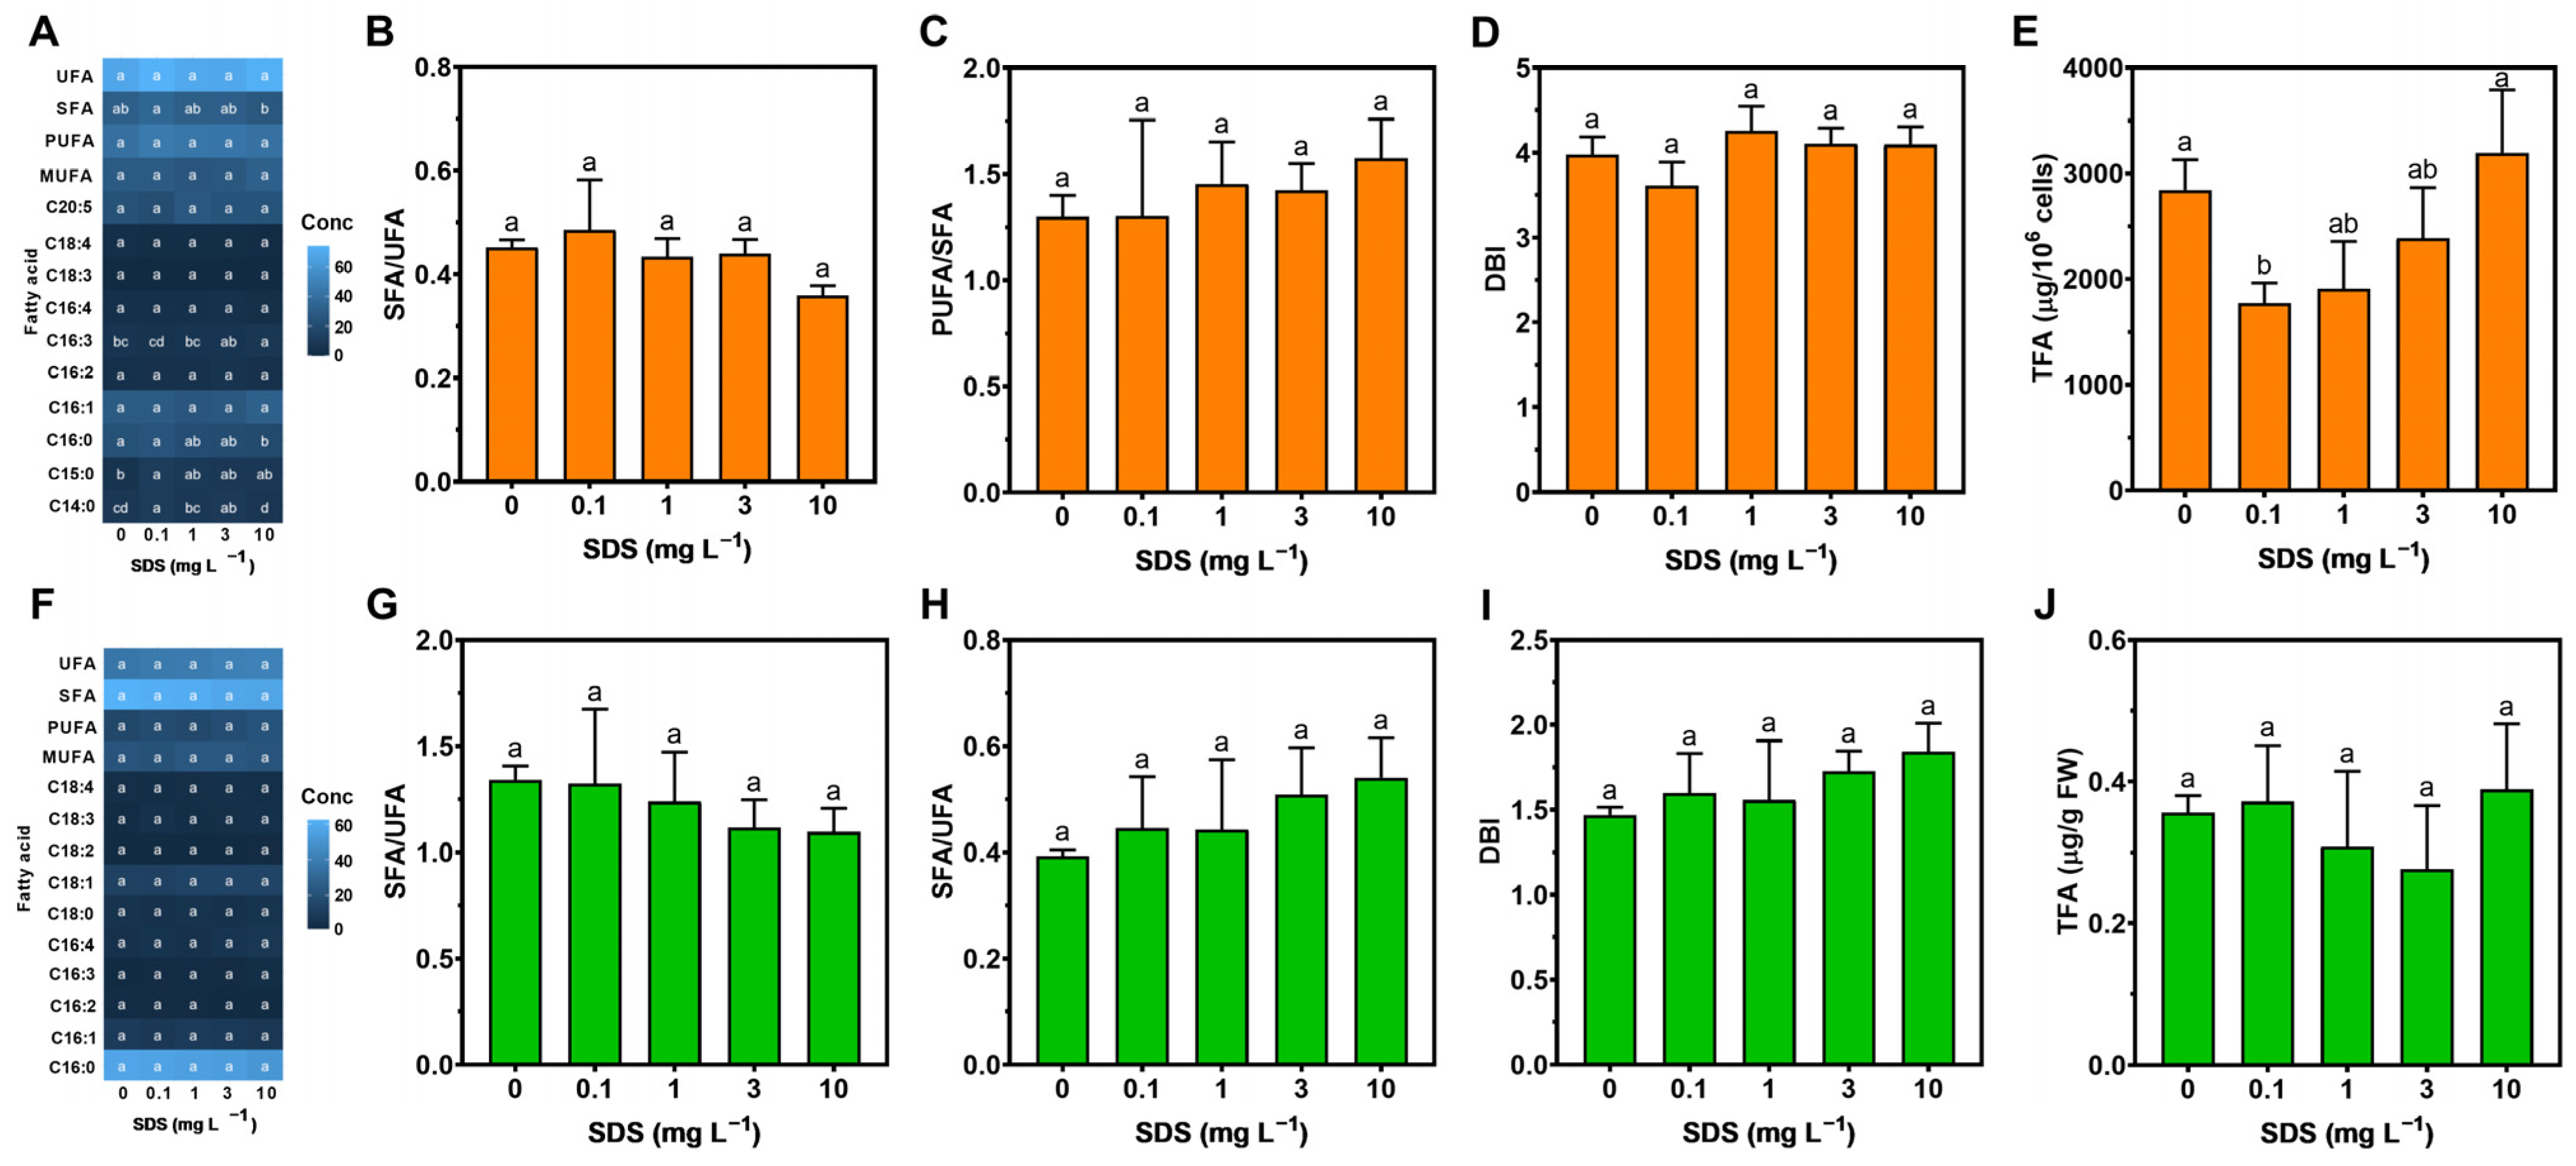
2.6. Fatty Acid Profiles
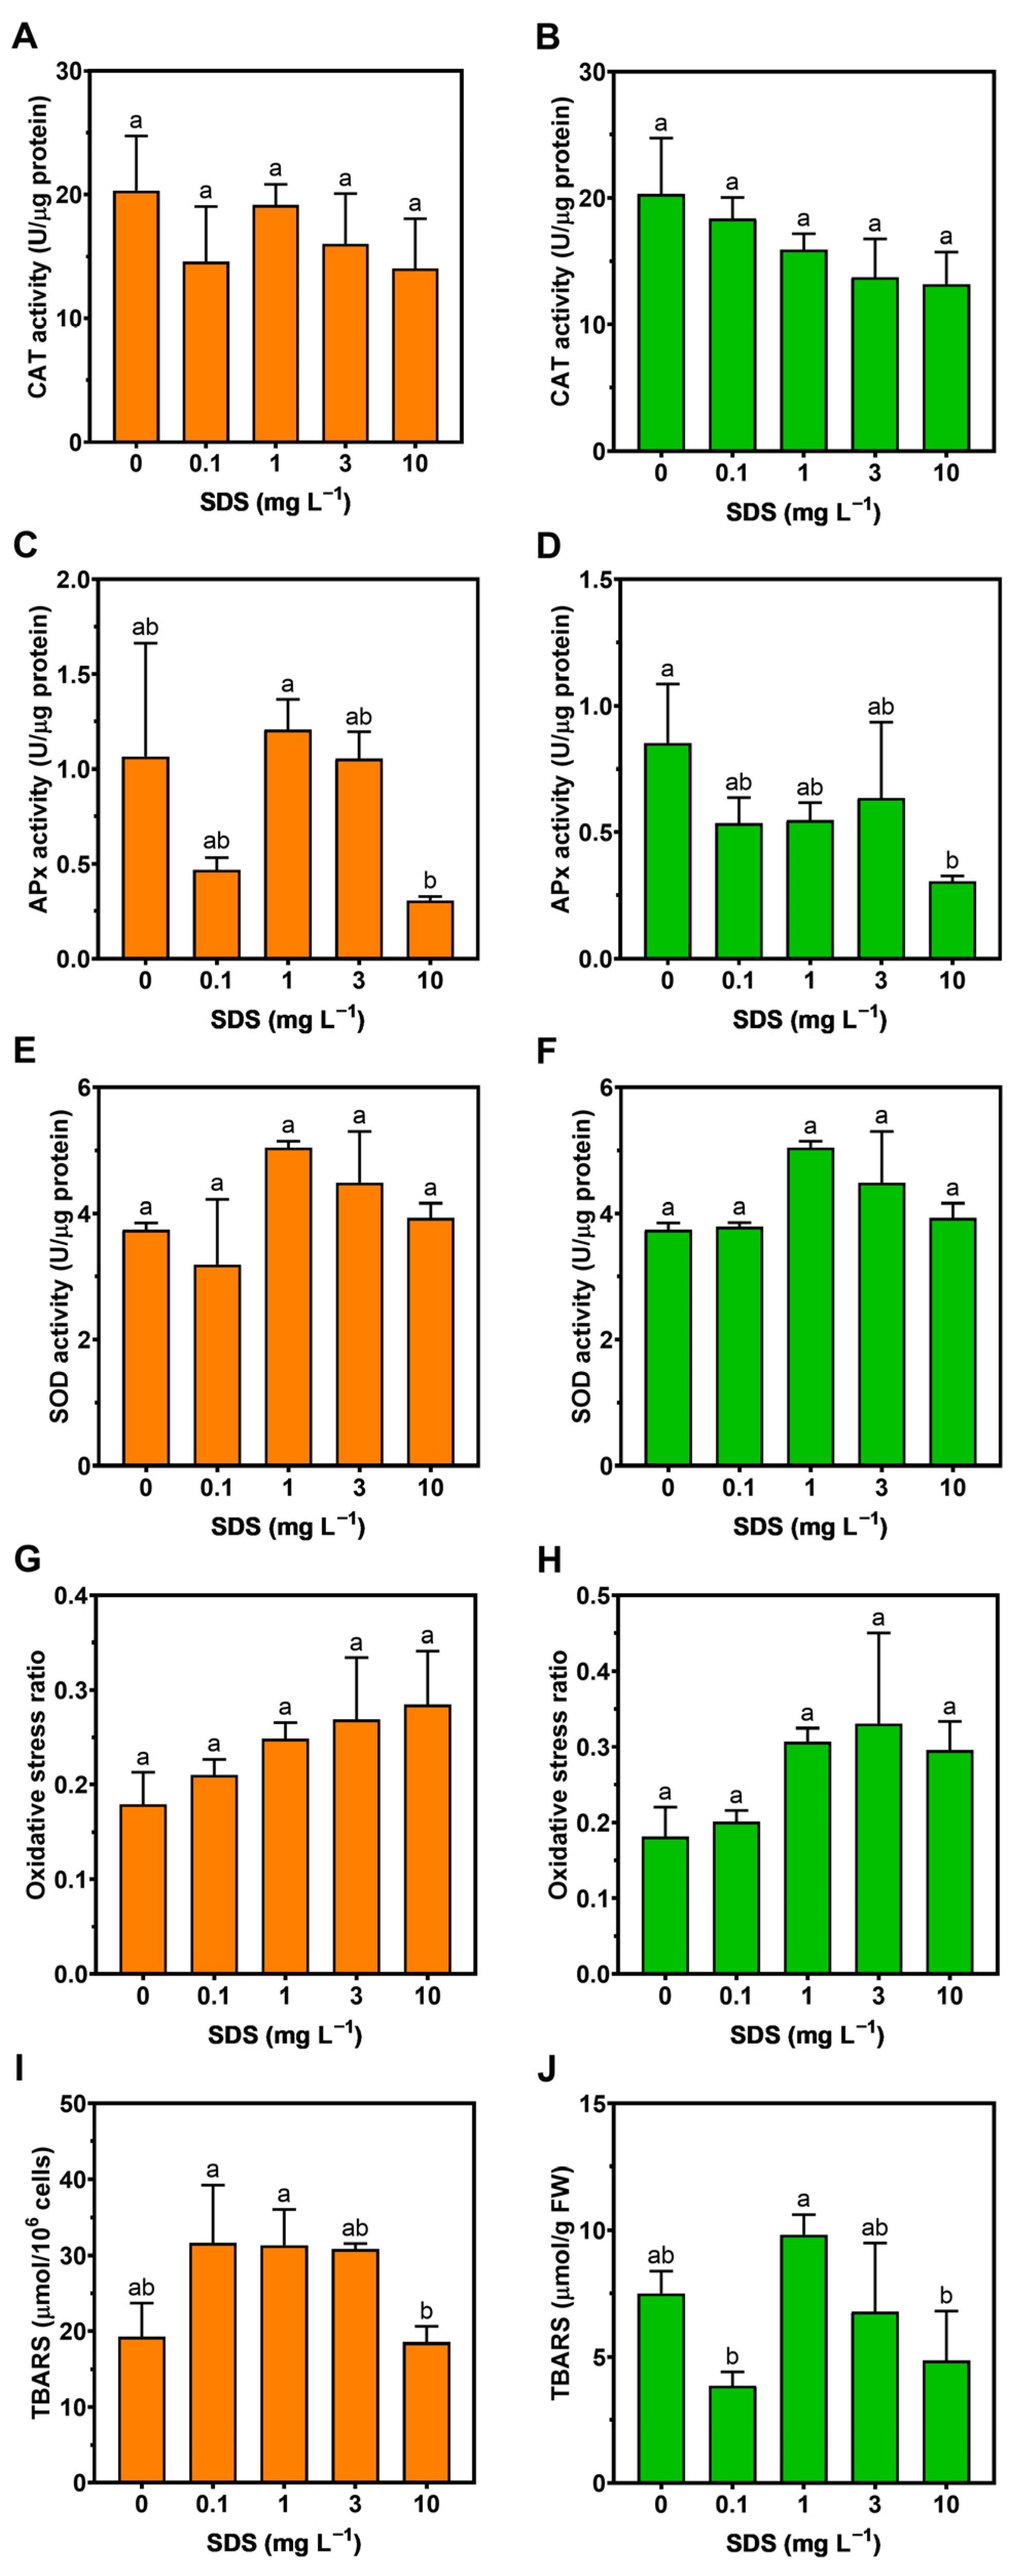
2.7. Oxidative Stress
2.8. Energy Balance
2.9. Statistical Analysis
3. Results
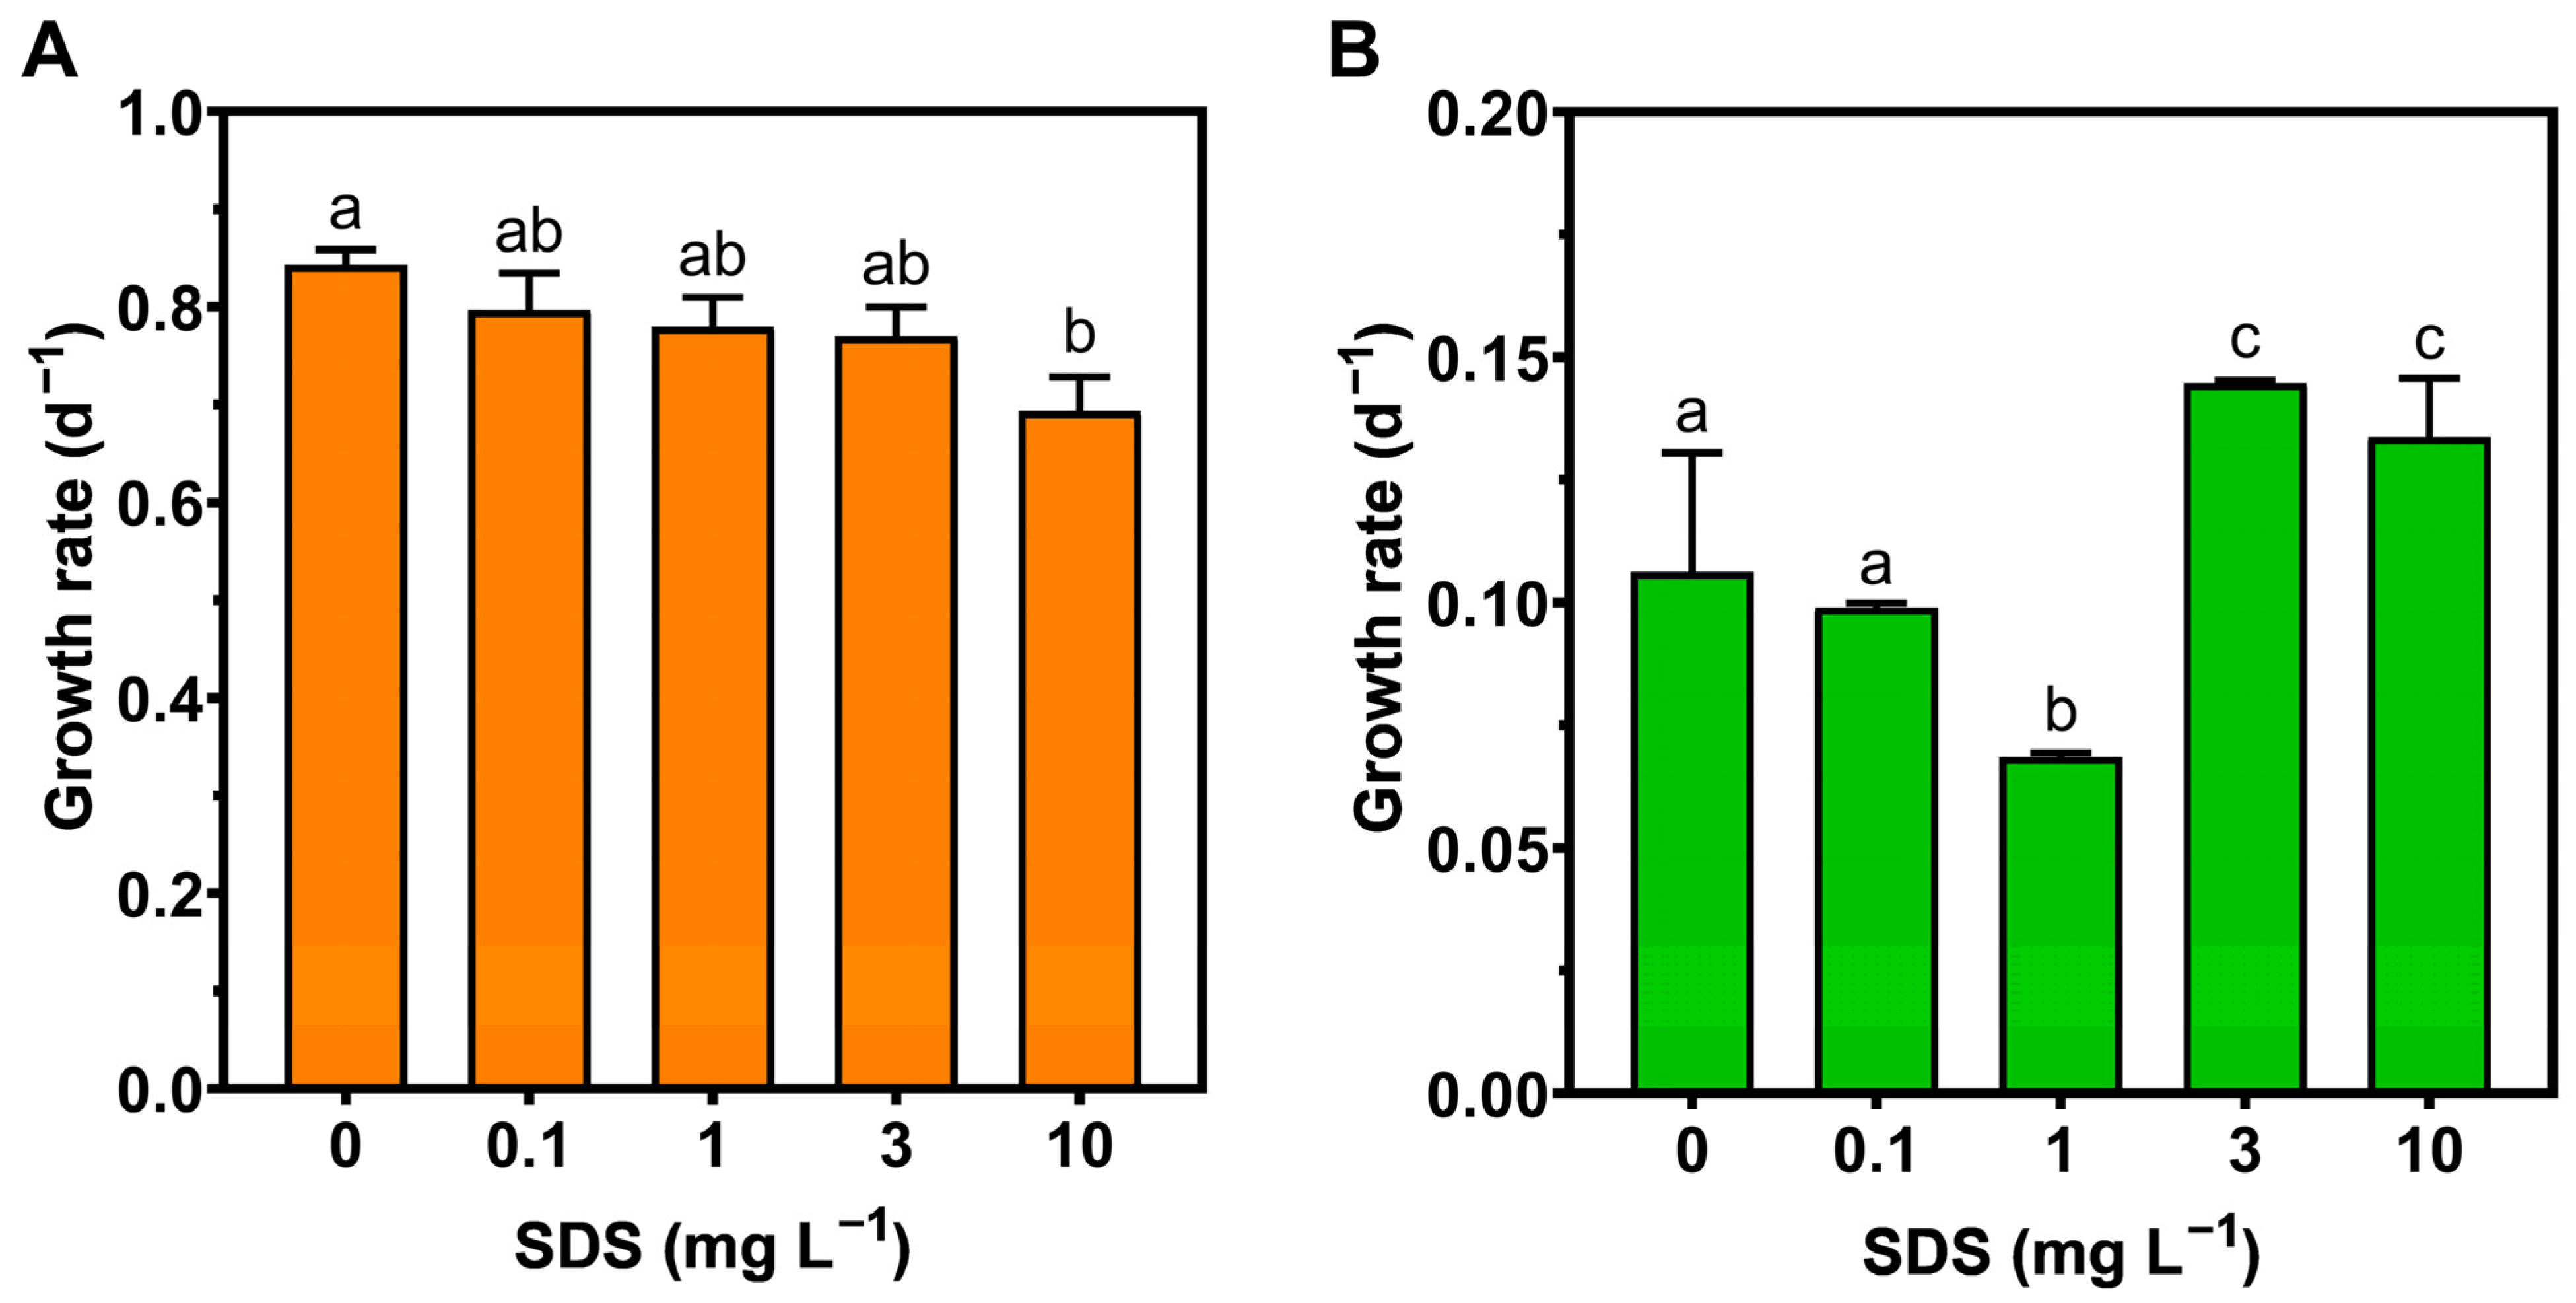
3.1. Growth Rate
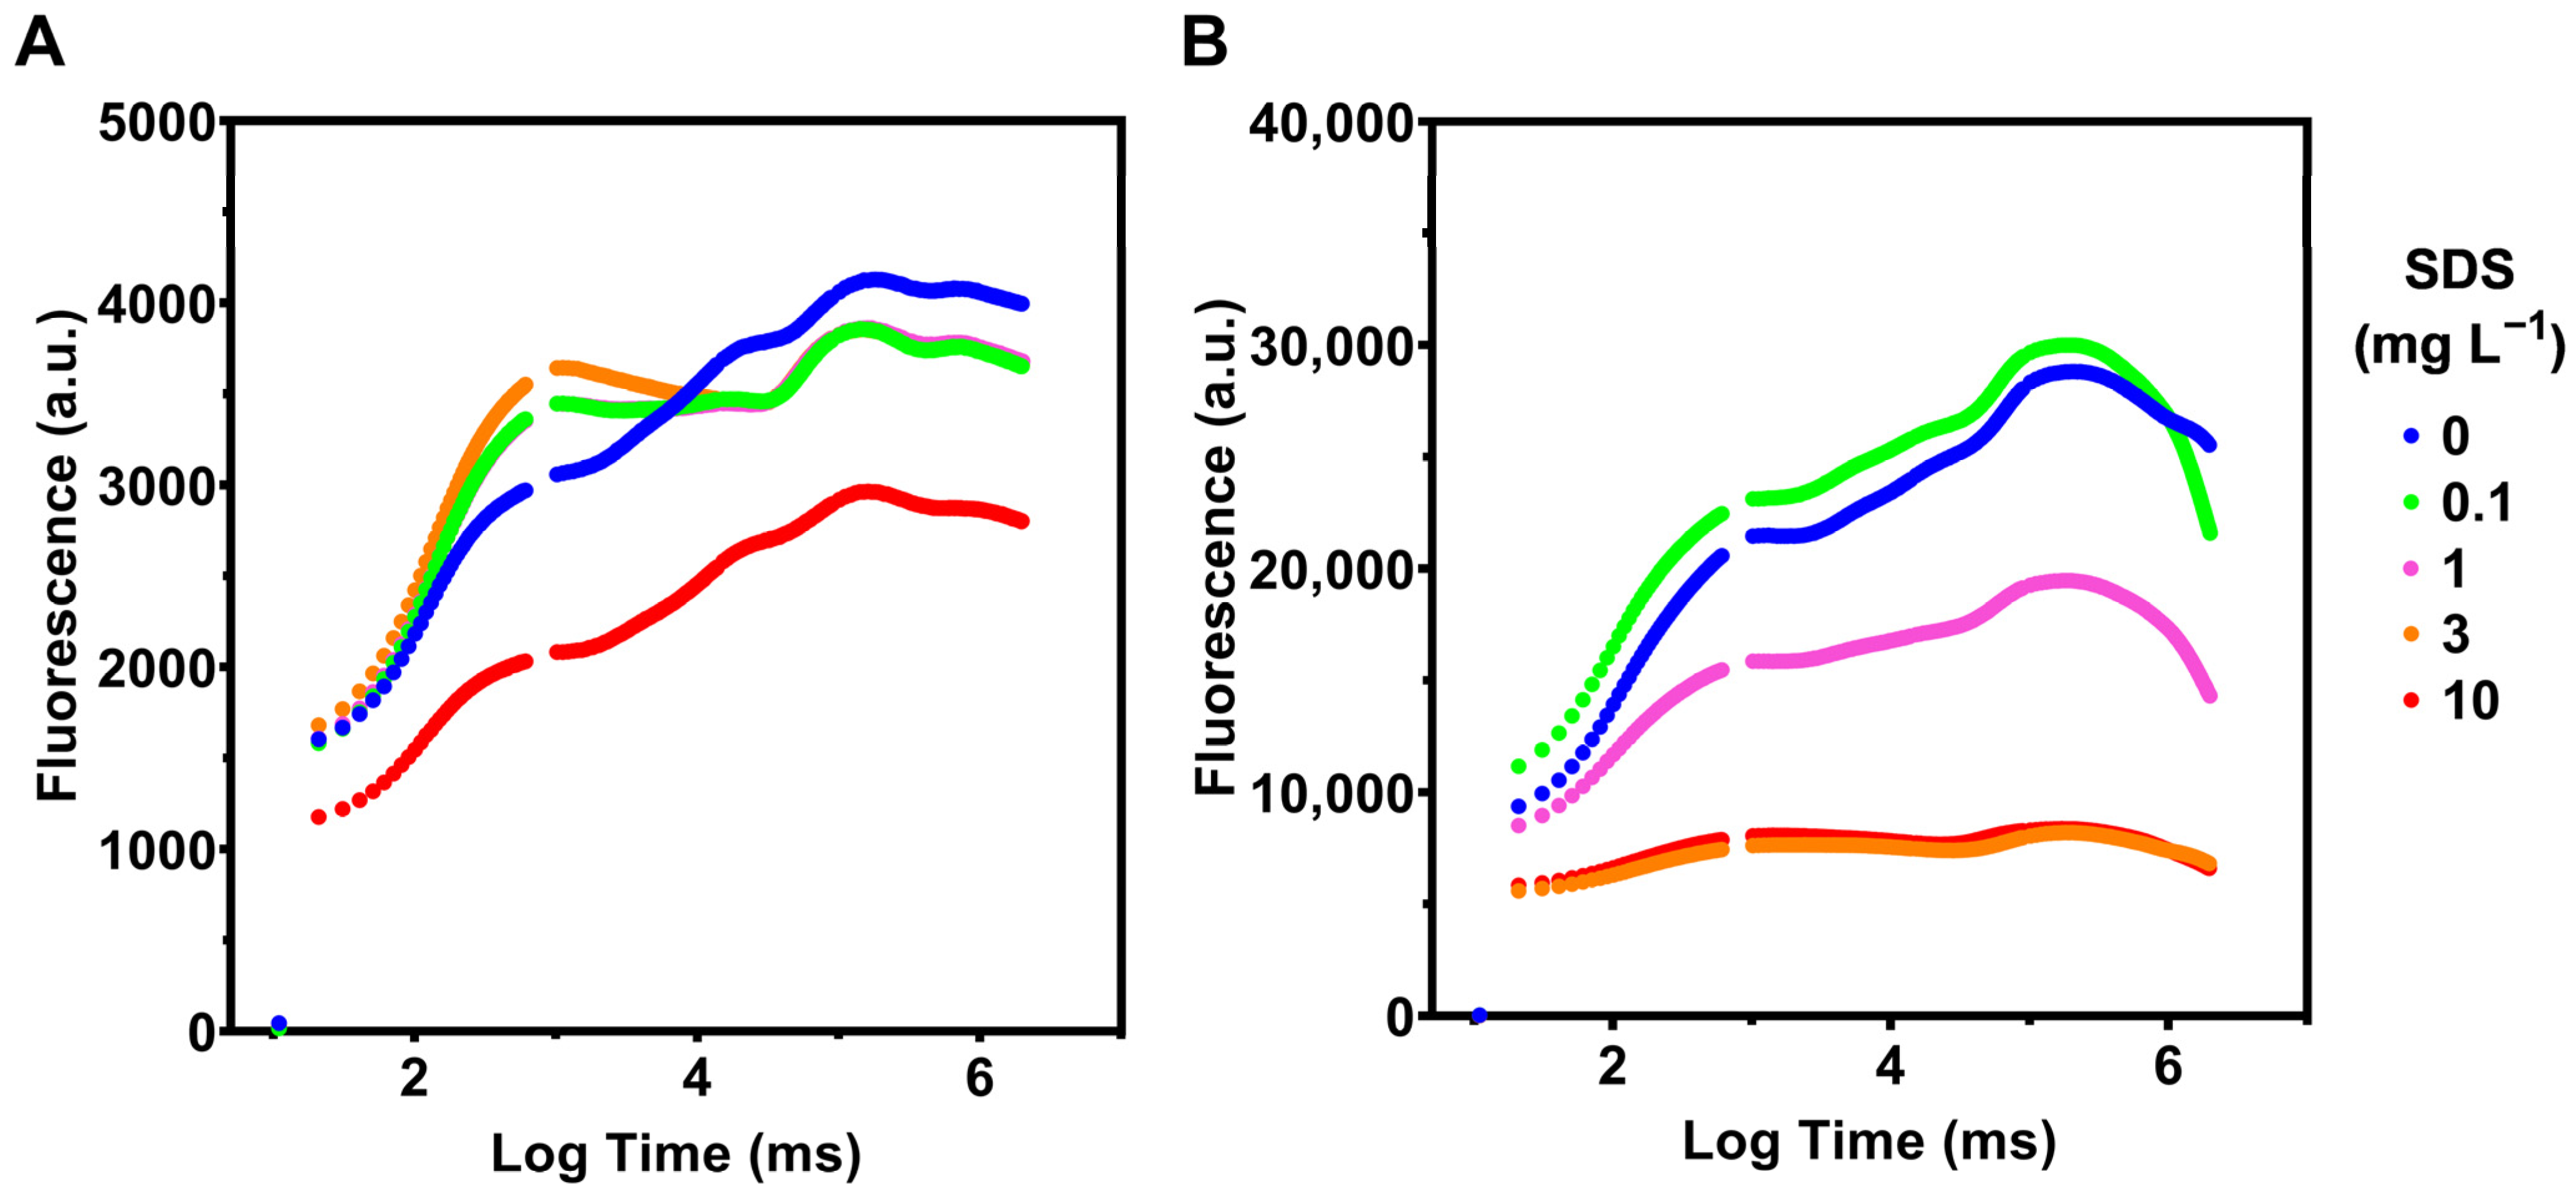
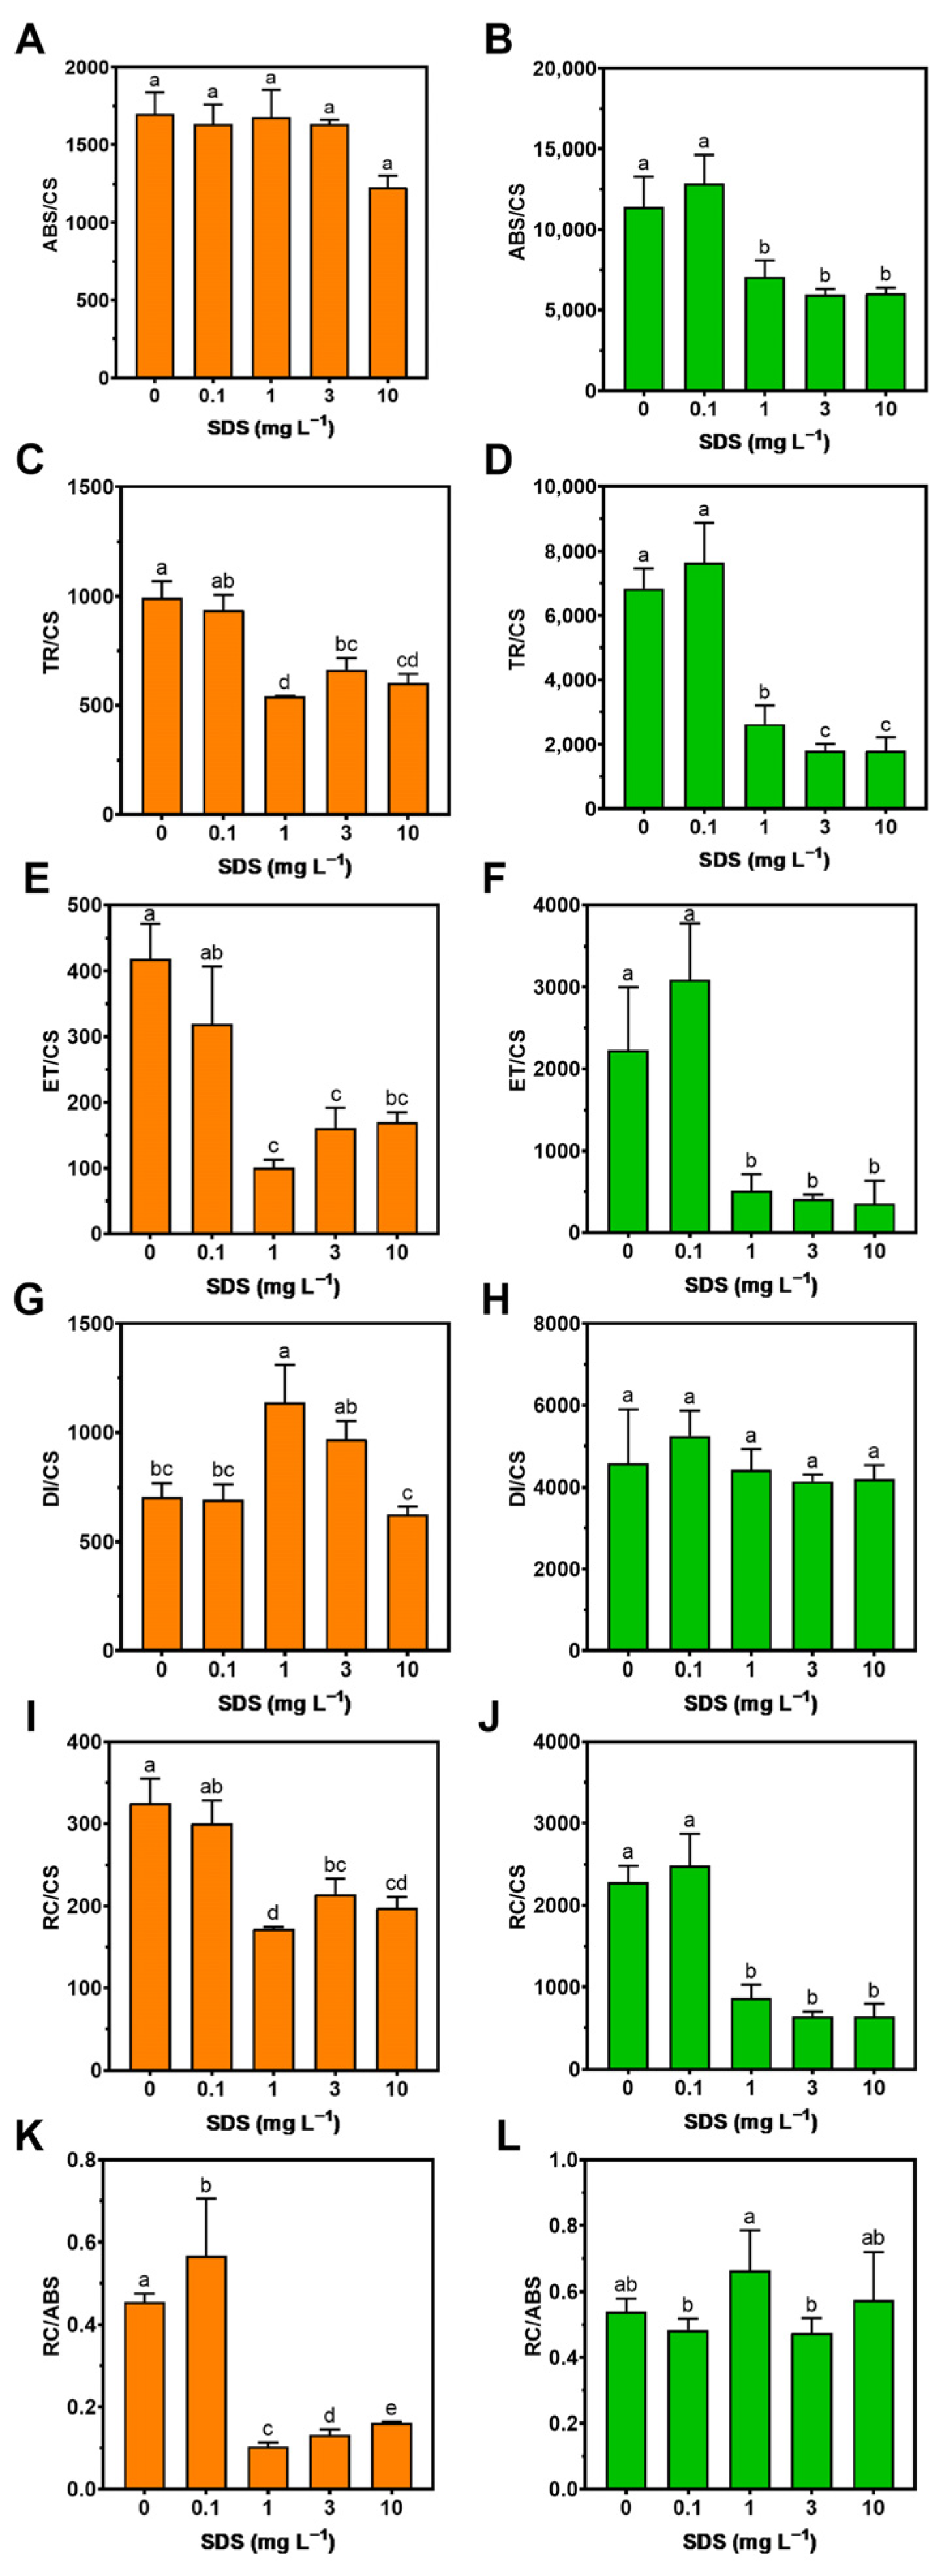
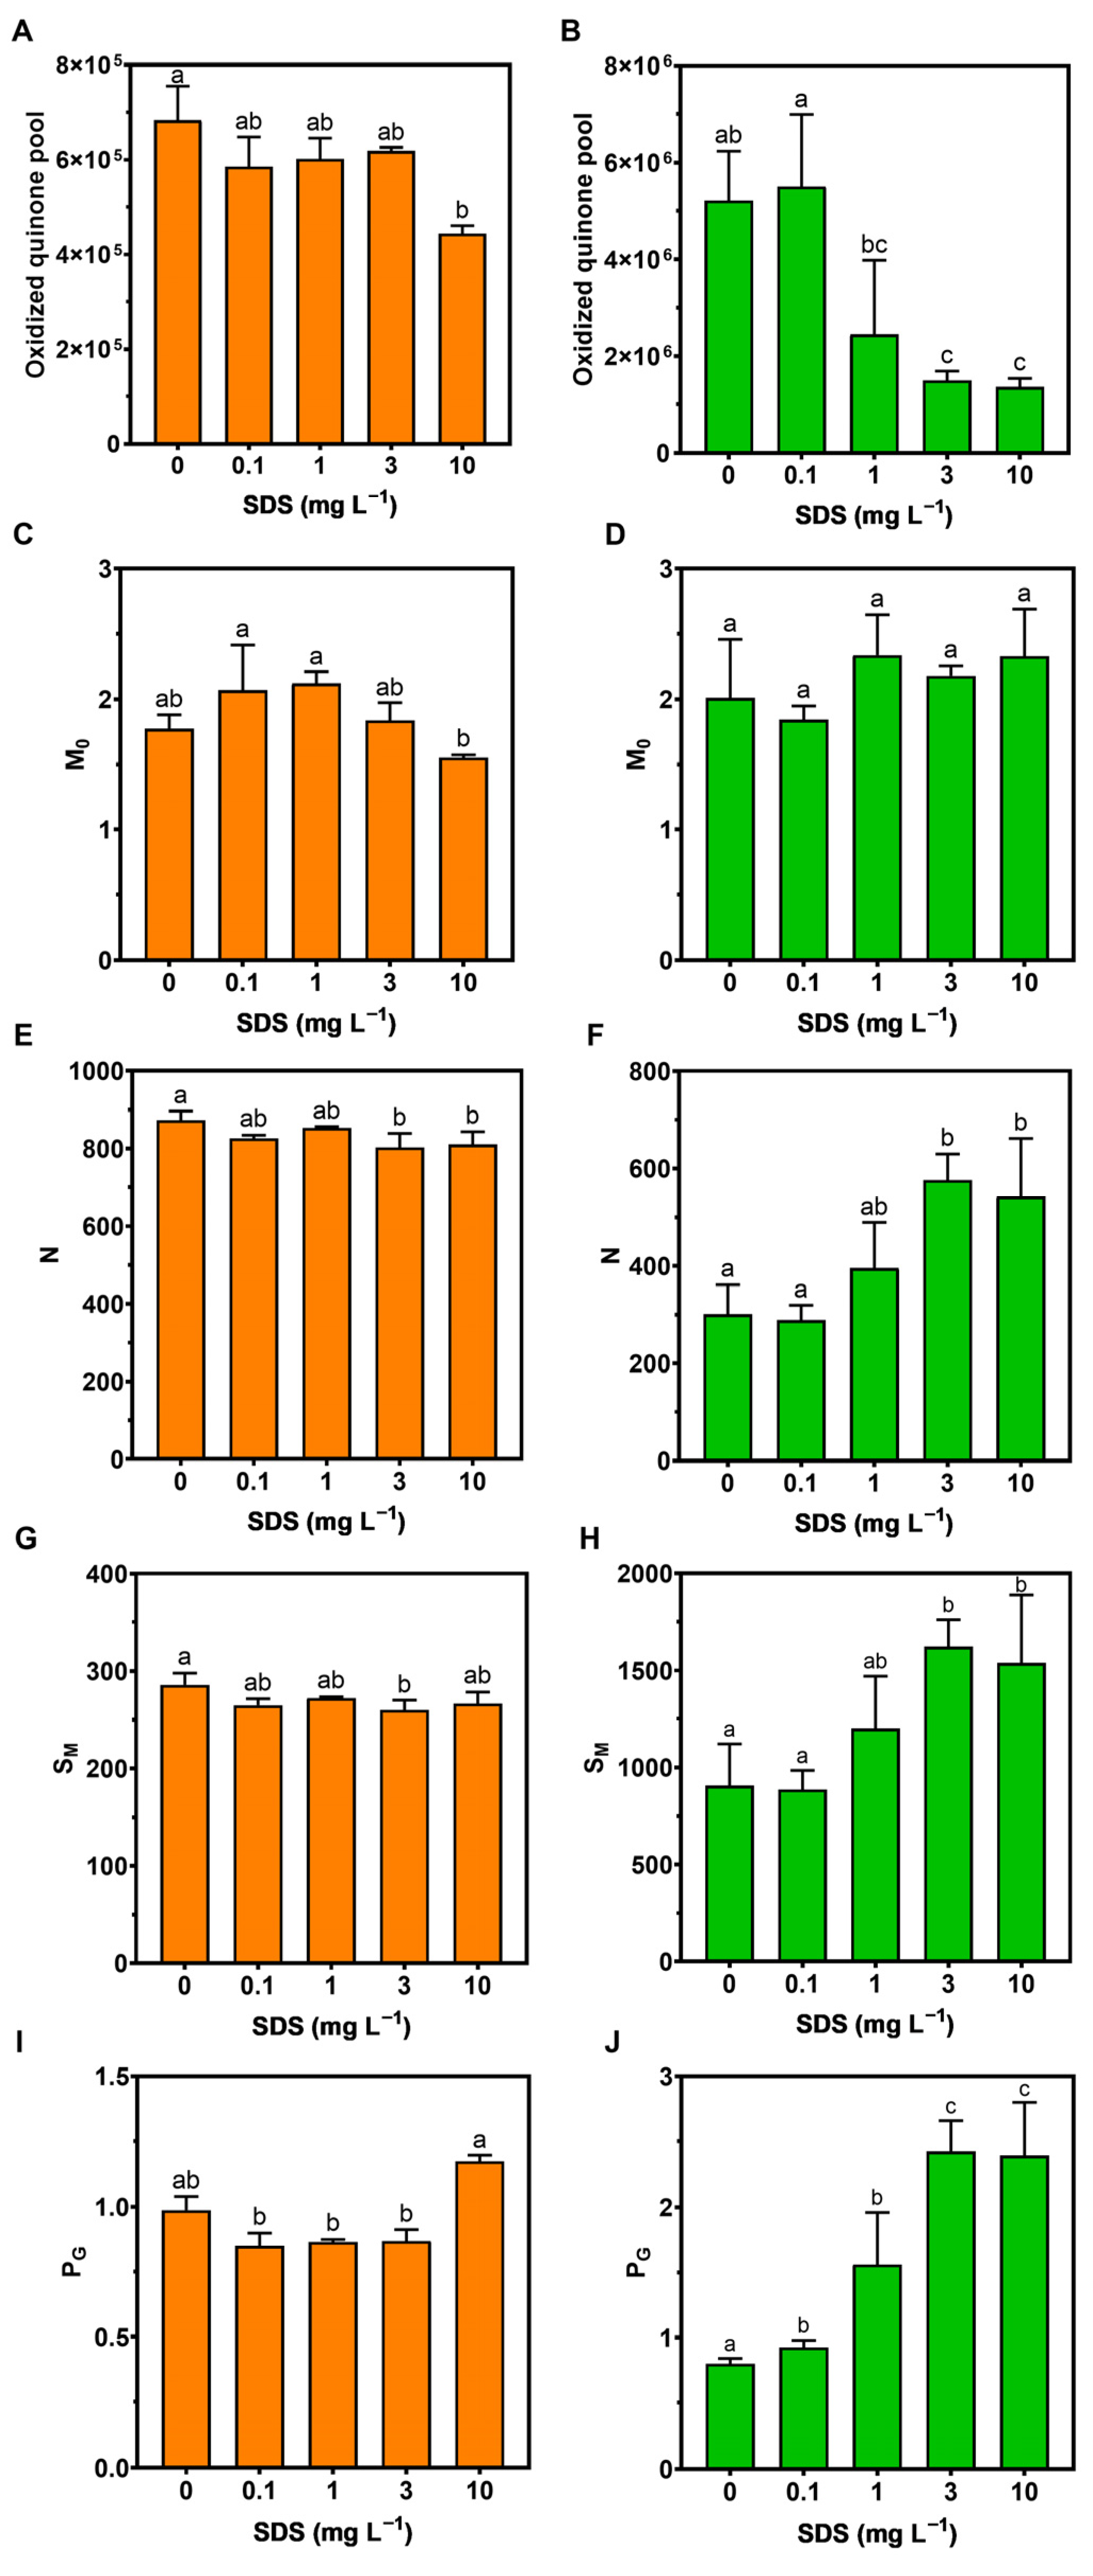
3.2. Photochemistry
3.3. Pigment Composition
3.4. Fatty Acid Profile
3.5. Oxidative Stress
3.6. Energy Balance
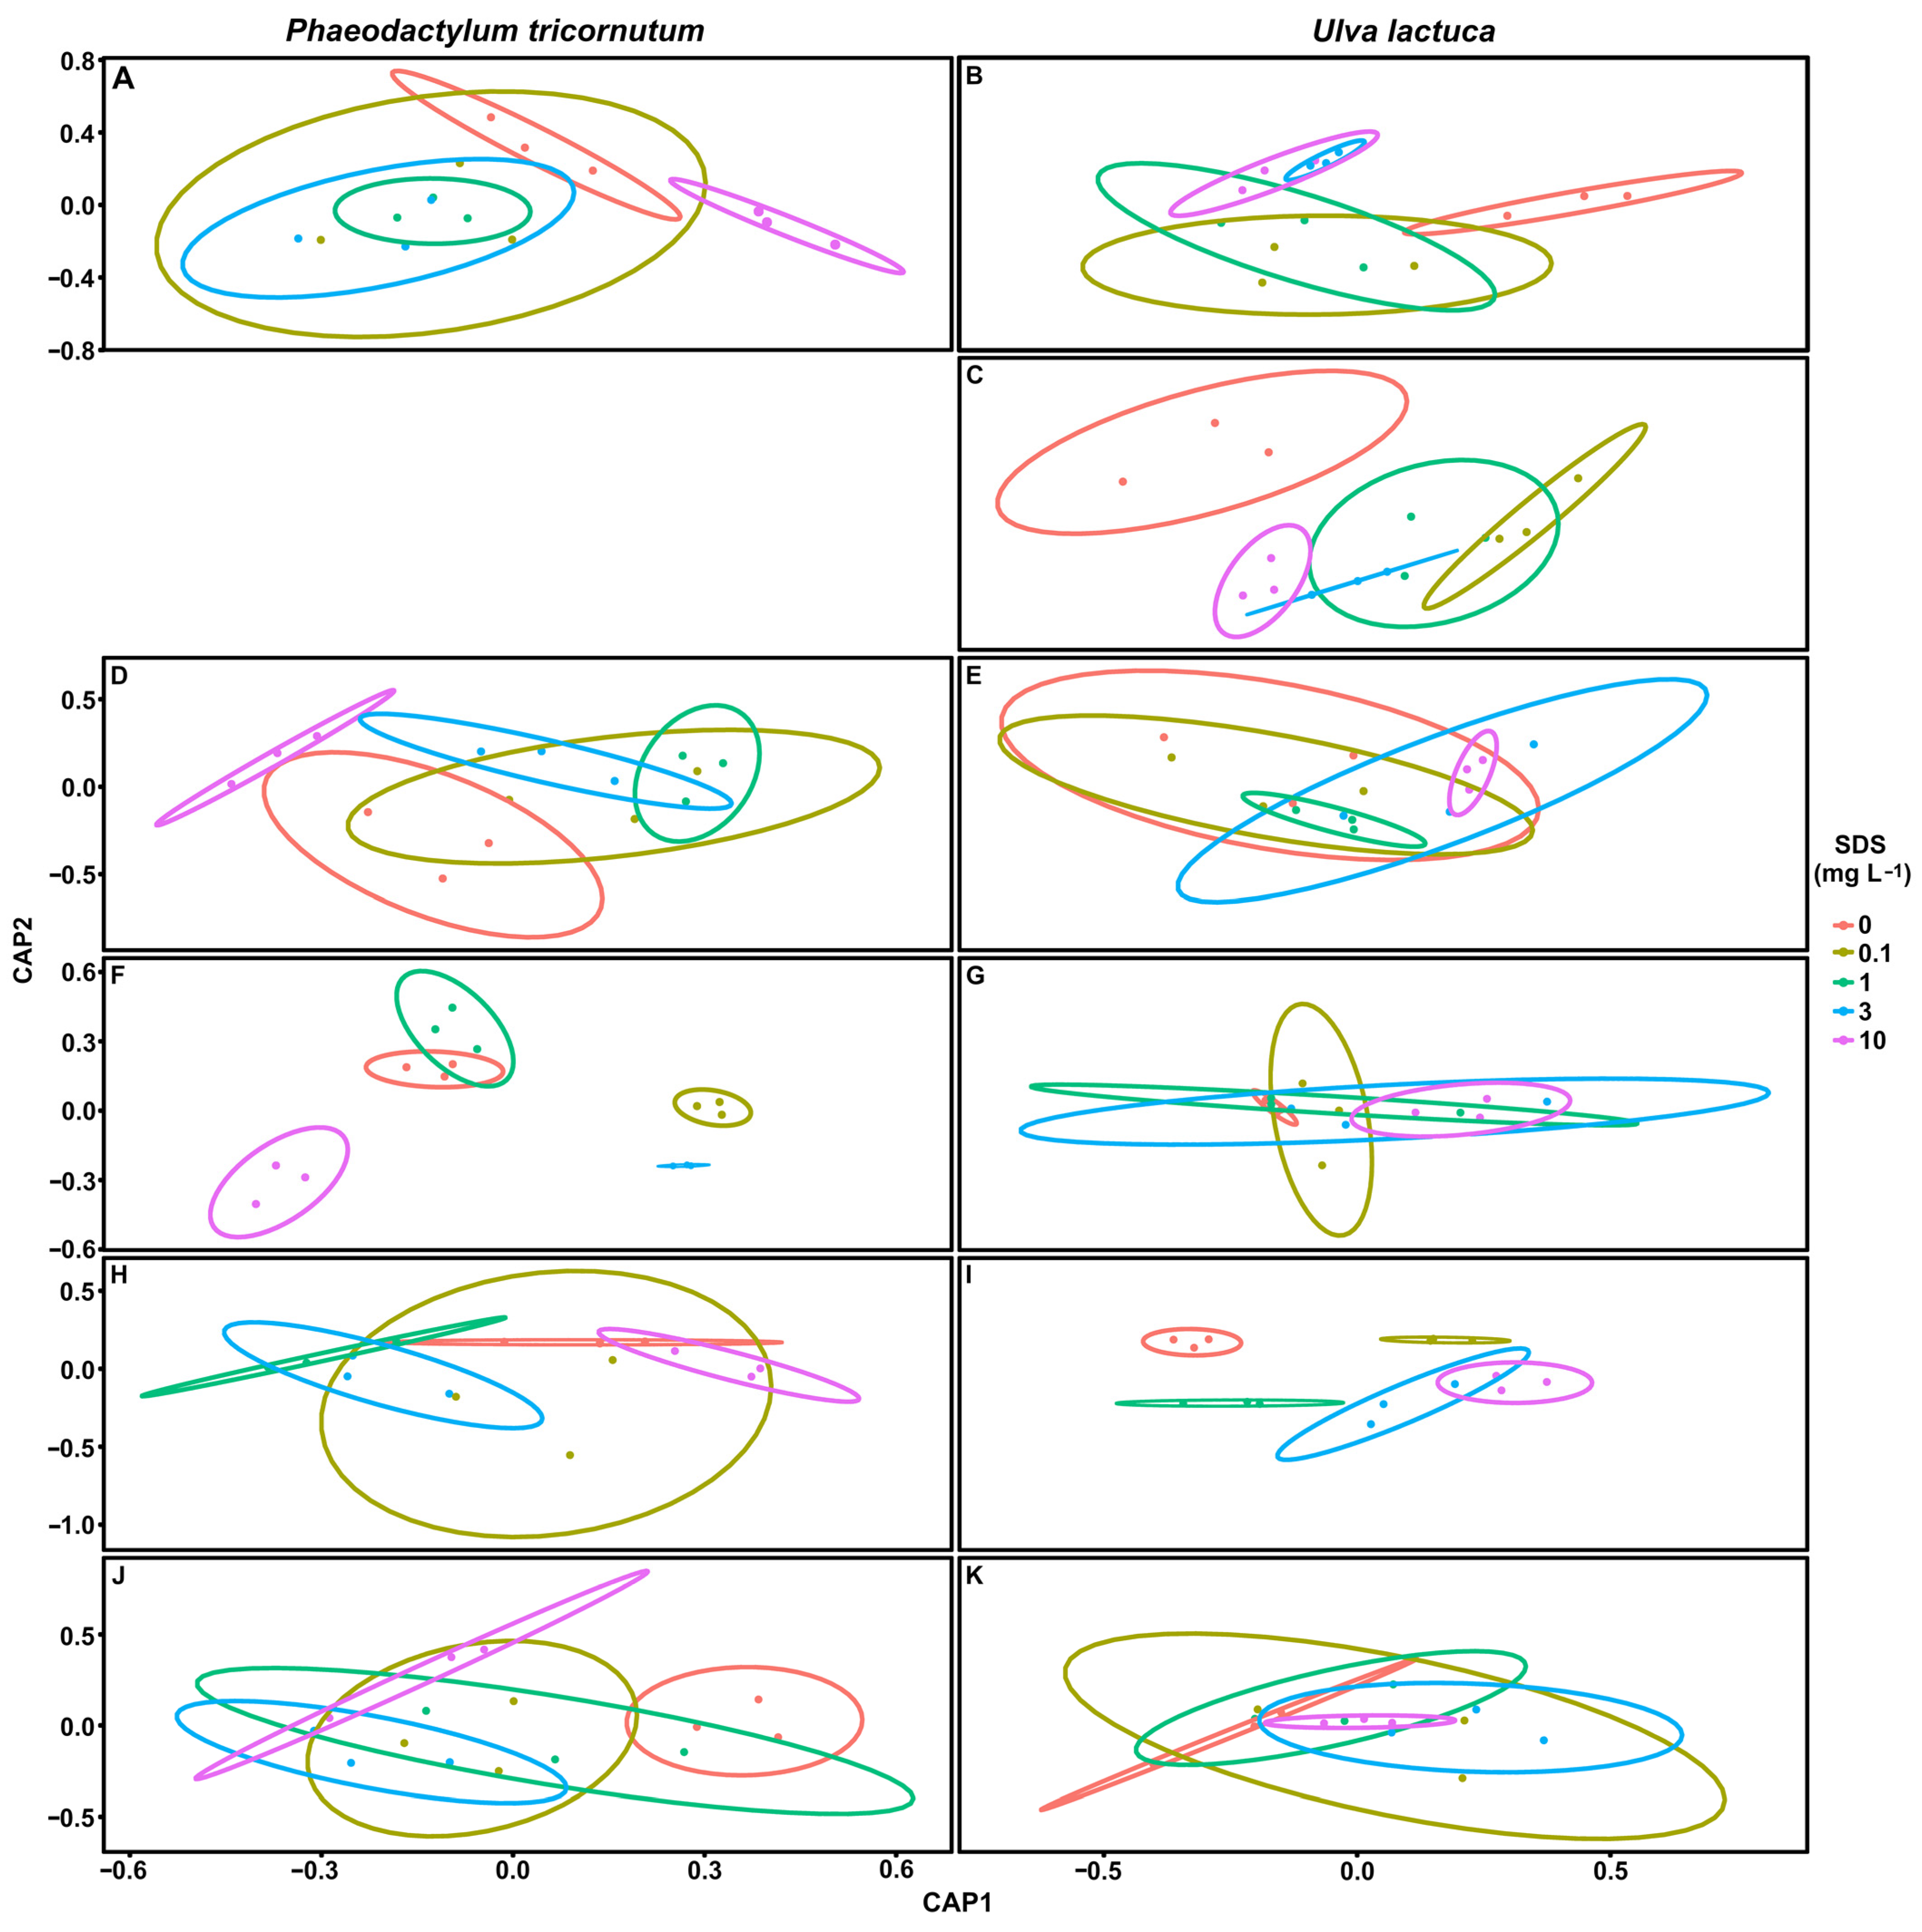
3.7. Biomarker Multivariate Analysis
4. Discussion
4.1. Micro and Macroalgae Are Impacted by Environmentally Relevant SDS Concentrations
4.2. SDS Negatively Impacts Photochemistry and Pigment Content
4.3. Energy Balance and Fatty Acid Profiles
4.4. Biomarker Potential in SDS Biomonitoring
5. Conclusions
Supplementary Materials
Author Contributions
Funding
Institutional Review Board Statement
Informed Consent Statement
Data Availability Statement
Acknowledgments
Conflicts of Interest
References
- Corrêa, A.X.R.; Tamanaha, M.S.; Horita, C.O.; Radetski, M.R.; Corrêa, R.; Radetski, C.M. Natural Impacted Freshwaters: In Situ Use of Alginate Immobilized Algae to the Assessment of Algal Response. Ecotoxicology 2009, 18, 464–469. [Google Scholar] [CrossRef] [PubMed]
- Amado, L.L.; da Rosa, C.E.; Leite, A.M.; Moraes, L.; Pires, W.V.; Pinho, G.L.L.; Martins, C.M.G.; Robaldo, R.B.; Nery, L.E.M.; Monserrat, J.M.; et al. Biomarkers in Croakers Micropogonias Furnieri (Teleostei: Sciaenidae) from Polluted and Non-Polluted Areas from the Patos Lagoon Estuary (Southern Brazil): Evidences of Genotoxic and Immunological Effects. Mar. Pollut. Bull. 2006, 52, 199–206. [Google Scholar] [CrossRef] [PubMed]
- Thomaidis, N.S.; Asimakopoulos, A.G.; Bletsou, A.A. Emerging Contaminants: A Tutorial Mini-Review. Glob. Nest J. 2012, 14, 72–79. [Google Scholar] [CrossRef]
- CAS. CAS Assigns the 100 Millionth CAS Registry Number® to a Substance Designed to Treat Acute Myeloid Leukemia. Available online: https://web.archive.org/web/20150822051043/http://www.cas.org/news/media-releases/100-millionth-substance (accessed on 3 February 2022).
- Gavrilescu, M.; Demnerová, K.; Aamand, J.; Agathos, S.; Fava, F. Emerging Pollutants in the Environment: Present and Future Challenges in Biomonitoring, Ecological Risks and Bioremediation. New Biotechnol. 2015, 32, 147–156. [Google Scholar] [CrossRef] [PubMed]
- Nakama, Y. Surfactants. In Cosmetic Science and Technology: Theoretical Principles and Applications; Elsevier: Amsterdam, The Netherlands, 2017; pp. 231–244. [Google Scholar] [CrossRef]
- Edser, C. Latest Market Analysis. Focus Surfactants 2006, 2006, 1–2. [Google Scholar] [CrossRef]
- CESIO (European Committee of Surfactants and their Organic Intermediates). Surfactants Production EU 1994–2018. Available online: https://www.cesio.eu/images/content/CESIO-Statistics_2018-For_website.pdf (accessed on 26 October 2022).
- Ying, G.G. Fate, Behavior and Effects of Surfactants and Their Degradation Products in the Environment. Environ. Int. 2006, 32, 417–431. [Google Scholar] [CrossRef] [PubMed]
- Panouillères, M.; Boillot, C.; Perrodin, Y. Study of the Combined Effects of a Peracetic Acid-Based Disinfectant and Surfactants Contained in Hospital Effluents on Daphnia Magna. Ecotoxicology 2007, 16, 327–340. [Google Scholar] [CrossRef]
- Cserháti, T.; Forgács, E.; Oros, G. Biological Activity and Environmental Impact of Anionic Surfactants. Environ. Int. 2002, 28, 337–348. [Google Scholar] [CrossRef]
- Lewis, M.A. Chronic Toxicities of Surfactants and Detergent Builders to Algae: A Review and Risk Assessment. Ecotoxicol. Environ. Saf. 1990, 20, 123–140. [Google Scholar] [CrossRef]
- Dyer, S.D.; Lauth, J.R.; Morrall, S.W.; Herzog, R.R.; Cherry, D.S. Development of a Chronic Toxicity Structure-Activity Relationship for Alkyl Sulfates. Environ. Toxicol. Water Qual. 1997, 12, 295–303. [Google Scholar] [CrossRef]
- Koynova, R.; Tenchov, B. Interactions of Surfactants and Fatty Acids with Lipids. Curr. Opin. Colloid Interface Sci. 2001, 6, 277–286. [Google Scholar] [CrossRef]
- Umlong, I.M.; Ismail, K. Micellization Behaviour of Sodium Dodecyl Sulfate in Different Electrolyte Media. Colloids Surf. A Phys. Eng. Asp. 2007, 299, 8–14. [Google Scholar] [CrossRef]
- Belanger, S.E.; Lee, D.M.; Bowling, J.W.; LeBlanc, E.M. Responses of Periphyton and Invertebrates to a Tetradecyl-Pentadecyl Sulfate Mixture in Stream Mesocosms. Environ. Toxicol. Chem. 2004, 23, 2202–2213. [Google Scholar] [CrossRef] [PubMed]
- Fendinger, N.J.; Versteeg, D.J.; Weeg, E.; Dyer, S.; Rapaport, R.A. Environmental Behavior and Fate of Anionic Surfactants; ACS Publications: Washington, DC, USA, 1994; pp. 527–557. [Google Scholar] [CrossRef]
- Bashir, I.; Lone, F.A.; Bhat, R.A.; Mir, S.A.; Dar, Z.A.; Dar, S.A. Concerns and Threats of Contamination on Aquatic Ecosystems. In Bioremediation and Biotechnology: Sustainable Approaches to Pollution Degradation; Springer: Cham, Switzerland, 2020; pp. 1–26. [Google Scholar] [CrossRef] [Green Version]
- Yadav, V.K.; Khan, S.H.; Choudhary, N.; Tirth, V.; Kumar, P.; Ravi, R.K.; Modi, S.; Khayal, A.; Shah, M.P.; Sharma, P.; et al. Nanobioremediation: A Sustainable Approach towards the Degradation of Sodium Dodecyl Sulfate in the Environment and Simulated Conditions. J. Basic Microbiol. 2022, 62, 348–360. [Google Scholar] [CrossRef]
- Domingues, N.; Matos, A.R.; da Silva, J.M.; Cartaxana, P. Response of the Diatom Phaeodactylum Tricornutum to Photooxidative Stress Resulting from High Light Exposure. PLoS ONE 2012, 7, e38162. [Google Scholar] [CrossRef] [Green Version]
- Guschina, I.A.; Harwood, J.L. Algal Lipids and Effect of the Environment on Their Biochemistry. In Lipids in Aquatic Ecosystems; Springer: New York, NY, USA, 2009; pp. 1–24. ISBN 9780387893662. [Google Scholar] [CrossRef]
- Armbrust, E.V. The Life of Diatoms in the World’s Oceans. Nature 2009, 459, 185–192. [Google Scholar] [CrossRef]
- Hamilton, M.L.; Haslam, R.P.; Napier, J.A.; Sayanova, O. Metabolic Engineering of Phaeodactylum Tricornutum for the Enhanced Accumulation of Omega-3 Long Chain Polyunsaturated Fatty Acids. Metab. Eng. 2014, 22, 3–9. [Google Scholar] [CrossRef]
- Cleuvers, M. Aquatic Ecotoxicity of Pharmaceuticals Including the Assessment of Combination Effects. Toxicol. Lett. 2003, 142, 185–194. [Google Scholar] [CrossRef]
- Nalewajko, C.; Olaveson, M.M. Ecophysiological Considerations in Microalgal Toxicity Tests. In Microscale Testing in Aquatic Toxicology; CRC Press: London, UK, 1998; pp. 289–309. [Google Scholar] [CrossRef]
- Feijão, E.; Cruz de Carvalho, R.; Duarte, I.A.; Matos, A.R.; Cabrita, M.T.; Novais, S.C.; Lemos, M.F.L.; Caçador, I.; Marques, J.C.; Reis-Santos, P.; et al. Fluoxetine Arrests Growth of the Model Diatom Phaeodactylum Tricornutum by Increasing Oxidative Stress and Altering Energetic and Lipid Metabolism. Front. Microbiol. 2020, 11, 1803. [Google Scholar] [CrossRef]
- Duarte, B.; Feijão, E.; Cruz de Carvalho, R.; Duarte, I.A.; Silva, M.; Matos, A.R.; Cabrita, M.T.; Novais, S.C.; Lemos, M.F.L.; Marques, J.C.; et al. Effects of Propranolol on Growth, Lipids and Energy Metabolism and Oxidative Stress Response of Phaeodactylum Tricornutum. Biology 2020, 9, 478. [Google Scholar] [CrossRef]
- Cruz de Carvalho, R.; Feijão, E.; Matos, A.R.; Cabrita, M.T.; Novais, S.C.; Lemos, M.F.L.; Caçador, I.; Marques, J.C.; Reis-Santos, P.; Fonseca, V.F.; et al. Glyphosate-Based Herbicide Toxicophenomics in Marine Diatoms: Impacts on Primary Production and Physiological Fitness. Appl. Sci. 2020, 10, 7391. [Google Scholar] [CrossRef]
- Hughes, A.R.; Williams, S.L.; Duarte, C.M.; Heck, K.L.; Waycott, M. Associations of Concern: Declining Seagrasses and Threatened Dependent Species. Front. Ecol. Environ. 2009, 7, 242–246. [Google Scholar] [CrossRef] [Green Version]
- Kraan, S. Pigments and Minor Compounds in Algae. In Functional Ingredients from Algae for Foods and Nutraceuticals; Woodhead Publishing Limited: Cambridge, UK, 2013; pp. 205–251. [Google Scholar] [CrossRef]
- Wichard, T.; Charrier, B.; Mineur, F.; Bothwell, J.H.; de Clerck, O.; Coates, J.C. The Green Seaweed Ulva: A Model System to Study Morphogenesis. Front. Plant Sci. 2015, 6, 72. [Google Scholar] [CrossRef] [PubMed] [Green Version]
- Mantri, V.A.; Kazi, M.A.; Balar, N.B.; Gupta, V.; Gajaria, T. Concise Review of Green Algal Genus Ulva Linnaeus. J. Appl. Phycol. 2020, 32, 2725–2741. [Google Scholar] [CrossRef]
- Paradossi, G.; Cavalieri, F.; Pizzoferrato, L.; Liquori, A.M. A Physico-Chemical Study on the Polysaccharide Ulvan from Hot Water Extraction of the Macroalga Ulva. Int. J. Biol. Macromol. 1999, 25, 309–315. [Google Scholar] [CrossRef]
- Kim, Y.J.; Han, Y.S.; Kim, E.; Jung, J.; Kim, S.H.; Yoo, S.J.; Shin, G.S.; Oh, J.J.; Park, A.; Choi, H.; et al. Application of the Ulva Pertusa Bioassay for a Toxicity Identification Evaluation and Reduction of Effluent from a Wastewater Treatment Plant. Front. Environ. Sci. 2015, 3, 2. [Google Scholar] [CrossRef] [Green Version]
- Kim, E.; Kim, S.H.; Kim, H.C.; Lee, S.G.; Lee, S.J.; Jeong, S.W. Growth Inhibition of Aquatic Plant Caused by Silver and Titanium Oxide Nanoparticles. Toxicol. Environ. Health Sci. 2011, 3, 1–6. [Google Scholar] [CrossRef]
- Oh, J.J.; Choi, E.M.; Han, Y.S.; Yoon, J.H.; Park, A.; Jin, K.; Lee, J.W.; Choi, H.; Kim, S.; Brown, M.T.; et al. Influence of Salinity on Metal Toxicity to Ulva Pertusa. Toxicol. Environ. Health Sci. 2012, 4, 9–13. [Google Scholar] [CrossRef]
- Han, Y.S.; Brown, M.T.; Gyoung, S.P.; Han, T. Evaluating Aquatic Toxicity by Visual Inspection of Thallus Color in the Green Macroalga Ulva: Testing a Novel Bioassay. Environ. Sci. Technol. 2007, 41, 3667–3671. [Google Scholar] [CrossRef]
- Karthikeyan, S.; Balasubramanian, R.; Iyer, C.S.P. Evaluation of the Marine Algae Ulva Fasciata and Sargassum Sp. for the Biosorption of Cu(II) from Aqueous Solutions. Bioresour. Technol. 2007, 98, 452–455. [Google Scholar] [CrossRef]
- Park, J.; Brown, M.T.; Lee, H.; Choi, S.; Depuydt, S.; Häder, D.P.; Han, T. Toxicity Testing Using the Marine Macroalga Ulva Pertusa: Method Development and Application. In Bioassays: Advanced Methods and Applications; Elsevier: Amsterdam, The Netherlands, 2018; pp. 119–142. [Google Scholar] [CrossRef]
- de Carvalho, R.C.; Feijão, E.; Matos, A.R.; Cabrita, M.T.; Utkin, A.B.; Novais, S.C.; Lemos, M.F.L.; Caçador, I.; Marques, J.C.; Reis-Santos, P.; et al. Effects of Glyphosate-Based Herbicide on Primary Production and Physiological Fitness of the Macroalgae Ulva Lactuca. Toxics 2022, 10, 430. [Google Scholar] [CrossRef] [PubMed]
- Camacho-Muñoz, D.; Martín, J.; Santos, J.L.; Aparicio, I.; Alonso, E. Occurrence of Surfactants in Wastewater: Hourly and Seasonal Variations in Urban and Industrial Wastewaters from Seville (Southern Spain). Sci. Total Environ. 2014, 468–469, 977–984. [Google Scholar] [CrossRef] [PubMed]
- Jahromi, R.; Mogharab, V.; Jahromi, H.; Avazpour, A. Synergistic Effects of Anionic Surfactants on Coronavirus (SARS-CoV-2) Virucidal Efficiency of Sanitizing Fluids to Fight COVID-19. Food Chem. Toxicol. 2020, 145, 111702. [Google Scholar] [CrossRef] [PubMed]
- Kumar, A.; Ansari, W.A.; Ahamad, T.; Saquib, M.; Khan, M.F. Safe Use of Sodium Dodecyl Sulfate (SDS) to Deactivate SARS-CoV-2: An Evidence-Based Systematic Review. Coronaviruses 2021, 2, 12–17. [Google Scholar] [CrossRef]
- Marteinson, S.C.; Lawrence, M.J.; Taranu, Z.E.; Kosziwka, K.; Taylor, J.J.; Green, A.; Winegardner, A.K.; Rytwinski, T.; Reid, J.L.; Dubetz, C.; et al. Increased Use of Sanitizers and Disinfectants during the COVID-19 Pandemic: Identification of Antimicrobial Chemicals and Considerations for Aquatic Environmental Contamination. Environ. Rev. 2022. e-First (Ahead of Print). [Google Scholar] [CrossRef]
- Guillard, R.R.; Ryther, J.H. Studies of Marine Planktonic Diatoms: I. Cyclotella Nana Hustedt, and Detonula Confervacea (Cleve) Gran. Can. J. Microbiol. 2011, 8, 229–239. [Google Scholar] [CrossRef]
- OECD. Test No. 201: Freshwater Alga and Cyanobacteria, Growth Inhibition Test, OECD Guidelines for the Testing of Chemicals, Section 2; OECD Publishing: Paris, France. [CrossRef] [Green Version]
- Cabrita, M.T.; Duarte, B.; Gameiro, C.; Godinho, R.M.; Caçador, I. Photochemical Features and Trace Element Substituted Chlorophylls as Early Detection Biomarkers of Metal Exposure in the Model Diatom Phaeodactylum Tricornutum. Ecol. Indic. 2018, 95, 1038–1052. [Google Scholar] [CrossRef]
- Feijão, E.; Gameiro, C.; Franzitta, M.; Duarte, B.; Caçador, I.; Cabrita, M.T.; Matos, A.R. Heat Wave Impacts on the Model Diatom Phaeodactylum Tricornutum: Searching for Photochemical and Fatty Acid Biomarkers of Thermal Stress. Ecol. Indic. 2018, 95, 1026–1037. [Google Scholar] [CrossRef]
- Pavlić, Ž.; Vidaković-Cifrek, Ž.; Puntarić, D. Toxicity of Surfactants to Green Microalgae Pseudokirchneriella Subcapitata and Scenedesmus Subspicatus and to Marine Diatoms Phaeodactylum Tricornutum and Skeletonema Costatum. Chemosphere 2005, 61, 1061–1068. [Google Scholar] [CrossRef]
- Aizdaicher, N.A.; Markina, Z.V. Toxic Effects of Detergents on the Alga Plagioselmis Prolonga (Cryptophyta). Russ. J. Mar. Biol. 2006, 32, 45–49. [Google Scholar] [CrossRef]
- Aizdaicher, N.A.; Reunova, Y.A. Effects of Detergents on in Vitro Growth of Diatom Alga Thalassiosira Pseudonana. Russ. J. Mar. Biol. 2002, 28, 324–328. [Google Scholar] [CrossRef]
- Provasoli, L. Growing Marine Seaweeds. In Proceedings of the Fourth International Seaweed Symposium; de VirVille, A.D., Feldman, J., Eds.; Pergamon Press: Oxford, UK, 1963; pp. 9–17. [Google Scholar]
- Santos-Ballardo, D.U.; Rossi, S.; Hernández, V.; Gómez, R.V.; del Carmen Rendón-Unceta, M.; Caro-Corrales, J.; Valdez-Ortiz, A. A Simple Spectrophotometric Method for Biomass Measurement of Important Microalgae Species in Aquaculture. Aquaculture 2015, 448, 87–92. [Google Scholar] [CrossRef]
- Zhu, X.G.; Baker, N.R.; DeSturler, E.; Ort, D.R.; Long, S.P. Chlorophyll a Fluorescence Induction Kinetics in Leaves Predicted from a Model Describing Each Discrete Step of Excitation Energy and Electron Transfer Associated with Photosystem II. Planta 2005, 223, 114–133. [Google Scholar] [CrossRef] [PubMed]
- Strasser, R.J.; Srivastava, A. Govindjee Polyphasic Chlorophyll a Fluorescence Transient in Plants and Cyanobacteria. Photochem. Photobiol. 1995, 61, 32–42. [Google Scholar] [CrossRef]
- Strasser, R.J.; Tsimilli-Michael, M.; Srivastava, A. Analysis of the Chlorophyll a Fluorescence Transient; Springer: Dordrecht, The Netherlands, 2004. [Google Scholar]
- Strasser, R.J.; Stirbet, A.D. Estimation of the Energetic Connectivity of PS II Centres in Plants Using the Fluorescence Rise O–J–I–P: Fitting of Experimental Data to Three Different PS II Models. Math. Comput. Simul. 2001, 56, 451–462. [Google Scholar] [CrossRef]
- Gameiro, C.; Utkin, A.B.; Cartaxana, P. Characterisation of Estuarine Intertidal Macroalgae by Laser-Induced Fluorescence. Estuar. Coast. Shelf Sci. 2015, 167, 119–124. [Google Scholar] [CrossRef]
- Lavrov, A.; Utkin, A.B.; Marques Da Silva, J.; Vilar, R.; Santos, N.M.; Alves, B. Water Stress Assessment of Cork Oak Leaves and Maritime Pine Needles Based on LIF Spectra. Opt. Spectrosc. 2012, 112, 271–279. [Google Scholar] [CrossRef]
- Utkin, A.B.; Vieira, S.; Marques Da Silva, J.; Lavrov, A.; Leite, E.; Cartaxana, P. Compact Low-Cost Detector for in Vivo Assessment of Microphytobenthos Using Laser Induced Fluorescence. Opt. Spectrosc. 2013, 114, 471–477. [Google Scholar] [CrossRef]
- Küpper, H.; Seibert, S.; Parameswaran, A. Fast, Sensitive, and Inexpensive Alternative to Analytical Pigment HPLC: Quantification of Chlorophylls and Carotenoids in Crude Extracts by Fitting with Gauss Peak Spectra. Anal. Chem. 2007, 79, 7611–7627. [Google Scholar] [CrossRef]
- Bradford, M.M. A Rapid and Sensitive Method for the Quantitation of Microgram Quantities of Protein Utilizing the Principle of Protein-Dye Binding. Anal Biochem. 1976, 72, 248–254. [Google Scholar] [CrossRef]
- Marklund, S.; Marklund, G. Involvement of the Superoxide Anion Radical in the Autoxidation of Pyrogallol and a Convenient Assay for Superoxide Dismutase. Eur J. Biochem. 1974, 47, 469–474. [Google Scholar] [CrossRef]
- Teranishi, Y.; Tanaka, A.; Osumi, M.; Fukui, S. Catalase Activities of Hydrocarbon-Utilizing Candida Yeasts. Agric Biol. Chem. 1974, 38, 1213–1220. [Google Scholar] [CrossRef]
- Tiryakioglu, M.; Eker, S.; Ozkutlu, F.; Husted, S.; Cakmak, I. Antioxidant Defense System and Cadmium Uptake in Barley Genotypes Differing in Cadmium Tolerance. J. Trace Elem. Med. Biol. 2006, 20, 181–189. [Google Scholar] [CrossRef]
- Heath, R.L.; Packer, L. Photoperoxidation in Isolated Chloroplasts: I. Kinetics and Stoichiometry of Fatty Acid Peroxidation. Arch. Biochem. Biophys. 1968, 125, 189–198. [Google Scholar] [CrossRef]
- Feijão, E.; Cruz de Carvalho, R.; Duarte, I.A.; Matos, A.R.; Cabrita, M.T.; Utkin, A.B.; Caçador, I.; Marques, J.C.; Novais, S.C.; Lemos, M.F.L.; et al. Fluoxetine Induces Photochemistry-Derived Oxidative Stress on Ulva Lactuca. Front. Environ. Sci. 2022, 10, 1488. [Google Scholar] [CrossRef]
- Aderemi, A.O.; Novais, S.C.; Lemos, M.F.; Alves, L.M.; Hunter, C.; Pahl, O. Oxidative Stress Responses and Cellular Energy Allocation Changes in Microalgae Following Exposure to Widely Used Human Antibiotics. Aquat. Toxicol. 2018, 203, 130–139. [Google Scholar] [CrossRef] [Green Version]
- de Coen, W.M.; Janssen, C.R. The Missing Biomarker Link: Relationships between Effects on the Cellular Energy Allocation Biomarker of Toxicant-Stressed Daphnia Magna and Corresponding Population Characteristics. Environ. Toxicol. Chem. 2003, 22, 1632–1641. [Google Scholar] [CrossRef]
- de Coen, W.M.; Janssen, C.R. The Use of Biomarkers in Daphnia Magna Toxicity Testing. IV. Cellular Energy Allocation: A New Methodology to Assess the Energy Budget of Toxicant-Stressed Daphnia Populations. J. Aquat. Ecosyst. Stress Recovery 1997, 6, 43–55. [Google Scholar] [CrossRef]
- Gnaiger, E. Calculation of Energetic and Biochemical Equivalents of Respiratory Oxygen Consumption. In Polarographic Oxygen Sensors; Springer: Berlin, Germany, 1983; pp. 337–345. [Google Scholar] [CrossRef]
- King, F.D.; Packard, T.T. Respiration and the Activity of the Respiratory Electron Transport System in Marine Zooplankton1. Limnol. Ocean. 1975, 20, 849–854. [Google Scholar] [CrossRef]
- Verslycke, T.; Ghekiere, A.; Janssen, C.R. Seasonal and Spatial Patterns in Cellular Energy Allocation in the Estuarine Mysid Neomysis Integer (Crustacea: Mysidacea) of the Scheldt Estuary (The Netherlands). J. Exp. Mar. Biol. Ecol. 2004, 306, 245–267. [Google Scholar] [CrossRef]
- Wei, T.; Simko, V. R Package “Corrplot”: Visualization of a Correlation Matrix (Version 0.92). Available online: https://github.com/taiyun/corrplot (accessed on 19 October 2022).
- Wickham, H. Ggplot2: Elegant Graphics for Data Analysis; Springer: New York, NY, USA, 2009. [Google Scholar]
- Mendiburu, F.; Simon, R.; de Mendiburu, F. Agricolae—Ten Years of an Open Source Statistical Tool for Experiments in Breeding, Agriculture and Biology. PeerJ PrePrints 2015. [Google Scholar] [CrossRef]
- Clarke, K.R.; Gorley, R.N. PRIMER v6: User Manual/Tutorial; Prim: Plymouth, UK, 2006. [Google Scholar]
- Bonanno, G.; Veneziano, V.; Piccione, V. The Alga Ulva Lactuca (Ulvaceae, Chlorophyta) as a Bioindicator of Trace Element Contamination along the Coast of Sicily, Italy. Sci. Total Environ. 2020, 699, 134329. [Google Scholar] [CrossRef]
- Roma, J.; Matos, A.R.; Vinagre, C.; Duarte, B. Engineered Metal Nanoparticles in the Marine Environment: A Review of the Effects on Marine Fauna. Mar. Environ. Res. 2020, 161, 105110. [Google Scholar] [CrossRef]
- Brausch, J.M.; Connors, K.A.; Brooks, B.W.; Rand, G.M. Human Pharmaceuticals in the Aquatic Environment: A Review of Recent Toxicological Studies and Considerations for Toxicity Testing. Rev. Environ. Contam. Toxicol. 2012, 218, 1–99. [Google Scholar] [CrossRef]
- Cabrita, M.T.; Gameiro, C.; Utkin, A.B.; Duarte, B.; Caçador, I.; Cartaxana, P. Photosynthetic Pigment Laser-Induced Fluorescence Indicators for the Detection of Changes Associated with Trace Element Stress in the Diatom Model Species Phaeodactylum Tricornutum. Environ. Monit. Assess. 2016, 188, 1–13. [Google Scholar] [CrossRef]
- Pires, V.L.; Novais, S.C.; Lemos, M.F.L.; Fonseca, V.F.; Duarte, B. Evaluation of Multivariate Biomarker Indexes Application in Ecotoxicity Tests with Marine Diatoms Exposed to Emerging Contaminants. Appl. Sci. 2021, 11, 3878. [Google Scholar] [CrossRef]
- Duarte, B.; Santos, D.; Caçador, I. Halophyte Anti-Oxidant Feedback Seasonality in Two Salt Marshes with Different Degrees of Metal Contamination: Search for an Efficient Biomarker. Funct. Plant Biol. 2013, 40, 922–930. [Google Scholar] [CrossRef]
- Weyers, A.; Vollmer, G. Algal Growth Inhibition: Effect of the Choice of Growth Rate or Biomass as Endpoint on the Classification and Labelling of New Substances Notified in the EU. Chemosphere 2000, 41, 1007–1010. [Google Scholar] [CrossRef]
- Nunes, B.; Carvalho, F.; Guilhermino, L. Acute Toxicity of Widely Used Pharmaceuticals in Aquatic Species: Gambusia Holbrooki, Artemia Parthenogenetica and Tetraselmis Chuii. Ecotoxicol. Environ. Saf. 2005, 61, 413–419. [Google Scholar] [CrossRef]
- Reynolds, A.; Giltrap, D.M.; Chambers, P.G. Acute Growth Inhibition & Toxicity Analysis of Nano-Polystyrene Spheres on Raphidocelis Subcapitata. Ecotoxicol. Environ. Saf. 2021, 207, 111153. [Google Scholar] [CrossRef]
- Ivanković, T.; Hrenović, J. Surfactants in the Environment. Arh. Hig. Rada Toksikol. 2010, 61, 95–110. [Google Scholar] [CrossRef] [PubMed]
- Palmer, C.M.; Maloney, T.E.; Taft, R.A. Preliminary Screening for Potential Algicides. Ohio J. Sci. 1955, 55, 1–8. [Google Scholar]
- Dirilgen, N.; Ince, N. Inhibition Effect of the Anionic Surfactant SDS on Duckweed, LEMNA Minor with Considerations of Growth and Accumulation. Chemosphere 1995, 31, 4185–4196. [Google Scholar] [CrossRef]
- Tkalin, A.V.; Belan, T.A.; Shapovalov, E.N. The State of the Marine Environment near Vladivostok, Russia. Mar. Pollut. Bull. 1993, 26, 418–422. [Google Scholar] [CrossRef]
- Haigh, S.D. A Review of the Interaction of Surfactants with Organic Contaminants in Soil. Sci. Total Environ. 1996, 185, 161–170. [Google Scholar] [CrossRef]
- Smolders, R.; Bervoets, L.; de Coen, W.; Blust, R. Cellular Energy Allocation in Zebra Mussels Exposed along a Pollution Gradient: Linking Cellular Effects to Higher Levels of Biological Organization. Environ. Pollut. 2004, 129, 99–112. [Google Scholar] [CrossRef]
- Masakorala, K.; Turner, A.; Brown, M.T. Toxicity of Synthetic Surfactants to the Marine Macroalga, Ulva Lactuca. Water Air Soil Pollut. 2011, 218, 283–291. [Google Scholar] [CrossRef]
- Areco, M.M.; Salomone, V.N.; Afonso, M.d.S. Ulva Lactuca: A Bioindicator for Anthropogenic Contamination and Its Environmental Remediation Capacity. Mar. Environ. Res. 2021, 171, 105468. [Google Scholar] [CrossRef]
- Cerqueira, J.V.A.; Silveira, J.A.G.; Carvalho, F.E.L.; Cunha, J.R.; Lima Neto, M.C. The Regulation of P700 Is an Important Photoprotective Mechanism to NaCl-Salinity in Jatropha Curcas. Physiol. Plant 2019, 167, 404–417. [Google Scholar] [CrossRef]
- Sousa, G.T.; Neto, M.C.L.; Choueri, R.B.; Castro, Í.B. Photoprotection and Antioxidative Metabolism in Ulva Lactuca Exposed to Coastal Oceanic Acidification Scenarios in the Presence of Irgarol. Aquat. Toxicol. 2021, 230, 105717. [Google Scholar] [CrossRef]
- Anjum, N.A.; Duarte, B.; Caçador, I.; Sleimi, N.; Duarte, A.C.; Pereira, E. Biophysical and Biochemical Markers of Metal/Metalloid-Impacts in Salt Marsh Halophytes and Their Implications. Front. Environ. Sci. 2016, 4, 24. [Google Scholar] [CrossRef] [Green Version]
- Tóth, S.Z.; Schansker, G.; Strasser, R.J. A Non-Invasive Assay of the Plastoquinone Pool Redox State Based on the OJIP-Transient. Photosynth. Res. 2007, 93, 193–203. [Google Scholar] [CrossRef] [PubMed]
- Gupta, R. The Oxygen-Evolving Complex: A Super Catalyst for Life on Earth, in Response to Abiotic Stresses. Plant Signal. Behav. 2020, 15, 1824721. [Google Scholar] [CrossRef] [PubMed]
- Cleland, R.E.; Grace, S.C. Voltammetric Detection of Superoxide Production by Photosystem II. FEBS Lett. 1999, 457, 348–352. [Google Scholar] [CrossRef] [PubMed]
- Human, L.R.D.; Feijão, E.; Cruz de Carvalho, R.; Caçador, I.; Reis-Santos, P.; Fonseca, V.; Duarte, B. Mediterranean Salt Marsh Sediment Metal Speciation and Bioavailability Changes Induced by the Spreading of Non-Indigenous Spartina Patens. Estuar. Coast. Shelf Sci. 2020, 243, 106921. [Google Scholar] [CrossRef]
- Xie, X.; Gao, S.; Gu, W.; Pan, G.; Wang, G. Desiccation Induces Accumulations of Antheraxanthin and Zeaxanthin in Intertidal Macro-Alga Ulva Pertusa (Chlorophyta). PLoS ONE 2013, 8, e72929. [Google Scholar] [CrossRef]
- Gao, S.; Zheng, Z.; Wang, J.; Wang, G. Slow Zeaxanthin Accumulation and the Enhancement of CP26 Collectively Contribute to an Atypical Non-Photochemical Quenching in Macroalga Ulva Prolifera under High Light. J. Phycol. 2020, 56, 393–403. [Google Scholar] [CrossRef]
- Kuczynska, P.; Jemiola-Rzeminska, M.; Strzalka, K. Photosynthetic Pigments in Diatoms. Mar. Drugs 2015, 13, 5847–5881. [Google Scholar] [CrossRef]
- Zapata, M.; Garrido, J.L.; Jeffrey, S.W. Chlorophyll c Pigments: Current Status. In Chlorophylls and Bacteriochlorophylls; Springer: Dordrecht, The Netherlands, 2006; pp. 39–53. [Google Scholar] [CrossRef]
- Abida, H.; Dolch, L.-J.; Meï, C.; Villanova, V.; Conte, M.; Block, M.A.; Finazzi, G.; Bastien, O.; Tirichine, L.; Bowler, C.; et al. Membrane Glycerolipid Remodeling Triggered by Nitrogen and Phosphorus Starvation in Phaeodactylum Tricornutum 1. Plant Physiol. Ò 2015, 167, 118–136. [Google Scholar] [CrossRef] [Green Version]
- Thornton, D.C.O. Effect of Low PH on Carbohydrate Production by a Marine Planktonic Diatom (Chaetoceros Muelleri). Res. Lett. Ecol. 2009, 2009, 105901. [Google Scholar] [CrossRef] [Green Version]
- Griffiths, M.J.; Harrison, S.T.L. Lipid Productivity as a Key Characteristic for Choosing Algal Species for Biodiesel Production. J. Appl Phycol. 2009, 21, 493–507. [Google Scholar] [CrossRef]
- Kern, J.; Guskov, A. Lipids in Photosystem II: Multifunctional Cofactors. J. Photochem. Photobiol. B 2011, 104, 19–34. [Google Scholar] [CrossRef] [PubMed]
- Sakurai, I.; Mizusawa, N.; Wada, H.; Sato, N. Digalactosyldiacylglycerol Is Required for Stabilization of the Oxygen-Evolving Complex in Photosystem II. Plant Physiol. 2007, 145, 1361. [Google Scholar] [CrossRef] [PubMed]


| OJIP-Test | |
|---|---|
| Area | Corresponds to the oxidized quinone pool size available for reduction and is a function of the area above the Kautsky plot |
| N | Reaction centre turnover rate |
| SM | Corresponds to the energy needed to close all reaction centres |
| M0 | The net rate of PS II RC closure |
| PG | Grouping probability between the two PS II units |
| ABS/CS | Absorbed energy flux per cross-section |
| TR/CS | Trapped energy flux per cross-section |
| ET/CS | Electron transport energy flux per cross-section |
| DI/CS | Dissipated energy flux per cross-section |
| RC/CS | Number of available reaction centres per cross-section |
| RC/ABS | Reaction centre II density within the antenna chlorophyll bed of PS II |
| SDS Concentration (mg L−1) | |||||
|---|---|---|---|---|---|
| Pigments (µg × 10−8 cell−1) | 0 | 0.1 | 1 | 3 | 10 |
| Chl a | 39.32 ± 1.11 ac | 50.83 ± 4.47 ab | 56.74 ± 3.89 ab† | 52.27 ± 2.15 ab | 37.04 ± 3.10 c |
| Chl c | 4.40 ± 1.44 a | 5.15 ± 0.50 a† | 4.71 ± 1.54 a | 3.40 ± 1.59 a | 1.49 ± 0.13 a |
| Pheo a | 1.03 ± 0.33 ab | 1.74 ± 0.87 a | 2.05 ± 0.15 a† | 1.12 ± 0.35 ab | 0.17 ± 0.06 b |
| β-carot | 3.57 ± 0.91 ab | 4.92 ± 1.06 a | 6.06 ± 0.71 a† | 4.32 ± 0.56 ab | 1.21 ± 0.02 b |
| Fx | 9.73 ± 3.79 ab | 8.95 ± 5.83 b | 5.30 ± 1.37 b | 14.49 ± 2.1 ab | 22.20 ± 2.17 a† |
| DD | 7.19 ± 1.18 a | 10.03 ± 2.02 ab | 11.48 ± 0.74 b† | 8.93 ± 0.62 ab | 7.63 ± 0.66 a |
| DT | 6.96 ± 1.33 a | 7.15 ± 2.79 a | 5.66 ± 1.13 a | 7.59 ± 0.98 a† | 7.59 ± 1.58 a |
| SDS Concentration (mg L−1) | |||||
|---|---|---|---|---|---|
| Pigments (µg g−1 FW) | 0 | 0.1 | 1 | 3 | 10 |
| Chl a | 66.03 ± 54.59 a† | 55.05 ± 43.49 ab | 18.63 ± 7.39 bc | 10.87 ± 7.62 c | 9.86 ± 0.45 c |
| Chl b | 46.18 ± 37.69 a† | 39.35 ± 31.28 ab | 12.45 ± 4.58 bc | 7.41 ± 5.26 c | 6.30 ± 0.14 c |
| Pheo a | 0.67 ± 0.92 a† | 0.56 ± 0.63 a | 0.09 ± 0.03 a | 0.01 ± 0.02 b | 0.00 ± 0.00 b |
| Auro | 3.69 ± 2.60 a† | 3.34 ± 2.26 a | 1.14 ± 0.55 b | 0.79 ± 0.54 b | 0.79 ± 0.29 b |
| Anthera | 3.82 × 10⁻¹² ± 2.12 × 10⁻¹² a | 2.36 × 10⁻¹² ± 1.06 × 10⁻¹² a | 1.00 × 10⁻¹² ± 0.22 × 10⁻¹² a | 3.68 × 10⁻¹² ± 3.77 × 10⁻¹² a | 4.60 × 10⁻¹² ± 1.19 × 10⁻¹² a† |
| β-carot | 0.90 ± 0.42 a† | 0.74 ± 0.48 a | 0.31 ± 0.18 b | 0.20 ± 0.12 b | 0.23 ± 0.10 b |
| Lut | 4.95 ± 3.75 a† | 4.35 ± 3.65 ab | 1.64 ± 0.49 bc | 0.93 ± 0.57 c | 1.00 ± 0.20 c |
| Viola | 1.22 ± 0.89 a† | 0.95 ± 0.60 ab | 0.46 ± 0.30 bc | 0.19 ± 0.17 c | 0.13 ± 0.08 c |
| Zea | 0.95 ± 0.45 a† | 0.78 ± 0.51 a | 0.33 ± 0.19 b | 0.21 ± 0.13 b | 0.24 ± 0.11 b |
Publisher’s Note: MDPI stays neutral with regard to jurisdictional claims in published maps and institutional affiliations. |
© 2022 by the authors. Licensee MDPI, Basel, Switzerland. This article is an open access article distributed under the terms and conditions of the Creative Commons Attribution (CC BY) license (https://creativecommons.org/licenses/by/4.0/).
Share and Cite
Cruz de Carvalho, R.; Feijão, E.; Matos, A.R.; Cabrita, M.T.; Utkin, A.B.; Novais, S.C.; Lemos, M.F.L.; Caçador, I.; Marques, J.C.; Reis-Santos, P.; et al. Ecotoxicological Effects of the Anionic Surfactant Sodium Dodecyl Sulfate (SDS) in Two Marine Primary Producers: Phaeodactylum tricornutum and Ulva lactuca. Toxics 2022, 10, 780. https://doi.org/10.3390/toxics10120780
Cruz de Carvalho R, Feijão E, Matos AR, Cabrita MT, Utkin AB, Novais SC, Lemos MFL, Caçador I, Marques JC, Reis-Santos P, et al. Ecotoxicological Effects of the Anionic Surfactant Sodium Dodecyl Sulfate (SDS) in Two Marine Primary Producers: Phaeodactylum tricornutum and Ulva lactuca. Toxics. 2022; 10(12):780. https://doi.org/10.3390/toxics10120780
Chicago/Turabian StyleCruz de Carvalho, Ricardo, Eduardo Feijão, Ana Rita Matos, Maria Teresa Cabrita, Andrei B. Utkin, Sara C. Novais, Marco F. L. Lemos, Isabel Caçador, João Carlos Marques, Patrick Reis-Santos, and et al. 2022. "Ecotoxicological Effects of the Anionic Surfactant Sodium Dodecyl Sulfate (SDS) in Two Marine Primary Producers: Phaeodactylum tricornutum and Ulva lactuca" Toxics 10, no. 12: 780. https://doi.org/10.3390/toxics10120780