

Determination of 19 Steroid Hormones in Human Serum and Urine Using Liquid Chromatography-Tandem Mass Spectrometry

Abstract
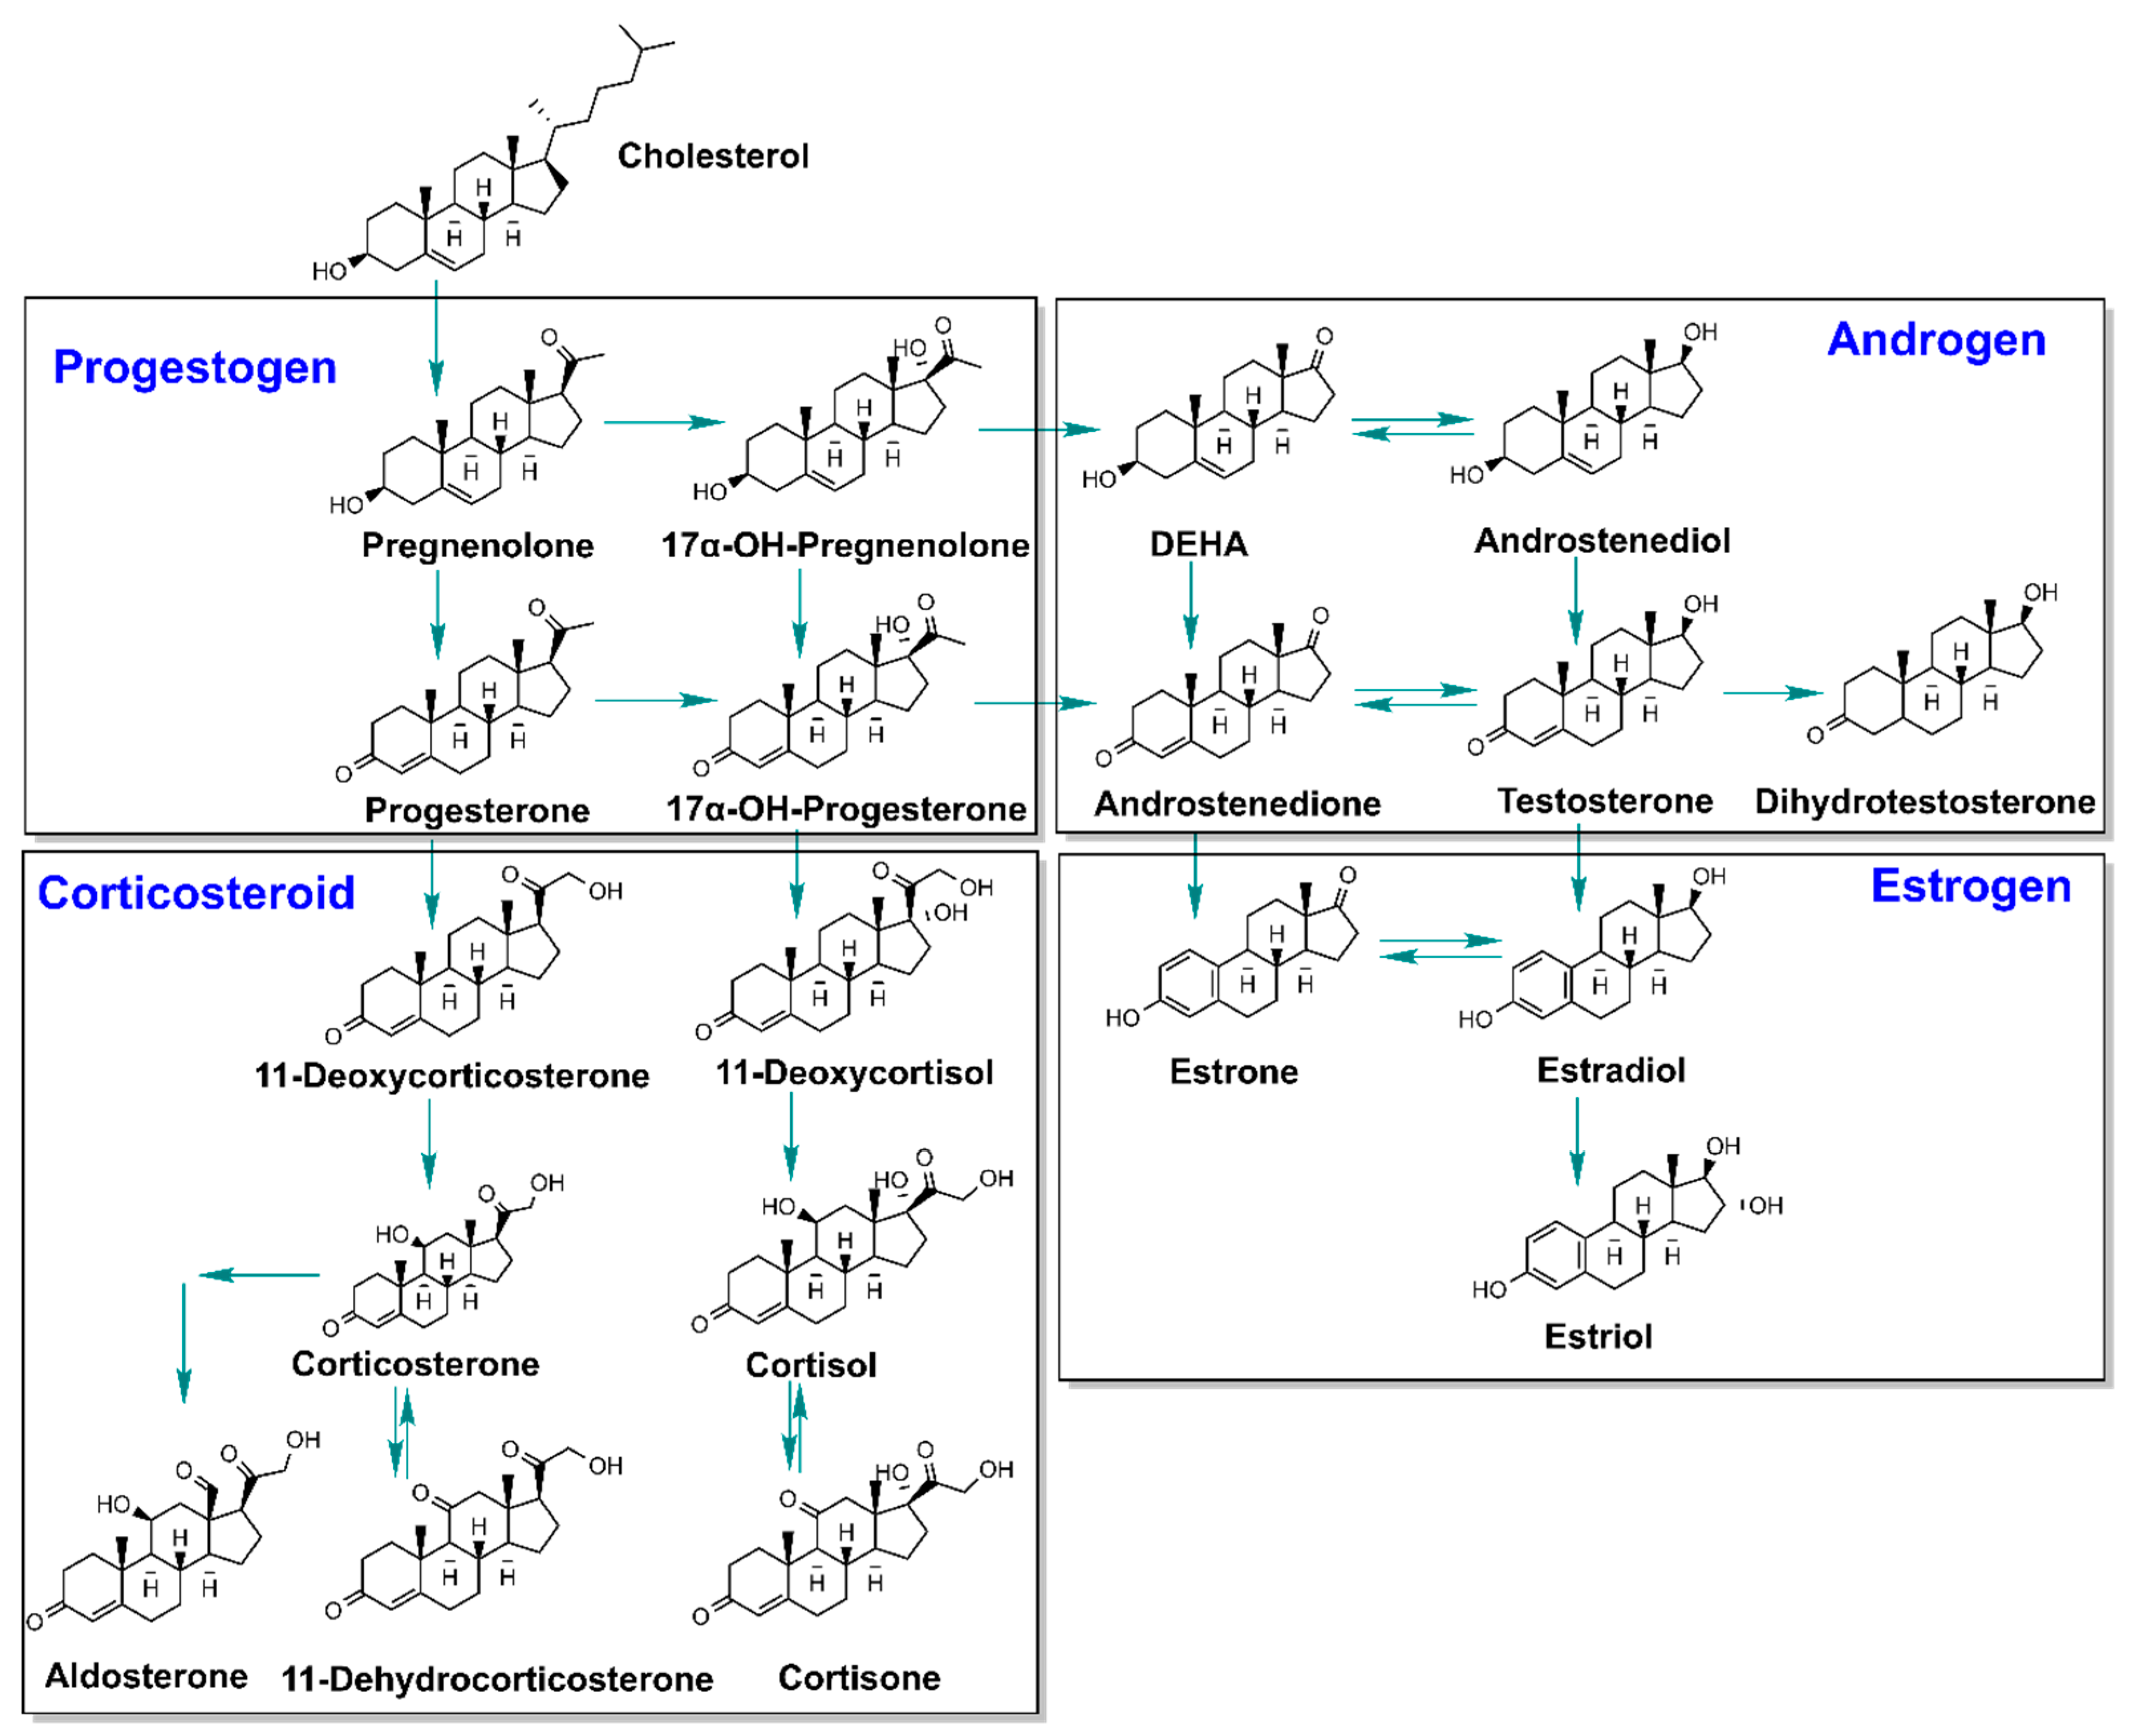
:1. Introduction
2. Materials and Methods
2.1. Chemicals and Reagents
2.2. Sample Collection
2.3. Preparation of Urine and Serum Samples
2.4. LC-MS/MS Analysis
2.5. Method Validation
2.6. Quality Assurance and Quality Control
3. Results and Discussion
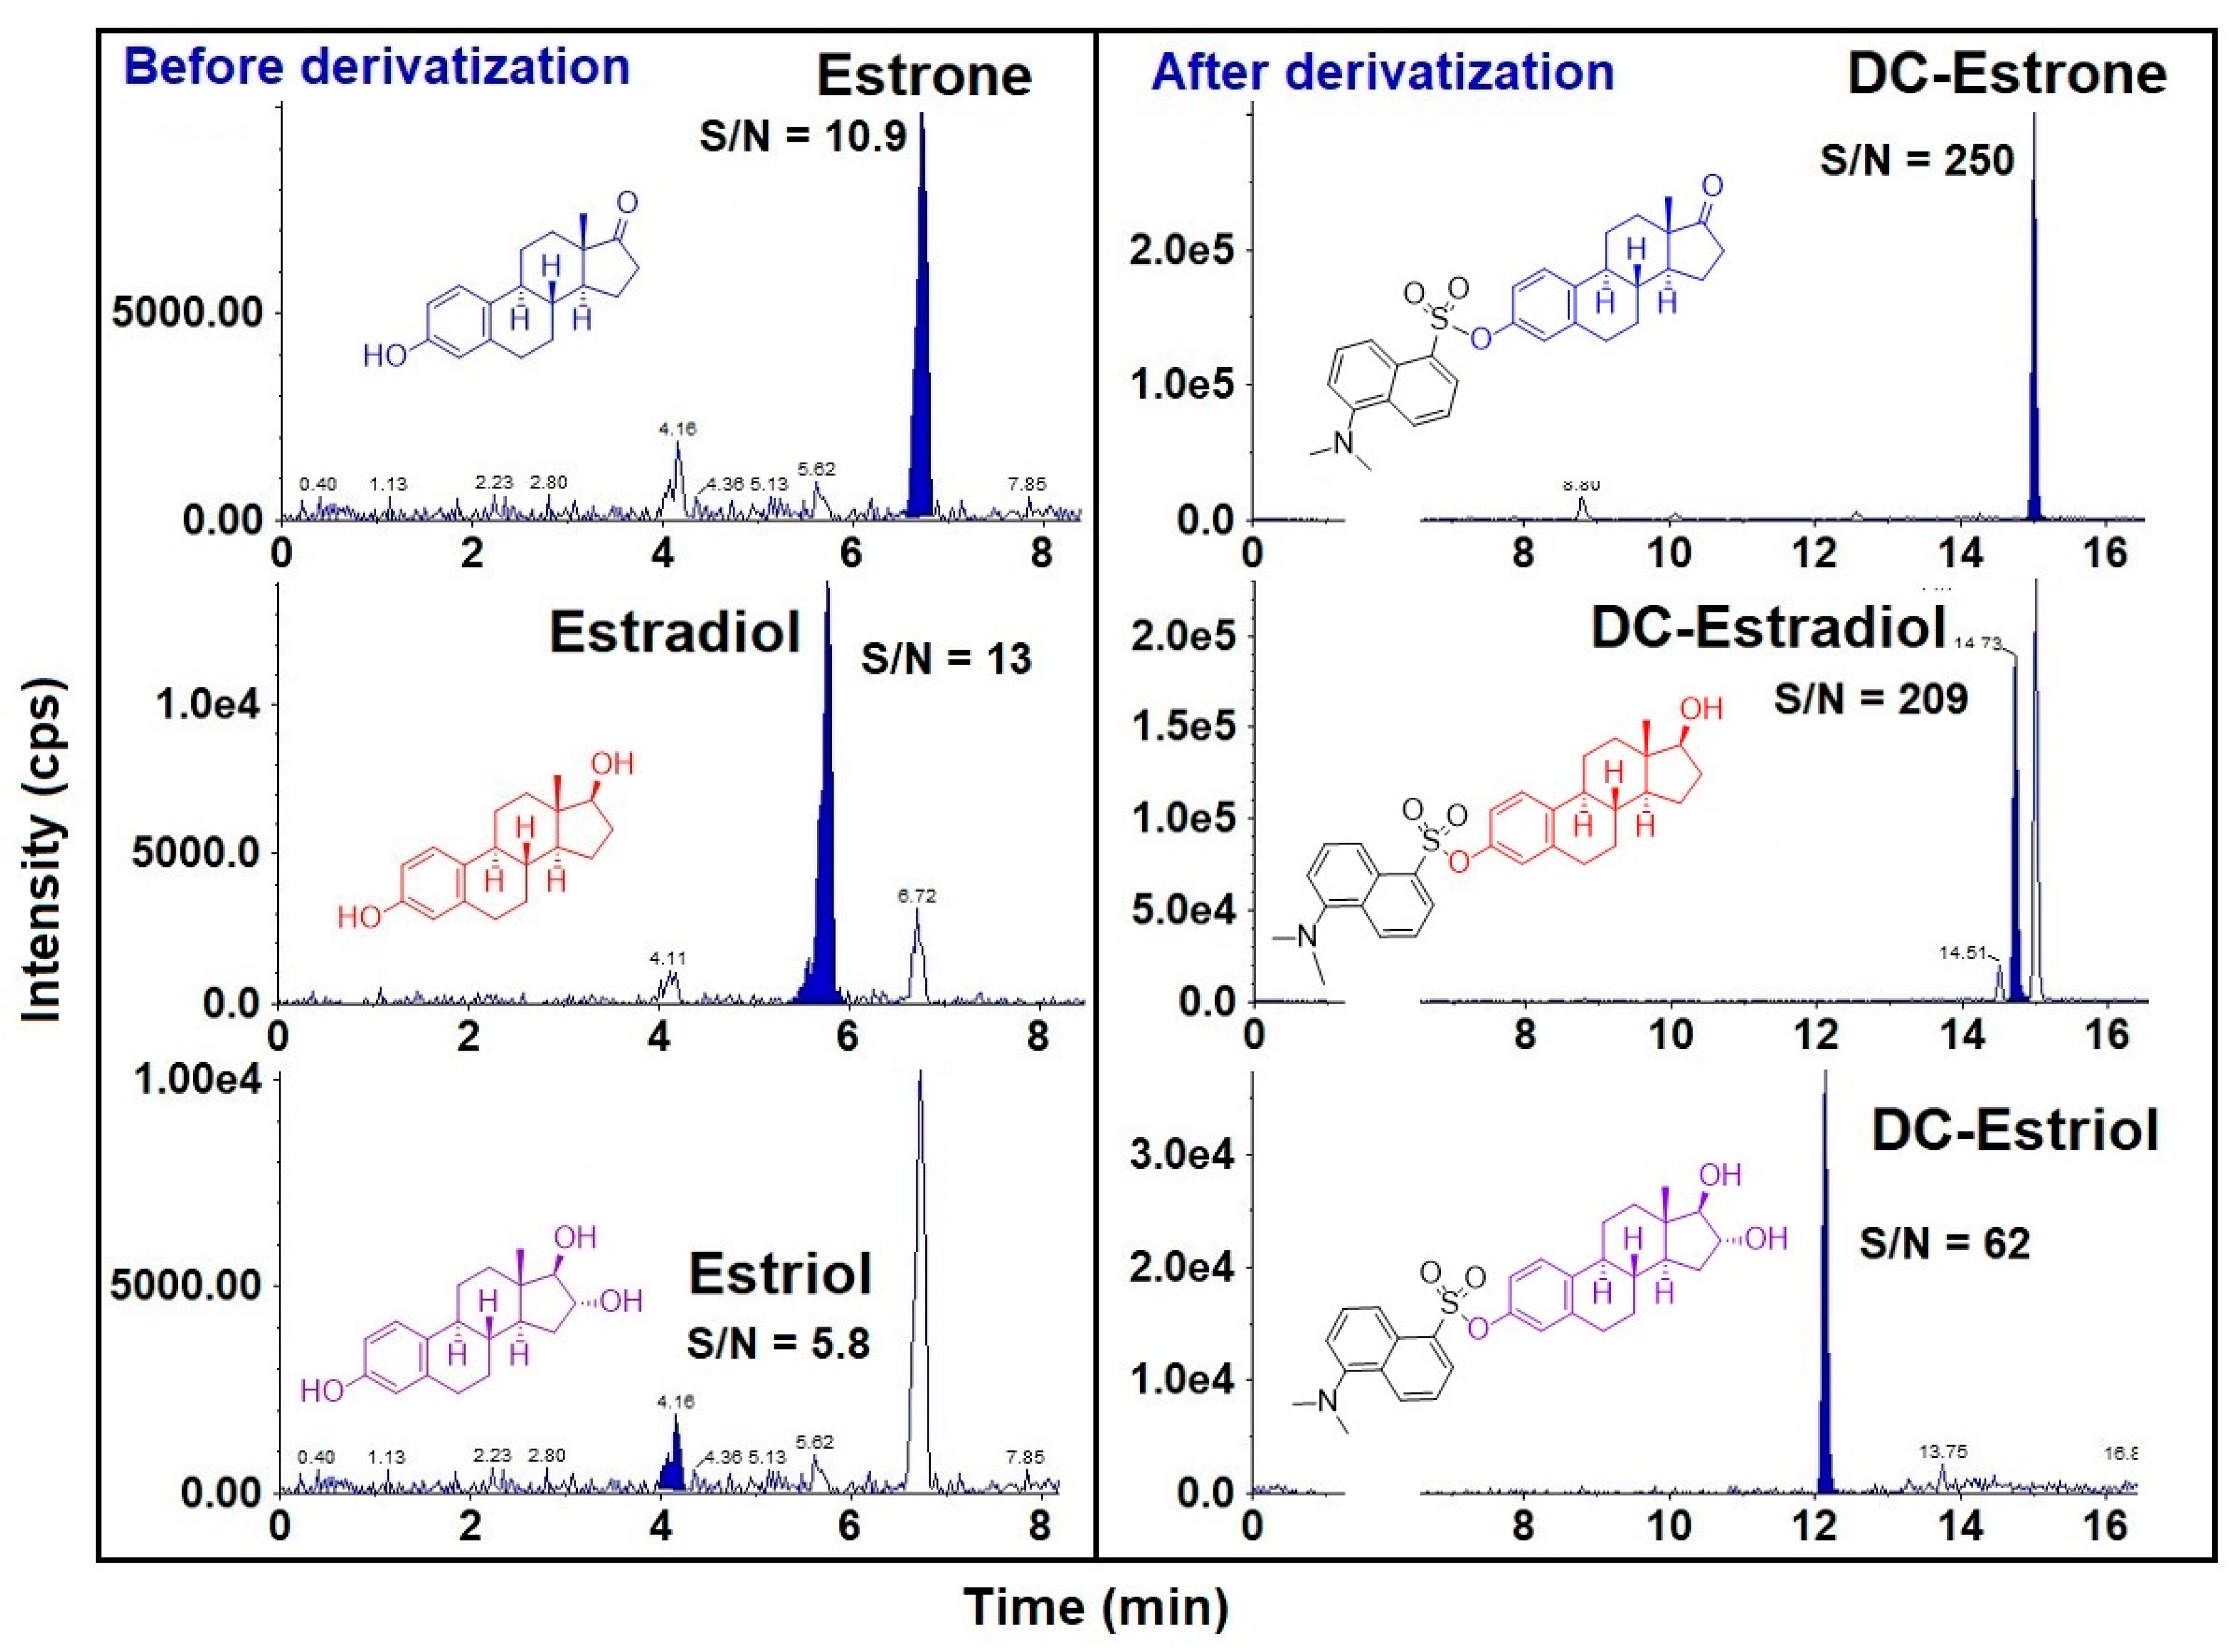
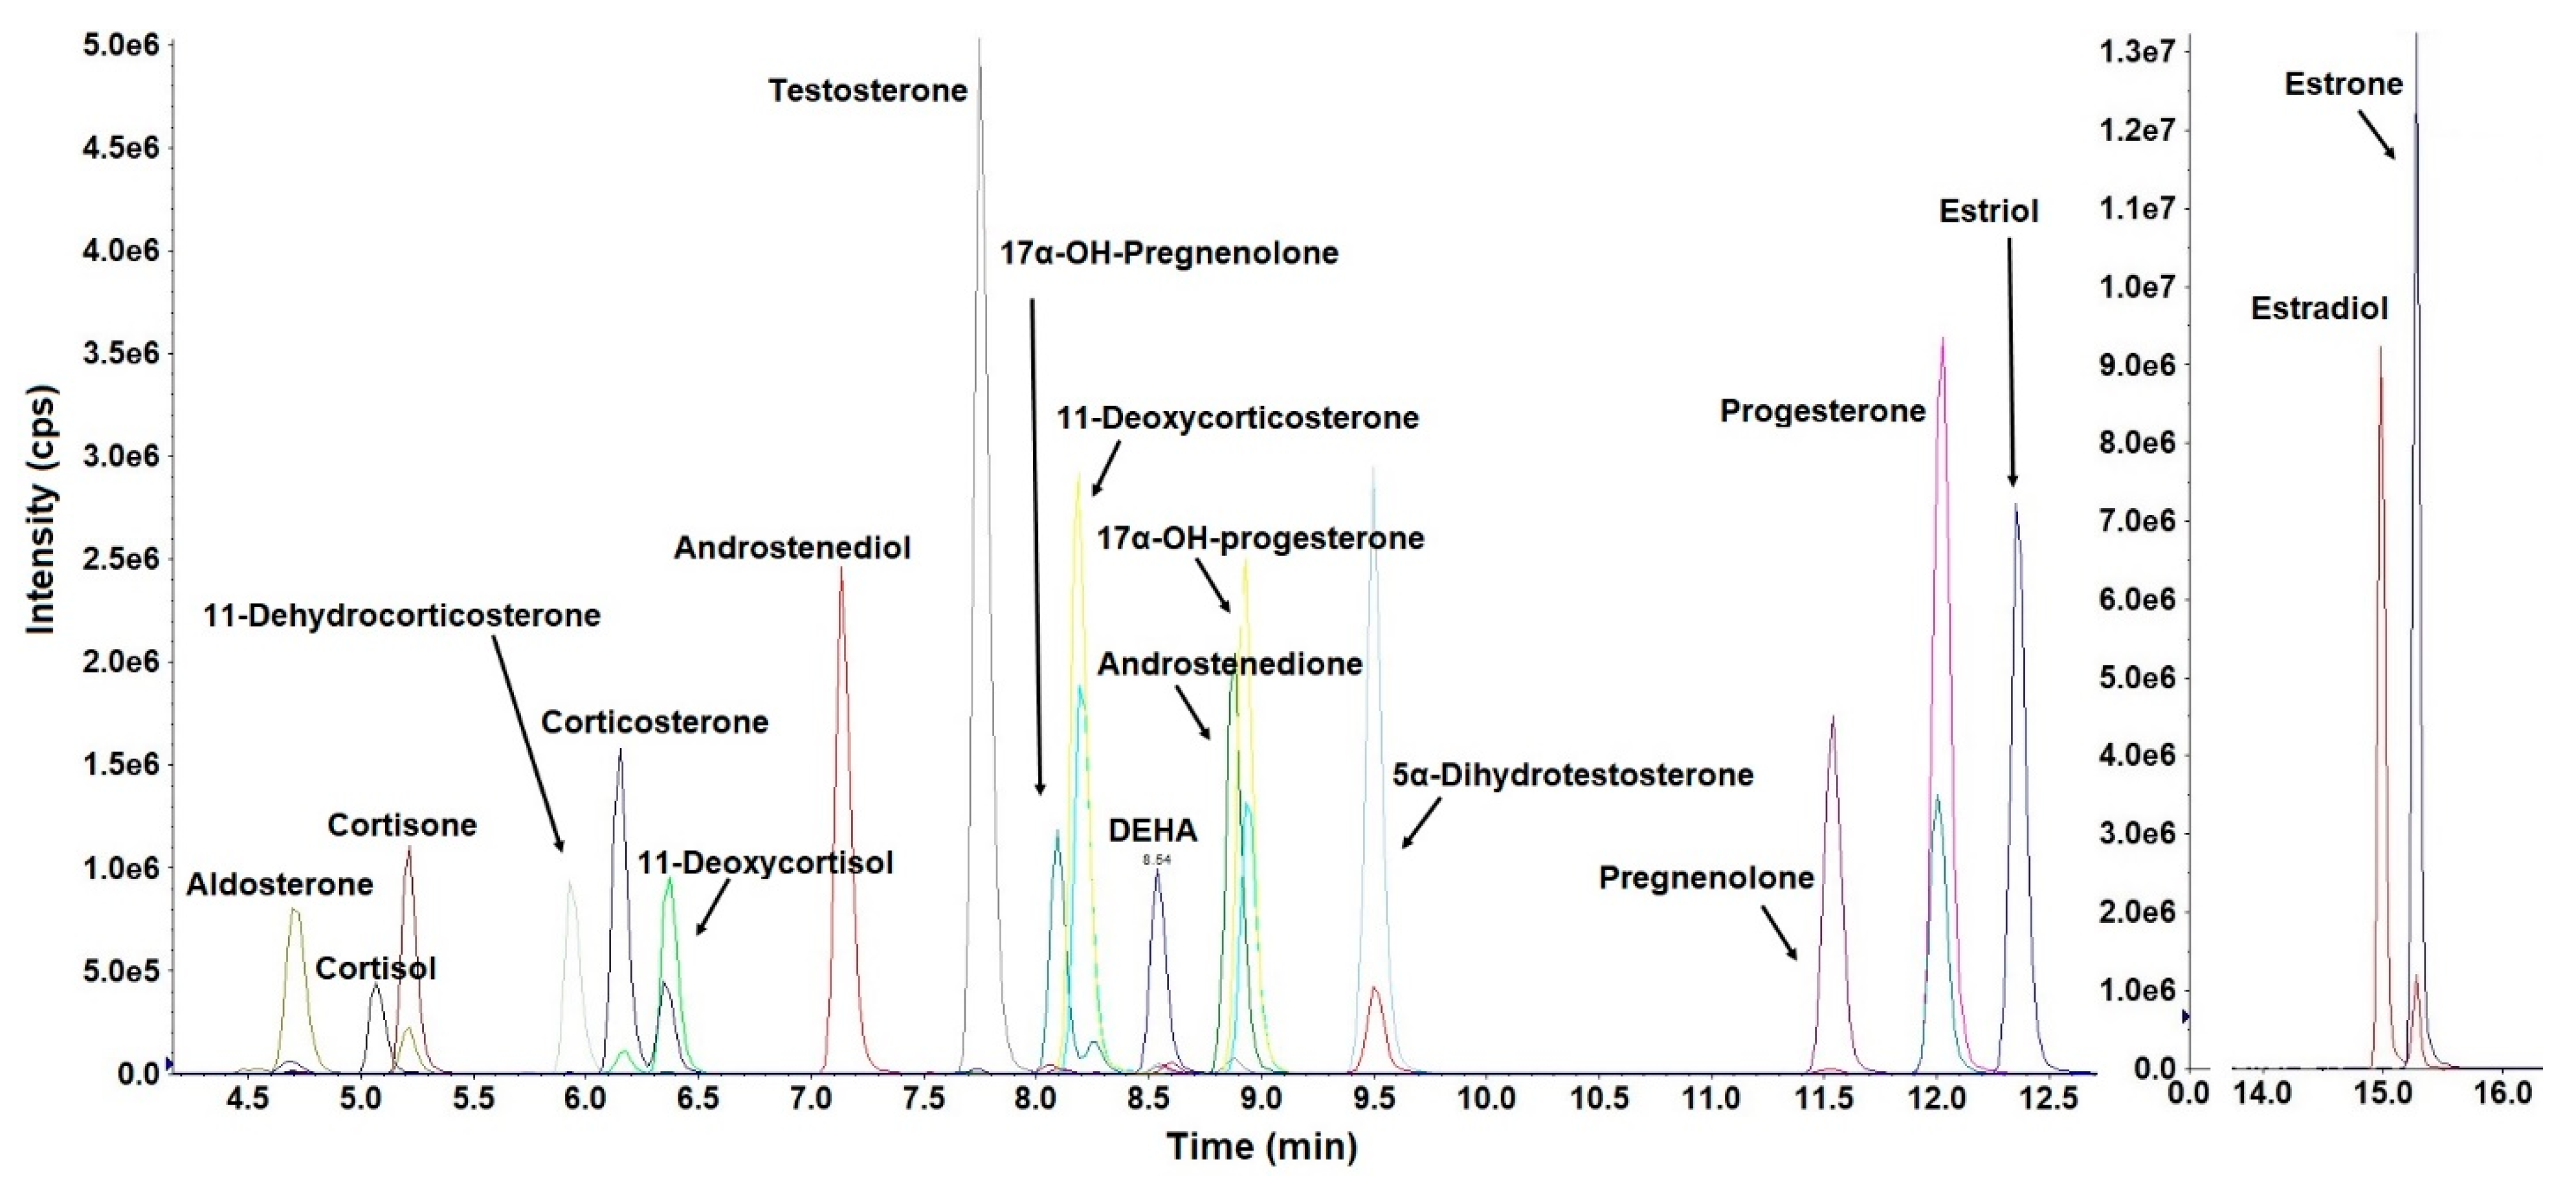
3.1. Chromatography and Mass Spectrometry
3.2. Optimization of Sample Purification
3.3. Method Validation
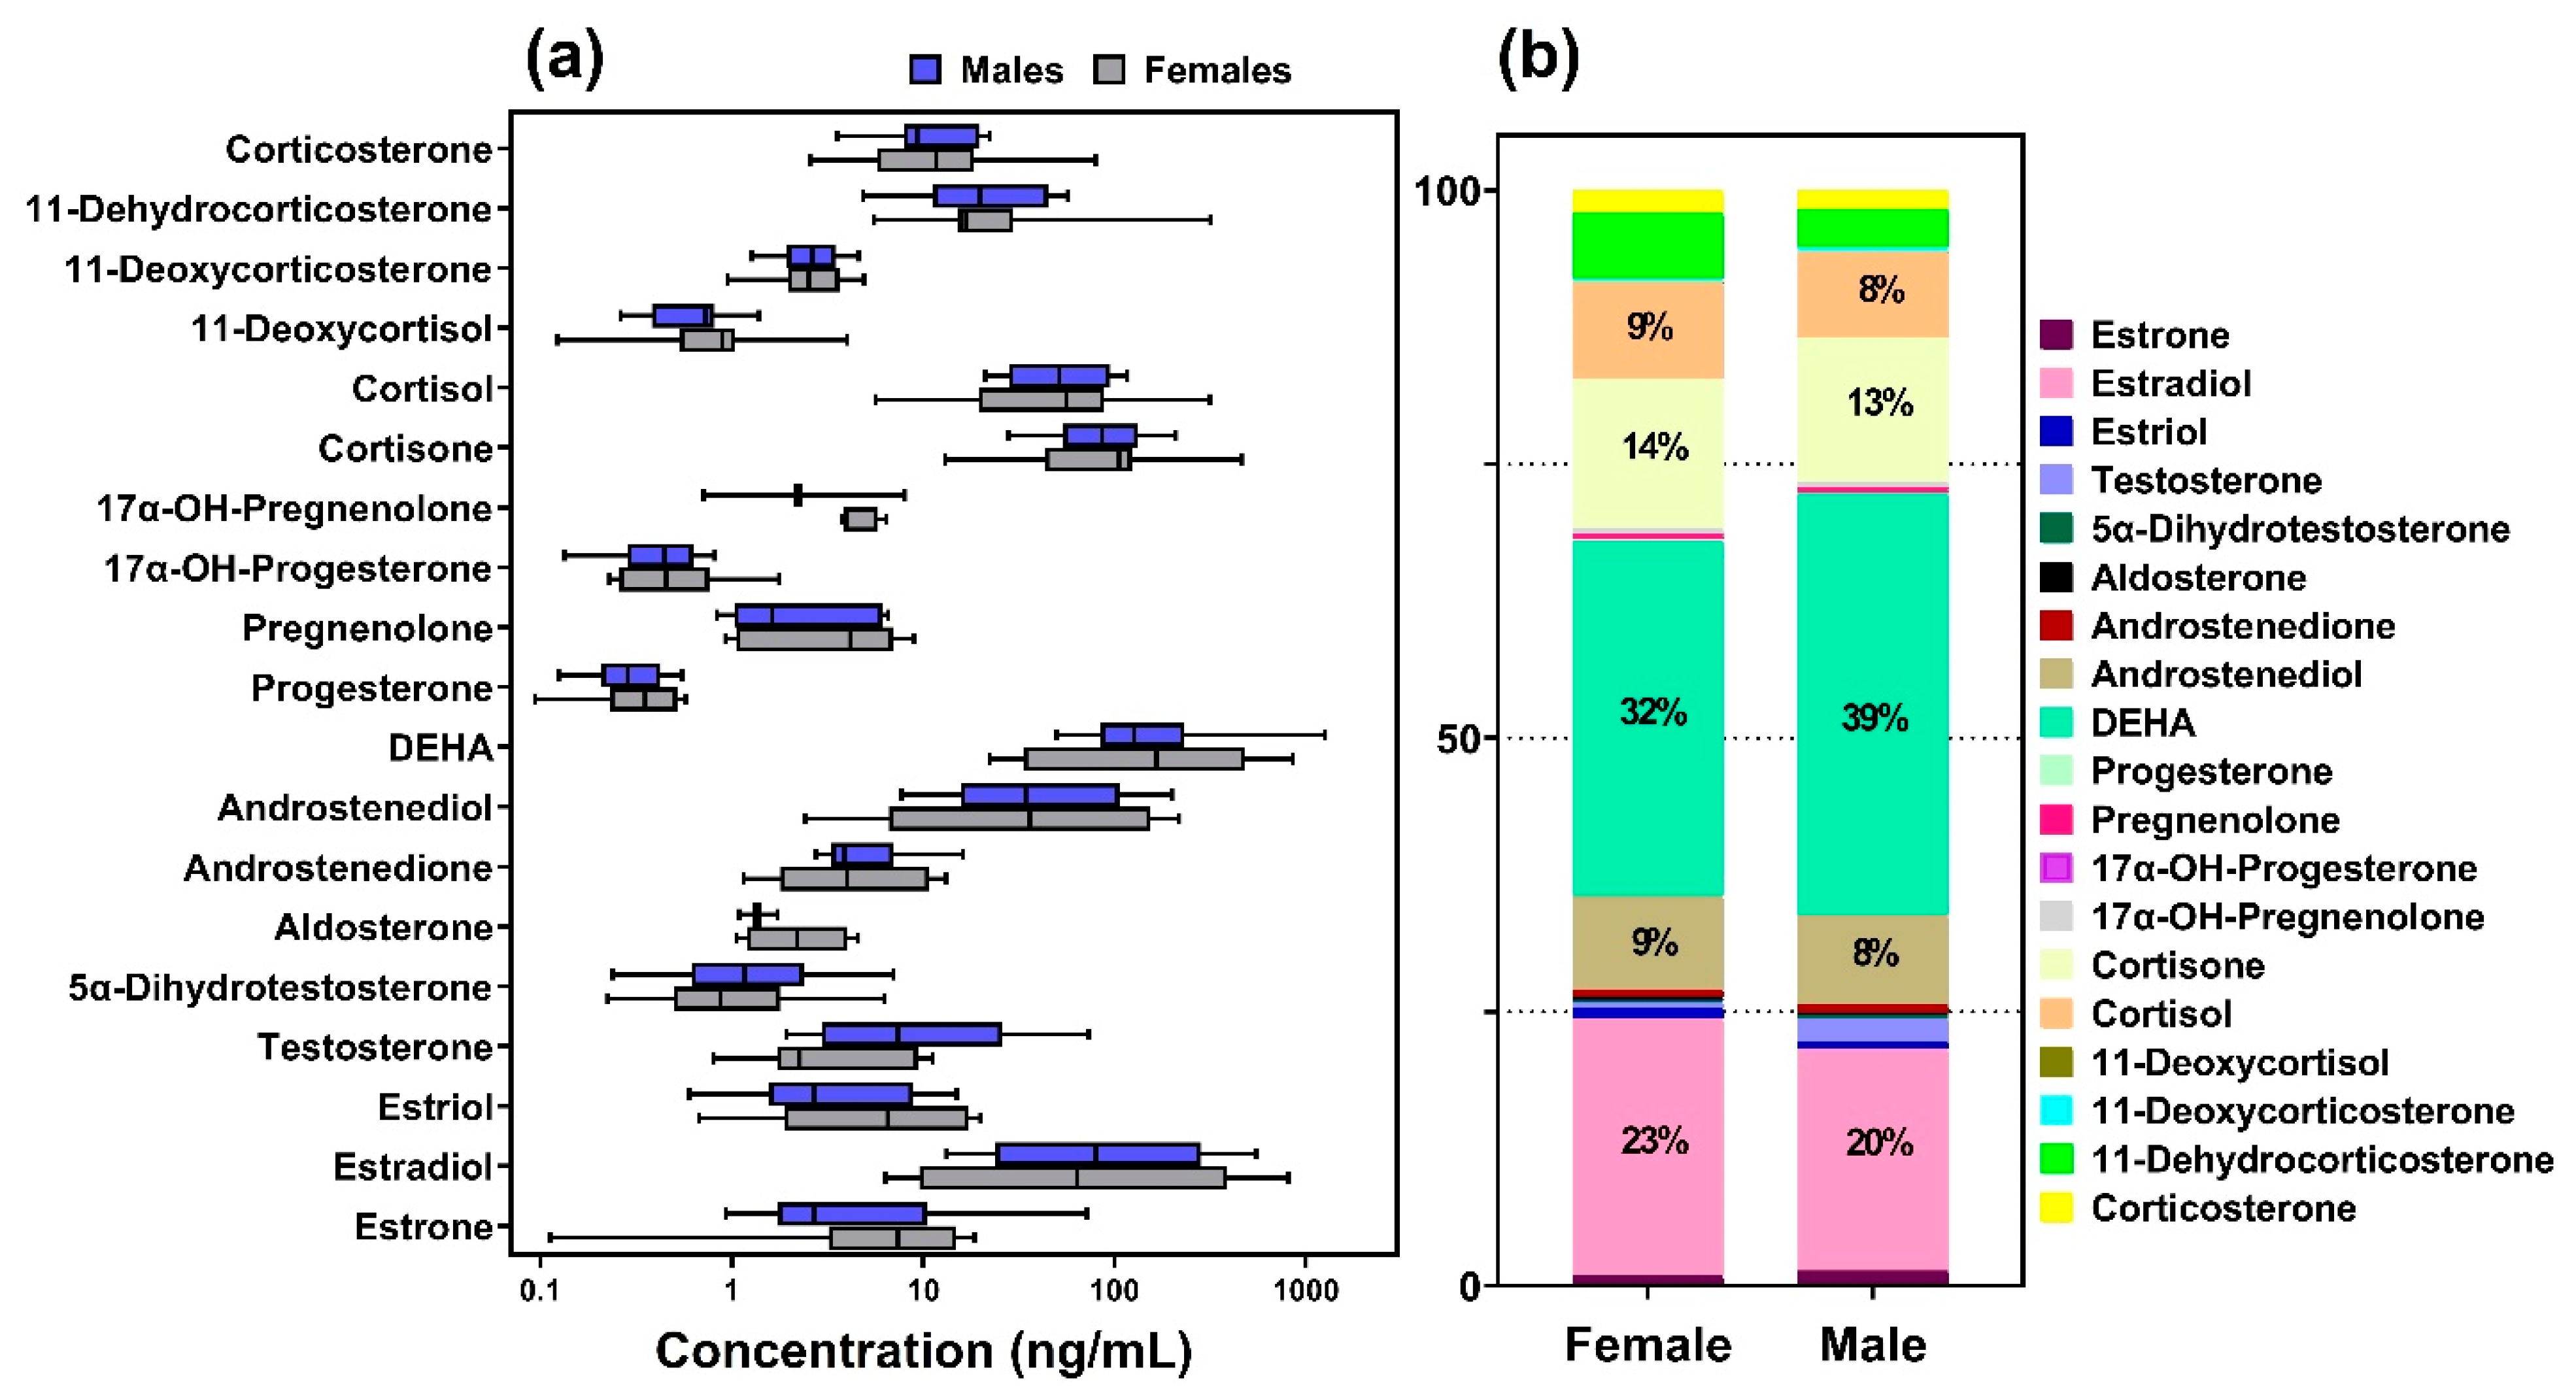
3.4. Method Application
4. Conclusions
Supplementary Materials
Author Contributions
Funding
Institutional Review Board Statement
Informed Consent Statement
Data Availability Statement
Conflicts of Interest
References
- Schiffer, L.; Barnard, L.; Baranowski, E.S.; Gilligan, L.C.; Taylor, A.E.; Arlt, W.; Shackleton, C.H.L.; Storbeck, K.H. Human steroid biosynthesis, metabolism and excretion are differentially reflected by serum and urine steroid metabolomes: A comprehensive review. J. Steroid. Biochem. Mol. Biol. 2019, 194, 105439. [Google Scholar] [CrossRef] [PubMed]
- Papadopoulos, A.S.; Cleare, A.J. Hypothalamic-pituitary-adrenal axis dysfunction in chronic fatigue syndrome. Nat. Rev. Endocrinol. 2011, 8, 22–32. [Google Scholar] [CrossRef] [PubMed]
- Acevedo-Rodriguez, A.; Kauffman, A.S.; Cherrington, B.D.; Borges, C.S.; Roepke, T.A.; Laconi, M. Emerging insights into hypothalamic-pituitary-gonadal axis regulation and interaction with stress signalling. J. Neuroendocrinol. 2018, 30, e12590. [Google Scholar] [CrossRef] [PubMed]
- Falkenstein, E.; Tillmann, H.-C.; Christ, M.; Feuring, M.; Wehling, M. Multiple actions of steroid hormones—A focus on rapid, nongenomic effects. Pharmacol. Rev. 2000, 52, 513–556. [Google Scholar]
- Boggs, A.S.; Bowden, J.A.; Galligan, T.M.; Guillette, L.J., Jr.; Kucklick, J.R. Development of a multi-class steroid hormone screening method using Liquid Chromatography/Tandem Mass Spectrometry (LC-MS/MS). Anal. Bioanal. Chem. 2016, 408, 4179–4190. [Google Scholar] [CrossRef] [Green Version]
- Taylor, J.I.; Grace, P.B.; Bingham, S.A. Optimization of conditions for the enzymatic hydrolysis of phytoestrogen conjugates in urine and plasma. Anal. Biochem. 2005, 341, 220–229. [Google Scholar] [CrossRef]
- Baglietto, L.; Severi, G.; English, D.R.; Krishnan, K.; Hopper, J.L.; McLean, C.; Morris, H.A.; Tilley, W.D.; Giles, G.G. Circulating steroid hormone levels and risk of breast cancer for postmenopausal women. Cancer Epidemiol. Biomark. Prev. 2010, 19, 492–502. [Google Scholar] [CrossRef] [Green Version]
- Peck, J.D.; Hulka, B.S.; Poole, C.; Savitz, D.A.; Baird, D.; Richardson, B.E. Steroid hormone levels during pregancy and incidence of maternal breast cancer. Cancer Epidemiol. Biomark. Prev. 2002, 11, 361–368. [Google Scholar]
- Eliassen, A.H.; Missmer, S.A.; Tworoger, S.S.; Spiegelman, D.; Barbieri, R.L.; Dowsett, M.; Hankinson, S.E. Endogenous steroid hormone concentrations and risk of breast cancer among premenopausal women. J. Natl. Cancer Inst. 2006, 98, 1406–1415. [Google Scholar] [CrossRef] [Green Version]
- Lukanova, A.; Lundin, E.; Micheli, A.; Arslan, A.; Ferrari, P.; Rinaldi, S.; Krogh, V.; Lenner, P.; Shore, R.E.; Biessy, C.; et al. Circulating levels of sex steroid hormones and risk of endometrial cancer in postmenopausal women. Int. J. Cancer 2004, 108, 425–432. [Google Scholar] [CrossRef]
- Lukanova, A.; Lundin, E.; Akhmedkhanov, A.; Micheli, A.; Rinaldi, S.; Zeleniuch-Jacquotte, A.; Lenner, P.; Muti, P.; Biessy, C.; Krogh, V.; et al. Circulating levels of sex steroid hormones and risk of ovarian cancer. Int. J. Cancer 2003, 104, 636–642. [Google Scholar] [CrossRef] [PubMed]
- Herane Vives, A.; De Angel, V.; Papadopoulos, A.; Strawbridge, R.; Wise, T.; Young, A.H.; Arnone, D.; Cleare, A.J. The relationship between cortisol, stress and psychiatric illness: New insights using hair analysis. J. Psychiatr. Res. 2015, 70, 38–49. [Google Scholar] [CrossRef] [PubMed]
- Pollock, T.; Arbuckle, T.E.; Guth, M.; Bouchard, M.F.; St-Amand, A. Associations among urinary triclosan and bisphenol A concentrations and serum sex steroid hormone measures in the Canadian and U.S. Populations. Environ. Int. 2021, 146, 106229. [Google Scholar] [CrossRef] [PubMed]
- Aimuzi, R.; Wang, Y.; Luo, K.; Jiang, Y. Exposure to phthalates, phenols, and parabens mixture and alterations in sex steroid hormones among adolescents. Chemosphere 2022, 302, 134834. [Google Scholar] [CrossRef] [PubMed]
- Soldin, S.J.; Soldin, O.P. Steroid hormone analysis by tandem mass spectrometry. Clin. Chem. 2009, 55, 1061–1066. [Google Scholar] [CrossRef] [PubMed] [Green Version]
- Adlercreutz, H.; Kiuru, P.; Rasku, S.; Wahala, K.; Fotsis, T. An isotope dilution gas chromatographic-mass spectrometric method for the simultaneous assay of estrogens and phytoestrogens in urine. J. Steroid. Biochem. Mol. Biol. 2004, 92, 399–411. [Google Scholar] [CrossRef] [PubMed]
- Xu, X.; Duncan, A.M.; Merz-Demlow, B.E.; Phipps, W.R.; Kurzer, M.S. Menstrual cycle effects on urinary estrogen metabolites. J. Clin. Endocrinol. Metab. 1999, 84, 3914–3918. [Google Scholar] [CrossRef]
- Xu, X.; Veenstra, T.D.; Fox, S.D.; Roman, J.M.; Issaq, H.J.; Falk, R.; Saavedra, J.E.; Keefer, L.K.; Ziegler, R.G. Measuring fifteen endogenous estrogens simultaneously in human urine by high-performance liquid chromatography-mass spectrometry. Anal. Chem. 2005, 77, 6646–6654. [Google Scholar] [CrossRef]
- Xu, X.; Keefer, L.K.; Ziegler, R.G.; Veenstra, T.D. A liquid chromatography-mass spectrometry method for the quantitative analysis of urinary endogenous estrogen metabolites. Nat. Protoc. 2007, 2, 1350–1355. [Google Scholar] [CrossRef]
- Zhou, Y.; Cai, Z. Determination of hormones in human urine by ultra-high-performance liquid chromatography/triple-quadrupole mass spectrometry. Rapid Commun. Mass Spectrom. 2020, 34 (Suppl. 1), e8583. [Google Scholar] [CrossRef] [Green Version]
- Gao, W.; Kirschbaum, C.; Grass, J.; Stalder, T. LC-MS based analysis of endogenous steroid hormones in human hair. J. Steroid. Biochem. Mol. Biol. 2016, 162, 92–99. [Google Scholar] [CrossRef] [PubMed]
- Gao, W.; Stalder, T.; Kirschbaum, C. Quantitative analysis of estradiol and six other steroid hormones in human saliva using a high throughput liquid chromatography-tandem mass spectrometry assay. Talanta 2015, 143, 353–358. [Google Scholar] [CrossRef] [PubMed]
- Wang, Q.; Mesaros, C.; Blair, I.A. Ultra-high sensitivity analysis of estrogens for special populations in serum and plasma by liquid chromatography-mass spectrometry: Assay considerations and suggested practices. J. Steroid. Biochem. Mol. Biol. 2016, 162, 70–79. [Google Scholar] [CrossRef] [PubMed] [Green Version]
- Stanczyk, F.Z.; Clarke, N.J. Measurement of estradiol—Challenges ahead. J. Clin. Endocrinol. Metab. 2014, 99, 56–58. [Google Scholar] [CrossRef] [Green Version]
- Nelson, R.E.; Grebe, S.K.; DJ, O.K.; Singh, R.J. Liquid chromatography-tandem mass spectrometry assay for simultaneous measurement of estradiol and estrone in human plasma. Clin. Chem. 2004, 50, 373–384. [Google Scholar] [CrossRef] [Green Version]
- Honda, L.; Becerra-Herrera, M.; Richter, P. Liquid chromatography-time-of-flight high-resolution mass spectrometry study and determination of the dansylated products of estrogens and their hydroxylated metabolites in water and wastewater. Anal. Bioanal. Chem. 2018, 410, 7909–7919. [Google Scholar] [CrossRef]
- Zhu, H.; Chinthakindi, S.; Kannan, K. A method for the analysis of 121 multi-class environmental chemicals in urine by high-performance liquid chromatography-tandem mass spectrometry. J. Chromatogr. A 2021, 1646, 462146. [Google Scholar] [CrossRef]


| Name | CAS | Q1 (m/z) | Q3 (m/z) | DP (V) | CE (V) | EP (V) | CXP (V) | Dwell (ms) |
|---|---|---|---|---|---|---|---|---|
| Target analytes | ||||||||
| DC-Estrone | 504 | 171 | 125 | 35 | 10 | 15 | 30 | |
| DC-Estradiol | 506 | 171 | 125 | 35 | 10 | 15 | 30 | |
| DC-Estriol | 522 | 171 | 125 | 35 | 10 | 15 | 30 | |
| Testosterone | 58-22-0 | 289 | 97 | 100 | 29 | 10 | 12 | 30 |
| 5α-Dihydrotestosterone | 521-18-6 | 291 | 255 | 100 | 22 | 10 | 14 | 30 |
| Androstenedione | 63-05-8 | 287 | 97 | 172 | 25 | 10 | 14 | 30 |
| Androstenediol | 521-17-5 | 273 | 255 | 93 | 17 | 10 | 8 | 30 |
| DEHA | 53-43-0 | 271 | 253 | 80 | 23 | 10 | 12 | 30 |
| Progesterone | 57-83-0 | 315 | 97 | 130 | 23 | 10 | 10 | 30 |
| Pregnenolone | 145-13-1 | 317 | 299 | 98 | 13 | 10 | 16 | 30 |
| 17α-OH-Progesterone | 68-96-2 | 331 | 109 | 114 | 39 | 10 | 6 | 30 |
| 17α-OH-Pregnenolone | 387-79-1 | 333 | 297 | 80 | 23 | 10 | 18 | 30 |
| Cortisone | 53-06-5 | 361 | 163 | 152 | 31 | 10 | 20 | 30 |
| Cortisol | 50-23-7 | 363 | 121 | 144 | 29 | 10 | 12 | 30 |
| 11-Deoxycortisol | 152-58-9 | 347 | 97 | 161 | 27 | 10 | 10 | 30 |
| 11-Deoxycorticosterone | 64-85-7 | 331 | 97 | 160 | 27 | 10 | 16 | 30 |
| 11-Dehydrocorticosterone | 72-23-1 | 331 | 97 | 168 | 26 | 10 | 11 | 30 |
| Corticosterone | 50-22-6 | 347 | 329 | 100 | 23 | 10 | 18 | 30 |
| Aldosterone | 52-39-1 | 361 | 343 | 120 | 24 | 10 | 12 | 30 |
| Internal standards | ||||||||
| DC-13C3-Estrone | 507 | 171 | 125 | 35 | 10 | 15 | 30 | |
| DC-13C2-Estradiol | 508 | 171 | 125 | 35 | 10 | 15 | 30 | |
| DC-13C3-Estriol | 525 | 171 | 125 | 35 | 10 | 15 | 30 | |
| 13C3-Testosterone | 292 | 100 | 120 | 27 | 10 | 14 | 30 | |
| 13C3-5α-Dihydrotestosterone | 294 | 258 | 130 | 21 | 10 | 12 | 30 | |
| 13C3-Dehydroepiandrosterone | 274 | 256 | 125 | 14 | 10 | 14 | 30 | |
| 13C3-Progesterone | 318 | 100 | 170 | 30 | 10 | 6 | 30 | |
| 13C2-D2-Pregnenolone | 321 | 303 | 110 | 11 | 10 | 22 | 30 | |
| 13C3-17α-OH-Progesterone | 334 | 100 | 138 | 27 | 10 | 12 | 30 | |
| 13C2-D2-17α-OH-Pregnenolone | 319 | 301 | 90 | 15 | 10 | 16 | 30 | |
| 13C3-Cortisol | 366 | 124 | 152 | 30 | 10 | 22 | 30 | |
| 13C3-11-Deoxycortisol | 350 | 112 | 132 | 32 | 10 | 17 | 30 | |
| 13C3-11-Deoxycorticosterone | 334 | 100 | 154 | 27 | 10 | 18 | 30 | |
| D4-Corticosterone | 351 | 333 | 126 | 17 | 10 | 18 | 30 | |
| D4-Aldosterone | 365 | 347 | 100 | 26 | 10 | 24 | 30 | |
| Analytes | R a | LOD (ng/mL) | LOQ (ng/mL) | ME% | 10 ng/mL | 20 ng/mL | 200 ng/mL | ||||||
|---|---|---|---|---|---|---|---|---|---|---|---|---|---|
| Recovery% | CV% | Recovery% | CV% | Recovery% | CV% | ||||||||
| Intra-Day | Inter-Day | Intra-Day | Inter-Day | Intra-Day | Inter-Day | ||||||||
| Estrogen | |||||||||||||
| Estrone | 0.9990 | 0.17 | 0.56 | −6.56 | 111 ± 9 | 8.39 | 3.24 | 114 ± 3 | 2.78 | 2.39 | 105 ± 5 | 4.61 | 0.55 |
| Estradiol | 0.9992 | 0.04 | 0.14 | 0.92 | 93.3 ± 11.5 | 12.4 | 2.84 | 120 ± 10 | 8.67 | 3.10 | 118 ± 11 | 9.05 | 4.08 |
| Estriol | 0.9981 | 0.13 | 0.42 | −2.16 | 110 ± 5 | 4.18 | 9.68 | 109 ± 3 | 3.12 | 6.83 | 99.6 ± 5.3 | 5.31 | 3.65 |
| Androgen | |||||||||||||
| Testosterone | 0.9997 | 0.14 | 0.46 | −0.81 | 113 ± 5 | 4.20 | 0.71 | 119 ± 1 | 0.60 | 1.34 | 115 ± 3 | 2.10 | 1.71 |
| 5α-Dihydrotestosterone | 0.9974 | 0.15 | 0.49 | −2.51 | 82.5 ± 1.3 | 1.50 | 4.17 | 85.0 ± 1.9 | 2.20 | 3.21 | 82.7 ± 2.0 | 2.40 | 0.74 |
| Androstenedione | 0.9994 | 0.22 | 0.73 | 7.30 | 109 ± 13 | 11.7 | 2.39 | 109 ± 11 | 10.4 | 2.17 | 119 ± 7 | 6.20 | 3.68 |
| Androstenediol | 0.9994 | 0.23 | 0.76 | 0.49 | 102 ± 12 | 11.7 | 2.56 | 119 ± 8 | 6.40 | 0.56 | 99.8 ± 4.8 | 4.83 | 0.65 |
| DEHA | 0.9996 | 0.24 | 0.81 | −1.67 | 117 ± 6 | 4.95 | 3.88 | 91.7 ± 0 | 0.00 | 4.27 | 105 ± 8 | 7.45 | 2.58 |
| Progestogen | |||||||||||||
| Progesterone | 0.9990 | 0.15 | 0.50 | −2.65 | 141 ± 11 | 7.50 | 3.93 | 132 ± 8 | 6.30 | 4.45 | 117 ± 8 | 6.60 | 4.77 |
| Pregnenolone | 0.9998 | 0.23 | 0.75 | −2.48 | 106 ± 6 | 6.00 | 1.77 | 111 ± 1 | 0.90 | 2.70 | 110 ± 4 | 3.72 | 2.29 |
| 17α-OH-Progesterone | 0.9997 | 0.21 | 0.70 | 0.75 | 110 ± 1 | 0.60 | 1.49 | 115 ± 13 | 11.2 | 2.31 | 113 ± 4 | 3.30 | 1.69 |
| 17α-OH-Pregnenolone | 0.9998 | 0.12 | 0.41 | −2.45 | 112 ± 4 | 3.10 | 3.86 | 112 ± 1 | 1.10 | 1.00 | 96.8 ± 4.0 | 4.20 | 2.43 |
| Corticosteroid | |||||||||||||
| Cortisone | 0.9985 | 0.13 | 0.44 | 29.6 | 101 ± 12 | 11.5 | 4.53 | 115 ± 8 | 7.08 | 3.41 | 117 ± 4 | 3.47 | 4.25 |
| Cortisol | 0.9998 | 0.20 | 0.65 | −1.74 | 81.7 ± 15.5 | 19.0 | 1.34 | 100 ± 9 | 9.35 | 1.20 | 96.5 ± 4.3 | 4.49 | 3.12 |
| 11-Deoxycortisol | 0.9995 | 0.19 | 0.64 | 5.84 | 112 ± 3 | 2.37 | 2.63 | 116 ± 4 | 3.80 | 4.37 | 106 ± 3 | 2.76 | 1.17 |
| 11-Deoxycorticosterone | 0.9998 | 0.25 | 0.83 | −2.47 | 97.1 ± 9.9 | 10.2 | 1.29 | 99.2 ± 1.4 | 1.45 | 2.42 | 99.9 ± 2.0 | 2.02 | 1.58 |
| 11-Dehydrocorticosterone | 0.9990 | 0.28 | 0.92 | 5.41 | 86.7 ± 5.5 | 6.35 | 2.56 | 90.2 ± 3.2 | 3.56 | 1.82 | 84.1 ± 2.5 | 2.93 | 3.20 |
| Corticosterone | 0.9993 | 0.26 | 0.85 | 5.52 | 107 ± 4 | 3.37 | 2.20 | 101 ± 2 | 1.72 | 1.39 | 101 ± 1.3 | 1.31 | 1.13 |
| Aldosterone | 0.9997 | 0.19 | 0.63 | 4.42 | 95.5 ± 2.6 | 2.77 | 7.16 | 101 ± 10 | 9.47 | 7.59 | 90.0 ± 0.3 | 0.32 | 4.59 |
| Analytes | R a | LOD (ng/mL) | LOQ (ng/mL) | ME% | 10 ng/mL | 20 ng/mL | 200 ng/mL | ||||||
|---|---|---|---|---|---|---|---|---|---|---|---|---|---|
| Recovery% | CV% | Recovery% | CV% | Recovery% | CV% | ||||||||
| Intra-Day | Inter-Day | Intra-Day | Inter-Day | Intra-Day | Inter-Day | ||||||||
| Estrogen | |||||||||||||
| Estrone | 0.9998 | 0.11 | 0.38 | 1.09 | 112 ± 5 | 4.08 | 2.18 | 103 ± 3 | 2.97 | 6.06 | 97.3 ± 3.7 | 3.79 | 0.78 |
| Estradiol | 0.9989 | 0.14 | 0.48 | 0.92 | 88.5 ± 3.8 | 4.33 | 3.17 | 92.3 ± 8.9 | 9.63 | 1.14 | 93.3 ± 1.8 | 3.29 | 2.68 |
| Estriol | 0.9982 | 0.17 | 0.55 | −6.49 | 110 ± 2 | 1.89 | 2.46 | 114 ± 5 | 3.97 | 2.39 | 99.0 ± 3.1 | 3.15 | 1.13 |
| Androgen | |||||||||||||
| Testosterone | 0.9958 | 0.22 | 0.75 | −0.12 | 118 ± 8 | 6.37 | 2.16 | 116 ± 6 | 5.19 | 1.26 | 119 ± 1 | 0.64 | 2.63 |
| 5α-Dihydrotestosterone | 0.9998 | 0.18 | 0.60 | 0.00 | 104 ± 7 | 6.28 | 4.78 | 114 ± 3 | 2.67 | 0.78 | 108 ± 1 | 0.80 | 3.02 |
| Androstenedione | 0.9985 | 0.16 | 0.52 | 18.2 | 114 ± 3 | 2.68 | 4.09 | 117 ± 3 | 2.58 | 1.48 | 110 ± 3 | 2.73 | 2.08 |
| Androstenediol | 0.9985 | 0.24 | 0.81 | 5.34 | 96.1 ± 1.2 | 1.20 | 3.88 | 104 ± 6 | 5.30 | 3.00 | 99.7 ± 1.4 | 1.45 | 2.20 |
| DEHA | 0.9990 | 0.17 | 0.56 | −10.2 | 102 ± 5 | 5.05 | 6.43 | 102 ± 8 | 7.62 | 2.40 | 107 ± 3 | 2.84 | 3.89 |
| Progestogen | |||||||||||||
| Progesterone | 0.9997 | 0.17 | 0.58 | −7.08 | 110 ± 5 | 4.48 | 4.40 | 115 ± 5 | 4.24 | 6.72 | 110 ± 3 | 2.62 | 5.82 |
| Pregnenolone | 0.9992 | 0.35 | 1.18 | −0.62 | 96.6 ± 12.1 | 12.5 | 11.5 | 91.5 ± 1.3 | 1.45 | 8.55 | 100 ± 2 | 2.18 | 1.75 |
| 17α-OH-Progesterone | 0.9994 | 0.13 | 0.42 | 2.99 | 109 ± 6 | 5.36 | 2.95 | 108 ± 2 | 1.84 | 1.42 | 100 ± 1 | 1.00 | 1.00 |
| 17α-OH-Pregnenolone | 0.9974 | 0.24 | 0.80 | −13.9 | 101 ± 3 | 3.04 | 5.80 | 100 ± 7 | 6.60 | 4.14 | 92.8 ± 3.5 | 3.73 | 2.51 |
| Corticosteroid | |||||||||||||
| Cortisone | 0.9990 | 0.25 | 0.84 | 38.7 | 119 ± 9 | 7.33 | 4.33 | 118 ± 8 | 6.58 | 1.04 | 119 ± 5 | 4.21 | 2.61 |
| Cortisol | 0.9981 | 0.24 | 0.79 | −3.48 | 90.0 ± 14.1 | 15.7 | 1.24 | 80.0 ± 17.3 | 21.7 | 0.96 | 94.0 ± 8.8 | 9.32 | 2.06 |
| 11-Deoxycortisol | 0.9997 | 0.17 | 0.58 | 7.22 | 107 ± 3 | 2.46 | 2.55 | 111 ± 2 | 1.88 | 1.99 | 105 ± 3 | 2.72 | 1.91 |
| 11-Deoxycorticosterone | 0.9989 | 0.21 | 0.70 | 0.64 | 97.2 ± 1.6 | 1.68 | 1.01 | 103 ± 4 | 3.67 | 2.22 | 96.0 ± 3.5 | 3.61 | 2.04 |
| 11-Dehydrocorticosterone | 0.9981 | 0.23 | 0.78 | 6.76 | 106 ± 9 | 8.04 | 7.61 | 107 ± 1 | 1.08 | 4.73 | 103 ± 2 | 2.03 | 4.22 |
| Corticosterone | 0.9995 | 0.17 | 0.56 | −11.0 | 94.7 ± 6.4 | 6.71 | 0.16 | 100 ± 4 | 4.36 | 2.66 | 88.7 ± 1.3 | 1.49 | 1.83 |
| Aldosterone | 0.9997 | 0.22 | 0.73 | 9.73 | 102 ± 6 | 5.59 | 1.41 | 106 ± 5 | 4.34 | 4.74 | 98.8 ± 4.7 | 4.70 | 1.11 |
| Analytes | Our Results (ng/mL) | Reference Value (ng/mL) | Variation% |
|---|---|---|---|
| Estrogen | |||
| Estrone | 0.14 | n.a. | -- |
| Estradiol | <LOD | n.a. | -- |
| Estriol | <LOD | n.a. | -- |
| Androgen | |||
| Testosterone | 2.47 | 2.214 | 11 |
| 5α-Dihydrotestosterone | 0.20 | n.a. | -- |
| Androstenedione | 0.74 | n.a. | -- |
| Androstenediol | 0.58 | n.a. | -- |
| DEHA | 1.99 | n.a. | -- |
| Progestogen | |||
| Progesterone | 1.36 | 1.482 | 8.6 |
| Pregnenolone | 0.41 | n.a. | -- |
| 17α-OH-Progesterone | 0.58 | n.a. | -- |
| 17α-OH-Pregnenolone | 0.94 | n.a. | -- |
| Corticosteroid | |||
| Cortisol | 81.4 | 83.9 | 3 |
| Cortisone | 20.9 | n.a. | -- |
| 11-Deoxycortisol | 0.17 | n.a. | -- |
| 11-Deoxycorticosterone | <LOD | n.a. | -- |
| 11-Dehydrocorticosterone | 0.67 | n.a. | -- |
| Corticosterone | 1.57 | n.a. | -- |
| Aldosterone | <LOD | n.a. | -- |
Publisher’s Note: MDPI stays neutral with regard to jurisdictional claims in published maps and institutional affiliations. |
© 2022 by the authors. Licensee MDPI, Basel, Switzerland. This article is an open access article distributed under the terms and conditions of the Creative Commons Attribution (CC BY) license (https://creativecommons.org/licenses/by/4.0/).
Share and Cite
Li, Z.-M.; Kannan, K. Determination of 19 Steroid Hormones in Human Serum and Urine Using Liquid Chromatography-Tandem Mass Spectrometry. Toxics 2022, 10, 687. https://doi.org/10.3390/toxics10110687
Li Z-M, Kannan K. Determination of 19 Steroid Hormones in Human Serum and Urine Using Liquid Chromatography-Tandem Mass Spectrometry. Toxics. 2022; 10(11):687. https://doi.org/10.3390/toxics10110687
Chicago/Turabian StyleLi, Zhong-Min, and Kurunthachalam Kannan. 2022. "Determination of 19 Steroid Hormones in Human Serum and Urine Using Liquid Chromatography-Tandem Mass Spectrometry" Toxics 10, no. 11: 687. https://doi.org/10.3390/toxics10110687