An Update on the Content of Fatty Acids, Dioxins, PCBs and Heavy Metals in Farmed, Escaped and Wild Atlantic Salmon (Salmo salar L.) in Norway

 , and
, and
Abstract
:
1. Introduction
2. Materials and Methods
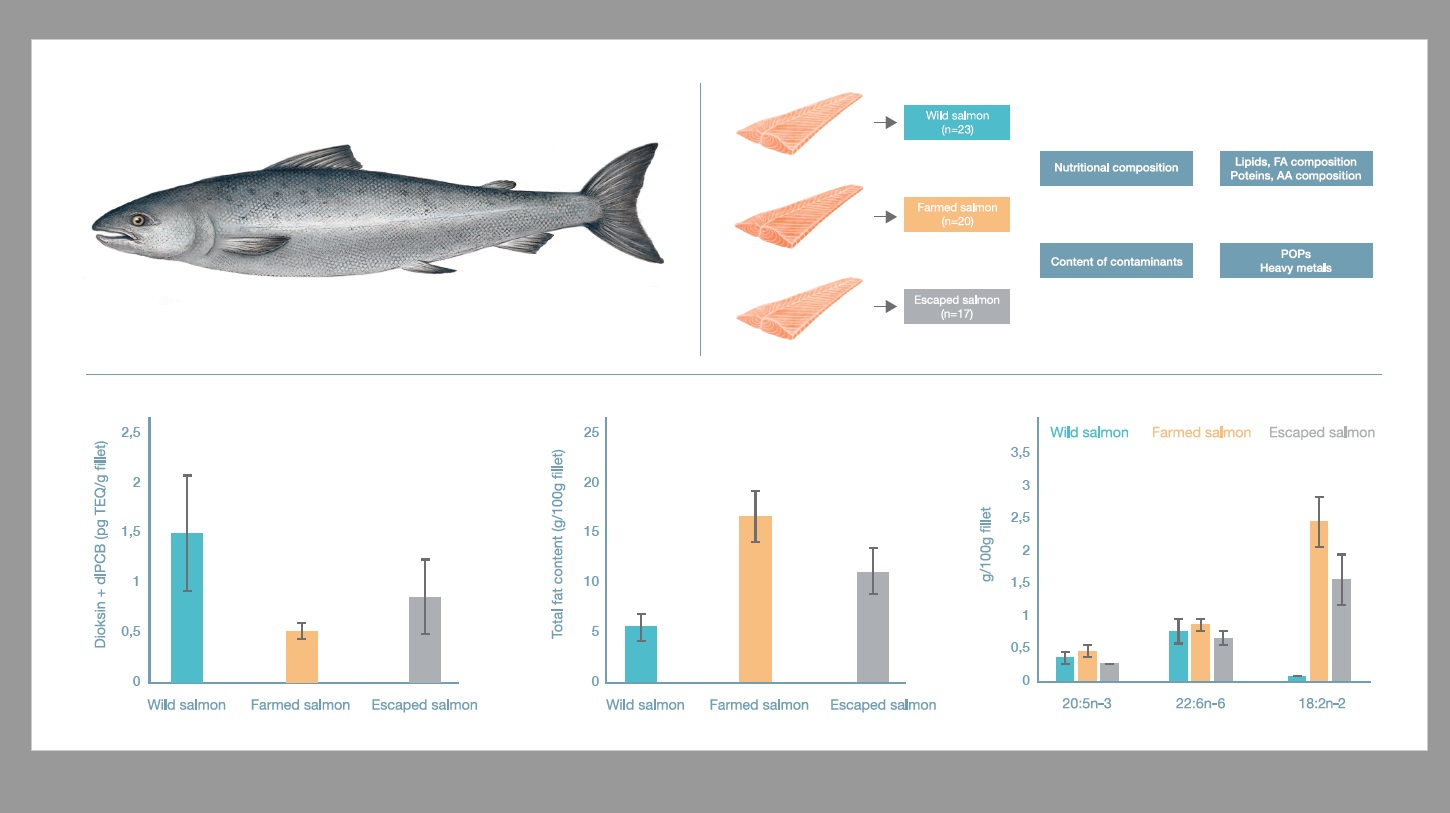
2.1. Fish
2.2. Proximate Composition
2.3. Fatty Acid Composition
2.4. Amino Acid Composition
2.5. Dioxins and Furans, PCBs, and Metals
2.6. Statistics Description
3. Results
3.1. Lipids
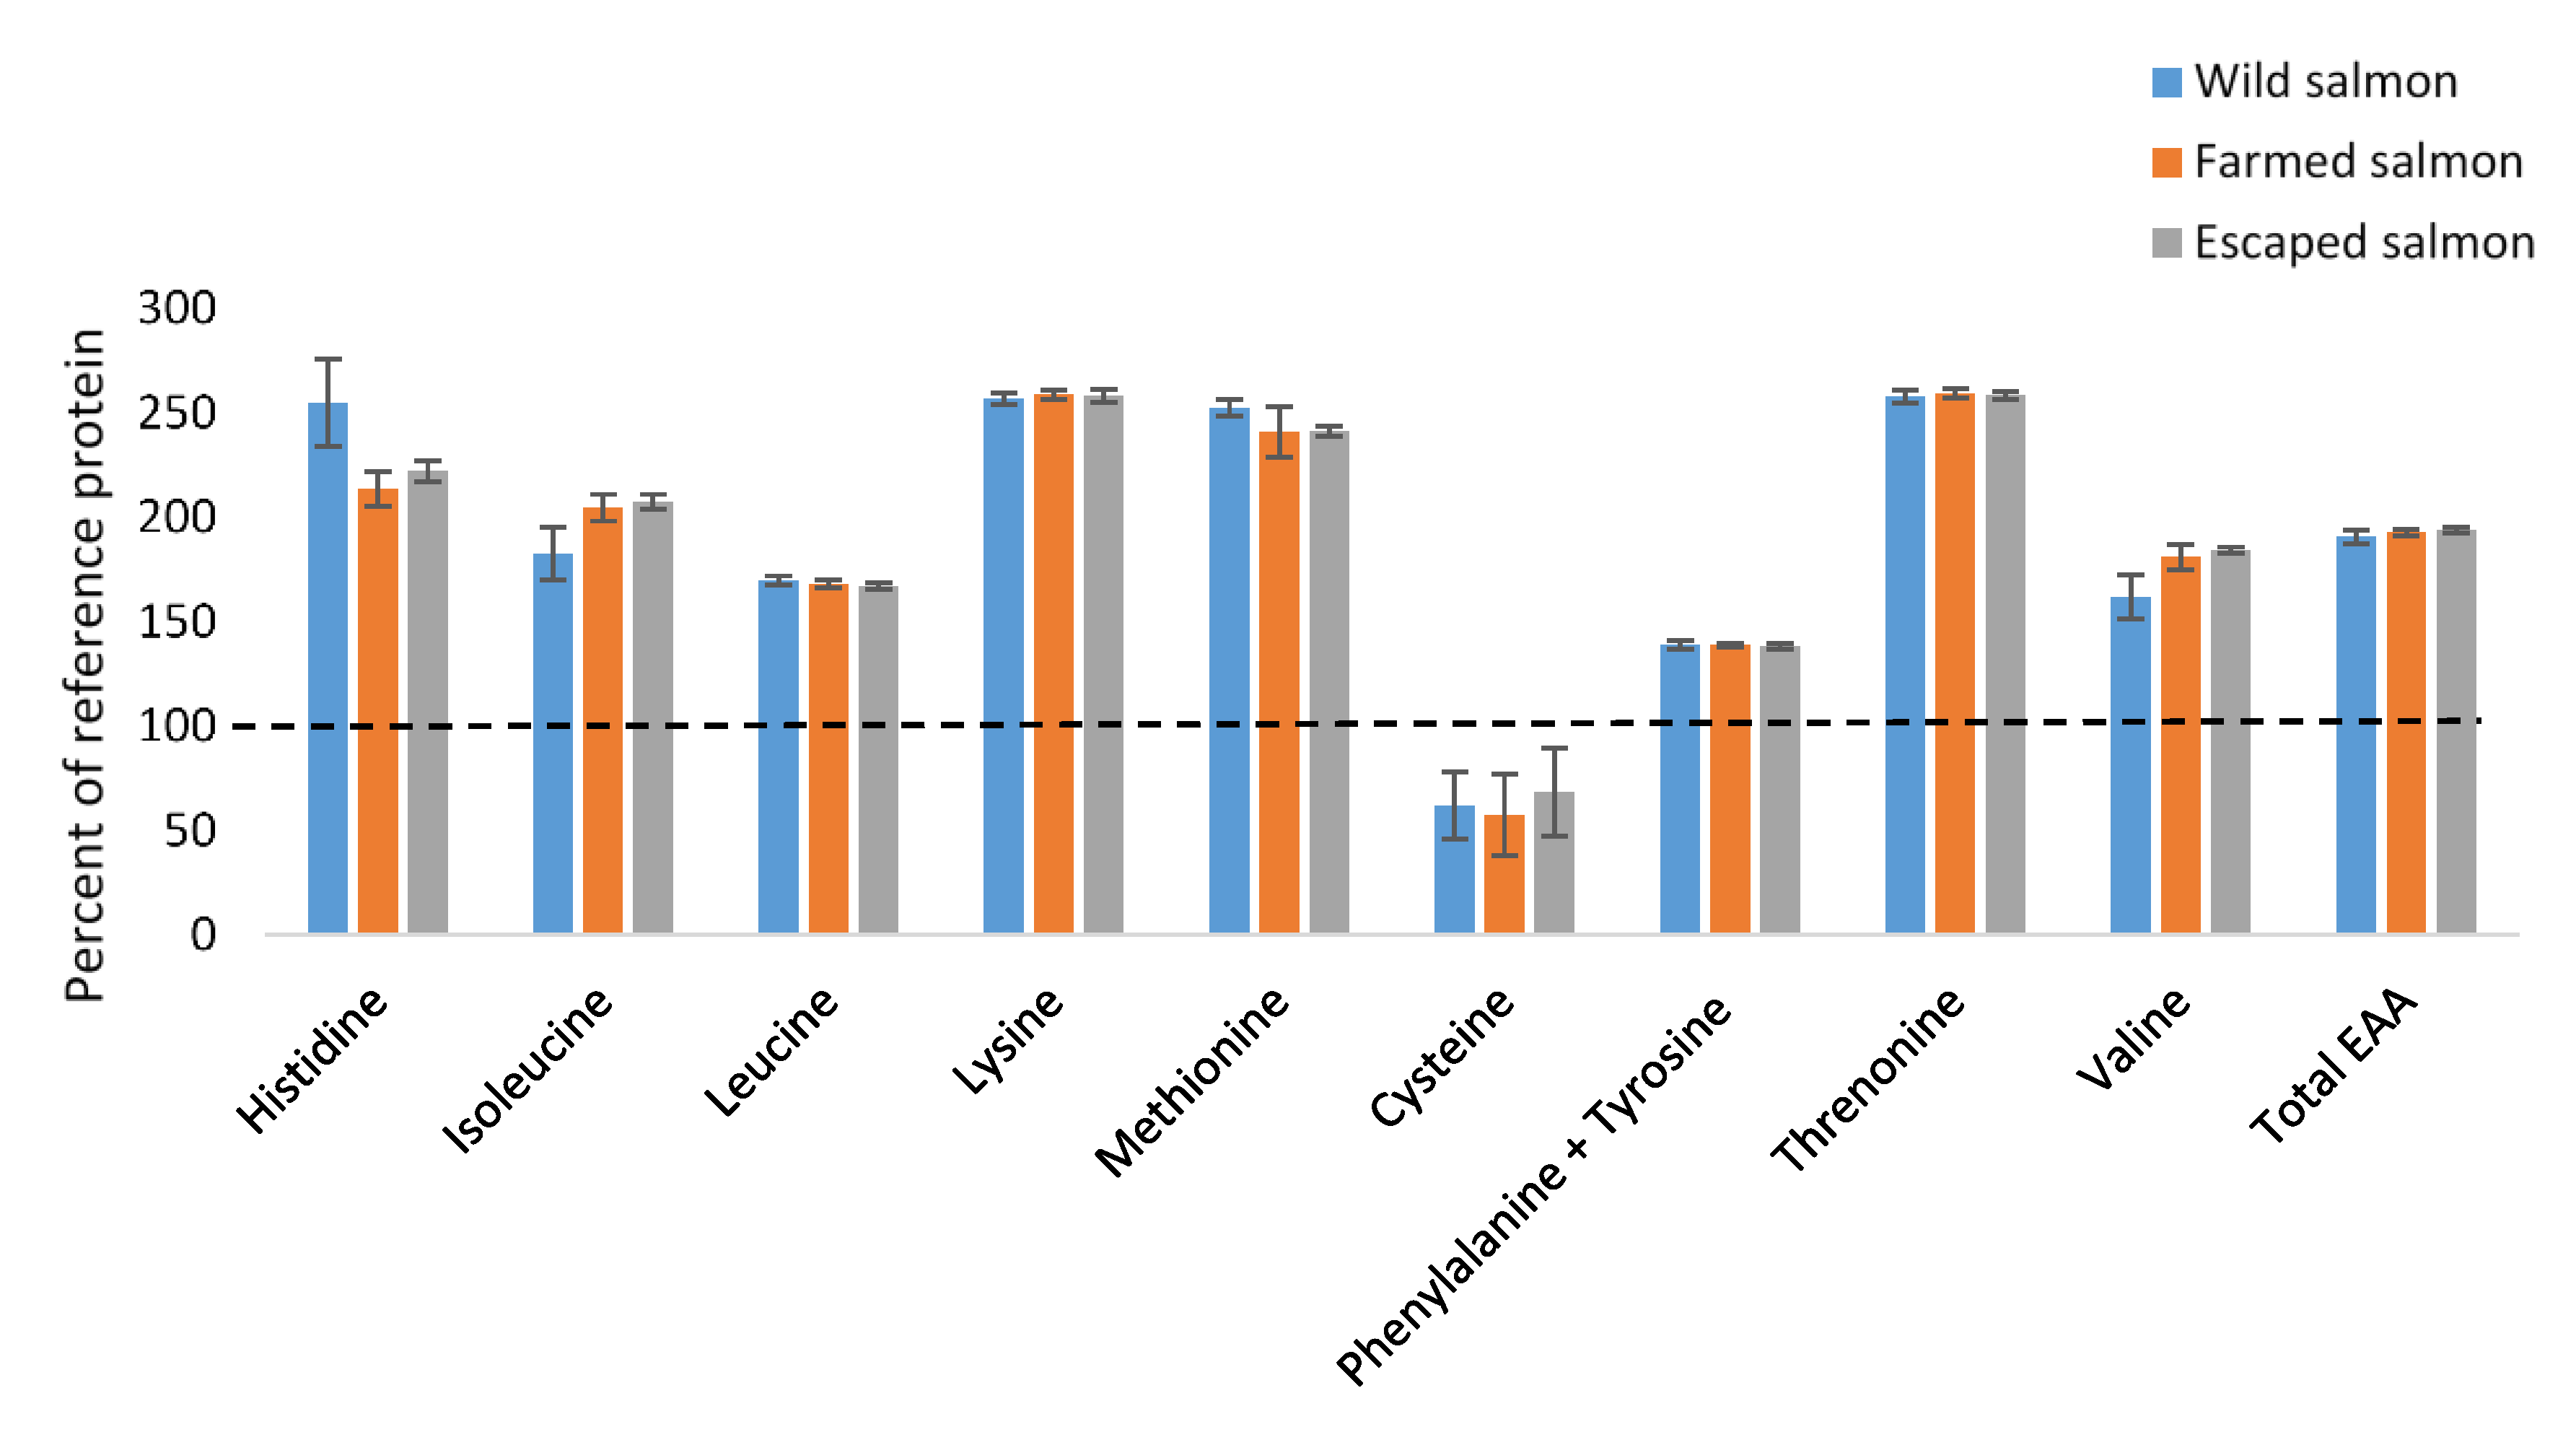
3.2. Amino Acids
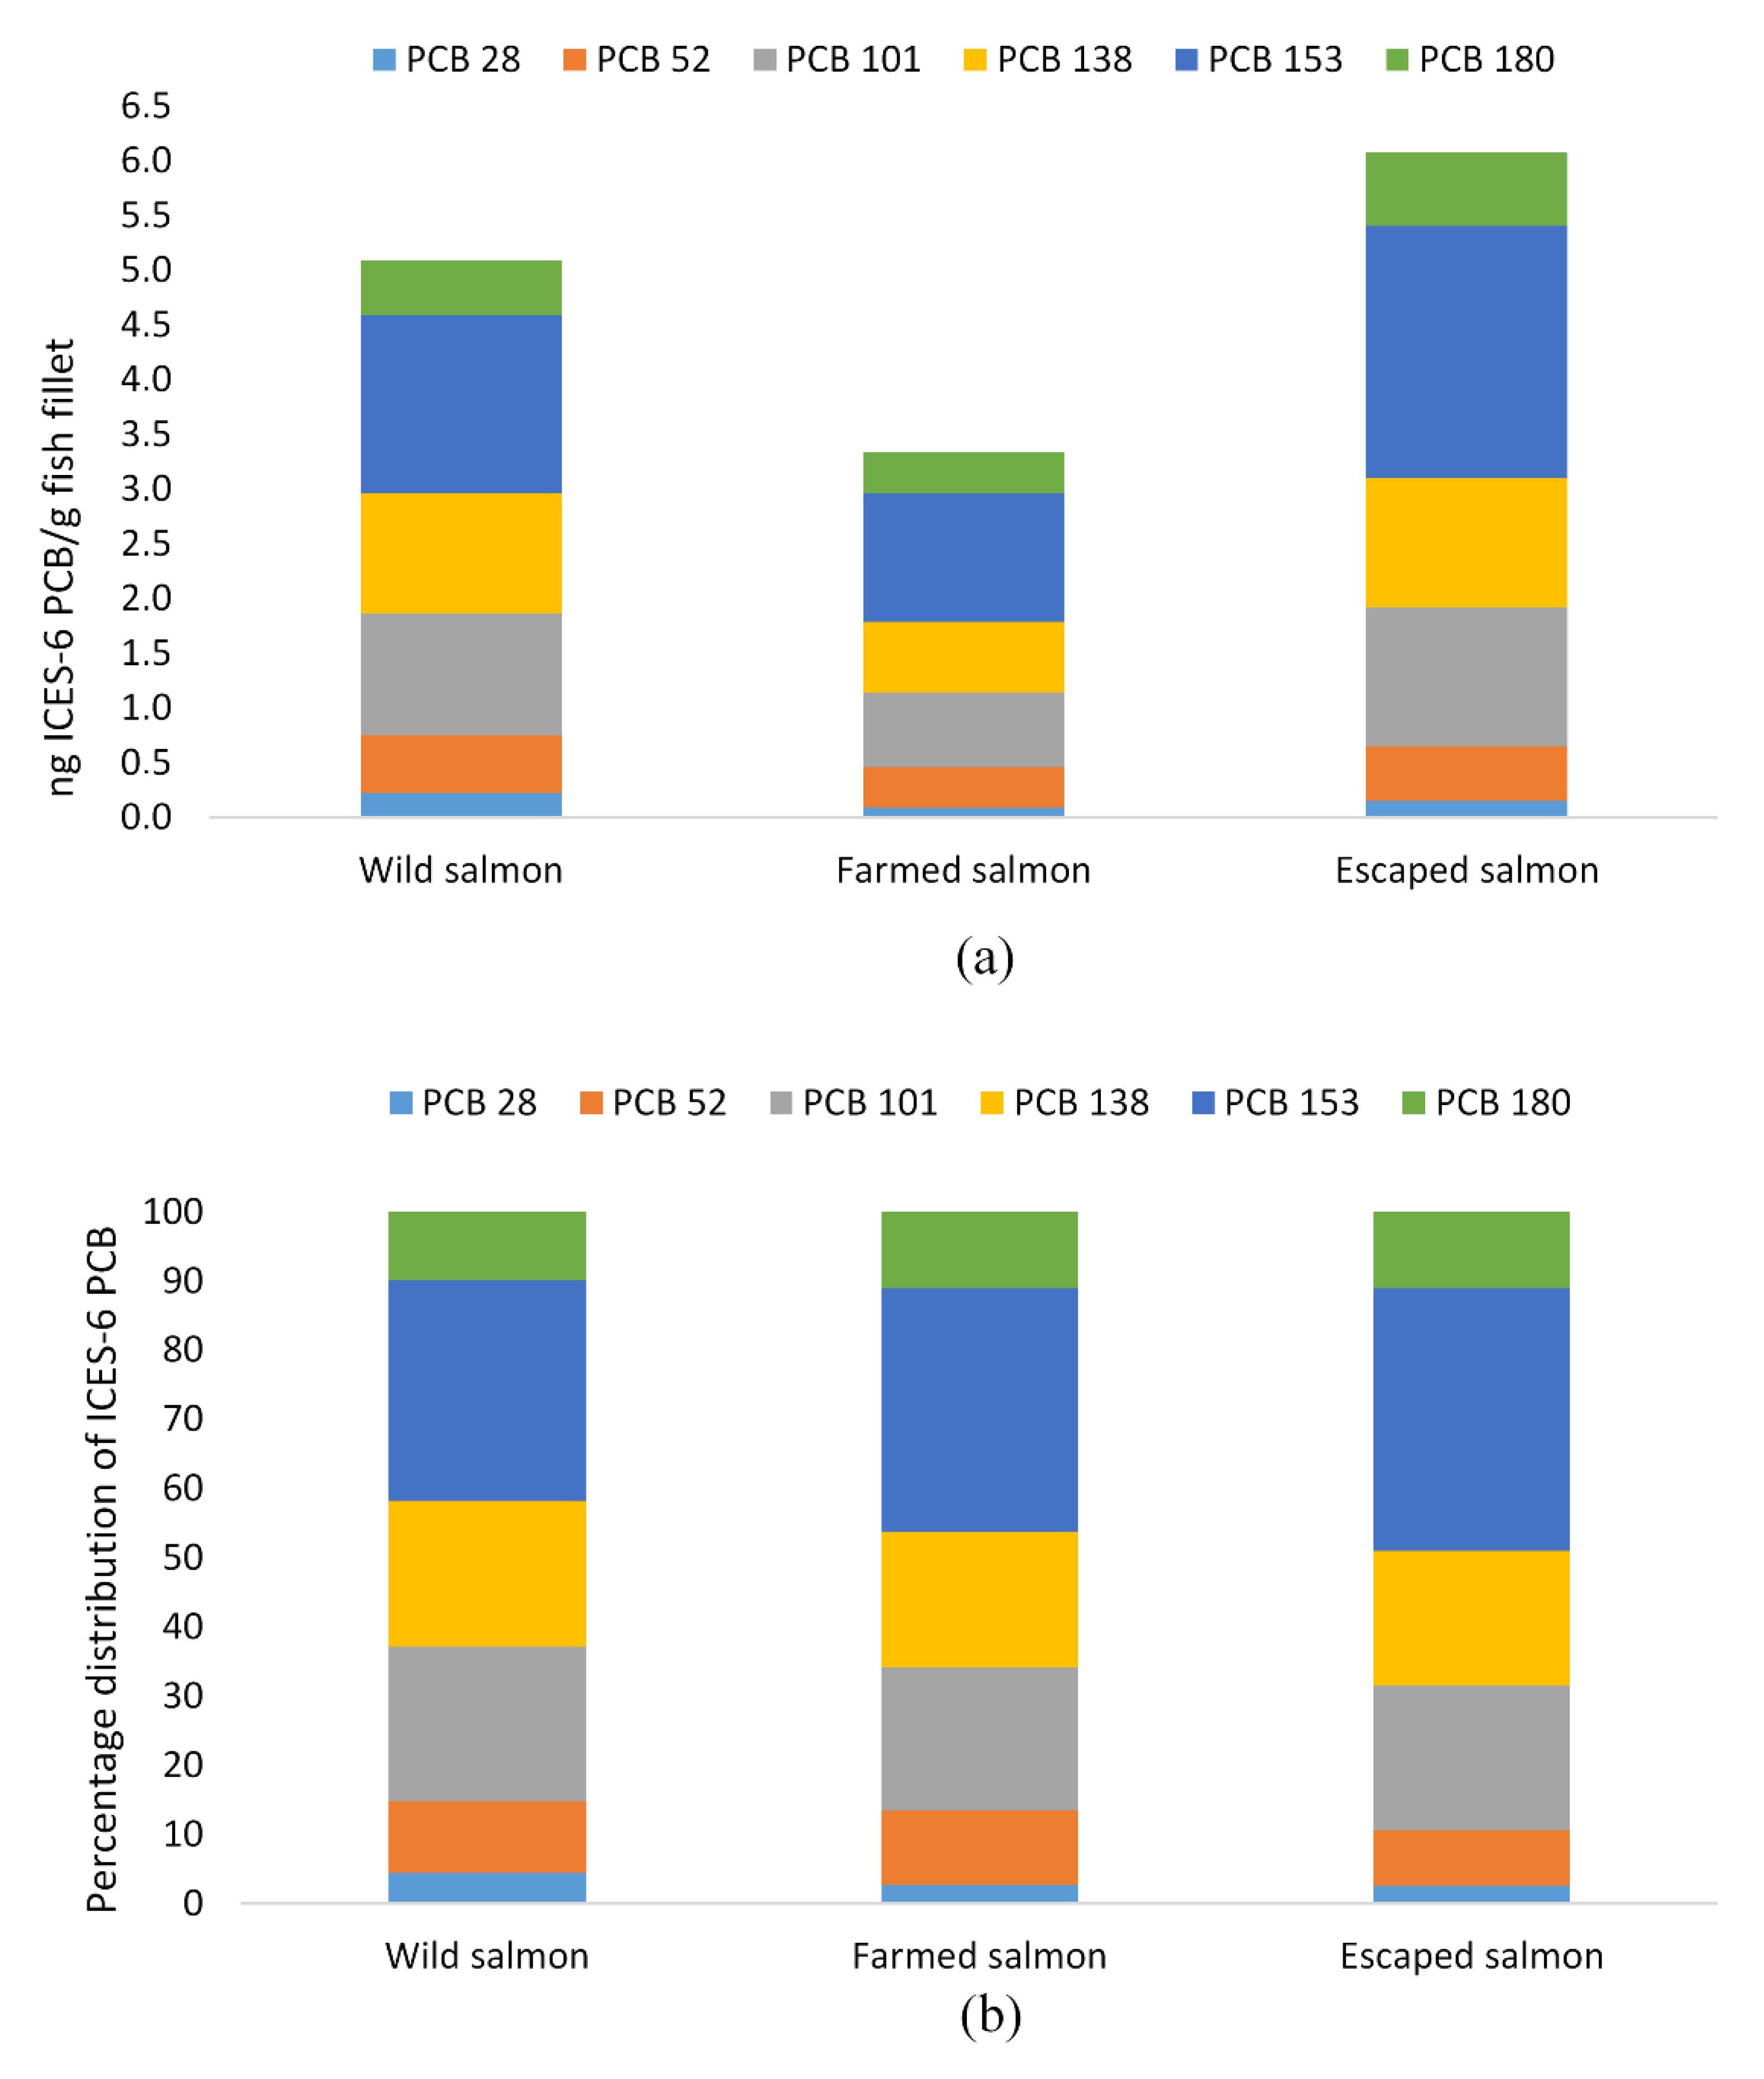
3.3. POPs and Metals
4. Discussion
4.1. Lipid Content
4.2. Fatty Acid Content
4.3. Nutritional Evaluation of Omega-3 Fatty Acids and Essential Amino Acids in Salmon
4.4. Contaminants
4.5. Future Prospects
5. Conclusions
Author Contributions
Funding
Acknowledgments
Conflicts of Interest
References
- Hoegh-Guldberg, O.; Caldeira, K.; Chopin, T.; Gaines, S.; Haugan, P.; Hemer, M.; Howard, J.; Konar, M.; Krause-Jensen, D.; Lindstad, E.; et al. The Ocean as a Solution to Climate Change: Five Opportunities for Action. 2019. Available online: https://www.wri.org/events/2019/10/ocean-solution-climate-change-5-opportunities-action (accessed on 20 September 2020).
- Hilborn, R.; Banobi, J.; Hall, S.J.; Pucylowski, T.; Walsworth, T.E. The environmental cost of animal source foods. Front. Ecol. Environ. 2018, 16, 329–335. [Google Scholar] [CrossRef] [Green Version]
- Chandra, A.; Røsjø, H.; Eide, I.A.; Vigen, T.; Ihle-Hansen, H.; Orstad, E.B.; Rønning, O.M.; Lyngbakken, M.N.; Berge, T.; Schmidt, E.B.; et al. Plasma marine n-3 polyunsaturated fatty acids and cardiovascular risk factors: Data from the ACE 1950 study. Eur. J. Nutr. 2020, 59, 1505–1515. [Google Scholar] [CrossRef] [PubMed]
- Rimm, E.B.; Appel, L.J.; Chiuve, S.E.; Djousse, L.; Engler, M.B.; Kris-Etherton, P.M.; Mozaffarian, D.; Siscovick, D.S.; Lichtenstein, A.H. Seafood long-chain n-3 polyunsaturated fatty acids and cardiovascular disease: A science advisory from the American Heart Association. Circulation 2018, 138, 35–47. [Google Scholar] [CrossRef] [PubMed]
- Afshin, A.; Sur, P.J.; Fay, K.A.; Cornaby, L.; Ferrara, G.; Salama, J.S.; Mullany, E.C.; Abate, K.H.; Abbafati, C.; Abebe, Z.; et al. Health effects of dietary risks in 195 countries, 1990-2017: A systematic analysis for the Global Burden of Disease Study 2017. Lancet 2019, 393, 1958–1972. [Google Scholar] [CrossRef] [Green Version]
- Maehre, H.K.; Jensen, I.J.; Elvevoll, E.O.; Eilertsen, K.E. Omega-3 fatty acids and cardiovascular diseases: Effects, Mechanisms and dietary relevance. Int. J. Mol. Sci. 2015, 16, 22636. [Google Scholar] [CrossRef] [PubMed]
- Innes, J.K.; Calder, P.C. Marine omega-3 (n-3) fatty acids for cardiovascular health: An update for 2020. Int. J. Mol. Sci. 2020, 21, 1362. [Google Scholar] [CrossRef] [Green Version]
- Aung, T.; Halsey, J.; Kromhout, D.; Gerstein, H.C.; Marchioli, R.; Tavazzi, L.; Geleijnse, J.M.; Rauch, B.; Ness, A.; Galan, P.; et al. Associations of omega-3 fatty acid supplement use with cardiovascular disease risks meta-analysis of 10 trials involving 77 917 individuals. JAMA Cardiol. 2018, 3, 225–234. [Google Scholar] [CrossRef] [Green Version]
- Jensen, I.J.; Walquist, M.; Liaset, B.; Elvevoll, E.O.; Eilertsen, K.E. Dietary intake of cod and scallop reduces atherosclerotic burden in female apolipoprotein E-deficient mice fed a Western-type high fat diet for 13 weeks. Nutr. Metab. 2016, 13. [Google Scholar] [CrossRef] [Green Version]
- Food and Agriculture Organization of the United Nations (FAO); World Health Organization (WHO). Report of the Joint FAO/WHO Expert Consultation on the Risks and Benefits of Fish Consumption; FAO: Rome, Italy, 2011. [Google Scholar]
- Malisch, R.; Kotz, A. Dioxins and PCBs in feed and food—Review from European perspective. Sci. Total Environ. 2014, 491, 2–10. [Google Scholar] [CrossRef]
- Larsen, J.C. Risk assessments of polychlorinated dibenzo-p-dioxins, polychlorinated dibenzofurans, and dioxin-like polychlorinated biphenyls in food. Mol. Nutr. Food Res. 2006, 50, 885–896. [Google Scholar] [CrossRef]
- Nogara, P.A.; Farina, M.; Aschner, M.; Rocha, J.B. Mercury in our food. Chem. Res. 2019, 32, 1459–1461. [Google Scholar] [CrossRef] [Green Version]
- United Nations Treaty Collection. 15. Stockholm Convention on Persistent Organic Pollutants. Available online: https://treaties.un.org/Pages/ViewDetails.aspx?src=IND&mtdsg_no=XXVII-15&chapter=27&clang=_en#1 (accessed on 29 November 2020).
- World Health Organization (WHO); Food and Agriculture Organization of the United Nations (FAO). Code of practice for the prevention and reduction of dioxins, dioxin-like PCBs and non-dioxin-like PCBs in food and feed. In Codex Alimentarius Commission; WHO: Geneva, Switzerland; FAO: Rome, Italy, 2018. [Google Scholar]
- Sissener, N.H. Are we what we eat? Changes to the feed fatty acid composition of farmed salmon and its effects through the food chain. J. Exp. Biol. 2018, 221. [Google Scholar] [CrossRef] [PubMed] [Green Version]
- Nostbakken, O.J.; Hove, H.T.; Duinker, A.; Lundebye, A.K.; Berntssen, M.H.G.; Hannisdal, R.; Lunestad, B.T.; Maage, A.; Madsen, L.; Torstensen, B.E.; et al. Contaminant levels in Norwegian farmed Atlantic salmon (Salmo salar) in the 13-year period from 1999 to 2011. Environ. Int. 2015, 74, 274–280. [Google Scholar] [CrossRef] [PubMed] [Green Version]
- Scientific Committee for Food and the Environment (VKM). Benefit-Risk Assessment of Fish and Fish Products in the Norwegian Diet—An Update; Norwegian Scientific Committee for Food Safety: Oslo, Norway, 2014. [Google Scholar]
- EFSA. Risk for animal and human health related to the presence of dioxins and dioxin-like PCBs in feed and food. EFSA J. 2018, 16, e05333. [Google Scholar] [CrossRef] [Green Version]
- Van den Berg, M.; Birnbaum, L.S.; Denison, M.; De Vito, M.; Farland, W.; Feeley, M.; Fiedler, H.; Hakansson, H.; Hanberg, A.; Haws, L.; et al. The 2005 World Health Organization reevaluation of human and mammalian toxic equivalency factors for dioxins and dioxin-like compounds. Toxicol. Sci. 2006, 93, 223–241. [Google Scholar] [CrossRef] [Green Version]
- Iversen, A.; Asche, F.; Hermansen, Ø.; Nystøyl, R. Production cost and competitiveness in major salmon farming countries 2003–2018. Aquaculture 2020, 522, 735089. [Google Scholar] [CrossRef]
- Jensen, I.J.; Maehre, H.K.; Tømmerås, S.; Eilertsen, K.E.; Olsen, R.L.; Elvevoll, E.O. Farmed Atlantic salmon (Salmo salar L.) is a good source of long chain omega-3 fatty acids. Nut. Bull. 2012, 37, 25–29. [Google Scholar] [CrossRef]
- Lund, R.A.; Hansen, L.P. Identification of wild and reared Atlantic salmon, Salmo salar L., using scale characters. Aquac. Fish. Manage 1991, 22, 499–508. [Google Scholar] [CrossRef]
- Fiske, P.; Lund, R.A.; Hansen, L.P. Identifying fish farm escapees. In Stock Identification Methods: Applications in Fishery Science; Cadrin, S.X., Friedland, K.D., Waldman, J.R.E., Eds.; Elsevier: Amsterdam, The Netherlands, 2005; pp. 659–680. [Google Scholar]
- Folch, J.; Lees, M.; Sloane Stanley, G.H. A simple method for the isolation and purification of total lipides from animal tissue. J. Biol. Chem. 1957, 226, 497–509. [Google Scholar]
- Maehre, H.K.; Dalheim, L.; Edvinsen, G.K.; Elvevoll, E.O.; Jensen, I.J. Protein Determination—Method Matters. Foods 2018, 7, 5. [Google Scholar] [CrossRef] [Green Version]
- AOAC International. Official Methods of Analysis of AOAC International, 21 ed.; AOAC International: Rockville, MD, USA, 2019. [Google Scholar]
- Maehre, H.K.; Hamre, K.; Elvevoll, E.O. Nutrient evaluation of rotifers and zooplankton: Feed for marine fish larvae. Aquac. Nutr. 2013, 19, 301–311. [Google Scholar] [CrossRef]
- Stoffel, W.; Chu, F.; Ahrens, E.H. Analysis of long-chain fatty acids by gas-liquid chromatography—Micromethod for preparation of methyl esters. Anal. Chem. 1959, 31, 307–308. [Google Scholar] [CrossRef]
- Moore, S.; Stein, W.H. Chromatographic determination of amino acids by the use of automatic recording equipment. Meth. Enzymol. 1963, 6, 819–831. [Google Scholar]
- U.S. Environmental Protection Agency. Method 1613: Tetra-Through Octa-Chlorinated Dioxins and Furans by Isotope Dilution HRGC/HRMS; U.S. Environmental Protection Agency: Washington, DC, USA, 1994.
- U.S. Environmental Protection Agency. Method 1668C Chlorinated Biphenyl Congeners in Water, Soil, Sediment, Biosolids, and Tissue by HRGC/HRMS; U.S. Environmental Protection Agency: Washington, DC, USA, 1999.
- U.S. Environmental Protection Agency. Method 7473 (SW-846): Mercury in Solids and Solutions by Thermal Decomposition, Amalgamation, and Atomic Absorption Spectrophotometry; Revision 0; U.S. Environmental Protection Agency: Washington, DC, USA, 1998.
- World Health Organization (WHO). Protein and Amino Acid Requirements in Human Nutrition. Report of a Joint WHO/FAO/UNU Expert Consultation; WHO Technical Report Series; WHO: Geneve, Switzerland, 2007. [Google Scholar]
- Forseth, T.; Barlaup, B.T.; Finstad, B.; Fiske, P.; Gjøsæter, H.; Falkegård, M.; Hindar, A.; Mo, T.A.; Rikardsen, A.H.; Thorstad, E.B.; et al. The major threats to Atlantic salmon in Norway. ICES J. Mar. Sci. 2017, 74, 14961513. [Google Scholar] [CrossRef]
- Glover, K.A.; Urdal, K.; Næsje, T.; Skoglund, H.; Florø-Larsen, B.; Otterå, H.; Fiske, P.; Heino, M.; Aronsen, T.; Sægrov, H.; et al. Domesticated escapees on the run: The second-generation monitoring programme reports the numbers and proportions of farmed Atlantic salmon in> 200 Norwegian rivers annually. ICES J. Mar. Sci. 2019, 76, 1151–1161. [Google Scholar] [CrossRef] [Green Version]
- Lundebye, A.K.; Lock, E.J.; Rasinger, J.D.; Nøstbakken, O.J.; Hannisdal, R.; Karlsbakk, E.; Wennevik, V.; Madhun, A.S.; Madsen, L.; Graff, I.E.; et al. Lower levels of persistent organic pollutants, metals and the marine omega 3-fatty acid DHA in farmed compared to wild atlantic salmon (Salmo salar). Environ. Res. 2017, 155, 49–59. [Google Scholar] [CrossRef]
- Skilbrei, O.T.; Normann, E.; Meier, S.; Olsen, R.E. Use of fatty acid profiles to monitor the escape history of farmed Atlantic salmon. Aquac. Environ. Interact. 2015, 7, 1–13. [Google Scholar] [CrossRef] [Green Version]
- Bicskei, B.; Bron, J.E.; Glover, K.A.; Taggart, J.B. A comparison of gene transcription profiles of domesticated and wild Atlantic salmon (Salmo salar L.) at early life stages, reared under controlled conditions. BMC Genom. 2014, 15. [Google Scholar] [CrossRef] [Green Version]
- Aas, T.S.; Ytrestøyl, T.; Åsgård, T. Utilization of feed resources in the production of Atlantic salmon (Salmo salar) in Norway: An update for 2016. Aquac. Rep. 2019, 15, 100216. [Google Scholar] [CrossRef]
- Bell, J.G.; McEvoy, J.; Webster, J.L.; McGhee, F.; Millar, R.M.; Sargent, J.R. Flesh Lipid and Carotenoid Composition of Scottish Farmed Atlantic Salmon (Salmo Salar). J Agric. Food Chem. 1998, 19, 119–127. [Google Scholar] [CrossRef]
- Bendiksen, E.Å.; Johnsen, C.A.; Olsen, H.J.; Jobling, M. Sustainable aquafeeds: Progress towards reduced reliance upon marine ingredients in diets for farmed Atlantic salmon (Salmo salar L.). Aquaculture 2011, 314, 132–139. [Google Scholar] [CrossRef]
- Ytrestøyl, T.; Aas, T.S.; Åsgård, T. Utilisation of feed resources in production of Atlantic salmon (Salmo salar) in Norway. Aquaculture 2015, 448, 365–374. [Google Scholar] [CrossRef] [Green Version]
- Colombo, S.M.; Mazal, X. Investigation of the nutritional composition of different types of salmon available to Canadian consumers. J. Agric. Food Chem. 2020, 2, 100056. [Google Scholar] [CrossRef]
- Tørris, C.; Molin, M.; Småstuen, M.C. Lean fish consumption is associated with beneficial changes in the metabolic syndrome components: A 13-year follow-up study from the Norwegian Tromsø Study. Nutrients 2017, 9, 247. [Google Scholar] [CrossRef] [PubMed] [Green Version]
- Sissener, N.H.; Julshamn, K.; Espe, M.; Lunestad, B.T.; Hemre, G.-I.; Waagbø, R.; Måge, A. Surveillance of selected nutrients, additives and undesirables in commercial Norwegian fish feeds in the years 2000–2010. Aquac. Nutr. 2013, 19, 555–572. [Google Scholar] [CrossRef]
- Friedman, N. Nutritional value of protein from different food sources. J. Agric. Food Chem. 1996, 44, 6–29. [Google Scholar] [CrossRef]
- EFSA. EEFSA sets European Dietary Reference Values for Nutrient Intakes. Available online: https://efsa.onlinelibrary.wiley.com/doi/epdf/10.2903/j.efsa.2010.1461 (accessed on 10 June 2020).
- Simopoulos, A.P. Evolutionary Aspects of the Dietary Omega-6: Omega-3 Fatty Acid Ratio: Medical Implications. World Rev. Nutr. Diet. 2009, 100, 1–21. [Google Scholar]
- European Food Safety Authority (EFSA) Update of the monitoring of levels of dioxins and PCBs in food and feed. EFSA J. 2012, 10, 2832.
- Totland, T.H.; Melnæs, B.K.; Lundberg-Hallén, N.; Helland-Kigen, K.M.; Lund-Blix, N.A.; Myhre, J.B.; Johansen, A.M.W.; Løken, E.B.; Andersen, L.F. Norkost 3. En Landsomfattende Kostholdsundersøkelse Blant Menn og Kvinner i Norge i Alderen 18-70 år. 2010–2011; Helsedirektoratet: Oslo, Norway, 2012.
- Norway, S. Elvefiske. Available online: https://www.ssb.no/jord-skog-jakt-og-fiskeri/statistikker/elvefiske (accessed on 23 September 2020).
- Van Ede, K.I.; Van Duursen, M.B.M.; van den Berg, M. Evaluation of relative effect potencies (REPs) for dioxin-like compounds to derive systemic or human-specific TEFs to improve human risk. Arch. Toxicol. 2016, 90, 1293–1305. [Google Scholar] [CrossRef] [Green Version]
- Horvat, M. Mercury. In Encyclopedia of Analytical Science; Worsfold, P., Townshend, A., Poole, C., Eds.; Elsevier: Amsterdam, The Netherlands, 2005; pp. 545–557. [Google Scholar]
- Commission regulation (EC) No 1881/2006 of 19 December 2006 Setting Maximum Levels for Certain Contaminants in Foodstuffs. 2006. Available online: https://eur-lex.europa.eu/legal-content/EN/ALL/?uri=CELEX%3A32006R1881 (accessed on 29. November 2020).
- Food and Agriculture Organization of the United Nations (FAO). The State of World Fisheries and Aquaculture: Sustainability in Action; FAO: Rome, Italy, 2020. [Google Scholar]
- Alvheim, A.R.; Kjellevold, M.; Strand, E.; Sanden, M.; QWiech, M. Mesopelagic species and their potential contribution to food and feed security—A case study from Norway. Foods 2020, 9, 344. [Google Scholar] [CrossRef] [Green Version]


| Parameter | Wild Salmon | Farmed Salmon | Escaped Salmon |
|---|---|---|---|
| Gutted weight (g) | 4280 ± 1083 a | 4340 ± 264 a | 3588 ± 239 b |
| Length (cm) 2 | 78.3 ± 7.3 a | 71.5 ± 2.2 ab | 70.4 ± 2.1 b |
| Fillet yield (%) 1 | 61.4 ± 2.4 | 60.5 ± 1.7 | 60.9 ± 2.8 |
| Condition factor | 0.9 ± 0.1 c | 1.2 ± 0.1 a | 1.0 ± 0.1 b |
| Parameter | Wild Salmon | Farmed Salmon | Escaped Salmon |
|---|---|---|---|
| Water | 69.6 ± 2.4 a | 61.4 ± 1.6 c | 66.5 ± 1.7 b |
| Ash | 1.2 ± 0.1 a | 1.1 ± 0.1 b | 1.2 ± 0.0 ab |
| Fat | 6.0 ± 1.5 c | 17.9 ± 2.8 a | 12.0 ± 2.4 b |
| Protein | 16.2 ± 1.4 a | 15.4 ± 1.0 b | 15.8 ± 0.6 ab |
| Fatty Acid | Wild Salmon | Farmed Salmon | Escaped Salmon | |||
|---|---|---|---|---|---|---|
| Composition (%) | Amount (g/100 g) | Composition (%) | Amount (g/100 g) | Composition (%) | Amount (g/100 g) | |
| 14:0 | 4.57 ± 0.81 a | 0.3 ± 0.1 a | 1.89 ± 0.06 b | 0.3 ± 0.1 b | 2.1 ± 0.4 c | 0.3 ± 0 a |
| 16:0 | 13.42 ± 0.92 a | 0.8 ± 0.2 a | 10.13 ± 0.37 b | 1.8 ± 0.3 b | 9.5 ± 1 c | 1.2 ± 0.2 c |
| 16:1n-7 | 4.77 ± 0.7 a | 0.3 ± 0.1 a | 2.2 ± 0.11 b | 0.4 ± 0.1 b | 2.5 ± 0.6 b | 0.3 ± 0 a |
| 18:0 | 2.85 ± 0.46 | 0.2 ± 0 a | 3.03 ± 0.13 | 0.5 ± 0.1 b | 2.6 ± 0.2 c | 0.3 ± 0.1 c |
| 18:1n-9 | 13.34 ± 1.64 a | 0.8 ± 0.2 a | 32.4 ± 0.56 b | 5.6 ± 1.1 b | 39.7 ± 4.8 c | 5 ± 1.2 b |
| 18:1n-7 | 3.02 ± 0.53 a | 0.2 ± 0.1 a | 2.53 ± 0.05 b | 0.5 ± 0.2 b | 3 ± 0.1 a | 0.4 ± 0.1 c |
| 18:2n-6 (LA) | 1.35 ± 0.24 a | 0.1 ± 0 a | 14.38 ± 0.29 b | 2.5 ± 0.4 b | 12.8 ± 2.1 c | 1.6 ± 0.4 c |
| 18:3n-3 (ALA) | 1.0 ± 0.2 a | 0.1 ± 0 a | 10.34 ± 0.37 b | 1.8 ± 0.3 b | 5.1 ± 0.9 c | 0.6 ± 0.2 c |
| 18:4n-3 (SDA) | 3.13 ± 0.45 a | 0.2 ± 0.1 a | 0.81 ± 0.34 b | 0.1 ± 0.0 b | 1 ± 0.2 b | 0.1 ± 0 c |
| 20:1n-9 | 11.17 ± 1.14 a | 0.6 ± 0.2 a | 4.76 ± 1.69 b | 1.0 ± 0.1 b | 4.3 ± 1.1 b | 0.5 ± 0.1 c |
| 20:2n-6 | n.d | n.d | 1.69 ± 0.13 a | 0.3 ± 0.0 a | 1.3 ± 0.2 b | 0.2 ± 0 b |
| 20:4n-3 | n.d | n.d | 1.21 ± 0.12 a | 0.2 ± 0.0 a | 0.5 ± 0.1 b | 0.0 ± 0.0 b |
| 22:1n-11 | 11.99 ± 1.8 a | 0.7 ± 0.2 a | 1.23 ± 0.09 b | 0.2 ± 0.0 b | 2.5 ± 1.1 c | 0.3 ± 0 c |
| 22:1n-9 | 2.74 ± 0.24 a | 0.2 ± 0 a | 1.71 ± 0.07 b | 0.3 ± 0.1 b | 1.5 ± 0.2 b | 0.2 ± 0 c |
| 20:5n-3 (EPA) | 6.58 ± 0.76 a | 0.4 ± 0.1 a | 2.64 ± 0.1 b | 0.5 ± 0.1 b | 2.6 ± 0.9 | 0.3 ± 0 c |
| 24:1n-9 | 0.95 ± 0.07 | 0.1 ± 0 | n.d | n.d | n.d | n.d |
| 22:5n-3 (DPA) | 3 ± 0.36 a | 0.2 ± 0 a | 1.37 ± 0.14 b | 0.2 ± 0.0 b | 1.4 ± 0.3 b | 0.2 ± 0 a |
| 22:6n-3 (DHA) | 14.56 ± 1.34 a | 0.8 ± 0.2 a | 4.94 ± 0.23 b | 0.9 ± 0.1 a | 5.6 ± 2.1 b | 0.7 ± 0.1 c |
| SFA | 20.84 ± 1.14 a | 1.2 ± 0.4 a | 15.05 ± 0.51 b | 2.7 ± 0.4 b | 14.2 ± 1.5 c | 1.7 ± 0.3 c |
| MUFA | 46.56 ± 3.81 a | 2.6 ± 0.8 a | 40.84 ± 0.7 b | 7.2 ± 1.2 b | 50.6 ± 1.0 c | 6.3 ± 1.3 c |
| PUFA | 30.95 ± 3.35 a | 1.7 ± 0.5 a | 41.93 ± 1.07 b | 7.4 ± 1.1 b | 32.8 ± 0.9 c | 4 ± 0.8 c |
| LC-PUFA n-3 | 24.13 ± 1.55 a | 1.4 ± 0.4 a | 8.94 ± 0.5 b | 4.3 ± 0.6 b | 10.0 ± 3.2 c | 1.2 ± 0.1 c |
| n-6/n-3 | 0.05 ± 0.01 a | - | 0.7 ± 0.01 b | - | 0.8 ± 0.2 b | - |
| Amino Acid | Wild Salmon | Farmed Salmon | Escaped Salmon |
|---|---|---|---|
| Histidine | 6.2 ± 0.7 a | 5.1 ± 0.3 b | 5.1 ± 0.3 b |
| Threonine | 9.6 ± 0.8 a | 9.2 ± 0.6 b | 9.4 ± 0.4 ab |
| Isoleucine | 8.8 ± 1.1 b | 9.5 ± 0.6 a | 9.7 ± 0.5 a |
| Leucine | 16.2 ± 1.3 a | 15.1 ± 1.0 b | 15.7 ± 0.6 ab |
| Valine | 10.2 ± 1.3 b | 11.0 ± 0.7 a | 11.1 ± 0.6 a |
| Lysine | 18.7 ± 1.6 a | 17.8 ± 1.2 b | 18.4 ± 0.7 ab |
| Methionine | 6.5 ± 0.5 a | 5.9 ±0.4 b | 6.1 ± 0.4 b |
| Phenylalanine | 8.6 ± 0.7 a | 8.1 ± 0.5 b | 8.3 ± 0.3 ab |
| ∑ Essential amino acids | 84.9 ± 7.6 a | 81.7 ± 5.5 a | 83.9 ± 3.2 a |
| Arginine | 11.5 ± 1.7 ab | 11.4 ± 0.7 b | 11.8 ± 0.5 a |
| Alanine | 13.5 ±1.2 a | 11.7 ± 0.8 b | 12.31 ± 0.7 b |
| Aspartic acid | 15.3 ± 1.3 a | 14.8 ± 1.0 a | 15.3 ± 0.6 a |
| Hydroxyproline | 0.2 ± 0.2 b | 0.4 ± 0.0 a | 0.4 ± 0.2 a |
| Beta alanine | 2.1 ± 0.2 a | 2.1 ± 0.2 a | 1.9 ± 0.2 b |
| Cysteine | 0.6 ± 0.2 a | 0.6 ± 0.2 a | 0.6 ± 0.2 a |
| Glycine | 10.6 ± 1.1 a | 9.5 ± 0.6 b | 9.9 ± 0.6 b |
| Glutamic acid | 29.3 ± 2.6 a | 27.5 ± 1.9 b | 28.7 ± 1.1 ab |
| Proline | 7.5 ± 0.7 a | 7.3 ± 0.6 a | 7.2 ± 0.4 a |
| Serine | 8.1 ± 0.7 a | 7.5 ± 0.5 b | 7.7 ± 0.3 ab |
| Tyrosine | 7.5 ± 1.1 a | 6.8 ± 0.5 b | 7.0 ± 0.5 ab |
| Taurine | 0.6 ± 0.1 a | 0.5 ± 0.1 b | 0.6 ± 0.7 a |
| Compound | Wild Salmon | Farmed Salmon | Escaped Salmon |
|---|---|---|---|
| Sum dl-PCB (pg TEQ/g) | 0.95 ± 0.48 a | 0.17 ± 0.07 c | 0.44 ± 0.3 b |
| Dioxins-furans (pg TEQ/g) | 0.53 ± 0.12 a | 0.34 ± 0.04 b | 0.41 ± 0.11 b |
| Dioxins + dl-PCB (pg TEQ/g) | 1.48 ± 0.57 a | 0.51 ± 0.08 b | 0.85 ± 0.37 a |
| Sum ICES-6 PCB (ng/g) | 5.09 ± 0.83 a | 3.34 ± 0.46 c | 6.08 ± 0.45 b |
| Mercury (µg/kg) | 56.3 ± 12.9 a | 18.1 ± 1.5 c | 34.9 ± 3.1 b |
| Lead (mg/kg) | 0.01 ± 0.0 | 0.01 ± 0.0 | 0.01 ± 0.0 |
| Cadmium (mg/kg) | 0.01 ± 0.0 | 0.01 ± 0.0 | 0.01 ± 0.0 |
| Arsenic (mg/kg) | 2.56 ± 0.87 a | 0.86 ± 0.1 c | 1.68 ± 019 b |
Publisher’s Note: MDPI stays neutral with regard to jurisdictional claims in published maps and institutional affiliations. |
© 2020 by the authors. Licensee MDPI, Basel, Switzerland. This article is an open access article distributed under the terms and conditions of the Creative Commons Attribution (CC BY) license (http://creativecommons.org/licenses/by/4.0/).
Share and Cite
Jensen, I.-J.; Eilertsen, K.-E.; Otnæs, C.H.A.; Mæhre, H.K.; Elvevoll, E.O. An Update on the Content of Fatty Acids, Dioxins, PCBs and Heavy Metals in Farmed, Escaped and Wild Atlantic Salmon (Salmo salar L.) in Norway. Foods 2020, 9, 1901. https://doi.org/10.3390/foods9121901
Jensen I-J, Eilertsen K-E, Otnæs CHA, Mæhre HK, Elvevoll EO. An Update on the Content of Fatty Acids, Dioxins, PCBs and Heavy Metals in Farmed, Escaped and Wild Atlantic Salmon (Salmo salar L.) in Norway. Foods. 2020; 9(12):1901. https://doi.org/10.3390/foods9121901
Chicago/Turabian StyleJensen, Ida-Johanne, Karl-Erik Eilertsen, Carina Helen Almli Otnæs, Hanne K. Mæhre, and Edel Oddny Elvevoll. 2020. "An Update on the Content of Fatty Acids, Dioxins, PCBs and Heavy Metals in Farmed, Escaped and Wild Atlantic Salmon (Salmo salar L.) in Norway" Foods 9, no. 12: 1901. https://doi.org/10.3390/foods9121901