Validation of a MS Based Proteomics Method for Milk and Egg Quantification in Cookies at the Lowest VITAL Levels: An Alternative to the Use of Precautionary Labeling

 ,
,  , , and
Abstract
:
1. Introduction
2. Materials and Methods
2.1. Chemicals and Materials
2.2. Synthetic Peptides Standard Solutions
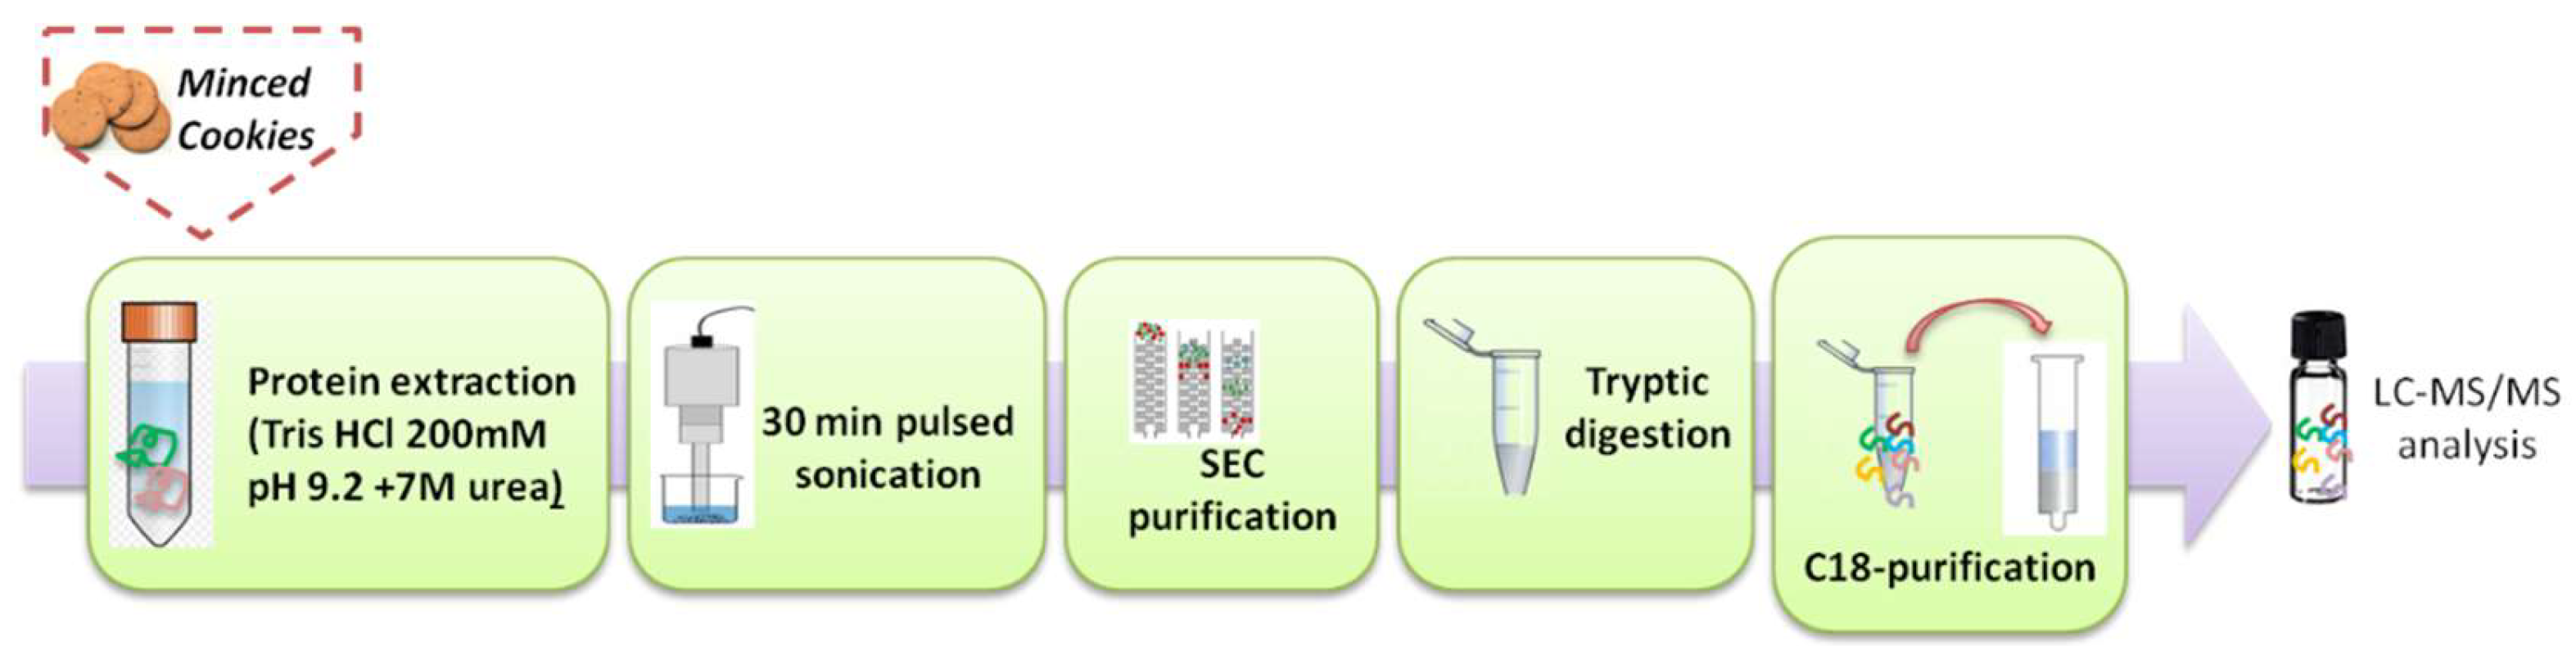
2.3. Sample Preparation Protocol
2.4. Liquid Chromatography–Multiple Reaction Monitoring Analysis
2.5. Performance Evaluation for In-House Method Validation
2.5.1. Sensitivity
2.5.2. Precision
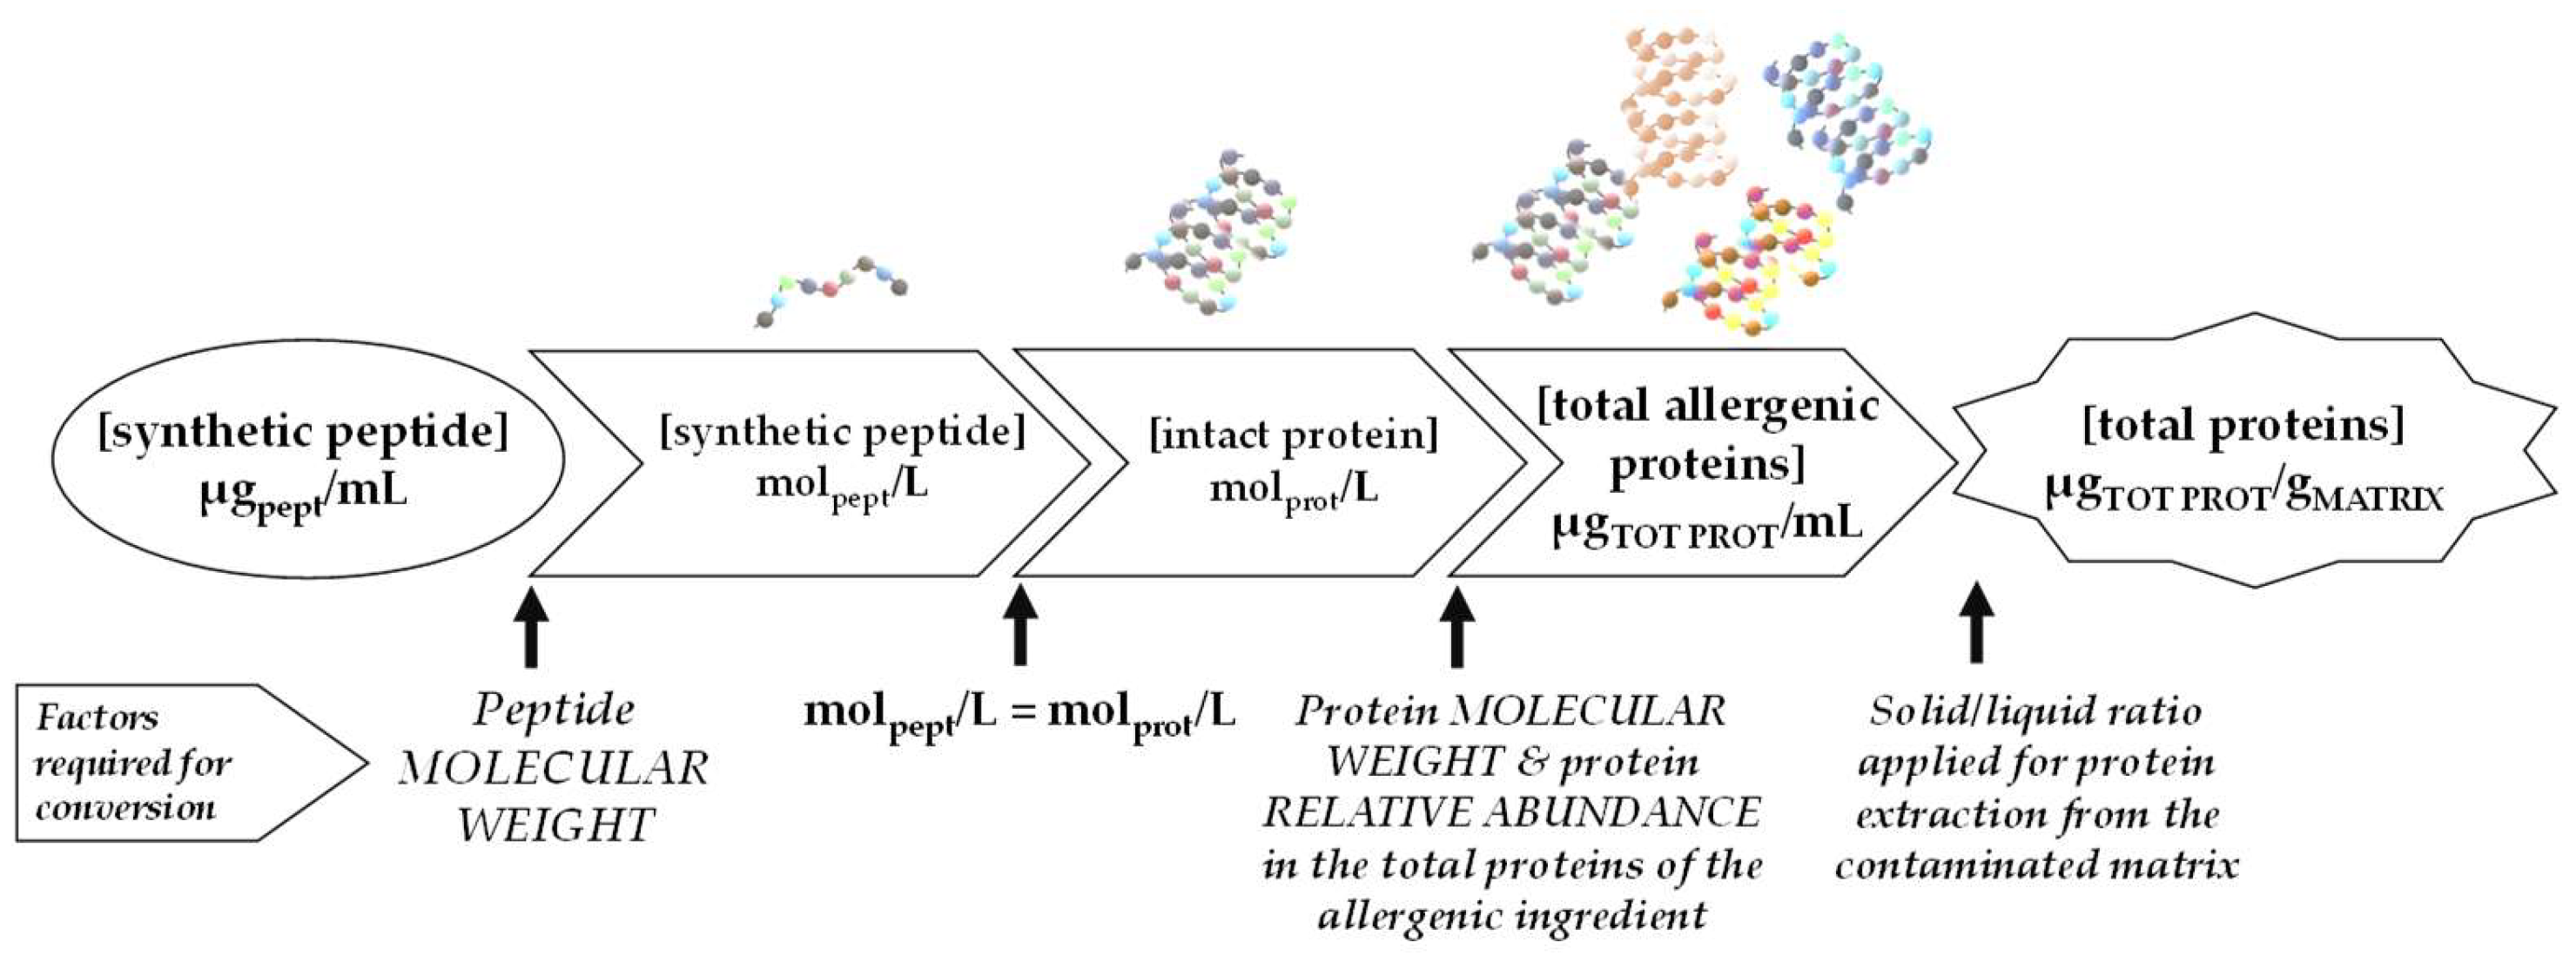
2.5.3. Trueness
3. Results and Discussion
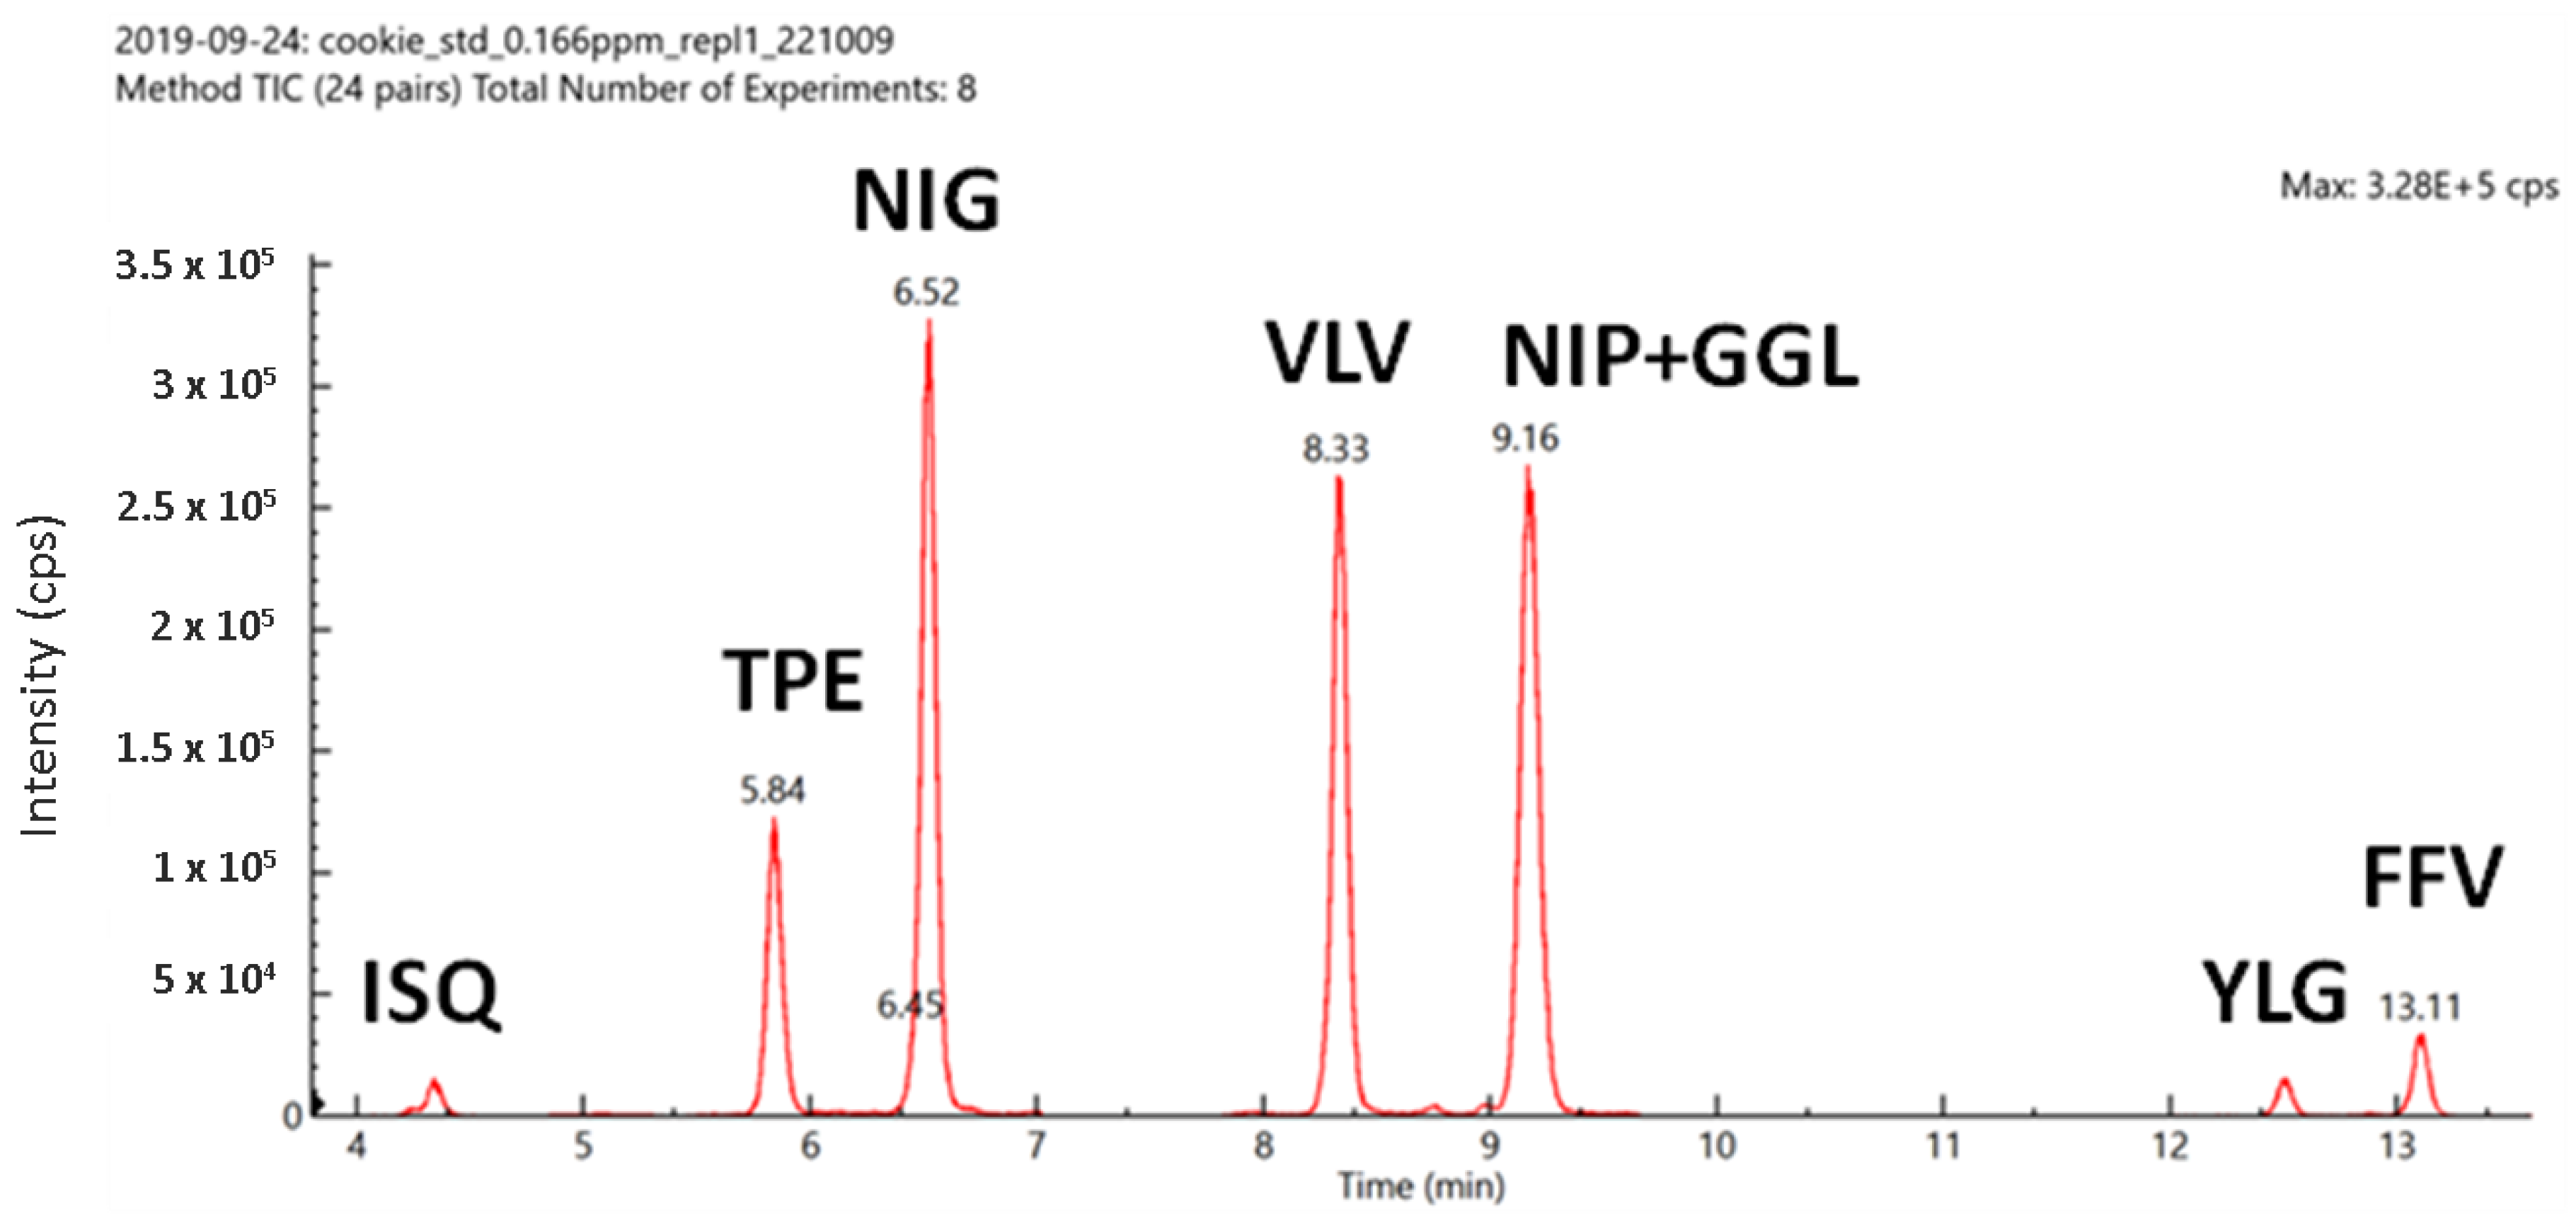
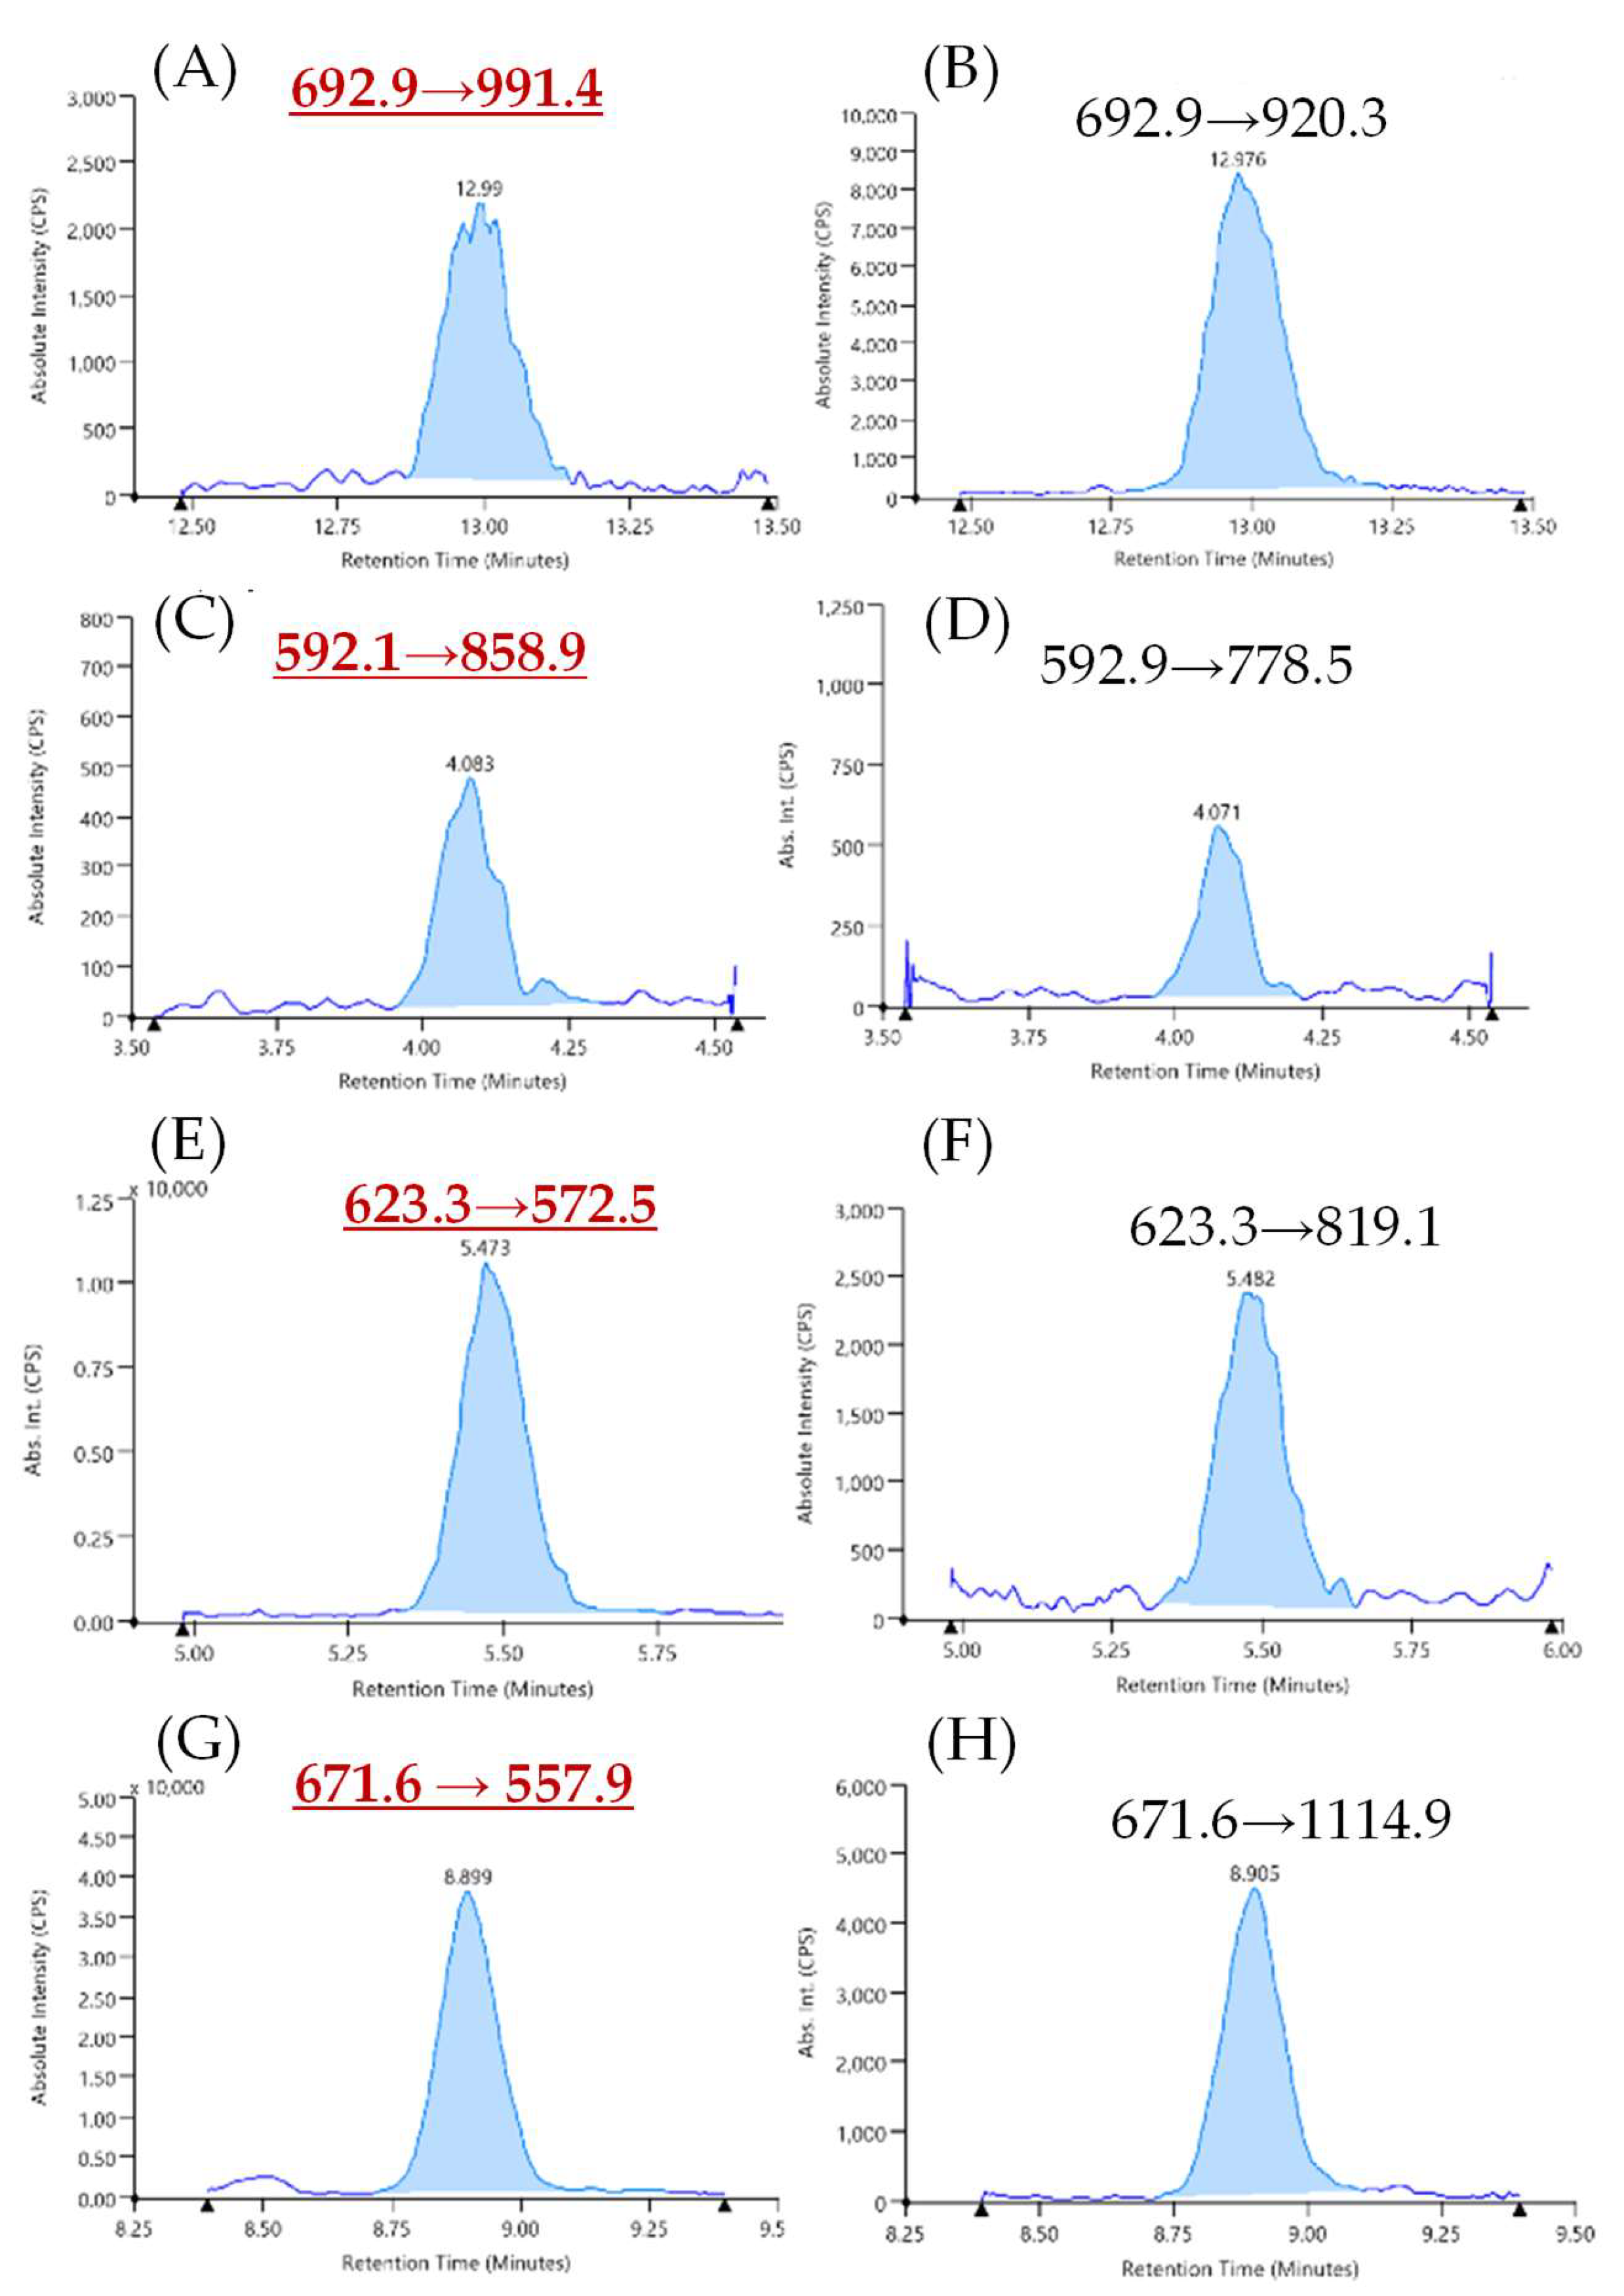
3.1. Optimization of LC–MS Instrumental Conditions
3.2. Sensitivity and Matrix Effect
3.3. Sensitivity of the Method in Incurred Cookies and Compliance with the VITAL Reference Doses
3.4. Precision
3.5. Evaluation of Processing Effect on Method Sensitivity
3.6. Trueness
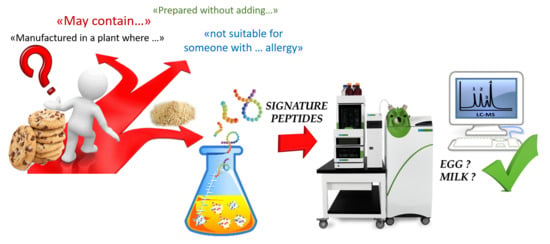
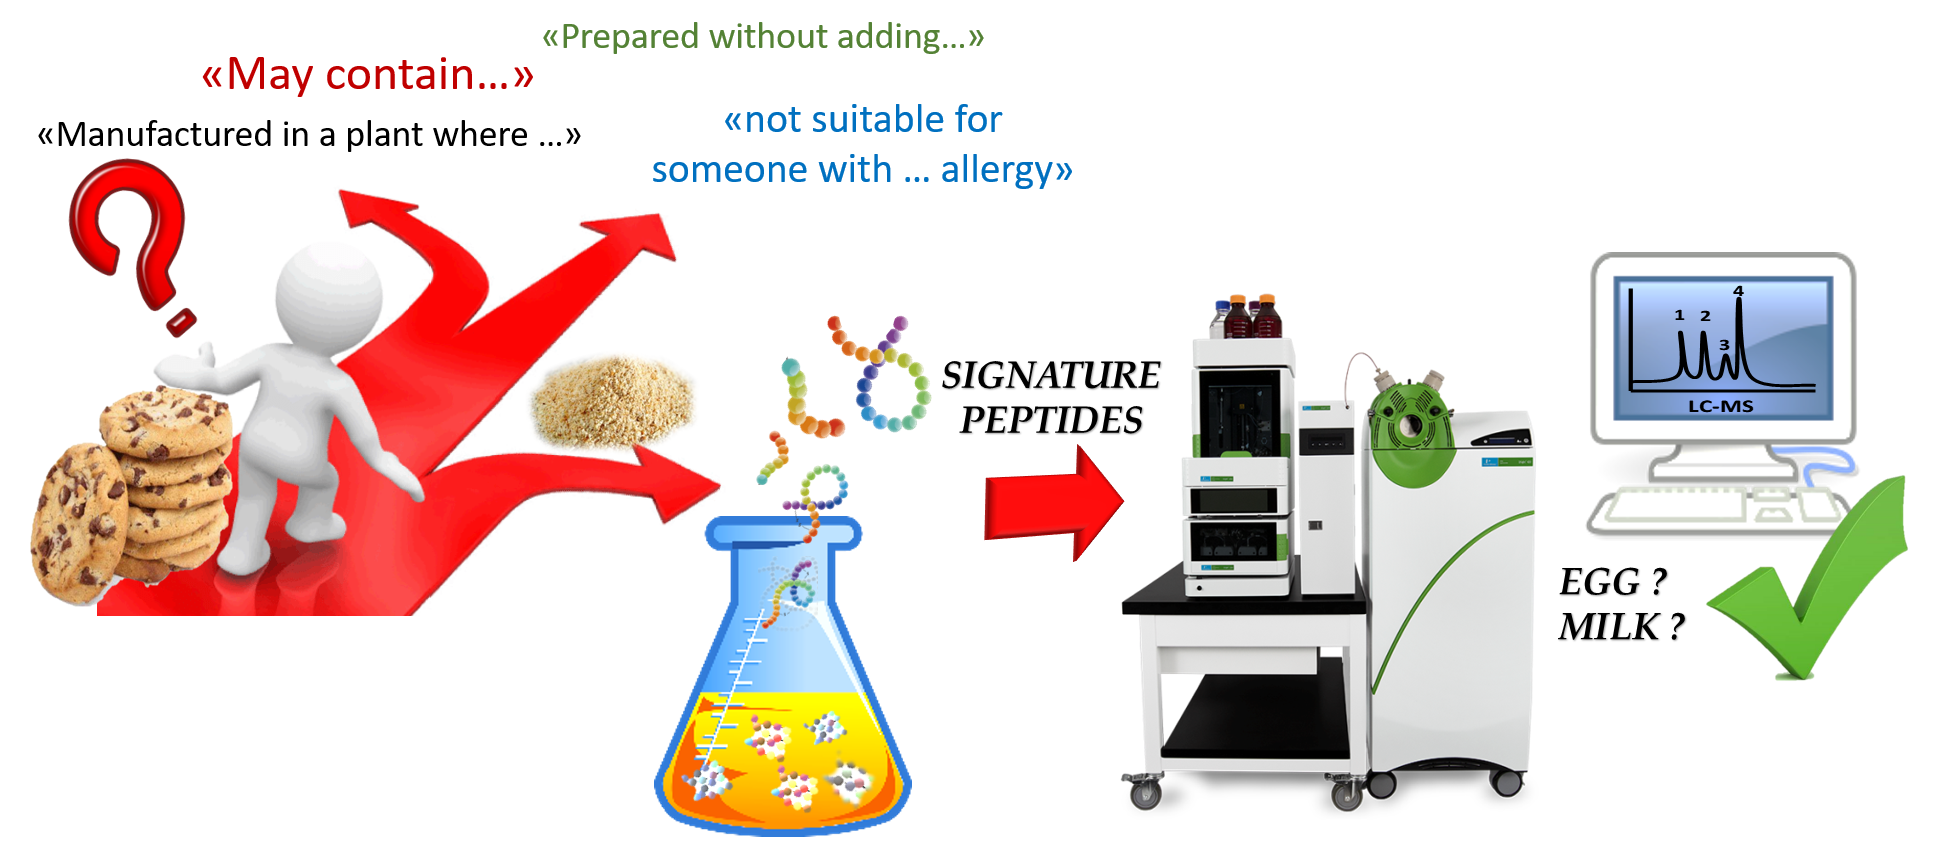
3.7. Occurrence of Milk and Egg Contamination in Commercial Samples Declared “Prepared without Adding Milk and Egg”
4. Conclusions
Supplementary Materials
Author Contributions
Funding
Acknowledgments
Conflicts of Interest
References
- Dunlop, J.H.; Keet, C.A. Epidemiology of food allergy. Immunol. Allergy Clin. 2018, 38, 13–25. [Google Scholar] [CrossRef]
- Sicherer, S.H.; Sampson, H.A. Food allergy: A review and update on epidemiology, pathogenesis, diagnosis, prevention, and management. J. Allergy Clin. Immunol. 2018, 141, 41–58. [Google Scholar] [CrossRef] [PubMed] [Green Version]
- Loh, W.; Tang, M.L.K. Debates in Allergy Medicine: Oral immunotherapy shortens the duration of milk and egg allergy–the con argument. World Allergy Organ. J. 2018, 11, 1–7. [Google Scholar] [CrossRef] [PubMed]
- European Regulation (EU) No 1169/Regulation of the European Parliament and of the Council of 25 October 2011 on the provision of food information to consumers. Off. J. Eur. Union. 2011, 18. Available online: https://eur-lex.europa.eu/legal-content/EN/TXT/?uri=CELEX:02011R1169-20180101 (accessed on 1 July 2020).
- Fierro, V.; Di Girolamo, F.; Marzano, V.; Dahdah, L.; Mennini, M. Food labelling issues in patients with severe food allergies: Solving a hamlet-like doubt. Curr. Opin. Allergy Clin. Immunol. 2017, 17, 204–211. [Google Scholar] [CrossRef] [PubMed]
- Mills, E.N.C.; Adel-Patient, K.; Bernard, H.; De Loose, M.; Gillard, N.; Huet, A.C.; Larré, C.; Nitride, C.; Pilolli, R.; Tranquet, O.; et al. Detection and quantification of allergens in foods and minimum eliciting doses in food-Allergic individuals (ThRAll). J. Aoac Int. 2019, 102, 1346–1353. [Google Scholar] [CrossRef] [PubMed] [Green Version]
- Allen, K.J.; Turner, P.J.; Pawankar, R.; Taylor, S.; Sicherer, S.; Lack, G.; Rosario, N.; Ebisawa, M.; Wong, G.; Mills, E.N.C.; et al. Precautionary labelling of foods for allergen content: Are we ready for a global framework? World Allergy Organ. J. 2014, 7. [Google Scholar] [CrossRef] [Green Version]
- Allen, K.J.; Remington, B.C.; Baumert, J.L.; Crevel, R.W.R.; Houben, G.F.; Brooke-Taylor, S.; Kruizinga, A.G.; Taylor, S.L. Allergen reference doses for precautionary labeling (VITAL 2.0): Clinical implications. J. Allergy Clin. Immunol. 2014, 133, 156–164. [Google Scholar] [CrossRef]
- Taylor, S.L.; Baumert, J.L.; Kruizinga, A.G.; Remington, B.C.; Crevel, R.W.R.; Brooke-Taylor, S.; Allen, K.J.; Houben, G. Establishment of Reference Doses for residues of allergenic foods: Report of the VITAL Expert Panel. Food Chem. Toxicol. 2014, 63, 9–17. [Google Scholar] [CrossRef]
- Cho, C.Y.; Nowatzke, W.; Oliver, K.; Garber, E.A.E. Multiplex detection of food allergens and gluten. Anal. Bioanal. Chem. 2015, 407, 4195–4206. [Google Scholar] [CrossRef]
- Pöpping, B.; Diaz-Amigo, C. The probability of obtaining a correct and representative result in allergen analysis. Agro Food Ind. Hi Tech 2014, 25, 421–442. [Google Scholar] [CrossRef]
- Monaci, L.; De Angelis, E.; Montemurro, N.; Pilolli, R. Comprehensive overview and recent advances in proteomics MS based methods for food allergens analysis. Trac–Trends Anal. Chem. 2018, 106, 21–36. [Google Scholar] [CrossRef]
- Marzano, V.; Tilocca, B.; Fiocchi, A.G.; Vernocchia, P.; Levi Mortera, S.; Urbani, A.; Roncada, P.; Putignani, L. Perusal of food allergens analysis by mass spectrometry-based proteomics. J. Proteomics. 2020, 215, 103636. [Google Scholar] [CrossRef]
- Heick, J.; Fischer, M.; Pöpping, B. First screening method for the simultaneous detection of seven allergens by liquid chromatography mass spectrometry. J. Chromatogr. A 2011, 1218, 938–943. [Google Scholar] [CrossRef]
- Parker, C.H.; Khuda, S.E.; Pereira, M.; Ross, M.M.; Fu, T.J.; Fan, X.; Wu, Y.; Williams, K.M.; DeVries, J.; Pulvermacher, B.; et al. Multi-allergen Quantitation and the Impact of Thermal Treatment in Industry-Processed Baked Goods by ELISA and Liquid Chromatography-Tandem Mass Spectrometry. J. Agric. Food Chem. 2015, 63, 10669–10680. [Google Scholar] [CrossRef]
- Lamberti, C.; Acquadro, E.; Corpillo, D.; Giribaldi, M.; Decastelli, L.; Garino, C.; Arlorio, M.; Ricciardi, C.; Cavallarin, L.; Giuffrida, M.G. Validation of a mass spectrometry-based method for milk traces detection in baked food. Food Chem. 2016, 199, 119–127. [Google Scholar] [CrossRef] [PubMed]
- Planque, M.; Arnould, T.; Dieu, M.; Delahaut, P.; Renard, P.; Gillard, N. Advances in ultra-high performance liquid chromatography coupled to tandem mass spectrometry for sensitive detection of several food allergens in complex and processed foodstuffs. J. Chromatogr. A 2016, 1464, 115–123. [Google Scholar] [CrossRef]
- Planque, M.; Arnould, T.; Dieu, M.; Delahaut, P.; Renard, P.; Gillard, N. Liquid chromatography coupled to tandem mass spectrometry for detecting ten allergens in complex and incurred foodstuffs. J. Chromatogr. A 2017, 1530, 138–151. [Google Scholar] [CrossRef]
- Pilolli, R.; De Angelis, E.; Monaci, L. Streamlining the analytical workflow for multiplex MS/MS allergen detection in processed foods. Food Chem. 2017, 221, 1747–1753. [Google Scholar] [CrossRef]
- Pilolli, R.; De Angelis, E.; Monaci, L. In house validation of a high resolution mass spectrometry Orbitrap-based method for multiple allergen detection in a processed model food. Anal. Bioanal. Chem. 2018, 410, 5653–5662. [Google Scholar] [CrossRef] [PubMed]
- Boo, C.C.; Parker, C.H.; Jackson, L.S. A targeted LC-MS/MS method for the simultaneous detection and quantitation of egg, milk, and peanut allergens in sugar cookies. J. Aoac Int. 2018, 101, 108–117. [Google Scholar] [CrossRef] [PubMed]
- New, S.L.; Schreiber, A.; Stahl-Zeng, J.; Liu, H.F. Simultaneous analysis of multiple allergens in food products by LC-MS/MS. J. Aoac Int. 2018, 101, 132–145. [Google Scholar] [CrossRef]
- Sayers, R.L.; Gethings, L.A.; Lee, V.; Balasundaram, A.; Johnson, P.E.; Marsh, J.A.; Wallace, A.; Brown, H.; Rogers, A.; Langridge, J.I.; et al. Microfluidic Separation Coupled to Mass Spectrometry for Quantification of Peanut Allergens in a Complex Food Matrix. J. Proteome Res. 2018, 17, 647–655. [Google Scholar] [CrossRef] [PubMed]
- Pilolli, R.; Nitride, C.; Gillard, N.; Huet, A.C.; van Poucke, C.; de Loose, M.; Tranquet, O.; Larré, C.; Adel-Patient, K.; Bernard, H.; et al. Critical review on proteotypic peptide marker tracing for six allergenic ingredients in incurred foods by mass spectrometry. Food Res. Int. 2020, 128, 108747. [Google Scholar] [CrossRef] [PubMed]
- Fæste, C.K.; Løvberg, K.E.; Lindvik, H.; Egaas, E. Extractability, stability, and allergenicity of egg white proteins in differently heat-processed foods. J. Aoac Int. 2007, 90, 427–436. [Google Scholar] [CrossRef] [PubMed] [Green Version]
- Korte, R.; Oberleitner, D.; Brockmeyer, J. Determination of food allergens by LC-MS: Impacts of sample preparation, food matrix, and thermal processing on peptide detectability and quantification. J. Proteom. 2019, 196, 131–140. [Google Scholar] [CrossRef]


| Allergenic Ingredient: Protein | Marker | Quantifier Transition | LOD/LOQ (µgTOT PROT/gMATRIX) | R2 | CV% intra Day 1 | CV% intra Day 2 | CV% intra Day 4 | CV% inter | Recovery LOW-MQA Material | Recovery HIGH-MQA Material |
|---|---|---|---|---|---|---|---|---|---|---|
| Milk: αS1-Casein | FFV | 692.9→991.4 | 0.10/0.3 | 1.0000 | 1.9% | 0.7% | 6% | 4% | 57 ± 4% | 50 ± 3% |
| Milk: β-Lactoglobulin | TPE | 623.3→572.5 | 3/8 | 0.9992 | 8% | 9% | 10% | 9% | - | - |
| Egg: Ovalbumin | ISQ | 592.1→858.9 | 0.3/1.1 | 1.0000 | 2% | 5% | 1.7% | 4% | - | - |
| Egg: Vitellogenin-2 | NIP | 671.8→557.9 | 3/9 | 1.0000 | 3% | 3% | 4% | 6% | - | - |
| Allergenic Ingredient: Protein | Marker | Quantifier Transition | LOD/LOQ (μgTOT PROT/gMATRIX) Incurred Material | R2 |
|---|---|---|---|---|
| Milk: α-S1-casein | FFV | 692.9→991.4 | 1.6/5.4 | 0.9969 |
| Milk: β-Lactoglobulin | TPE | 623.3→572.5 | 3.5/11.7 | 0.9854 |
| Egg: ovalbumin | ISQ | 592.1→858.9 | 4/15.6 | 0.9903 |
| Egg: vitellogenin | NIP | 671.8→557.9 | 4.8/14.0 | 0.9896 |
Publisher’s Note: MDPI stays neutral with regard to jurisdictional claims in published maps and institutional affiliations. |
© 2020 by the authors. Licensee MDPI, Basel, Switzerland. This article is an open access article distributed under the terms and conditions of the Creative Commons Attribution (CC BY) license (http://creativecommons.org/licenses/by/4.0/).
Share and Cite
Monaci, L.; De Angelis, E.; Guagnano, R.; Ganci, A.P.; Garaguso, I.; Fiocchi, A.; Pilolli, R. Validation of a MS Based Proteomics Method for Milk and Egg Quantification in Cookies at the Lowest VITAL Levels: An Alternative to the Use of Precautionary Labeling. Foods 2020, 9, 1489. https://doi.org/10.3390/foods9101489
Monaci L, De Angelis E, Guagnano R, Ganci AP, Garaguso I, Fiocchi A, Pilolli R. Validation of a MS Based Proteomics Method for Milk and Egg Quantification in Cookies at the Lowest VITAL Levels: An Alternative to the Use of Precautionary Labeling. Foods. 2020; 9(10):1489. https://doi.org/10.3390/foods9101489
Chicago/Turabian StyleMonaci, Linda, Elisabetta De Angelis, Rocco Guagnano, Aristide P. Ganci, Ignazio Garaguso, Alessandro Fiocchi, and Rosa Pilolli. 2020. "Validation of a MS Based Proteomics Method for Milk and Egg Quantification in Cookies at the Lowest VITAL Levels: An Alternative to the Use of Precautionary Labeling" Foods 9, no. 10: 1489. https://doi.org/10.3390/foods9101489