Effect of the Roasting Conditions on the Physicochemical, Quality and Sensory Attributes of Coffee-Like Powder and Brew from Defatted Palm Date Seeds

 ,
,
Abstract
:
1. Introduction
2. Materials and Methods
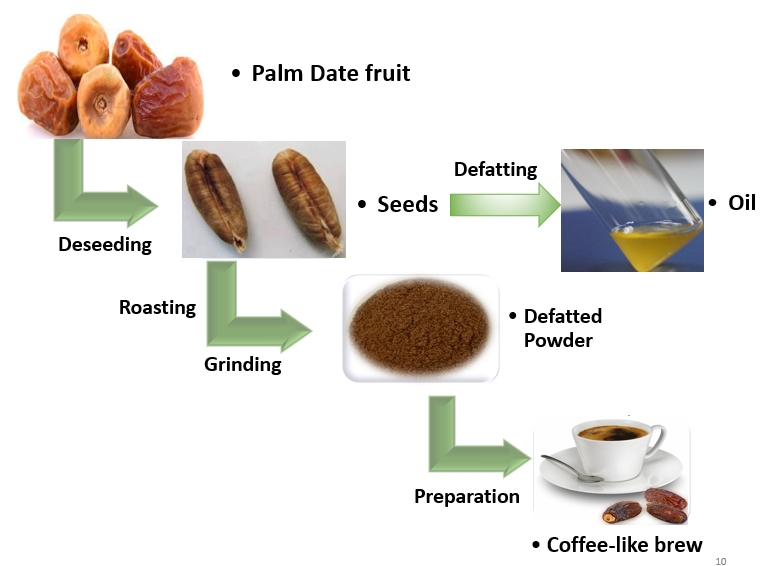
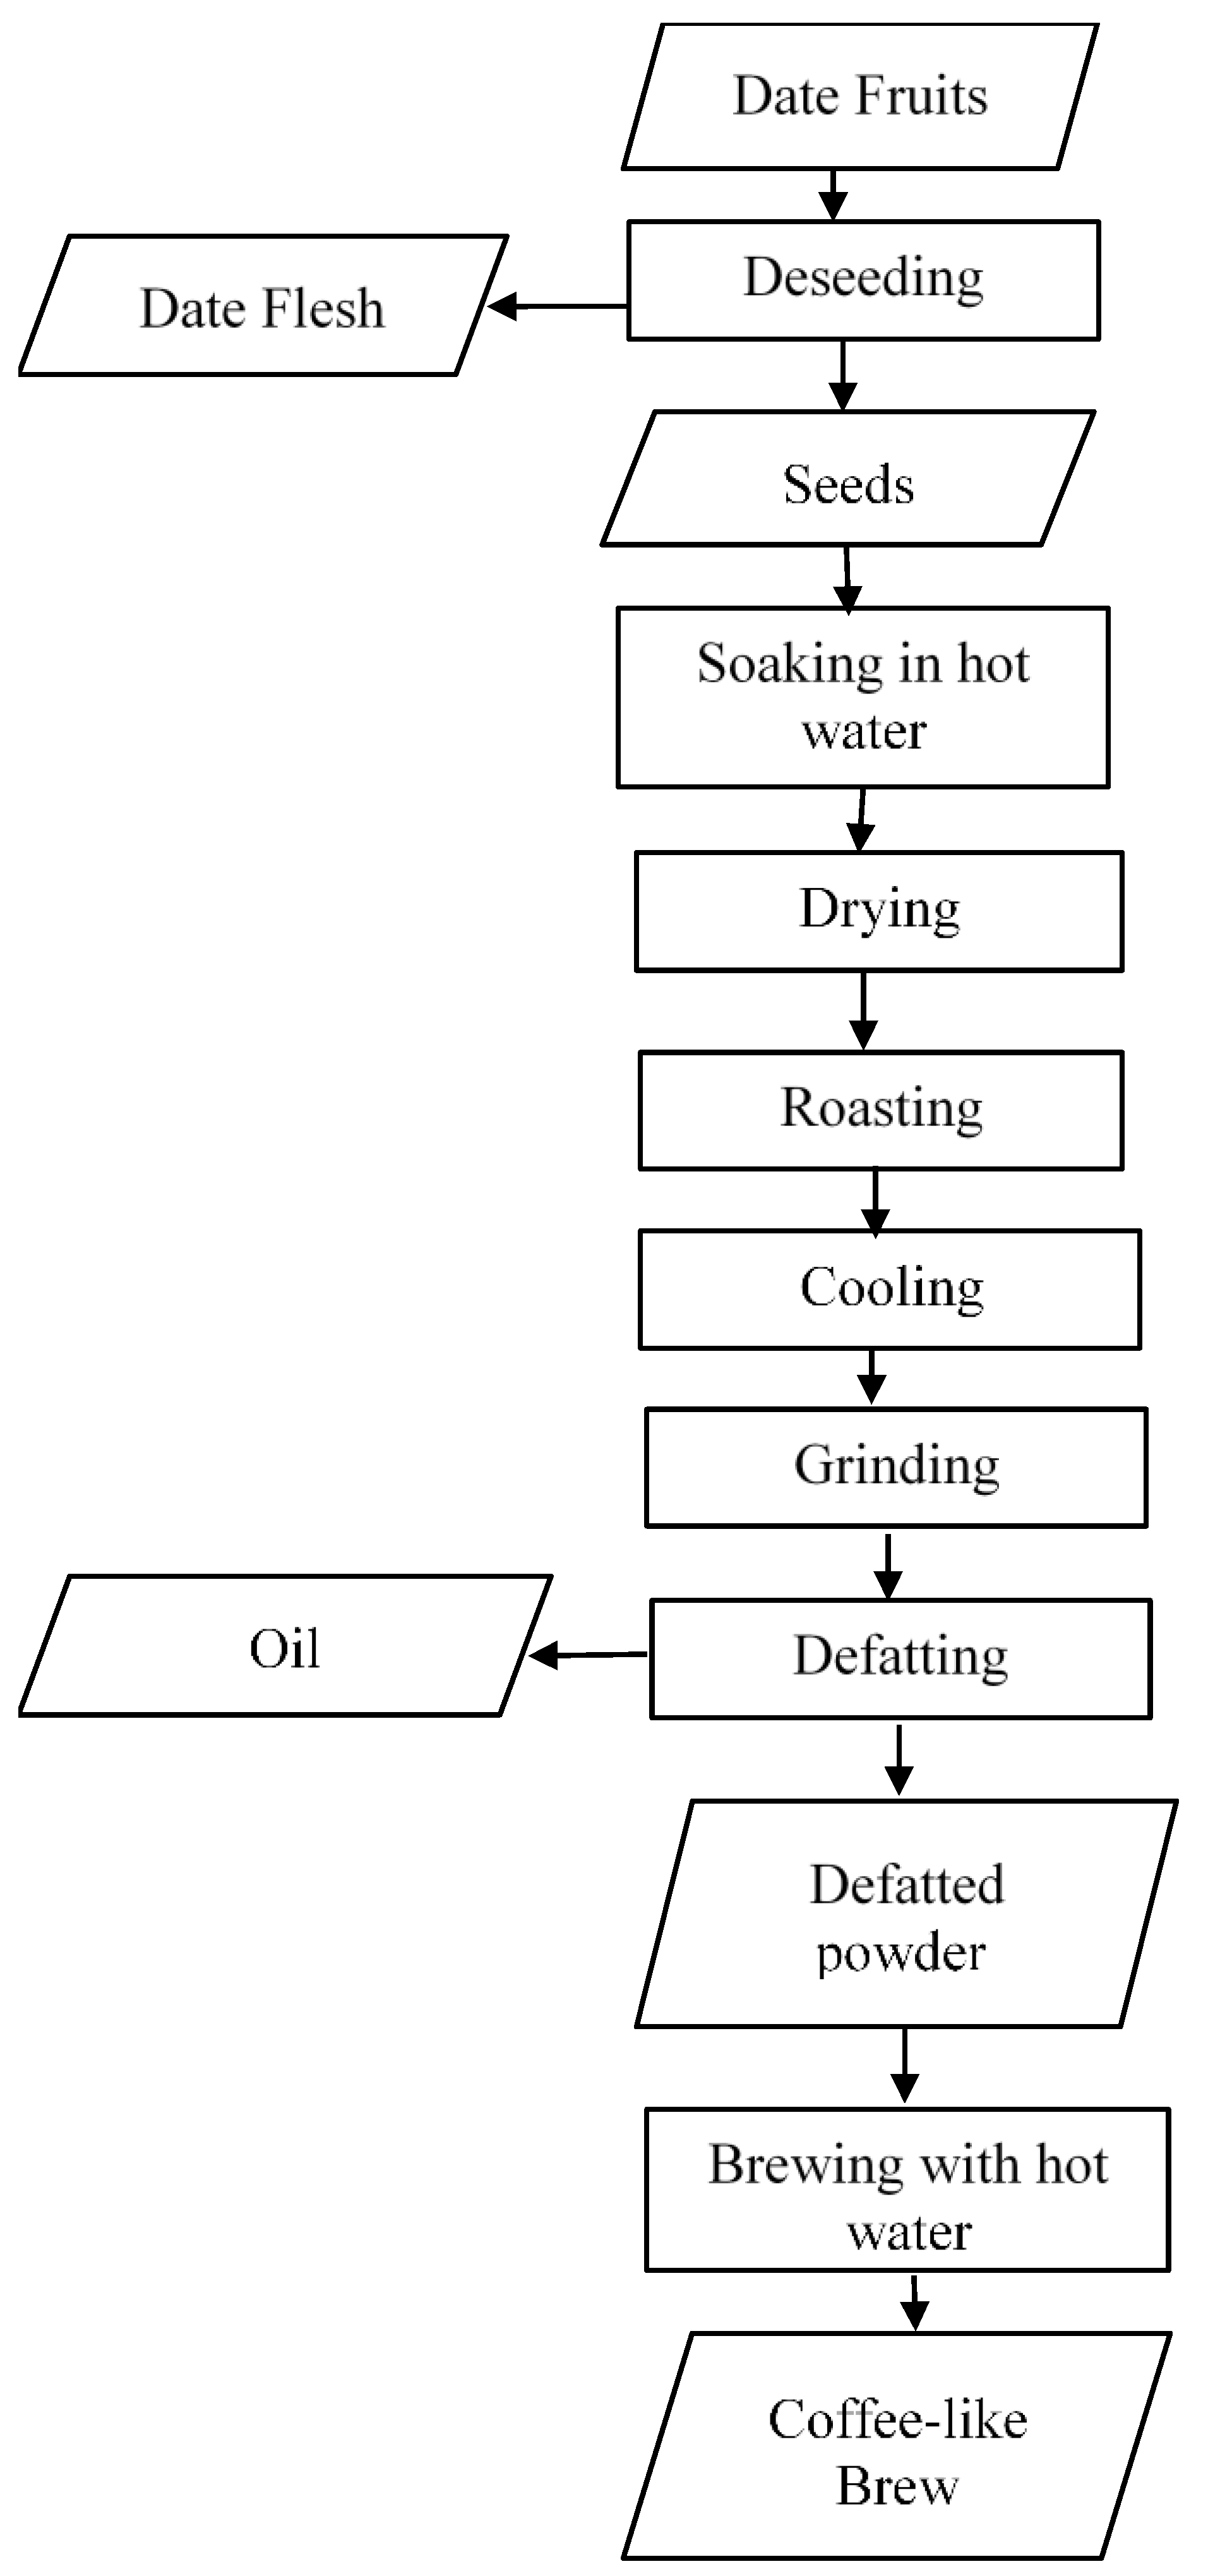
2.1. Preparation and Brewing of the Defatted Roasted Date Seed Powder (DRDSP)
2.2. Measurement of Hardness of the Roasted Seeds
2.3. Measurement of Moisture Content of the DRDSP
2.4. Measurement of Bulk Density of the DRDSP
2.5. Measurement of the Color of the DRDSP
2.6. Determination of Extraction Yield and pH of the Brew
2.7. Measurement of the Browning Index (BI) of the Brew
2.8. Analysis of Total Phenolic Content (TPC)
2.9. Determination of DPPH Radical Scavenging Activity
2.10. Sensory Analysis of Palm Date Seeds Brew
2.11. Experimental Design and Statistical Analysis
3. Results and Discussion
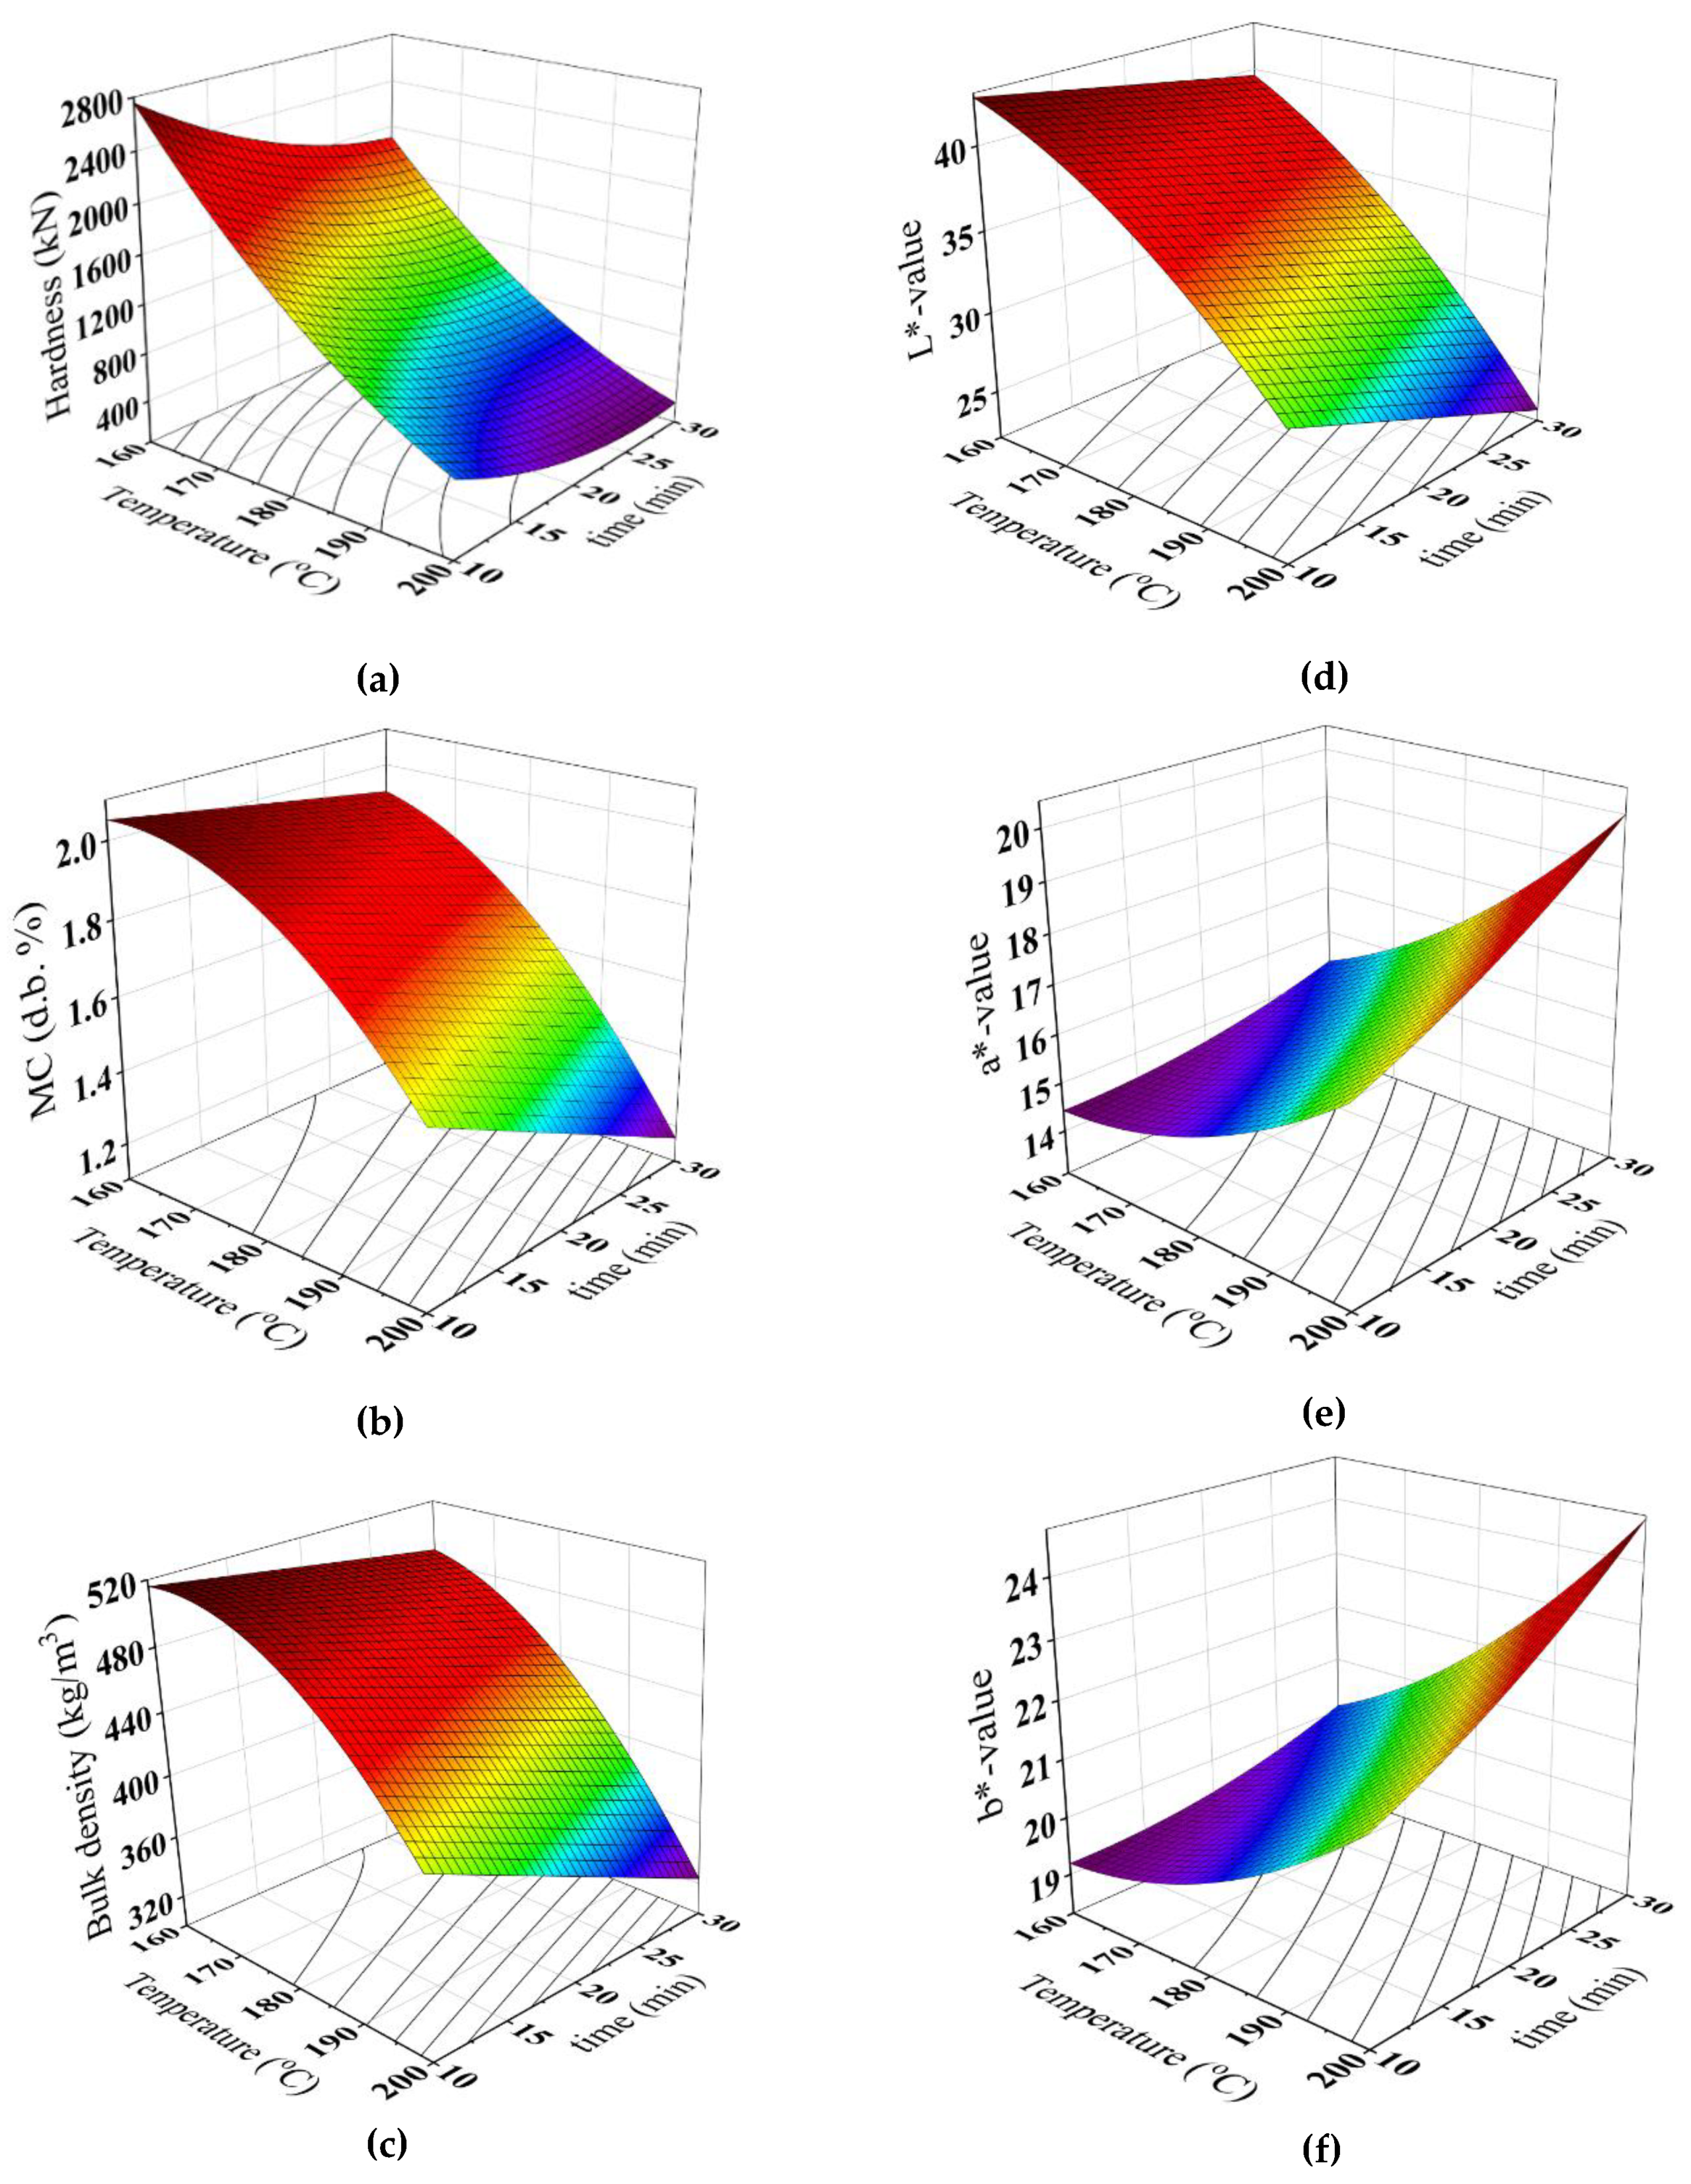
3.1. Effect of Roasting Conditions on the Physical Properties of DRDSP
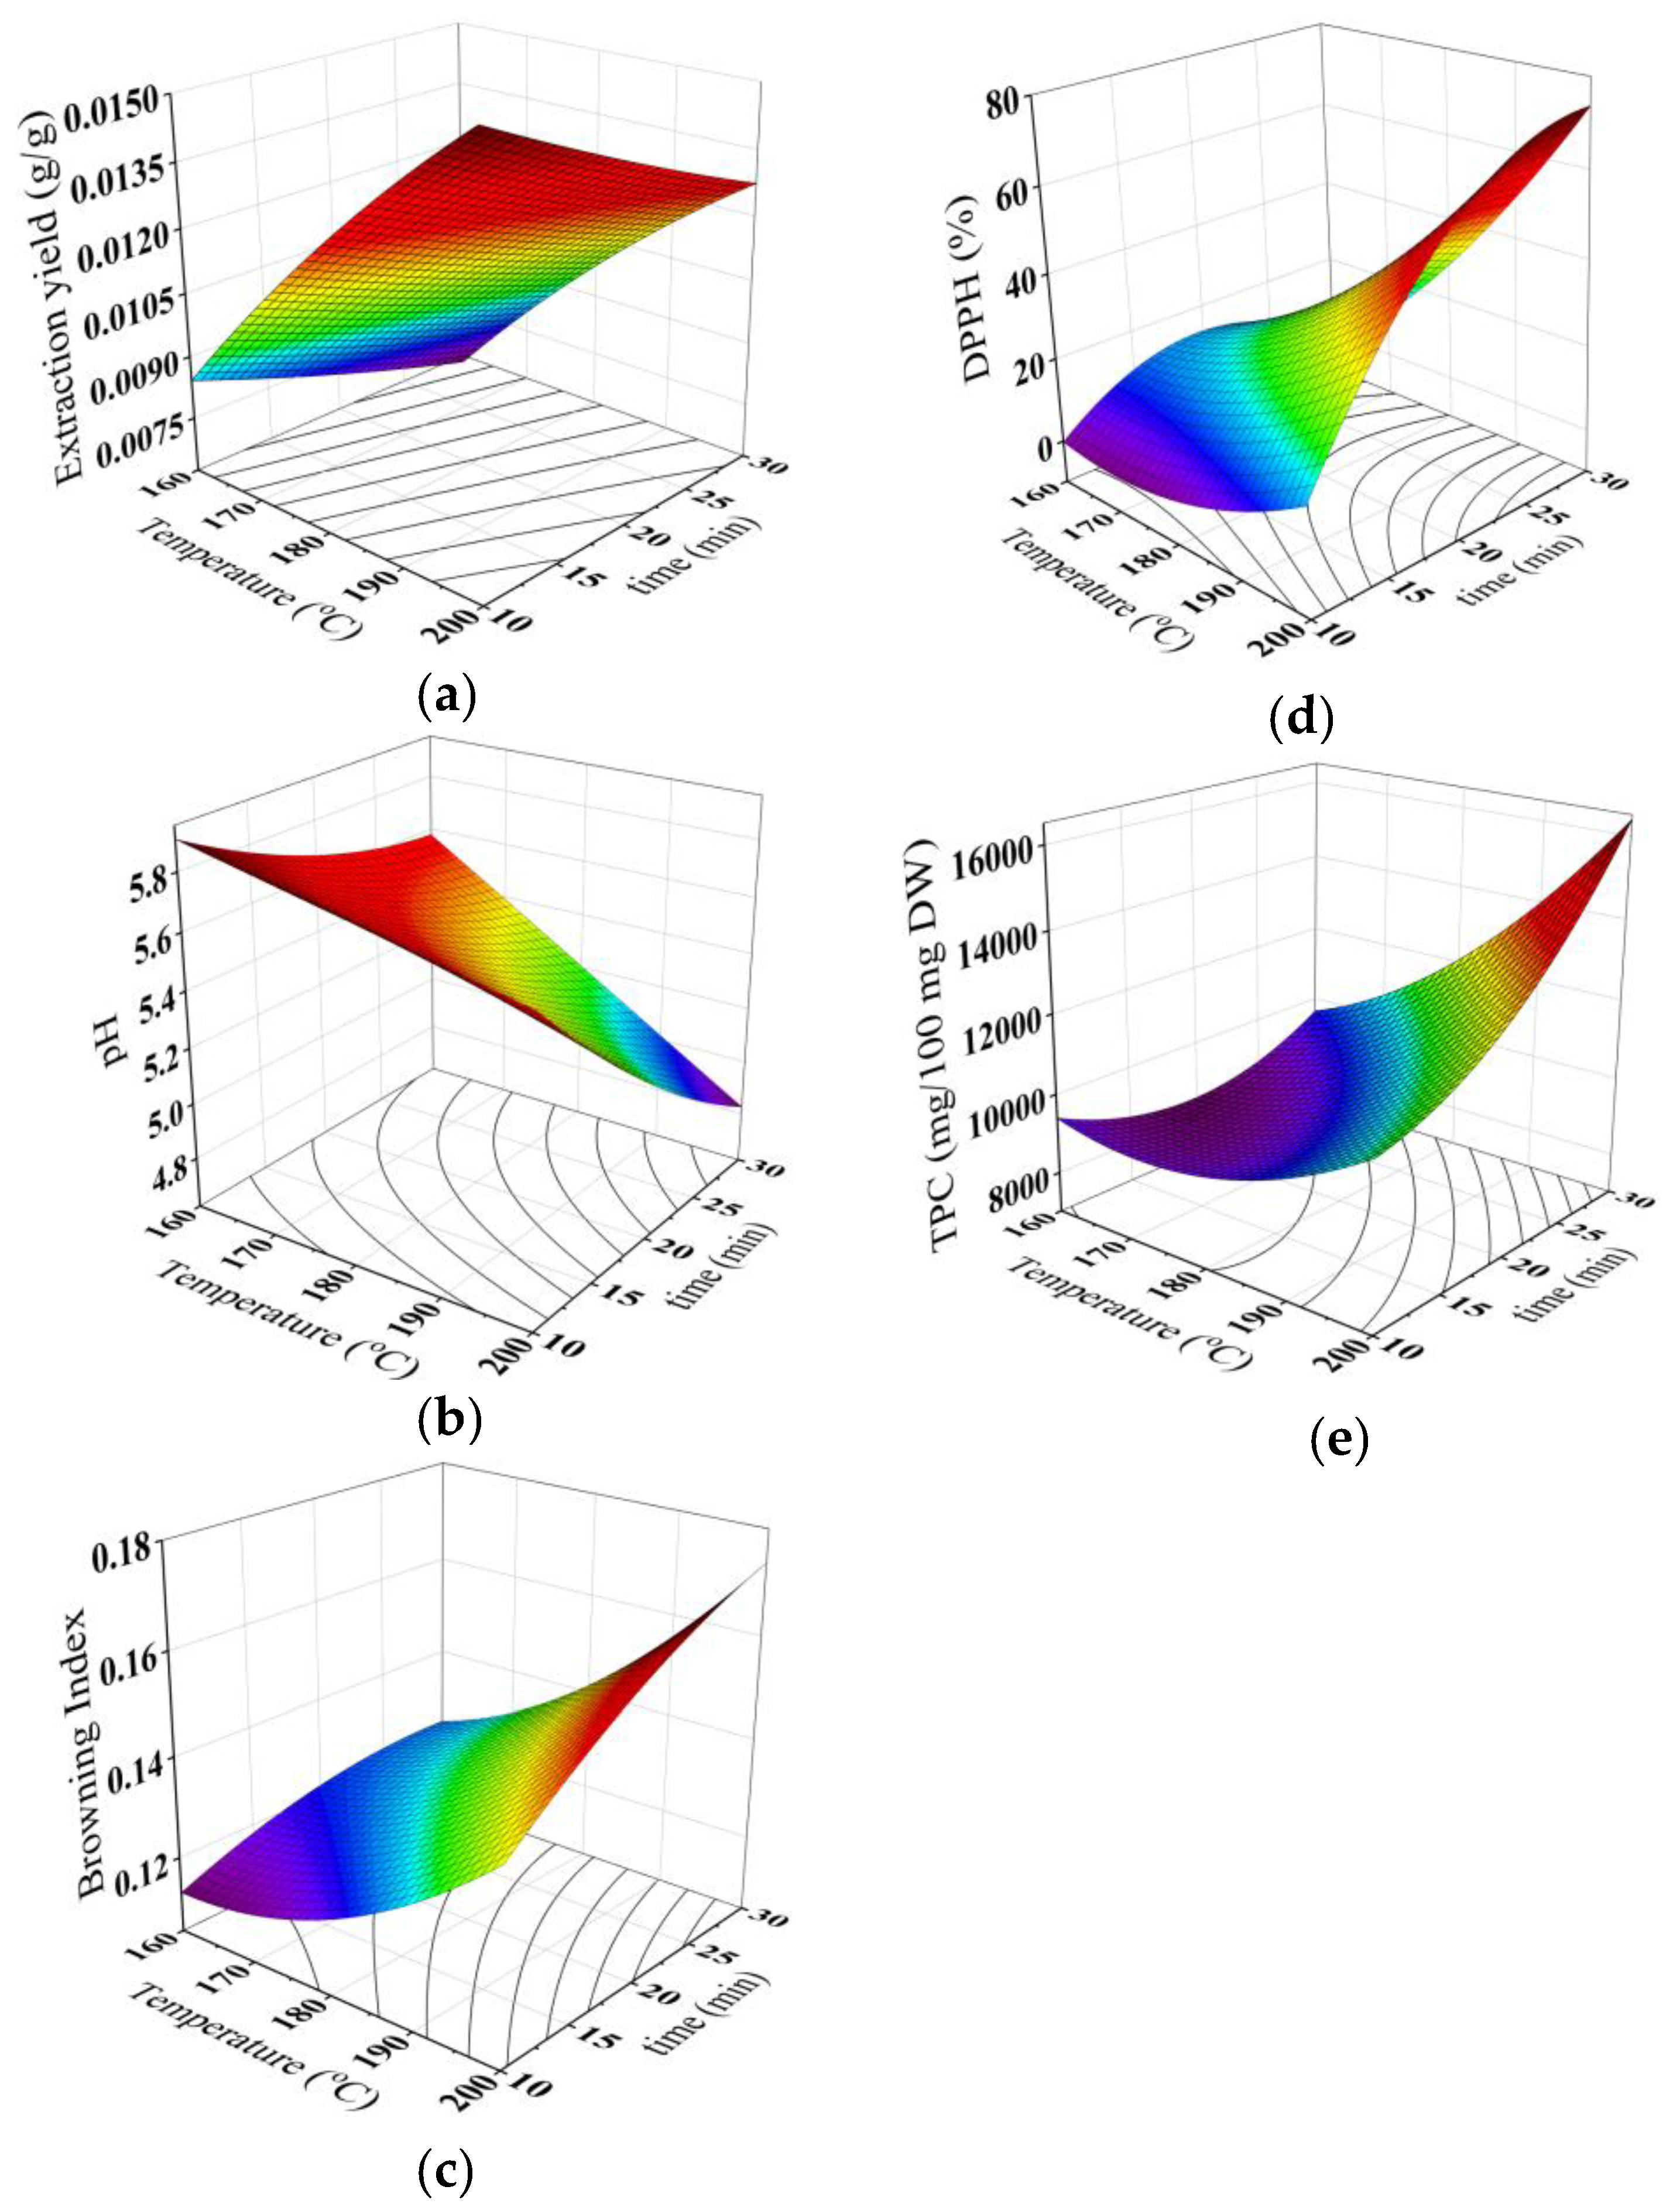
3.2. Effect of Roasting Conditions on the Quality and Chemical Properties of the Brew
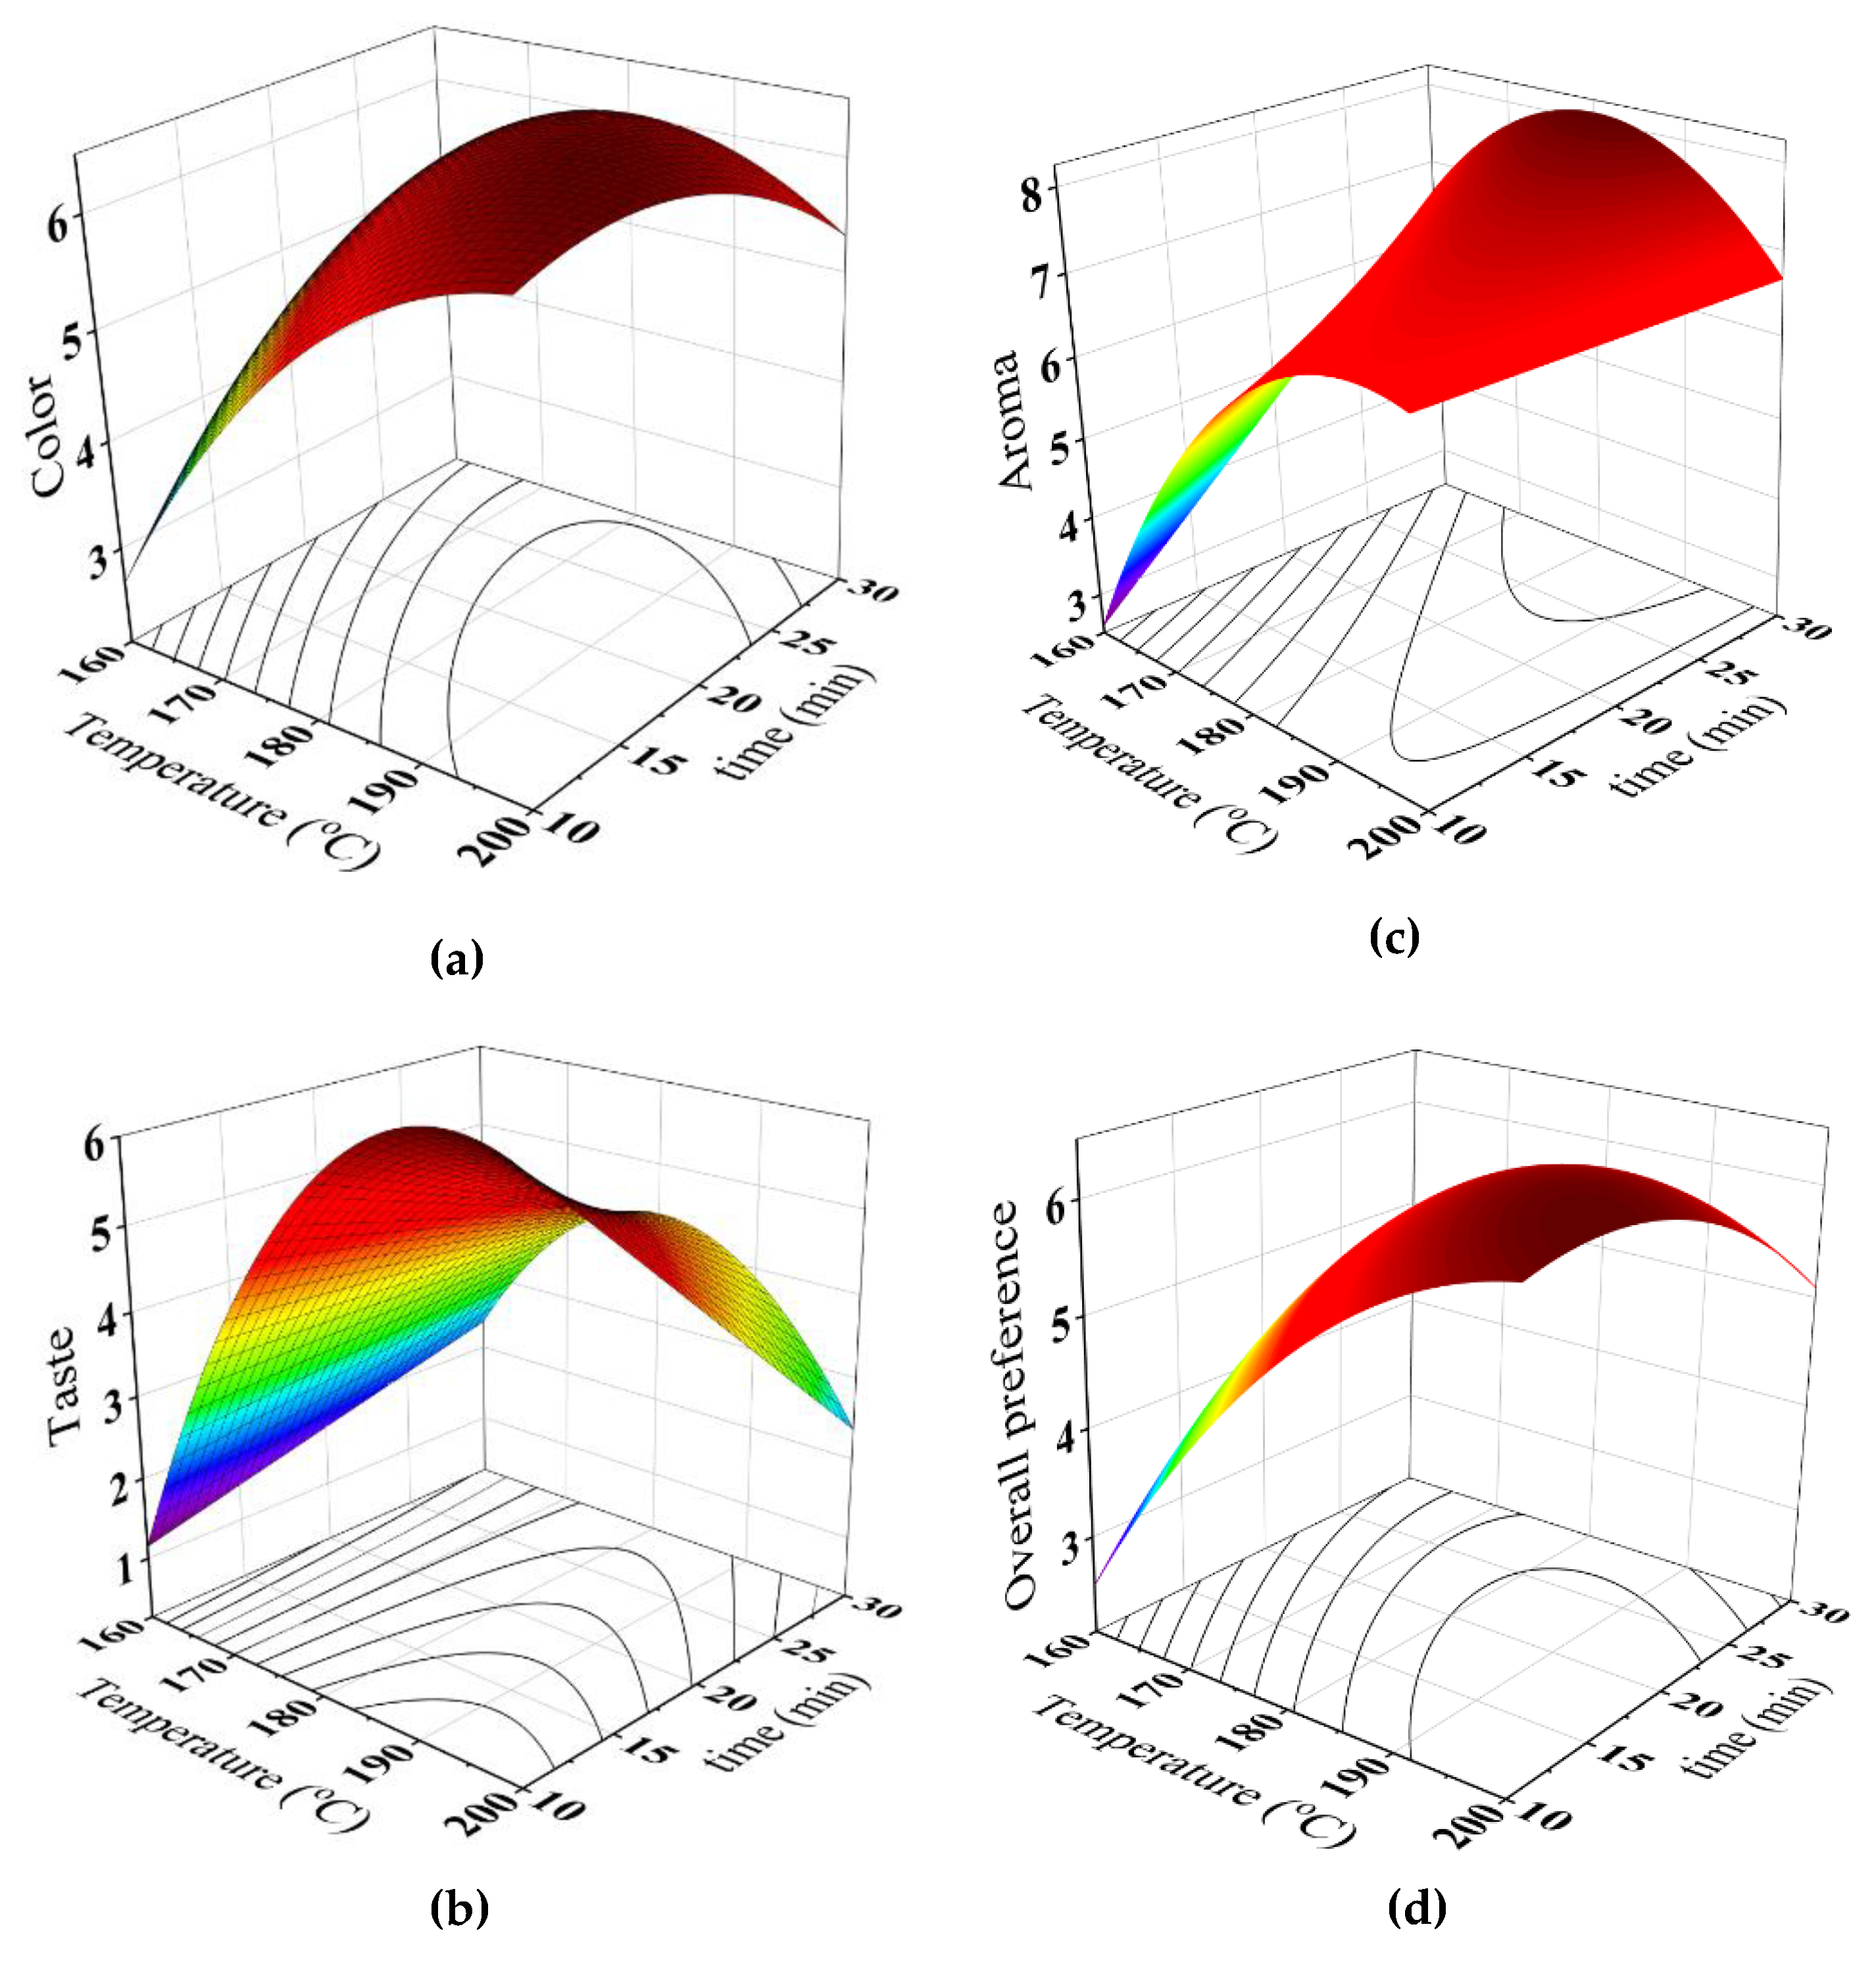
3.3. The Sensory Properties of the Brew as Affected by the Roasting Conditions
3.4. Data Validation
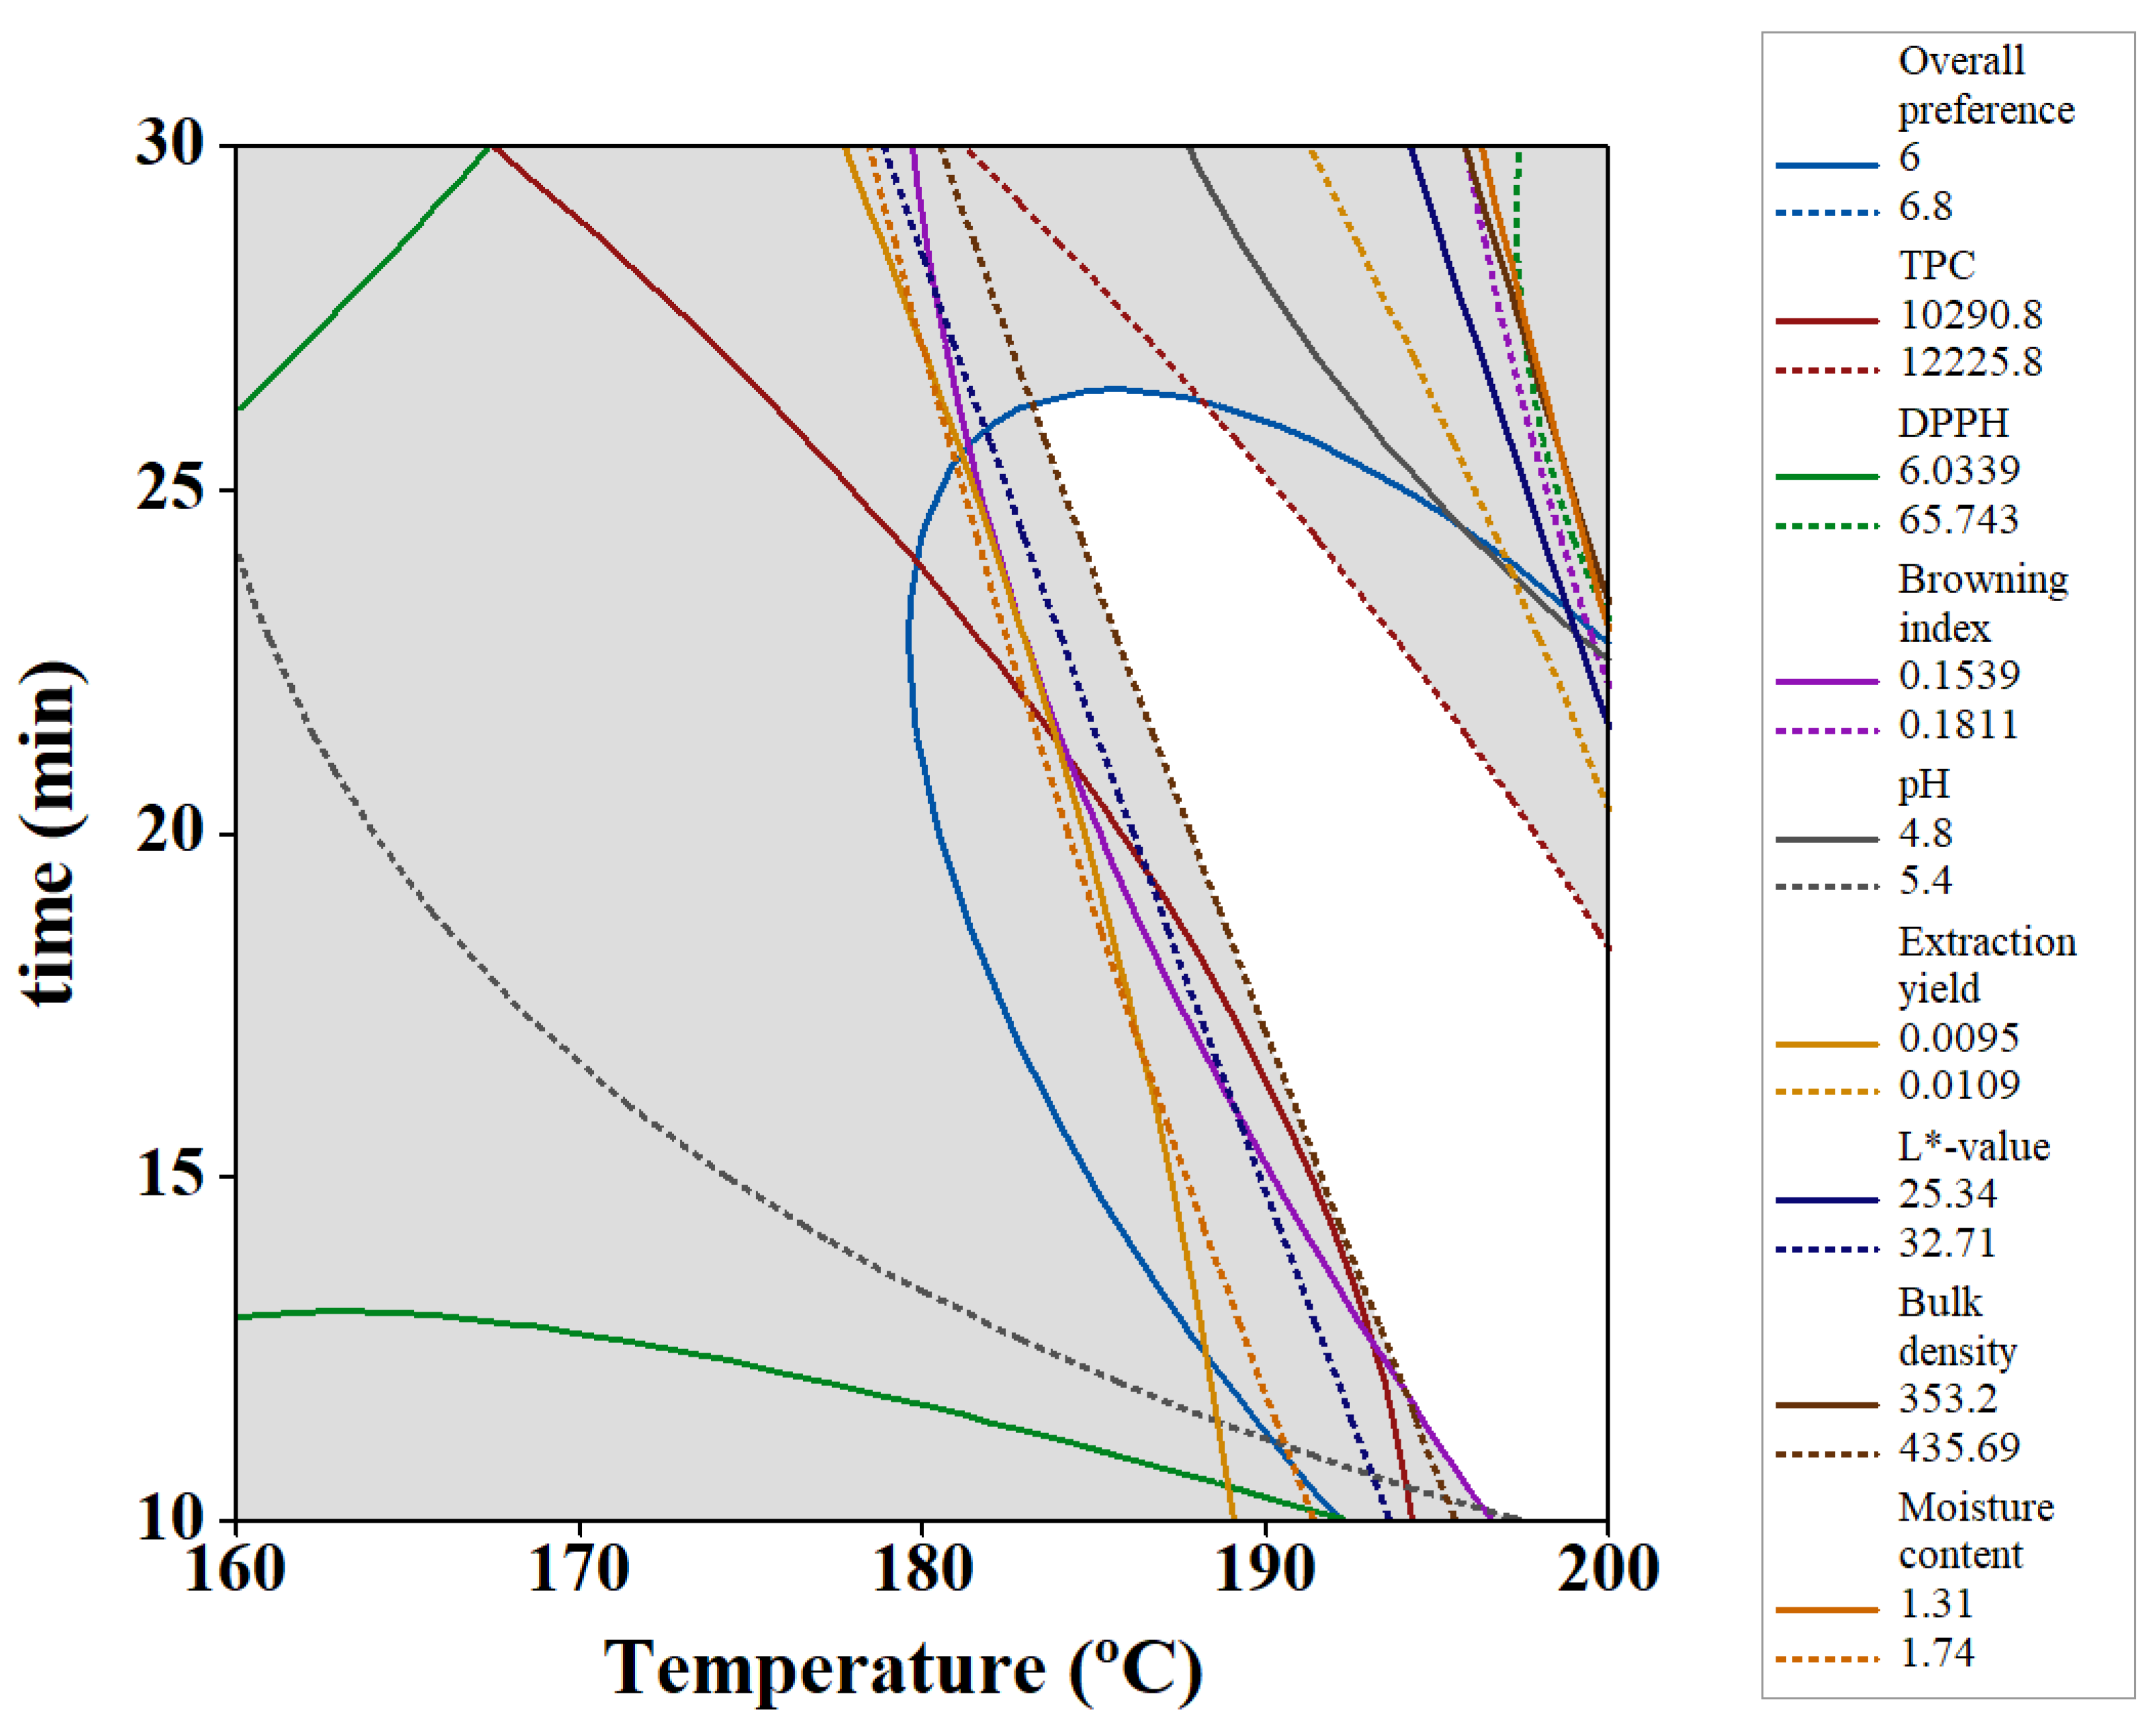
3.5. Determination of the Optimum Roasting Conditions
4. Conclusion
Author Contributions
Funding
Acknowledgments
Conflicts of Interest
References
- FAO. Data Base. Available online: http://www.faostat.fao.org (accessed on 20 March 2018).
- Barreveld, W.H. Date palm products. In FAO Agricultural Services Bulletin No. 101; Food and Agriculture Organization of the United Nations: Rome, Italy, 1993. [Google Scholar]
- Siddiq, M.; Greiby, I. Overview of date fruit production, postharvest handling, processing, and nutrition. In Dates: Postharvest Science, Processing Technology and Health Benefits; John Wiley & Sons, Ltd.: Hoboken, NJ, USA, 2013; pp. 1–28. [Google Scholar]
- Al-Farsi, M.A.; Lee, C.Y. Optimization of phenolics and dietary fibre extraction from date seeds. Food Chem. 2008, 108, 977–985. [Google Scholar] [CrossRef] [PubMed]
- Anderson, J.W.; Baird, P.; Davis, R.H.; Ferreri, S.; Knudtson, M.; Koraym, A.; Waters, V.; Williams, C.L. Health benefits of dietary fiber. Nutr. Rev. 2009, 67, 188–205. [Google Scholar] [CrossRef] [PubMed] [Green Version]
- Hossain, M.Z.; Waly, M.I.; Singh, V.; Sequeira, V.; Rahman, M.S. Chemical composition of date-pits and its potential for developing value-added product-a review. Pol. J. Food Nutr. Sci. 2014, 64, 215–226. [Google Scholar] [CrossRef]
- Amany, M.; Shaker, M.A.; Abeer, A. Antioxidant activities of date pits in a model meat system. Int. Food Res. J. 2012, 19, 223–227. [Google Scholar]
- Platat, C.; Habib, H.M.; Hashim, I.B.; Kamal, H.; AlMaqbali, F.; Souka, U.; Ibrahim, W.H. Production of functional pita bread using date seed powder. J. Food Sci. Technol. 2015, 52, 6375–6384. [Google Scholar] [CrossRef] [PubMed] [Green Version]
- Almana, H.; Mahmoud, R. Palm date seeds as an alternative source of dietary fiber in Saudi bread. Ecol. Food Nutr. 1994, 32, 261–270. [Google Scholar] [CrossRef]
- Bouaziz, M.A.; Abbes, F.; Mokni, A.; Blecker, C.; Attia, H.; Besbes, S. The addition effect of Tunisian date seed fibers on the quality of chocolate spreads. J. Texture Stud. 2017, 48, 143–150. [Google Scholar] [CrossRef]
- Venkatachalam, C.D.; Sengottian, M. Study on roasted date seed non caffeinated Coffee powder as a promising alternative. Humanities 2016, 6, 1387–1394. [Google Scholar] [CrossRef]
- Ghnimi, S.; Almansoori, R.; Jobe, B.; Hassan, M.; Afaf, K. Quality evaluation of Coffee-like beverage from date seeds (Phoenix dactylifera L.). J. Food Process. Technol. 2015, 6, 1–6. [Google Scholar] [CrossRef]
- Rahman, M.S.; Kasapis, S.; Al-Kharusi, N.S.Z.; Al-Marhubi, I.M.; Khan, A.J. Composition characterisation and thermal transition of date pits powders. J. Food Eng. 2007, 80, 1–10. [Google Scholar] [CrossRef]
- Al-Farsi, M.; Alasalvar, C.; Al-Abid, M.; Al-Shoaily, K.; Al-Amry, M.; Al-Rawahy, F. Compositional and functional characteristics of dates, syrups, and their by-products. Food Chem. 2007, 104, 943–947. [Google Scholar] [CrossRef]
- Baliga, M.S.; Baliga, B.R.V.; Kandathil, S.M.; Bhat, H.P.; Vayalil, P.K. A review of the chemistry and pharmacology of the date fruits (Phoenix dactylifera L.). Food Res. Int. 2011, 44, 1812–1822. [Google Scholar] [CrossRef]
- El Sheikh, D.M.; El-Kholany, E.A.; Kamel, S.M. Nutritional value, cytotoxicity, anti-carcinogenic and beverage evaluation of roasted date pits. World J. Dairy Food Sci. 2014, 9, 308–316. [Google Scholar]
- Saafi-Ben Salah, E.B.; Flamini, G.; El Arem, A.; Issaoui, M.; Dabbou, S.; BenYahia, L.; Ferchichi, A.; Hammami, M.; Achour, L. Compositional characteristics and aromatic profile of date palm seeds from seven varieties grown in Tunisia. Int. J. Food Sci. Technol. 2012, 47, 1903–1908. [Google Scholar] [CrossRef]
- Somporn, C.; Kamtuo, A.; Theerakulpisut, P.; Siriamornpun, S. Effects of roasting degree on radical scavenging activity, phenolics and volatile compounds of Arabica coffee beans (Coffea arabica L. cv. Catimor). Int. J. Food Sci. Technol. 2011, 46, 2287–2296. [Google Scholar] [CrossRef]
- Mendes, L.C.; de Menezes, H.C.; Aparecida, M.; Da Silva, A. Optimization of the roasting of robusta coffee (C. canephora conillon) using acceptability tests and RSM. Food Qual. Prefer. 2001, 12, 153–162. [Google Scholar] [CrossRef]
- Pittia, P.; Dalla Rosa, M.; Lerici, C. Textural changes of coffee beans as affected by roasting conditions. LWT Food Sci. Technol. 2001, 34, 168–175. [Google Scholar] [CrossRef]
- Bolek, S.; Ozdemir, M. Optimization of roasting conditions of Pistacia terebinthus in a fluidized bed roaster. LWT Food Sci. Technol. 2017, 80, 67–75. [Google Scholar] [CrossRef]
- Youn, K.-S.; Chung, H.-S. Optimization of the roasting temperature and time for preparation of coffee-like maize beverage using the response surface methodology. LWT Food Sci. Technol. 2012, 46, 305–310. [Google Scholar] [CrossRef]
- Uysal, N.; Sumnu, G.; Sahin, S. Optimization of microwave–infrared roasting of hazelnut. J. Food Eng. 2009, 90, 255–261. [Google Scholar] [CrossRef]
- Fasasi, O.; Eleyinmi, A.; Oyarekua, M. Effect of some traditional processing operations on the functional properties of African breadfruit seed (Treculia africana) flour. LWT Food Sci. Technol. 2007, 40, 513–519. [Google Scholar] [CrossRef]
- Nebesny, E.; Budryn, G. Evaluation of sensory attributes of coffee brews from robusta coffee roasted under different conditions. Eur. Food Res. Technol. 2006, 224, 159–165. [Google Scholar] [CrossRef]
- Kahyaoglu, T.; Kaya, S. Determination of optimum processing conditions for hot-air roasting of hulled sesame seeds using response surface methodology. J. Sci. Food Agric. 2006, 86, 1452–1459. [Google Scholar] [CrossRef]
- Şahin, H.; Topuz, A.; Pischetsrieder, M.; Özdemir, F. Effect of roasting process on phenolic, antioxidant and browning properties of carob powder. Eur. Food Res. Technol. 2009, 230, 155. [Google Scholar] [CrossRef]
- Hun-Sik, C.; Chung, S.K.; Youn, K.S. Effects of roasting temperature and time on bulk density, soluble solids, browning index and phenolic compounds of corn kernels. J. Food Process. Preserv. 2011, 35, 832–839. [Google Scholar]
- Chung, H.-S.; Kim, D.-H.; Youn, K.-S.; Lee, J.-B.; Moon, K.-D. Optimization of roasting conditions according to antioxidant activity and sensory quality of coffee brews. Food Sci. Biotechnol. 2013, 22, 23–29. [Google Scholar] [CrossRef]
- Marzocchi, S.; Pasini, F.; Verardo, V.; Ciemniewska-Żytkiewicz, H.; Caboni, M.F.; Romani, S. Effects of different roasting conditions on physical-chemical properties of Polish hazelnuts (Corylus avellana L. var. Kataloński). LWT Food Sci. Technol. 2017, 77, 440–448. [Google Scholar] [CrossRef]
- Fikry, M.; Yusof, Y.A.; Al-Awaadh, A.M.; Rahman, R.A.; Chin, N.L.; Chang, L.S. Moisture transfer kinetics during roasting of palm date seeds (Phoenix dactylifera L.). Pertanika J. Sci. Technol. 2019, in press. [Google Scholar]
- Fikry, M.; Yusof, Y.A.; Al-Awaadh, A.M.; Rahman, R.A.; Chin, N.L.; Mousa, E.; Chang, L.S. Kinetics modelling of the colour, hardness, grinding energy consumption and oil yield changes during the conventional roasting of palm date seeds. Food Sci. Technol. Res. 2019, in press. [Google Scholar]
- Massini, R.; Nicoli, M.; Cassarà, A.; Lerici, C. Study on physical and physico-chemical changes of coffee beans during roasting. note 1. Ital. J. Food Sci. 1990, 2, 123–130. [Google Scholar]
- Lab, Q. Moisture, Particle Characterization, Color and Sampling. Available online: https://www.coffeelabequipment.com/COLORTRACKRT.html (accessed on 17 December 2018).
- Benjakul, S.; Lertittikul, W.; Bauer, F. Antioxidant activity of Maillard reaction products from a porcine plasma protein–sugar model system. Food Chem. 2005, 93, 189–196. [Google Scholar] [CrossRef]
- Singleton, V.L.; Rossi, J.A. Colorimetry of total phenolics with phosphomolybdic-phosphotungstic acid reagents. Am. J. Enol. Vitic. 1965, 16, 144–158. [Google Scholar]
- Blois, M.S. Antioxidant determinations by the use of a stable free radical. Nature 1958, 181, 1199–1200. [Google Scholar] [CrossRef]
- International Organization for Standardization. ISO: 8586. Sensory Analysis–General Guidelines for the Selection, Training and Monitoring of Selected Assessors and Expert Sensory Assessors; International Organization for Standardization: Geneva, Switzerland, 2012. [Google Scholar]
- Prasad, K.; Nath, N. Comparison of sugarcane juice based beverage optimisation using response surface methodology with Fuzzy method. Sugar Tech 2002, 4, 109–115. [Google Scholar] [CrossRef]
- Kahyaoglu, T.; Kaya, S. Modeling of moisture, color and texture changes in sesame seeds during the conventional roasting. J. Food Eng. 2006, 75, 167–177. [Google Scholar] [CrossRef]
- Özdemir, M.; Devres, O. Analysis of color development during roasting of hazelnuts using response surface methodology. J. Food Eng. 2000, 45, 17–24. [Google Scholar] [CrossRef]
- Yousif, A.K.; Alghzawi, H. Processing and characterization of carob powder. Food Chem. 2000, 69, 283–287. [Google Scholar] [CrossRef]
- Rizki, H.; Kzaiber, F.; Elharfi, M.; Ennahli, S.; Hanine, H. Effects of roasting temperature and time on the physicochemical properties of sesame (Sesamum indicum L.) seeds. Int. J. Innov. Appl. Stud. 2015, 11, 148. [Google Scholar]
- Bekedam, E.K.; Schols, H.A.; Cämmerer, B.; Kroh, L.W.; van Boekel, M.A.; Smit, G. Electron spin resonance (ESR) studies on the formation of roasting-induced antioxidative structures in coffee brews at different degrees of roast. J. Agric. Food Chem. 2008, 56, 4597–4604. [Google Scholar] [CrossRef]
- Muñoz, A.M.; Civille, V.G.; Carr, B.T. Sensory Evaluation in Quality Control; Van Mostrand Reinhold: New York, NY, USA, 1992. [Google Scholar]
- Manzocco, L.; Calligaris, S.; Mastrocola, D.; Nicoli, M.C.; Lerici, C.R. Review of non-enzymatic browning and antioxidant capacity in processed foods. Trends Food Sci. Technol. 2000, 11, 340–346. [Google Scholar] [CrossRef]
- Bicho, N.C.; Leitão, A.E.; Ramalho, J.C.; de Alvarenga, N.B.; Lidon, F.C. Impact of roasting time on the sensory profile of Arabica and Robusta coffee. Ecol. Food Nutr. 2013, 52, 163–177. [Google Scholar] [CrossRef] [PubMed]
- Chambers, E.; Wolf, M.B. Sensory Testing Methods; ASTM International: Lancaster, PA, USA, 2005. [Google Scholar]


| L*-Value | Roasting Index |
|---|---|
| ≥57 | Very light |
| 42–56.99 | Medium light |
| 37–41.99 | Medium |
| 29–36.99 | Medium dark |
| 20.1–28.99 | dark |
| ≤20 | Very dark |
| Treatments | Temperature, x1 (°C) | Time, x2 (min) | ||
|---|---|---|---|---|
| Coded | Actual | Coded | Actual | |
| 1 | −1 | 160 | −1 | 10 |
| 2 | −1 | 160 | 0 | 20 |
| 3 | −1 | 160 | 1 | 30 |
| 4 | 0 | 180 | −1 | 10 |
| 5 | 0 | 180 | 0 | 20 |
| 6 | 0 | 180 | 1 | 30 |
| 7 | 1 | 200 | −1 | 10 |
| 8 | 1 | 200 | 0 | 20 |
| 9 | 1 | 200 | 1 | 30 |
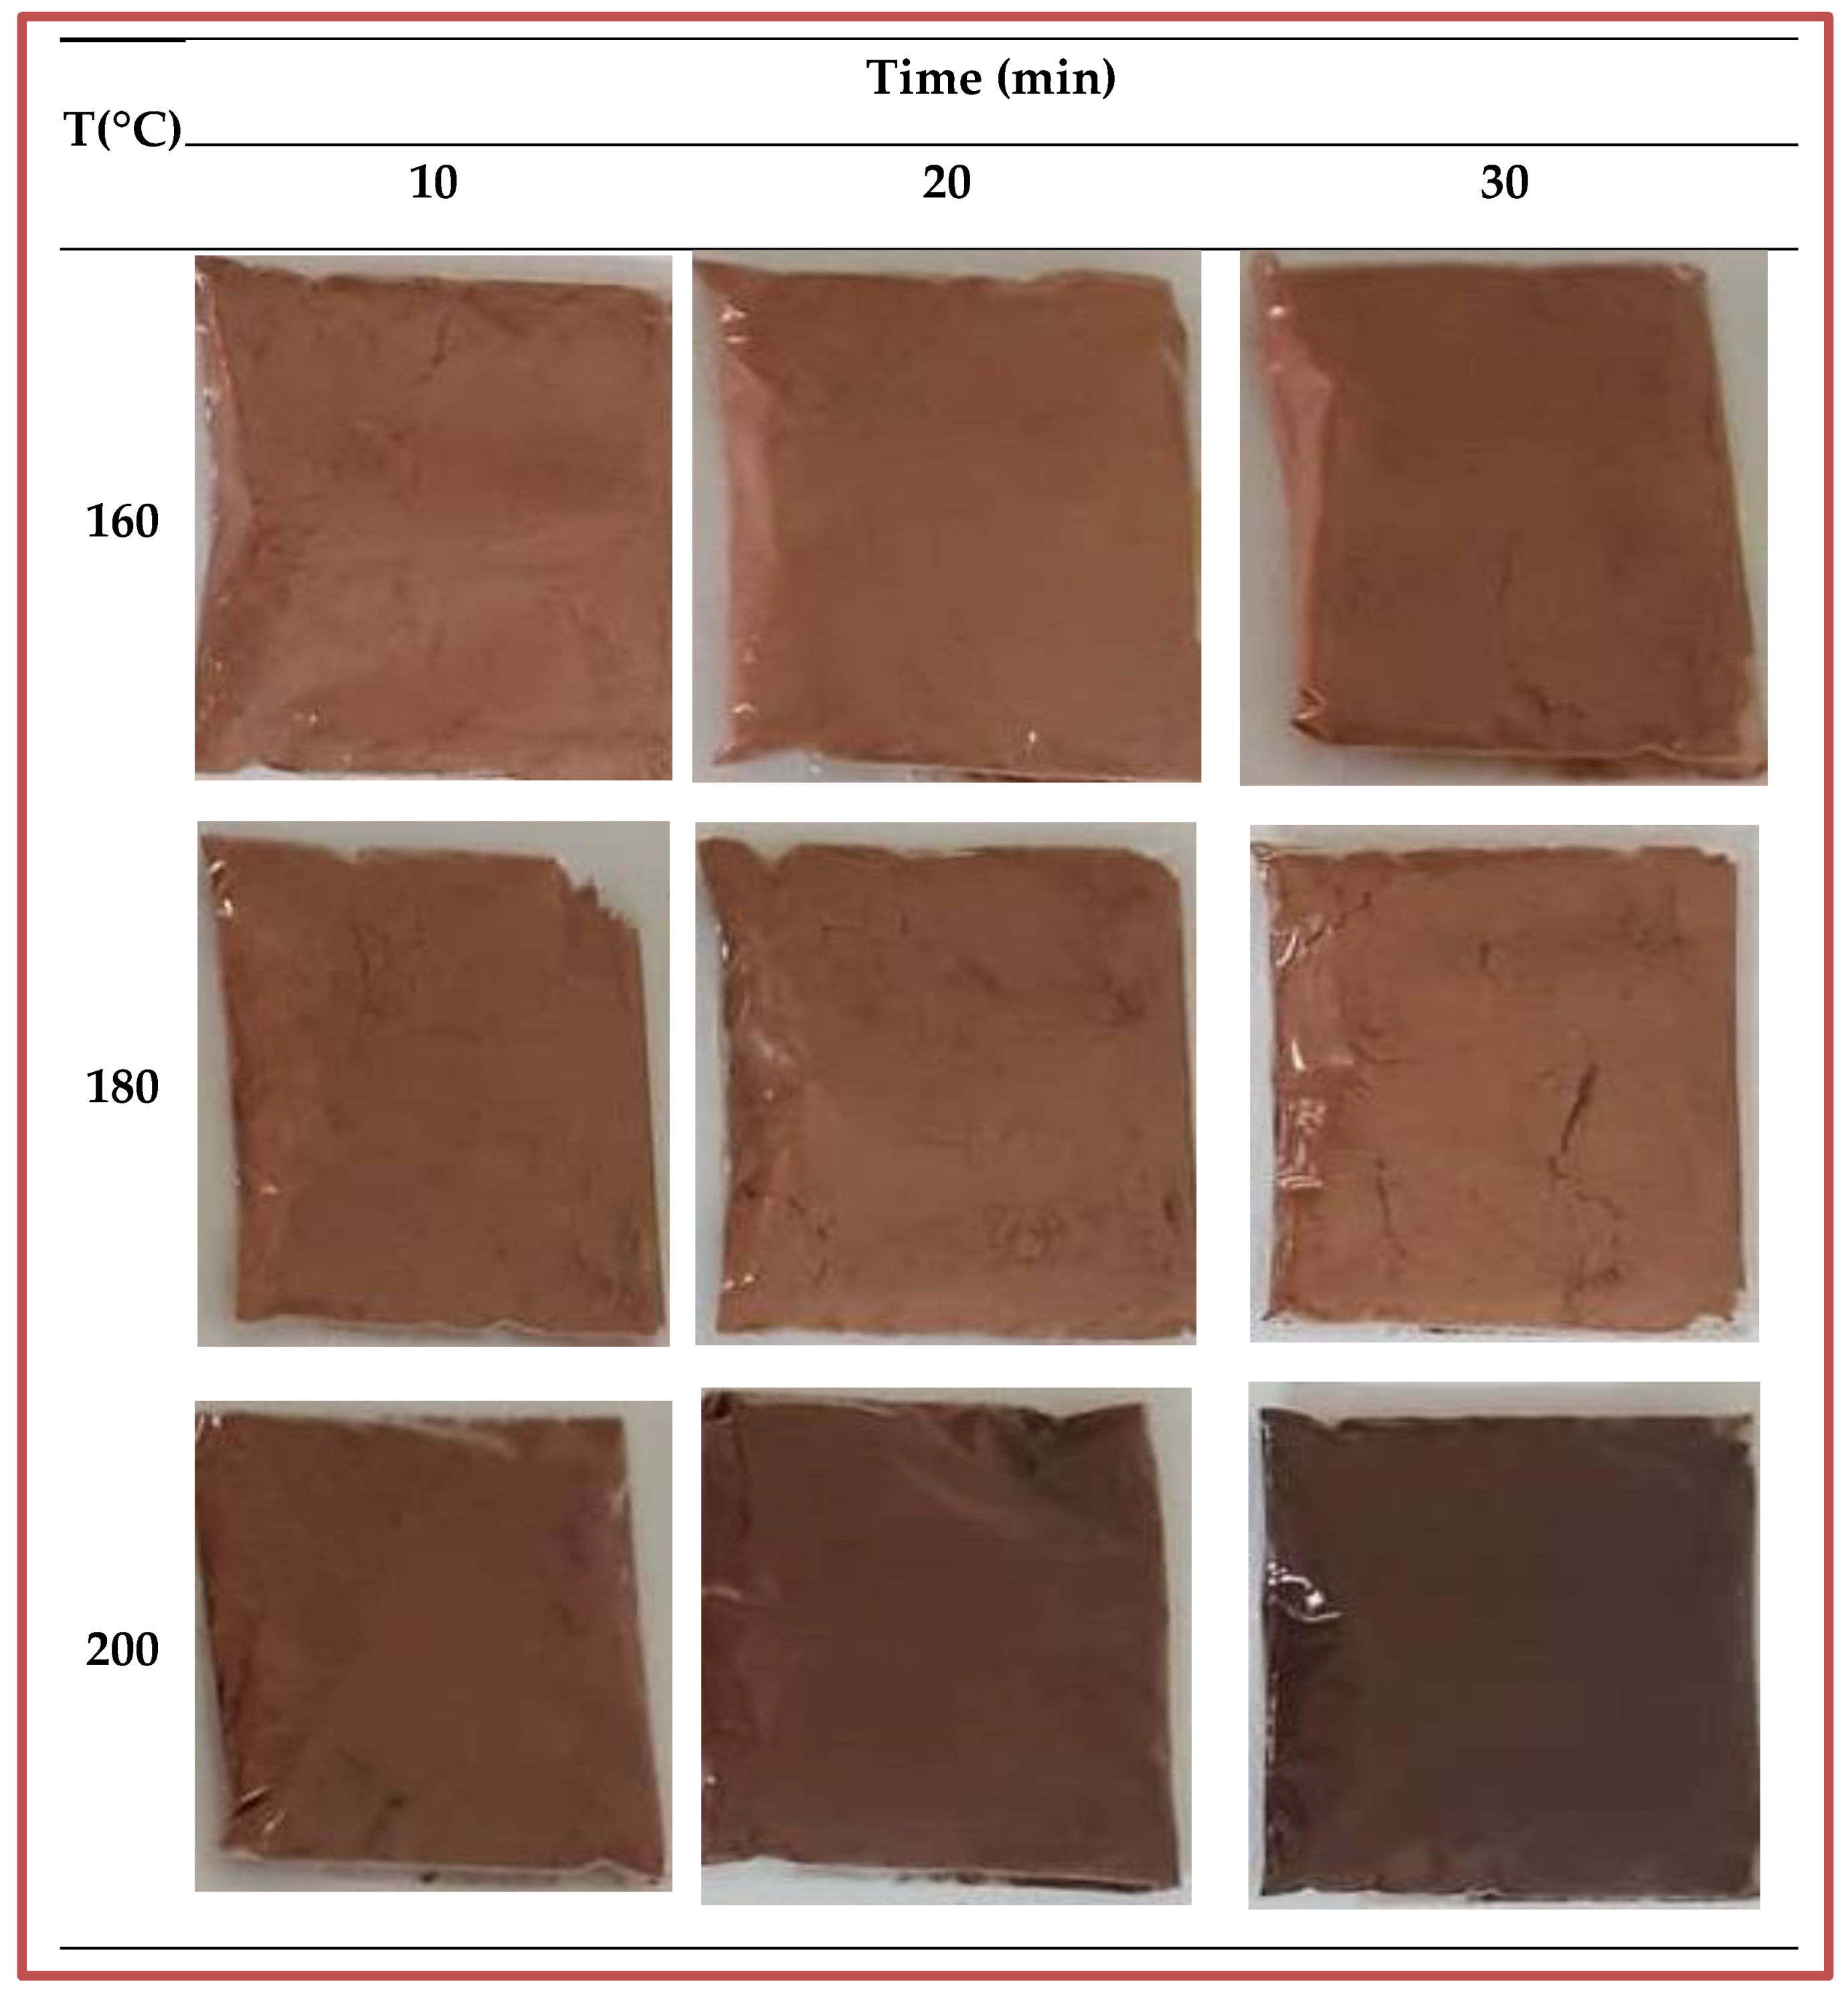
| T (°C) | t (min) | Moisture Content (% d.b.) | Bulk Density (kg/m3) | Hardness (N) | L*-Value | a*-Value | b*-Value | Roasting Level |
|---|---|---|---|---|---|---|---|---|
| 160 | 10 | 2.04 (0.01) | 515.4 (4.20) | 2673.93 (45.8) | 42.70 (0.015) | 14.39 (0.07) | 19.16 (0.06) | Medium Light |
| 20 | 1.99 (0.02) | 504 (4.2) | 2226.3 (112) | 41.33 (0.02) | 14.63 (0.02) | 19.39 (0.02) | Medium | |
| 30 | 1.96 (0.02) | 488.4 (4.2) | 1941.6 (83.2) | 38.42 (0.015) | 15.35 (0.04) | 20.12 (0.01) | Medium | |
| 180 | 10 | 1.90 (0.02) | 493.01 (4.2) | 1667.9 (74.3) | 37.36 (0.02) | 15.18 (0.02) | 19.94 (0.04) | Medium |
| 20 | 1.84 (0.03) | 475.66 (4.2) | 901.8 (43.5) | 35.26 (0.02) | 15.82 (0.03) | 20.58 (0.03) | Medium Dark | |
| 30 | 1.69 (0.05) | 431.49 (4.2) | 756.6 (29.9) | 32.67 (0.02) | 17.03 (0.02) | 21.79 (0.02) | Medium Dark | |
| 200 | 10 | 1.55 (0.02) | 415.52 (4.2) | 606.3 (11.8) | 30.22 (0.015) | 16.87 (0.03) | 21.57 (0.04) | Medium Dark |
| 20 | 1.33 (0.02) | 357.4 (4.2) | 321.43 (68.6) | 25.36 (0.01) | 18.26 (0.03) | 22.95 (0.05) | Dark | |
| 30 | 1.21 (0.05) | 330.09 (4.2) | 281 (1.00) | 22.03 (0.02) | 20.02 (0.07) | 24.70 (0.03) | Dark |
| T (°C) | t (min) | Extraction Yield (g/g) | pH | Browning Index (Abs at 420 nm) | DPPH Radical Scavenging Activity (%) | Total Phenolic Content (mg/100 mg DW) |
|---|---|---|---|---|---|---|
| 160 | 10 | 0.0054 (0.0002) * | 5.67 (0.06) | 0.124 (0.0004) | 0.587 (0.053) | 7972.78 (383.2) |
| 20 | 0.0061 (0.0002) | 5.46 (0.058) | 0.132 (0.001) | 2.165 (0.564) | 8959.17 (751.1) | |
| 30 | 0.0070 (0.0002) | 5.37 (0.1) | 0.135 (0.001) | 4.811 (0.046) | 9758.89 (589.2) | |
| 180 | 10 | 0.00853 (0.0002) | 5.57 (0.06) | 0.135 (0.001) | 3.506 (0.123) | 9760.56 (1375.9) |
| 20 | 0.00913 (0.0002) | 5.16 (0.1) | 0.145 (0.0004) | 32.764 (4.569) | 10,068.89 (317.9) | |
| 30 | 0.00963 (0.0002) | 4.93 (0.06) | 0.155 (0.001) | 18.539 (2.338) | 11,029.17 (641.6) | |
| 200 | 10 | 0.01053 (0.0002) | 5.37 (0.05) | 0.158 (0.0003) | 6.674 (0.554) | 11,086.39 (498.5) |
| 20 | 0.01073 (0.0002) | 4.90 (0.10) | 0.181 (0.001) | 64.046 (1.757) | 11,719.72 (448.7) | |
| 30 | 0.01163 (0.0002) | 4.56 (0.06) | 0.188 (0.001) | 72.919 (0.250) | 17,191.67 (1154) |
| Property | pH | Antioxidants activity | Total phenolic contents | Browning Index | Color | Aroma | Taste | Overall Preference |
|---|---|---|---|---|---|---|---|---|
| pH | 1 | |||||||
| Antioxidants activity | −0.823 ** | 1 | ||||||
| Total phenolic contents | −0.847 ** | 0.732 ** | 1 | |||||
| Browning Index | −0.943 ** | 0.890 ** | 0.846 ** | 1 | ||||
| Color | −0.585 ** | 0.465 * | 0.278 | 0.592 ** | 1 | |||
| Aroma | −0.439 * | 0.248 | 0.148 | 0.426 * | 0.880 ** | 1 | ||
| Taste | −0.631 ** | 0.509 ** | 0.300 | 0.676 ** | 0.914 ** | 0.841 ** | 1 | |
| Overall preference | −0.572 ** | 0.450 * | 0.248 | 0.596 ** | 0.967 ** | 0.938 ** | 0.953 ** | 1 |
| Roasting Conditions | Color | Aroma | Taste | Overall Preference | |
|---|---|---|---|---|---|
| T (°C) | t (min) | ||||
| 160 | 10 | 2.73 (0.46) | 2.60 (0.51) | 1.93 (0.42) | 2.73 (0.46) |
| 20 | 4.33 (0.49) | 3.53 (0.52) | 2.40 (0.40) | 4.07 (0.26) | |
| 30 | 5.27 (0.46) | 4.47 (0.52) | 4.53 (0.31) | 4.80 (0.41) | |
| 180 | 10 | 5.33 (0.49) | 5.67 (0.49) | 5.47 (0.31) | 5.07 (0.26) |
| 20 | 5.93 (0.26) | 6.00 (0.38) | 6.67 (0.46) | 5.67 (0.49) | |
| 30 | 6.13 (0.52) | 6.53 (0.52) | 7.00 (0.20) | 6.13 (0.35) | |
| 200 | 10 | 6.07 (0.59) | 6.60 (0.51) | 7.33 (0.23) | 6.13 (0.35) |
| 20 | 6.67 (0.49) | 6.20 (0.41) | 5.53 (0.61) | 6.67 (0.49) | |
| 30 | 5.13 (0.52) | 4.27 (0.88) | 4.40 (0.40) | 4.73 (0.46) | |
| Property | Regression Coefficients of the Second-Degree Model | ||||||
|---|---|---|---|---|---|---|---|
| β0 | β1 | β11 | β2 | β22 | β12 | R2 | |
| Hardness (N) | 31489 *** | −266.8 *** | 0.582 *** | −192.9 *** | 1.714 *** | 0.509 *** | 0.985 |
| Moisture content (% d.b.) | −7.31 *** | 0.1133 *** | −0.00034 *** | 0.0463 *** | 0.000056 | −0.000329 *** | 0.989 |
| Bulk Density (kg/m3) | −1690 *** | 26.51 *** | −0.07896 *** | 10.26 *** | −0.0004 | −0.073 *** | 0.989 |
| L*-value | −52.7 ** | 1.312 *** | −0.00441 *** | 0.625 *** | −0.00076 | −0.004892 ** | 0.996 |
| a*-value | 55.05 *** | −0.482 *** | 0.001436 *** | −0.4879 *** | 0.002361 *** | 0.002738 *** | 0.999 |
| b*-value | 57.66 *** | −0.4568 *** | 0.001363 *** | −0.4851 *** | 0.0024 *** | 0.002713 *** | 0.999 |
| Extraction yield (g/g) | −0.05376 ** | 0.000558 ** | −0.000001 ** | 0.000106 | 0.000001 * | −0.000001 * | 0.994 |
| pH | 6.27 ** | −0.0014 | 0.0000 | 0.0569 ** | 0.000667 * | −0.000625 ** | 0.974 |
| Browning index | 0.6276 ** | −0.006357 ** | −0.002062 ** | 0.000019 ** | −0.000034 ** | 0.000025 ** | 0.993 |
| DPPH radical scavenging activity (%) | 576 * | −6.65 * | 0.01733 * | −6.47 * | −0.1515 ** | 0.0775 ** | 0.935 |
| Total phenolic contents (mg/100 mg DW) | 93199 * | −891 * | 2.41 * | −1421 ** | 10.18 * | 6.41 ** | 0.871 |
| Sensory color | −82.78 ** | 0.8228 ** | −0.001917 ** | 1.0333 ** | −0.005333 ** | −0.004333 ** | 0.936 |
| Sensory aroma | −141.31 ** | 1.469 ** | −0.003639 ** | 1.0406 ** | −0.00222 * | −0.00525 ** | 0.915 |
| Sensory taste | −194.5 ** | 2.028 ** | −0.005056 ** | 1.167 ** | 0.00244 | −0.006917 ** | 0.921 |
| Overall preference | −83.33 ** | 0.8261 ** | −0.001917 ** | 1.0222 ** | −0.005333 ** | −0.004333 ** | 0.928 |
© 2019 by the authors. Licensee MDPI, Basel, Switzerland. This article is an open access article distributed under the terms and conditions of the Creative Commons Attribution (CC BY) license (http://creativecommons.org/licenses/by/4.0/).
Share and Cite
Fikry, M.; Yusof, Y.A.; Al-Awaadh, A.M.; Rahman, R.A.; Chin, N.L.; Mousa, E.; Chang, L.S. Effect of the Roasting Conditions on the Physicochemical, Quality and Sensory Attributes of Coffee-Like Powder and Brew from Defatted Palm Date Seeds. Foods 2019, 8, 61. https://doi.org/10.3390/foods8020061
Fikry M, Yusof YA, Al-Awaadh AM, Rahman RA, Chin NL, Mousa E, Chang LS. Effect of the Roasting Conditions on the Physicochemical, Quality and Sensory Attributes of Coffee-Like Powder and Brew from Defatted Palm Date Seeds. Foods. 2019; 8(2):61. https://doi.org/10.3390/foods8020061
Chicago/Turabian StyleFikry, Mohammad, Yus Aniza Yusof, Alhussein M. Al-Awaadh, Russly Abdul Rahman, Nyuk Ling Chin, Esraa Mousa, and Lee Sin Chang. 2019. "Effect of the Roasting Conditions on the Physicochemical, Quality and Sensory Attributes of Coffee-Like Powder and Brew from Defatted Palm Date Seeds" Foods 8, no. 2: 61. https://doi.org/10.3390/foods8020061