Flow Cytometry to Assess the Counts and Physiological State of Cronobacter sakazakii Cells after Heat Exposure

 , , and
Abstract
:
1. Introduction
2. Materials and Methods
2.1. Culture Preparation
2.2. Dead-Cells Suspensions (DCS)
2.3. Non-Heat-Treated (nTCS) and Heat-Treated (TCS) Cell Suspensions
2.4. FC Analysis
2.5. FC Events versus Plate Counts
3. Results
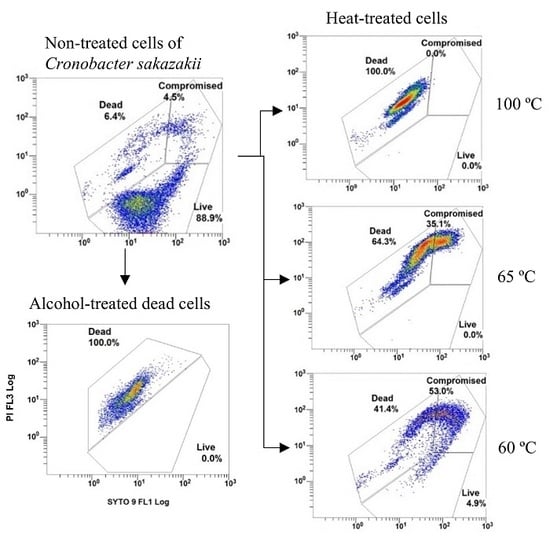
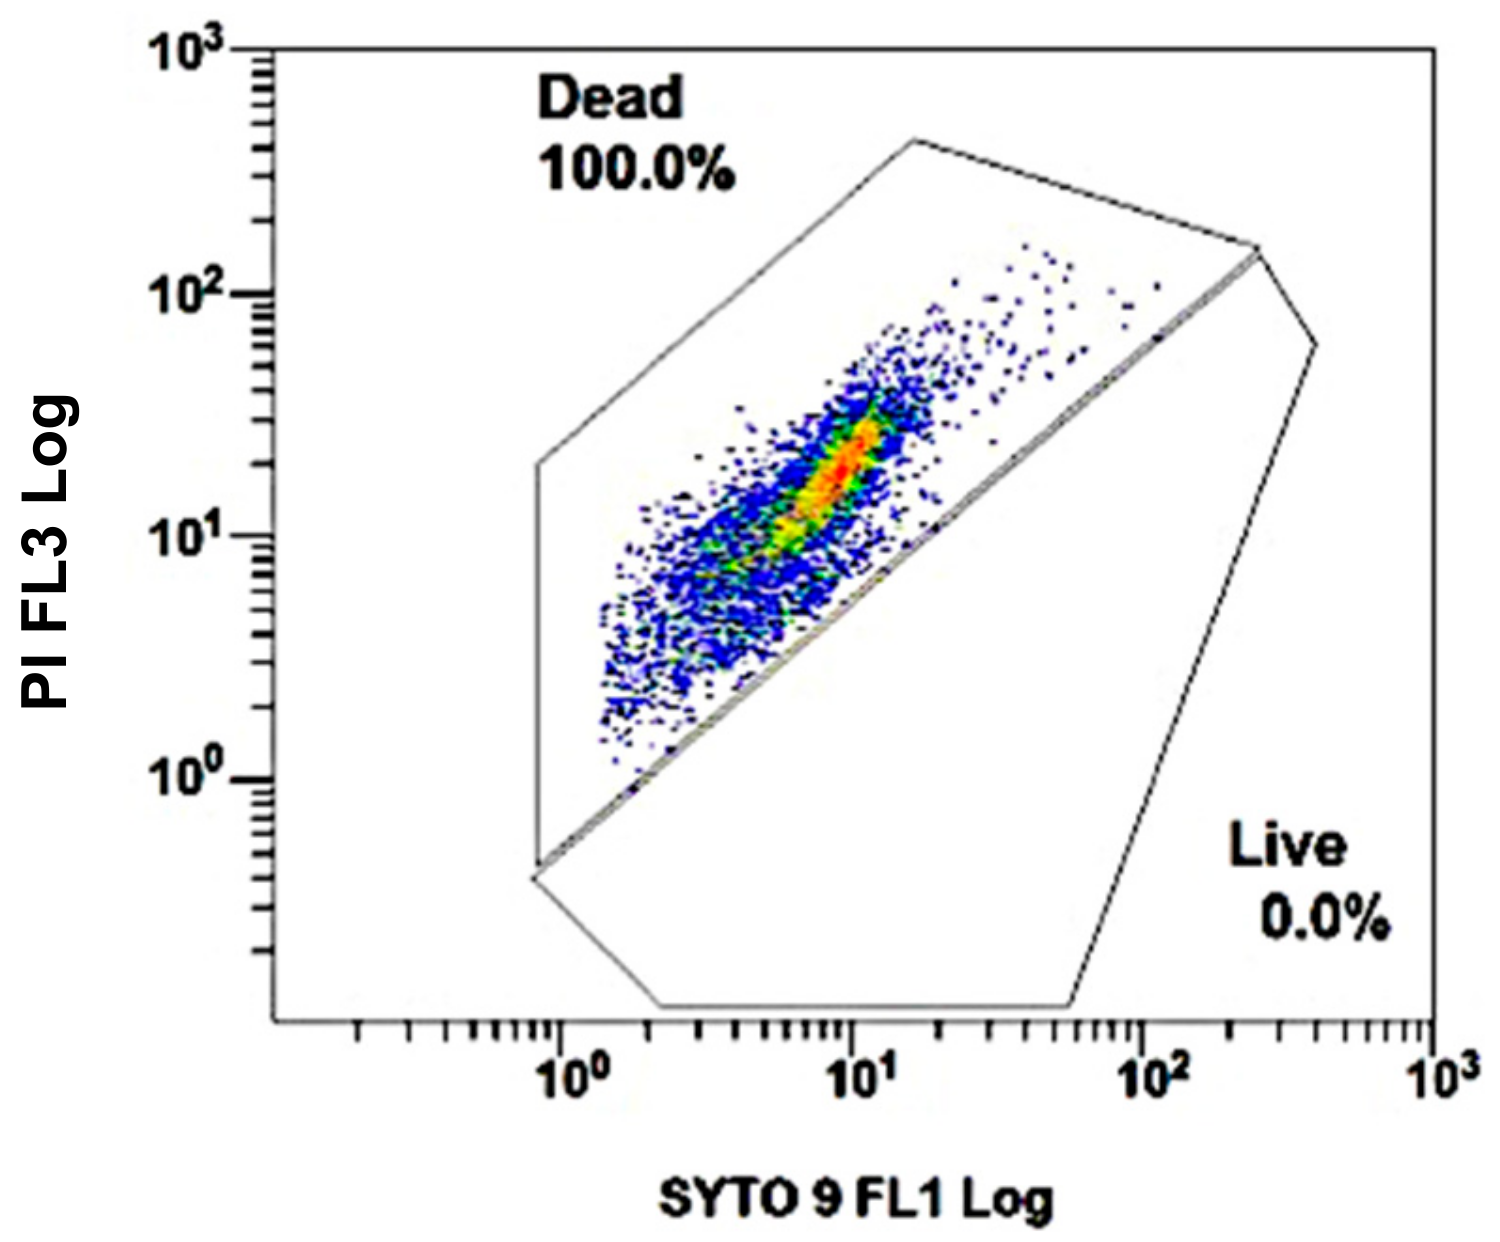
3.1. DCS
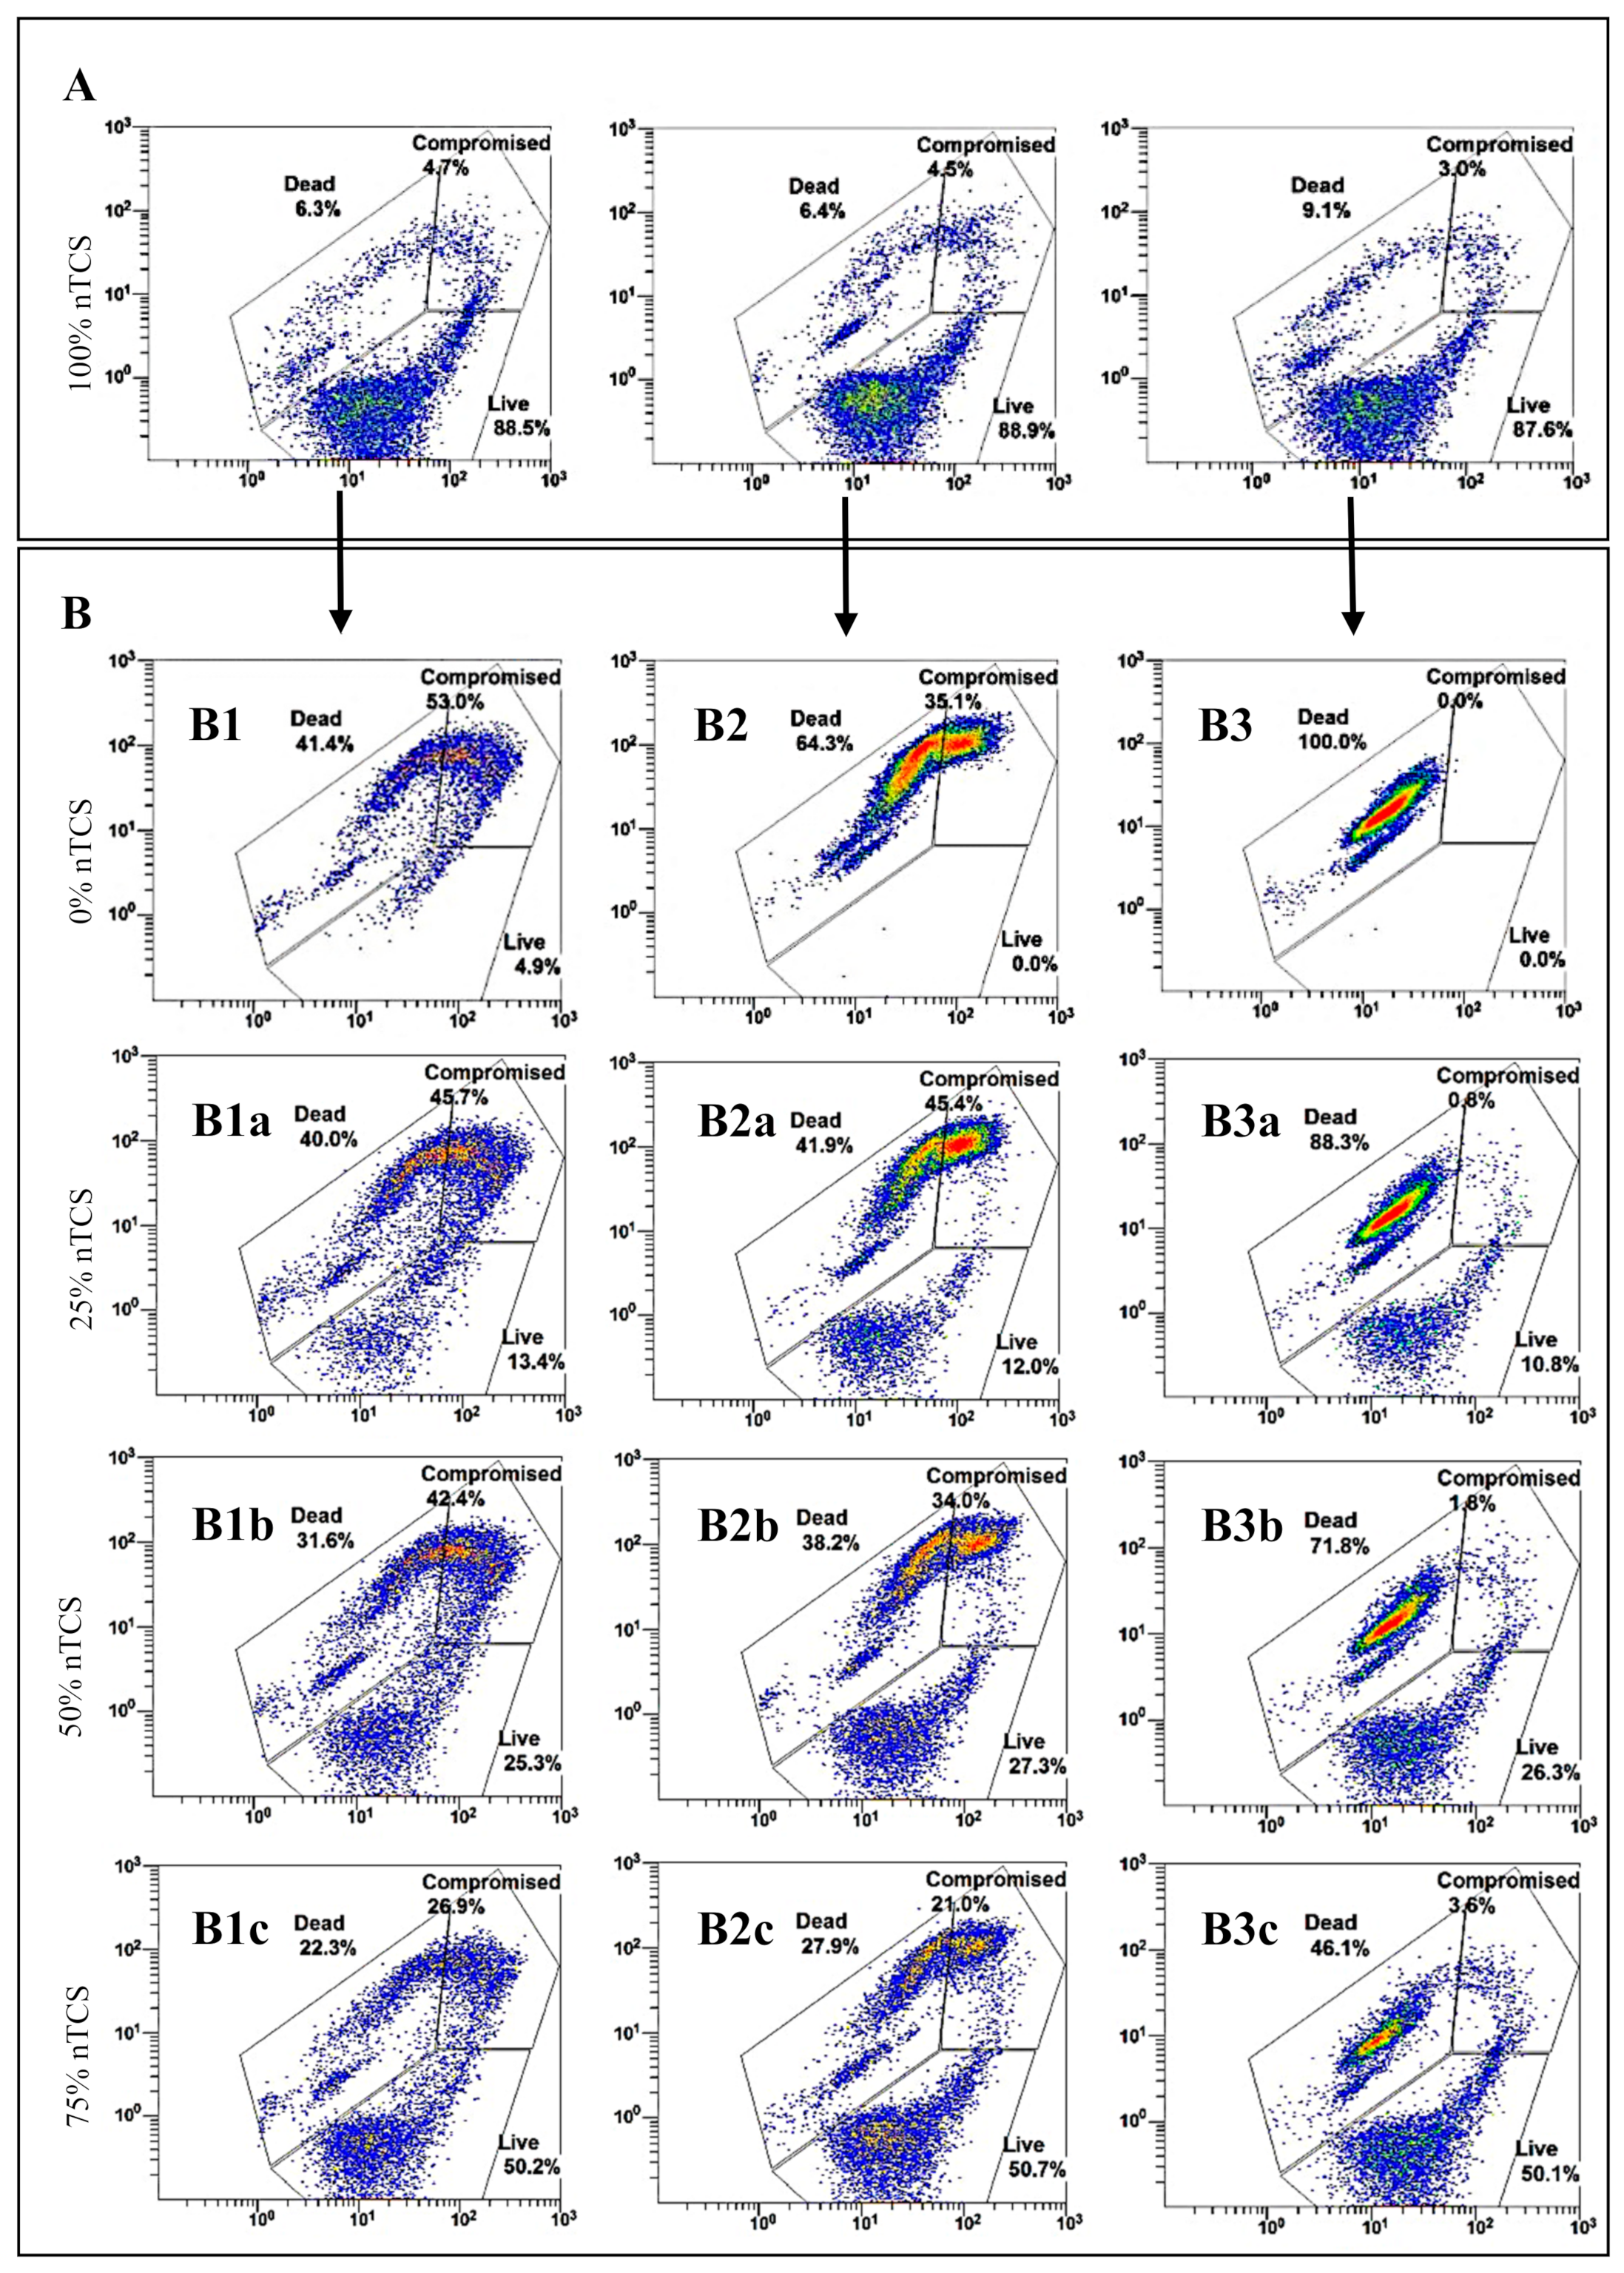
3.2. nTCS and TCS
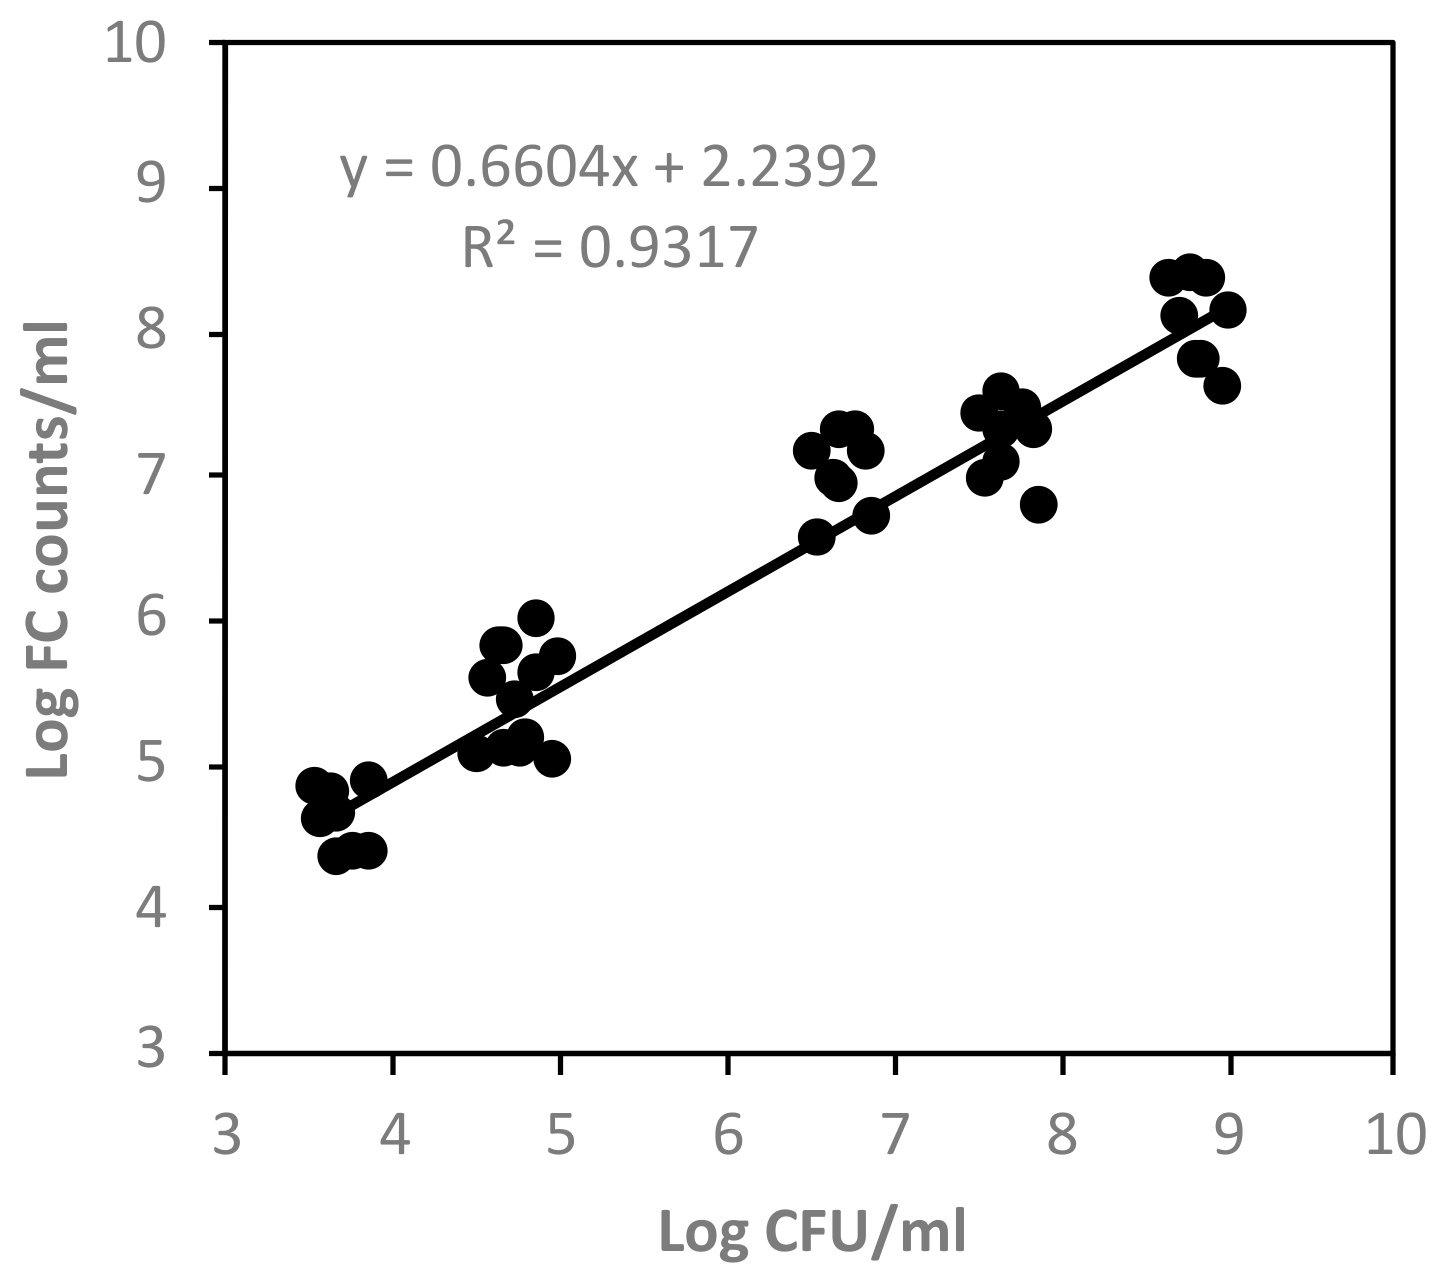
3.3. FC Events versus Plate Counts
4. Discussion
5. Conclusions
Author Contributions
Funding
Conflicts of Interest
References
- Farmer, J.J.; Asbury, M.A.; Hickman, F.W.; Brenner, D.J. Enterobacter sakazakii: A new species of Enterobacteriaceae isolated from clinical specimens. Int. J. Syst. Bacteriol. 1980, 30, 569–584. [Google Scholar] [CrossRef] [Green Version]
- Iversen, C.; Mullane, N.; McCardell, B.; Tall, B.D.; Lehner, A.; Fanning, S.; Stephan, R.; Joosten, H. Cronobacter gen. nov., a new genus to accommodate the biogroups of Enterobacter sakazakii, and proposal of Cronobacter sakazakii gen. nov., comb. nov., Cronobacter malonaticus sp. nov., Cronobacter turicensis sp. nov., Cronobacter muytjensii sp. nov. Int. J. Syst. Evol. Microbiol. 2008, 58, 1442–1447. [Google Scholar] [CrossRef] [PubMed]
- Beuchat, L.R.; Kim, H.; Gurtler, J.B.; Lin, L.-C.; Ryu, J.-H.; Richards, G.M. Cronobacter sakazakii in foods and factors affecting its survival, growth, and inactivation. Int. J. Food Microbiol. 2009, 136, 204–213. [Google Scholar] [CrossRef] [PubMed]
- Pagotto, F.; Nazarowec-White, M.; Bidawid, S.; Farber, J. Enterobacter sakazakii: Infectivity and enterotoxin production in vitro and in vivo. J. Food Prot. 2003, 66, 370–376. [Google Scholar] [CrossRef] [PubMed]
- Raghav, M.; Aggarwal, P.K. Purification and characterization of Enterobacter sakazakii enterotoxin. Can. J. Microbiol 2007, 53, 750–755. [Google Scholar] [CrossRef]
- Lai, K.K. Enterobacter sakazakii infections among neonates, infants, children, and adults. Medicine 2001, 80, 113–122. [Google Scholar] [CrossRef]
- International Commission for Microbiological Specification for Foods. Microorganisms in Foods 7: Microbiological Testing in Food Safety Management, 1st ed.; Springer: New York, NY, USA, 2002; ISBN 978-1-4613-5221-1. [Google Scholar]
- Arvanitoyannis, I.S. Enterobacter sakazakii and Salmonella in powdered infant formula: Meeting report. Int. J. Food Sci. Technol. 2009, 45, 858. [Google Scholar]
- Biering, G.; Karlsson, S.; Clark, N.C.; Jonsdottir, K.E.; Ludvigsson, P.; Steingrimsson, O. Three cases of neonatal meningitis caused by Enterobacter sakazakii in powdered milk. J. Clin. Microbiol. 1989, 27, 2054–2056. [Google Scholar]
- Simmons, B.P.; Gelfand, M.S.; Haas, M.; Metts, L.; Ferguson, J. Enterobacter sakazakii infections in neonates associated with intrinsic contamination of a powdered infant formula. Infect. Control. Hosp. Epidemiol. 1989, 10, 398–401. [Google Scholar] [CrossRef]
- Van Acker, J.; de Smet, F.; Muyldermans, G.; Bougatef, A.; Naessens, A.; Lauwers, S. Outbreak of necrotizing enterocolitis associated with Enterobacter sakazakii in powdered milk formula. J. Clin. Microbiol. 2001, 39, 293–297. [Google Scholar] [CrossRef] [Green Version]
- Centers for Disease Control and Prevention (CDC). Enterobacter sakazakii infections associated with the use of powdered infant formula—Tennessee, 2001. MMWR. Morb. Mortal. Wkly. Rep. 2002, 51, 297–300. [Google Scholar]
- Bar-Oz, B.; Preminger, A.; Peleg, O.; Block, C.; Arad, I. Enterobacter sakazakii infection in the newborn. Acta Paediatr. 2007, 90, 356–358. [Google Scholar] [CrossRef]
- WHO; FAO. Safe Preparation, Storage and Handling of Powdered Infant Formula: Guidelines. Available online: https://www.who.int/foodsafety/publications/micro/pif_guidelines.pdf (accessed on 4 November 2019).
- Arku, B.; Fanning, S.; Jordan, K. Flow cytometry to assess biochemical pathways in heat-stressed Cronobacter spp. (formerly Enterobacter sakazakii). J. Appl. Microbiol. 2011, 111, 616–624. [Google Scholar] [CrossRef] [PubMed]
- Jordan, K.N.; Oxford, L.; O’Byrne, C.P. Survival of low-pH stress by Escherichia coli O157:H7: Correlation between alterations in the cell envelope and increased acid tolerance. Appl. Environ. Microbiol. 1999, 65, 3048–3055. [Google Scholar]
- Arku, B.; Fanning, S.; Jordan, K. Heat adaptation and survival of Cronobacter spp. (formerly Enterobacter sakazakii). Foodborne Pathog. Dis. 2011, 8, 975–981. [Google Scholar] [CrossRef]
- Herrero, M.; Quiros, C.; Garcia, L.A.; Diaz, M. Use of flow cytometry to follow the physiological states of microorganisms in cider fermentation processes. Appl. Environ. Microbiol. 2006, 72, 6725–6733. [Google Scholar] [CrossRef] [Green Version]
- Bunthof, C.J.; Abee, T. Development of a flow cytometric method to analyze subpopulations of bacteria in probiotic products and dairy starters. Appl. Environ. Microbiol. 2002, 68, 2934–2942. [Google Scholar] [CrossRef] [Green Version]
- Baatout, S.; De Boever, P.; Mergeay, M. Temperature-induced changes in bacterial physiology as determined by flow cytometry. Ann. Microbiol. 2005, 55, 73–80. [Google Scholar]
- Kim, H.T.; Choi, H.J.; Kim, K.H. Flow cytometric analysis of Salmonella enterica serotype Typhimurium inactivated with supercritical carbon dioxide. J. Microbiol. Methods 2009, 78, 155–160. [Google Scholar] [CrossRef]
- Antolinos, V.; Esteban, M.D.; Ros-Chumillas, M.; Huertas, J.P.; Periago, P.M.; Palop, A.; Fernández, P.S. Assessment of the of acid shock effect on viability of Bacillus cereus and Bacillus weihenstephanensis using flow cytometry. Food Res. Int. 2014, 66, 306–312. [Google Scholar] [CrossRef]
- Pianetti, A.; Falcioni, T.; Bruscolini, F.; Sabatini, L.; Sisti, E.; Papa, S. Determination of the viability of Aeromonas hydrophila in different types of water by flow cytometry, and comparison with classical methods. Appl. Environ. Microbiol. 2005, 71, 7948–7954. [Google Scholar] [CrossRef] [PubMed] [Green Version]
- Ben-Amor, K.; Breeuwer, P.; Verbaarschot, P.; Rombouts, F.M.; Akkermans, A.D.L.; De Vos, W.M.; Abee, T. Multiparametric flow cytometry and cell sorting for the assessment of viable, injured, and dead Bifidobacterium cells during bile salt stress. Appl. Environ. Microbiol. 2002, 68, 5209–5216. [Google Scholar] [CrossRef] [PubMed] [Green Version]
- Ambriz-Aviña, V.; Contreras-Garduño, J.A.; Pedraza-Reyes, M. Applications of flow cytometry to characterize bacterial physiological responses. BioMed Res. Int. 2014. [Google Scholar] [CrossRef]
- Papadimitriou, K.; Pratsinis, H.; Nebe-von-Caron, G.; Kletsas, D.; Tsakalidou, E. Rapid assessment of the physiological status of Streptococcus macedonicus by flow cytometry and fluorescence probes. Int. J. Food Microbiol. 2006, 111, 197–205. [Google Scholar] [CrossRef] [PubMed]
- Adan, A.; Alizada, G.; Kiraz, Y.; Baran, Y.; Nalbant, A. Flow cytometry: Basic principles and applications. Crit. Rev. Biotechnol. 2017, 37, 163–176. [Google Scholar] [CrossRef] [PubMed]
- Nebe-von-Caron, G.; Stephens, P.; Hewitt, C.; Powell, J.; Badley, R. Analysis of bacterial function by multi-colour fluorescence flow cytometry and single cell sorting. J. Microbiol. Methods 2000, 42, 97–114. [Google Scholar] [CrossRef]
- Shapiro, H.M. Microbial analysis at the single-cell level: Tasks and techniques. J. Microbiol. Methods 2000, 42, 3–16. [Google Scholar] [CrossRef]
- Subires, A.; Yuste, J.; Capellas, M. Flow cytometry immunodetection and membrane integrity assessment of Escherichia coli O157:H7 in ready-to-eat pasta salad during refrigerated storage. Int. J. Food Microbiol. 2014, 168–169, 47–56. [Google Scholar] [CrossRef] [PubMed]
- Kell, D.B.; Kaprelyants, A.S.; Weichart, D.H.; Harwood, C.R.; Barer, M.R. Viability and activity in readily culturable bacteria: A review and discussion of the practical issues. Antonie Leeuwenhoek 1998, 73, 169–187. [Google Scholar] [CrossRef]
- Wesche, A.M.; Gurtler, J.B.; Marks, B.P.; Ryser, E.T. Stress, sublethal injury, resuscitation, and virulence of bacterial foodborne pathogens. J. Food Prot. 2009, 72, 1121–1138. [Google Scholar] [CrossRef]
- Braux, A.S.; Minet, J.; Tamanai-Shacoori, Z.; Riou, G.; Cormier, M. Direct enumeration of injured Escherichia coli cells harvested onto membrane filters. J. Microbiol. Methods 1997, 31, 1–8. [Google Scholar] [CrossRef]
- Gregori, G.; Citterio, S.; Ghiani, A.; Labra, M.; Sgorbati, S.; Brown, S.; Denis, M. Resolution of viable and membrane-compromised bacteria in freshwater and marine waters based on analytical flow cytometry and nucleic acid double staining. Appl. Environ. Microbiol. 2001, 67, 4662–4670. [Google Scholar] [CrossRef] [PubMed] [Green Version]
- Zhao, X.; Zhong, J.; Wei, C.; Lin, C.-W.; Ding, T. Current perspectives on viable but non-culturable state in foodborne pathogens. Front. Microbiol. 2017, 8, 580. [Google Scholar] [CrossRef] [PubMed] [Green Version]
- Ueckert, J.E.; Nebe von-Caron, G.; Bos, A.P.; Ter Steeg, P.F. Flow cytometric analysis of Lactobacillus plantarum to monitor lag times, cell divisionand injury. Lett. Appl. Microbiol. 1997, 25, 295–299. [Google Scholar] [CrossRef] [PubMed]
- Lemarchand, K.; Parthuisot, N.; Catala, P.; Lebaron, P. Comparative assessment of epifluorescence microscopy, flow cytometry and solid-phase cytometry used in the enumeration of specific bacteria in water. Aquat. Microb. Ecol. 2001, 25, 301–309. [Google Scholar] [CrossRef] [Green Version]
- Choi, M.J.; Kim, S.A.; Lee, N.Y.; Rhee, M.S. New decontamination method based on caprylic acid in combination with citric acid or vanillin for eliminating Cronobacter sakazakii and Salmonella enterica serovar Typhimurium in reconstituted infant formula. Int. J. Food Microbiol. 2013, 166, 499–507. [Google Scholar] [CrossRef]
- Joshi, S.S.; Howell, A.B.; D’Souza, D.H. Cronobacter sakazakii reduction by blueberry proanthocyanidins. Food Microbiol. 2014, 39, 127–131. [Google Scholar] [CrossRef]
- Lehner, A.; Riedel, K.; Eberl, L.; Breeuwer, P.; Diep, B.; Stephan, R. Biofilm formation, extracellular polysaccharide production, and cell-to-cell signaling in various Enterobacter sakazakii strains: Aspects promoting environmental persistence. J. Food Prot. 2005, 68, 2287–2294. [Google Scholar] [CrossRef]
- Parra-Flores, J.; Juneja, V.; de Fernando, G.G.; Aguirre, J. Variability in cell response of Cronobacter sakazakii after mild-heat treatments and its impact on food safety. Front. Microbiol. 2016, 7, 1–14. [Google Scholar] [CrossRef]
- Chen, C.-Y.; Nace, G.W.; Irwin, P.L. A 6×6 drop plate method for simultaneous colony counting and MPN enumeration of Campylobacter jejuni, Listeria monocytogenes, and Escherichia coli. J. Microbiol. Methods 2003, 55, 475–479. [Google Scholar] [CrossRef]
- Edelson-Mammel, S.G.; Buchanan, R.L. Thermal inactivation of Enterobacter sakazakii in rehydrated infant formula. J. Food Prot. 2004, 67, 60–63. [Google Scholar] [CrossRef] [PubMed]
- Gunasekera, T.S.; Attfield, P.V.; Veal, D.A. A flow cytometry method for rapid detection and enumeration of total bacteria in milk. Appl. Environ. Microbiol. 2000, 66, 1228–1232. [Google Scholar] [CrossRef] [PubMed] [Green Version]
- Iversen, C.; Lane, M.; Forsythe, S.J. The growth profile, thermotolerance and biofilm formation of Enterobacter sakazakii grown in infant formula milk. Lett. Appl. Microbiol. 2004, 38, 378–382. [Google Scholar] [CrossRef] [PubMed]
- Jamal, M.; Ahmad, W.; Andleeb, S.; Jalil, F.; Imran, M.; Nawaz, M.A.; Hussain, T.; Ali, M.; Rafiq, M.; Kamil, M.A. Bacterial biofilm and associated infections. J. Chin. Med. Assoc. 2018, 81, 7–11. [Google Scholar] [CrossRef]
- Miquel, S.; Lagrafeuille, R.; Souweine, B.; Forestier, C. Anti-biofilm activity as a health issue. Front. Microbiol. 2016, 7, 592. [Google Scholar] [CrossRef]
- Galié, S.; García-Gutiérrez, C.; Miguélez, E.M.; Villar, C.J.; Lombó, F. Biofilms in the food industry: Health aspects and control methods. Front. Microbiol. 2018, 9, 898. [Google Scholar] [CrossRef]
- Fredrickson, A.G.; Ramkrishna, D.; Tsuchiya, H.M. Statistics and dynamics of procaryotic cell populations. Math. Biosci. 1967, 1, 327–374. [Google Scholar] [CrossRef]
- Baranyi, J.; Roberts, T.A. A dynamic approach to predicting bacterial growth in food. Int. J. Food Microbiol. 1994, 23, 277–294. [Google Scholar] [CrossRef]
- Stocks, S.M. Mechanism and use of the commercially available viability stain, BacLight. Cytometry 2004, 61, 189–195. [Google Scholar] [CrossRef]
- Müller, S.; Nebe-von-Caron, G. Functional single-cell analyses: Flow cytometry and cell sorting of microbial populations and communities. FEMS Microbiol. Rev. 2010, 34, 554–587. [Google Scholar] [CrossRef] [Green Version]
- Manini, E.; Danovaro, R. Synoptic determination of living/dead and active/dormant bacterial fractions in marine sediments. FEMS Microbiol. Ecol. 2006, 55, 416–423. [Google Scholar] [CrossRef] [PubMed] [Green Version]
- Berney, M.; Hammes, F.; Bosshard, F.; Weilenmann, H.U.; Egli, T. Assessment and interpretation of bacterial viability by using the LIVE/DEAD BacLight kit in combination with flow cytometry. Appl. Environ. Microbiol. 2007, 73, 3283–3290. [Google Scholar] [CrossRef] [Green Version]
- Díaz, M.; Herrero, M.; García, L.A.; Quirós, C. Application of flow cytometry to industrial microbial bioprocesses. Biochem. Eng. J. 2010, 48, 385–407. [Google Scholar] [CrossRef]
- Sträuber, H.; Müller, S. Viability states of bacteria-specific mechanisms of selected probes. Cytom. Part A 2010, 77, 623–634. [Google Scholar] [CrossRef] [PubMed]
- Barbesti, S.; Citterio, S.; Labra, M.; Baroni, M.D.; Neri, M.G.; Sgorbati, S. Two and three-color fluorescence flow cytometric analysis of immunoidentified viable bacteria. Cytometry 2000, 40, 214–218. [Google Scholar] [CrossRef]
- Ben-Amor, K.; Heilig, H.; Smidt, H.; Vaughan, E.E.; Abee, T.; de Vos, W.M. Genetic diversity of viable, injured, and dead fecal bacteria assessed by fluorescence-activated cell sorting and 16S rRNA gene analysis. Appl. Environ. Microbiol. 2005, 71, 4679–4689. [Google Scholar] [CrossRef] [PubMed] [Green Version]
- Saegeman, V.S.M.; De Vos, R.; Tebaldi, N.D.; van der Wolf, J.M.; Bergervoet, J.H.W.; Verhaegen, J.; Lismont, D.; Verduyckt, B.; Ectors, N.L. Flow cytometric viability assessment and transmission electron microscopic morphological study of bacteria in glycerol. Microsc. Microanal. 2007, 13, 18–29. [Google Scholar] [CrossRef] [PubMed] [Green Version]
- Silva, F.; Ferreira, S.; Queiroz, J.A.; Domingues, F.C. Coriander (Coriandrum sativum L.) essential oil: Its antibacterial activity and mode of action evaluated by flow cytometry. J. Med. Microbiol. 2011, 60, 1479–1486. [Google Scholar] [CrossRef] [Green Version]
- Sachidanandham, R.; Yew-Hoong Gin, K.; Laa Poh, C. Monitoring of active but non-culturable bacterial cells by flow cytometry. Biotechnol. Bioeng. 2005, 89, 24–31. [Google Scholar] [CrossRef]
- Virta, M.; Lineri, S.; Kankaanpää, P.; Karp, M.; Peltonen, K.; Nuutila, J.; Lilius, E.M. Determination of complement-mediated killing of bacteria by viability staining and bioluminescence. Appl. Environ. Microbiol. 1998, 64, 515–519. [Google Scholar]
- Berney, M.; Weilenmann, H.-U.; Egli, T. Flow-cytometric study of vital cellular functions in Escherichia coli during solar disinfection (SODIS). Microbiology 2006, 152, 1719–1729. [Google Scholar] [CrossRef] [PubMed] [Green Version]
- Hoefel, D.; Grooby, W.L.; Monis, P.T.; Andrews, S.; Saint, C.P. Enumeration of water-borne bacteria using viability assays and flow cytometry: A comparison to culture-based techniques. J. Microbiol. Methods 2003, 55, 585–597. [Google Scholar] [CrossRef]
- Joux, F.; Lebaron, P. Use of fluorescent probes to assess physiological functions of bacteria at single-cell level. Microbes Infect. 2000, 2, 1523–1535. [Google Scholar] [CrossRef]
- Rosenberg, M.; Azevedo, N.F.; Ivask, A. Propidium iodide staining underestimates viability of adherent bacterial cells. Sci. Rep. 2019, 9, 6483. [Google Scholar] [CrossRef] [PubMed] [Green Version]
- Chamberlain, J.; Moss, S.H. Lipid peroxidation and other membrane damage produced in Escherichia coli K1060 by near-UV radiation and deuterium oxide. Photochem. Photobiol. 1987, 45, 625–630. [Google Scholar] [CrossRef] [PubMed]
- Wagner, S.; Snipes, W. Effects of acridine plus near-ultraviolet light on the outer membrane of Escherichia coli. Photochem. Photobiol. 1982, 36, 255–258. [Google Scholar] [CrossRef] [PubMed]
- Yan, Q.Q.; Condell, O.; Power, K.; Butler, F.; Tall, B.D.; Fanning, S. Cronobacter species (formerly known as Enterobacter sakazakii) in powdered infant formula: A review of our current understanding of the biology of this bacterium. J. Appl. Microbiol. 2012, 113, 1–15. [Google Scholar] [CrossRef]
- Xu, Y.Z.; Métris, A.; Stasinopoulos, D.M.; Forsythe, S.J.; Sutherland, J.P. Effect of heat shock and recovery temperature on variability of single cell lag time of Cronobacter turicensis. Food Microbiol. 2015, 45, 195–204. [Google Scholar] [CrossRef]
- Forsythe, S.J. FSA Project B13010. Bactericidal Preparation of Powdered Infant Formula, Final Report. 2009. Available online: https://www.researchgate.net/publication/248707161_FSA_UK_Bacteriocidal_preparation_of_infant_formula (accessed on 4 November 2019).
- Pina-Pérez, M.C.; Rodrigo, D.; Martínez, A. Nonthermal inactivation of Cronobacter sakazakii in infant formula milk: A review. Crit. Rev. Food Sci. Nutr. 2016, 56, 1620–1629. [Google Scholar] [CrossRef]
- Turck, D. Safety aspects in preparation and handling of infant food. Ann. Nutr. Metab. 2012, 60, 211–214. [Google Scholar] [CrossRef]
- Marty, V.; Jasnin, M.; Fabiani, E.; Vauclare, P.; Gabel, F.; Trapp, M.; Peters, J.; Zaccai, G.; Franzetti, B. Neutron scattering: A tool to detect in vivo thermal stress effects at the molecular dynamics level in micro-organisms. J. R. Soc. Interface 2013, 10, 20130003. [Google Scholar] [CrossRef] [PubMed] [Green Version]
- Tehei, M.; Franzetti, B.; Madern, D.; Ginzburg, M.; Ginzburg, B.Z.; Giudici-Orticoni, M.-T.; Bruschi, M.; Zaccai, G. Adaptation to extreme environments: Macromolecular dynamics in bacteria compared in vivo by neutron scattering. EMBO Rep. 2004, 5, 66–70. [Google Scholar] [CrossRef] [PubMed] [Green Version]
- Koutsoumanis, K. A study on the variability in the growth limits of individual cells and its effect on the behavior of microbial populations. Int. J. Food Microbiol. 2008, 128, 116–121. [Google Scholar] [CrossRef] [PubMed]
- Metris, A.; George, S.M.; Mackey, B.M.; Baranyi, J. Modeling the variability of single-cell lag times for Listeria innocua populations after sublethal and lethal heat treatments. Appl. Environ. Microbiol. 2008, 74, 6949–6955. [Google Scholar] [CrossRef] [Green Version]
- Aguirre, J.S.; González, A.; Özçelik, N.; Rodríguez, M.R.; García de Fernando, G.D. Modeling the Listeria innocua micropopulation lag phase and its variability. Int. J. Food Microbiol. 2013, 164, 60–69. [Google Scholar] [CrossRef]
- Aguirre, J.S.; Pin, C.; Rodriguez, M.R.; Garcia de Fernando, G.D. Analysis of the variability in the number of viable bacteria after mild heat treatment of food. Appl. Environ. Microbiol. 2009, 75, 6992–6997. [Google Scholar] [CrossRef] [Green Version]
- Lianou, A.; Koutsoumanis, K.P. Effect of the growth environment on the strain variability of Salmonella enterica kinetic behavior. Food Microbiol. 2011, 28, 828–837. [Google Scholar] [CrossRef]
- Davey, H.M. Flow cytometric techniques for the detection of microorganisms. Meth. Cell Sci. 2002, 24, 91–97. [Google Scholar] [CrossRef]
- Zacharias, N.; Kistemann, T.; Schreiber, C. Application of flow cytometry and PMA-qPCR to distinguish between membrane intact and membrane compromised bacteria cells in an aquatic milieu. Int. J. Hyg. Environ. Health 2015, 218, 714–722. [Google Scholar] [CrossRef]


© 2019 by the authors. Licensee MDPI, Basel, Switzerland. This article is an open access article distributed under the terms and conditions of the Creative Commons Attribution (CC BY) license (http://creativecommons.org/licenses/by/4.0/).
Share and Cite
Cal-Sabater, P.; Caro, I.; Castro, M.J.; Cao, M.J.; Mateo, J.; Quinto, E.J. Flow Cytometry to Assess the Counts and Physiological State of Cronobacter sakazakii Cells after Heat Exposure. Foods 2019, 8, 688. https://doi.org/10.3390/foods8120688
Cal-Sabater P, Caro I, Castro MJ, Cao MJ, Mateo J, Quinto EJ. Flow Cytometry to Assess the Counts and Physiological State of Cronobacter sakazakii Cells after Heat Exposure. Foods. 2019; 8(12):688. https://doi.org/10.3390/foods8120688
Chicago/Turabian StyleCal-Sabater, Paloma, Irma Caro, María J. Castro, María J. Cao, Javier Mateo, and Emiliano J. Quinto. 2019. "Flow Cytometry to Assess the Counts and Physiological State of Cronobacter sakazakii Cells after Heat Exposure" Foods 8, no. 12: 688. https://doi.org/10.3390/foods8120688