
The Difference between PC-Based and Immersive Virtual Reality Food Purchase Environments on Useability, Presence, and Physiological Responses
Abstract
:1. Introduction
2. Methods
2.1. Participants
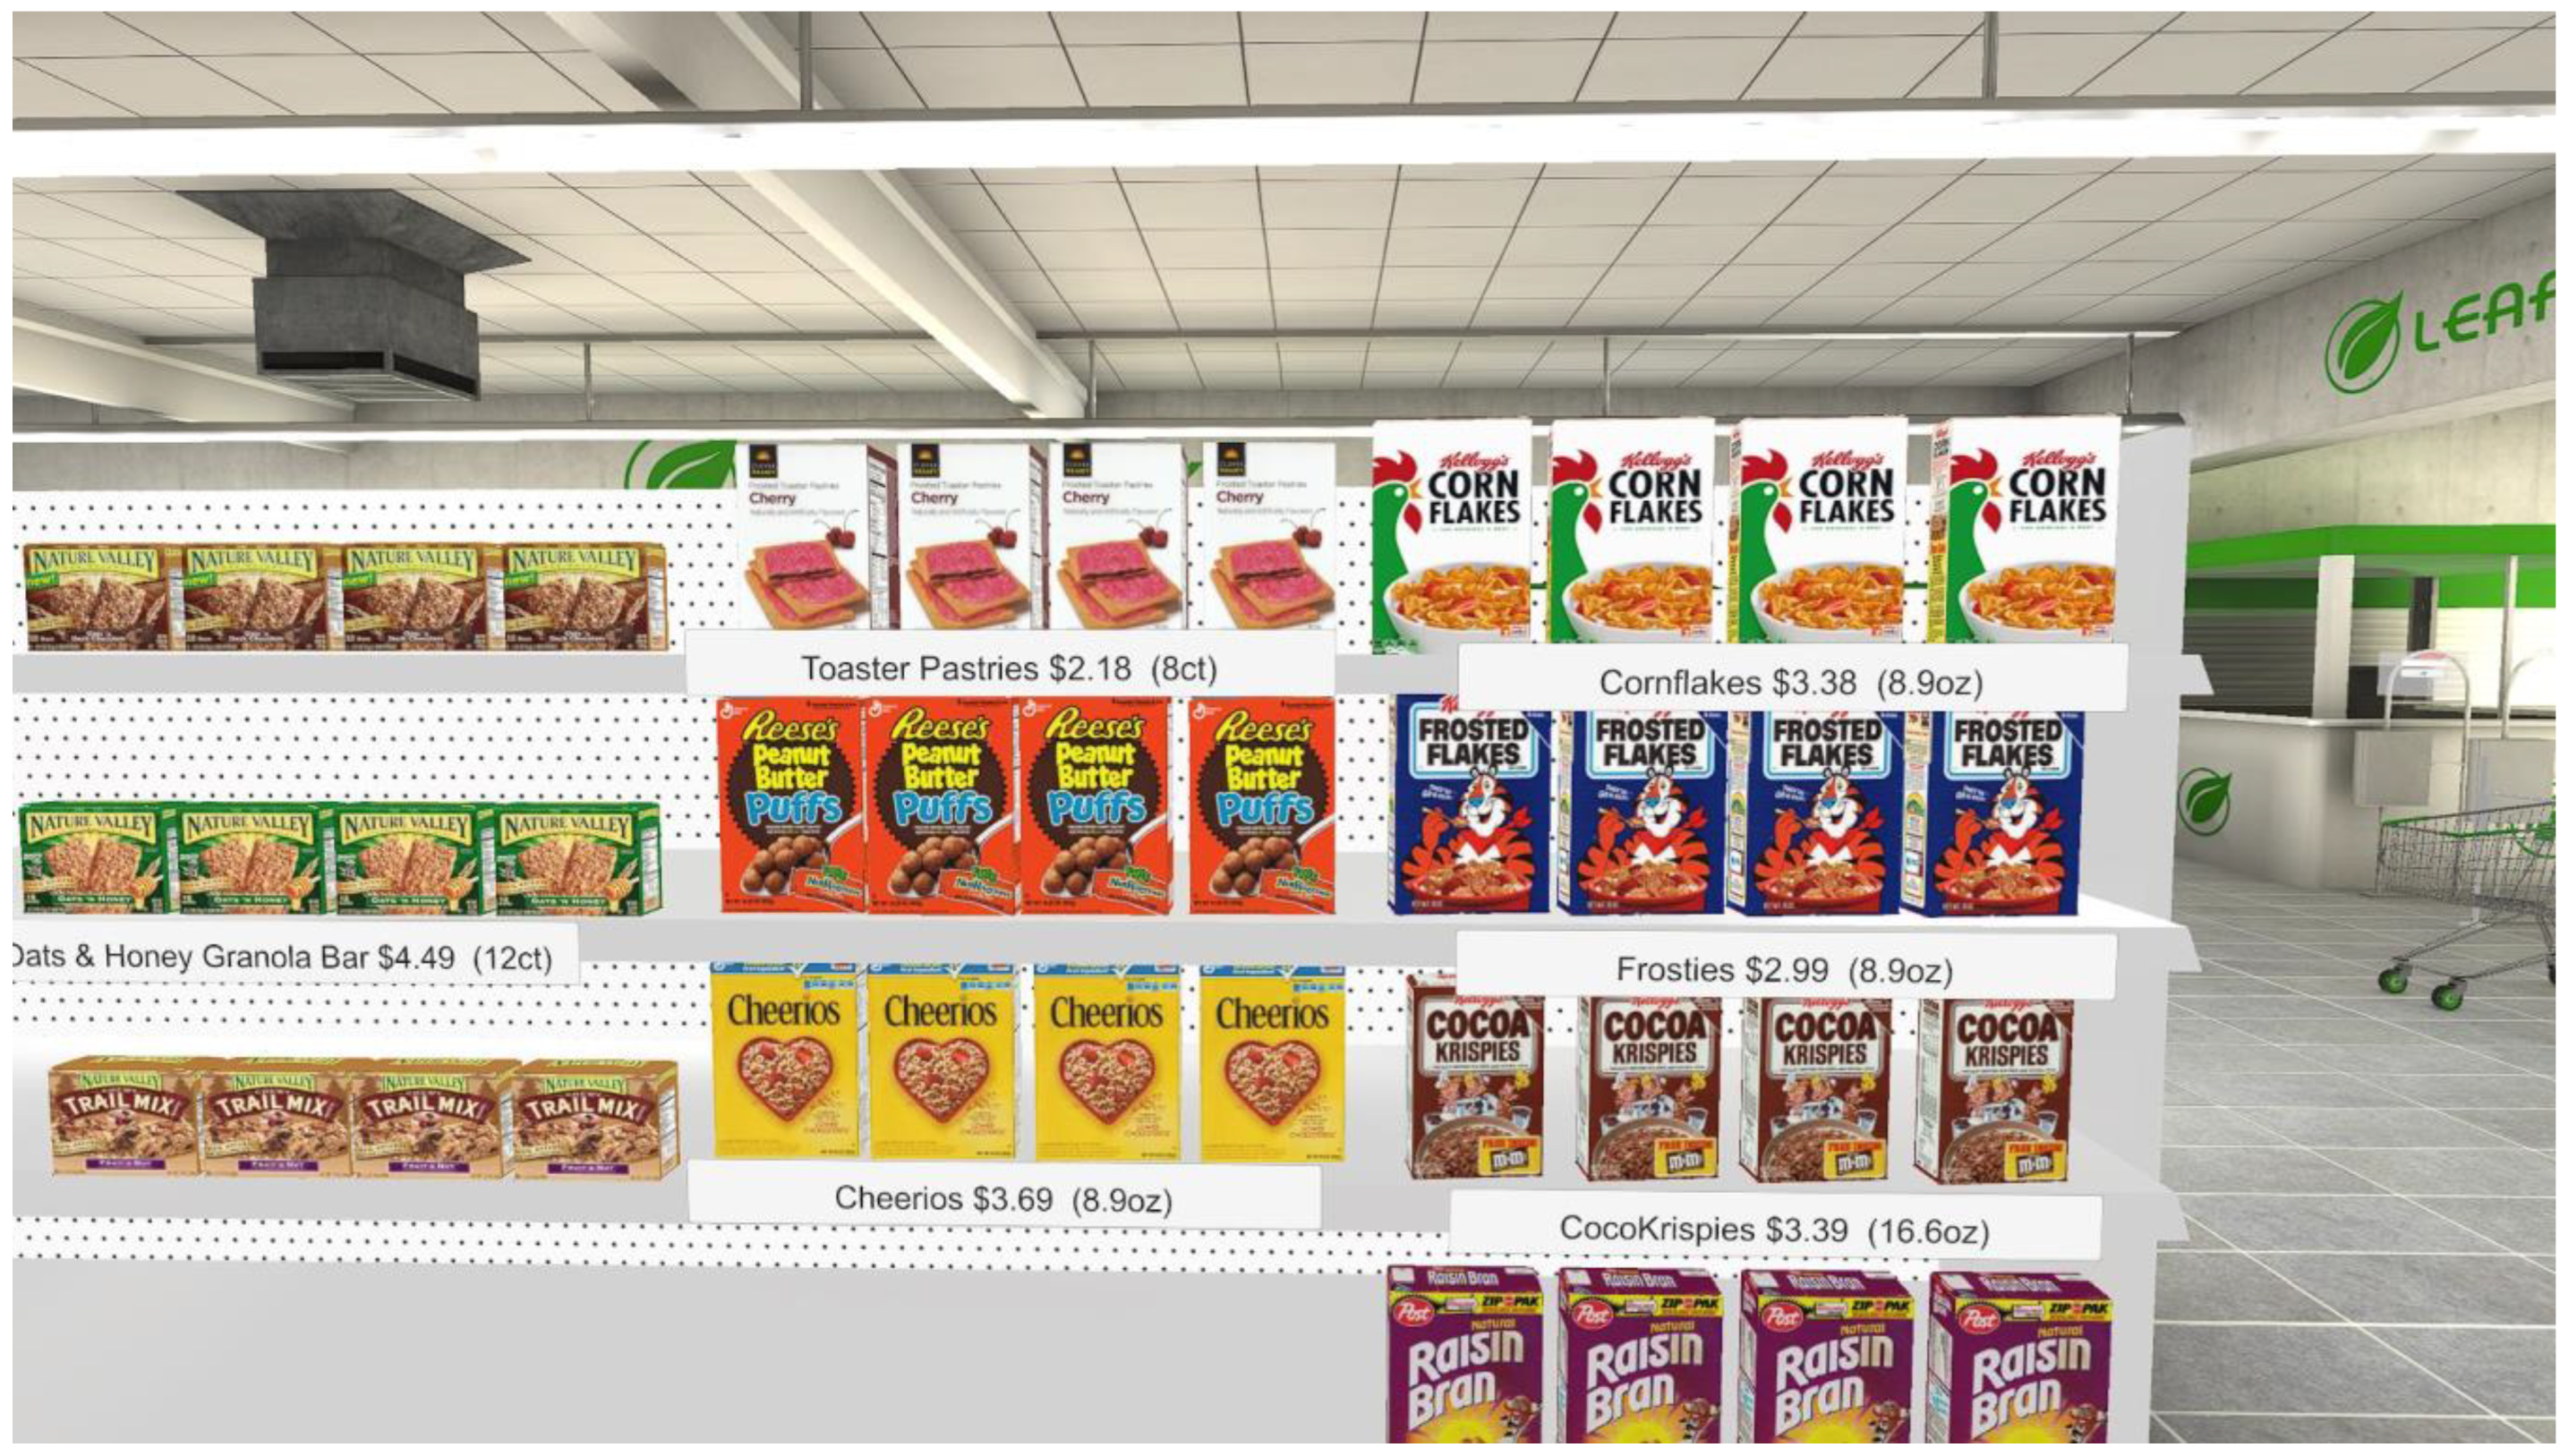
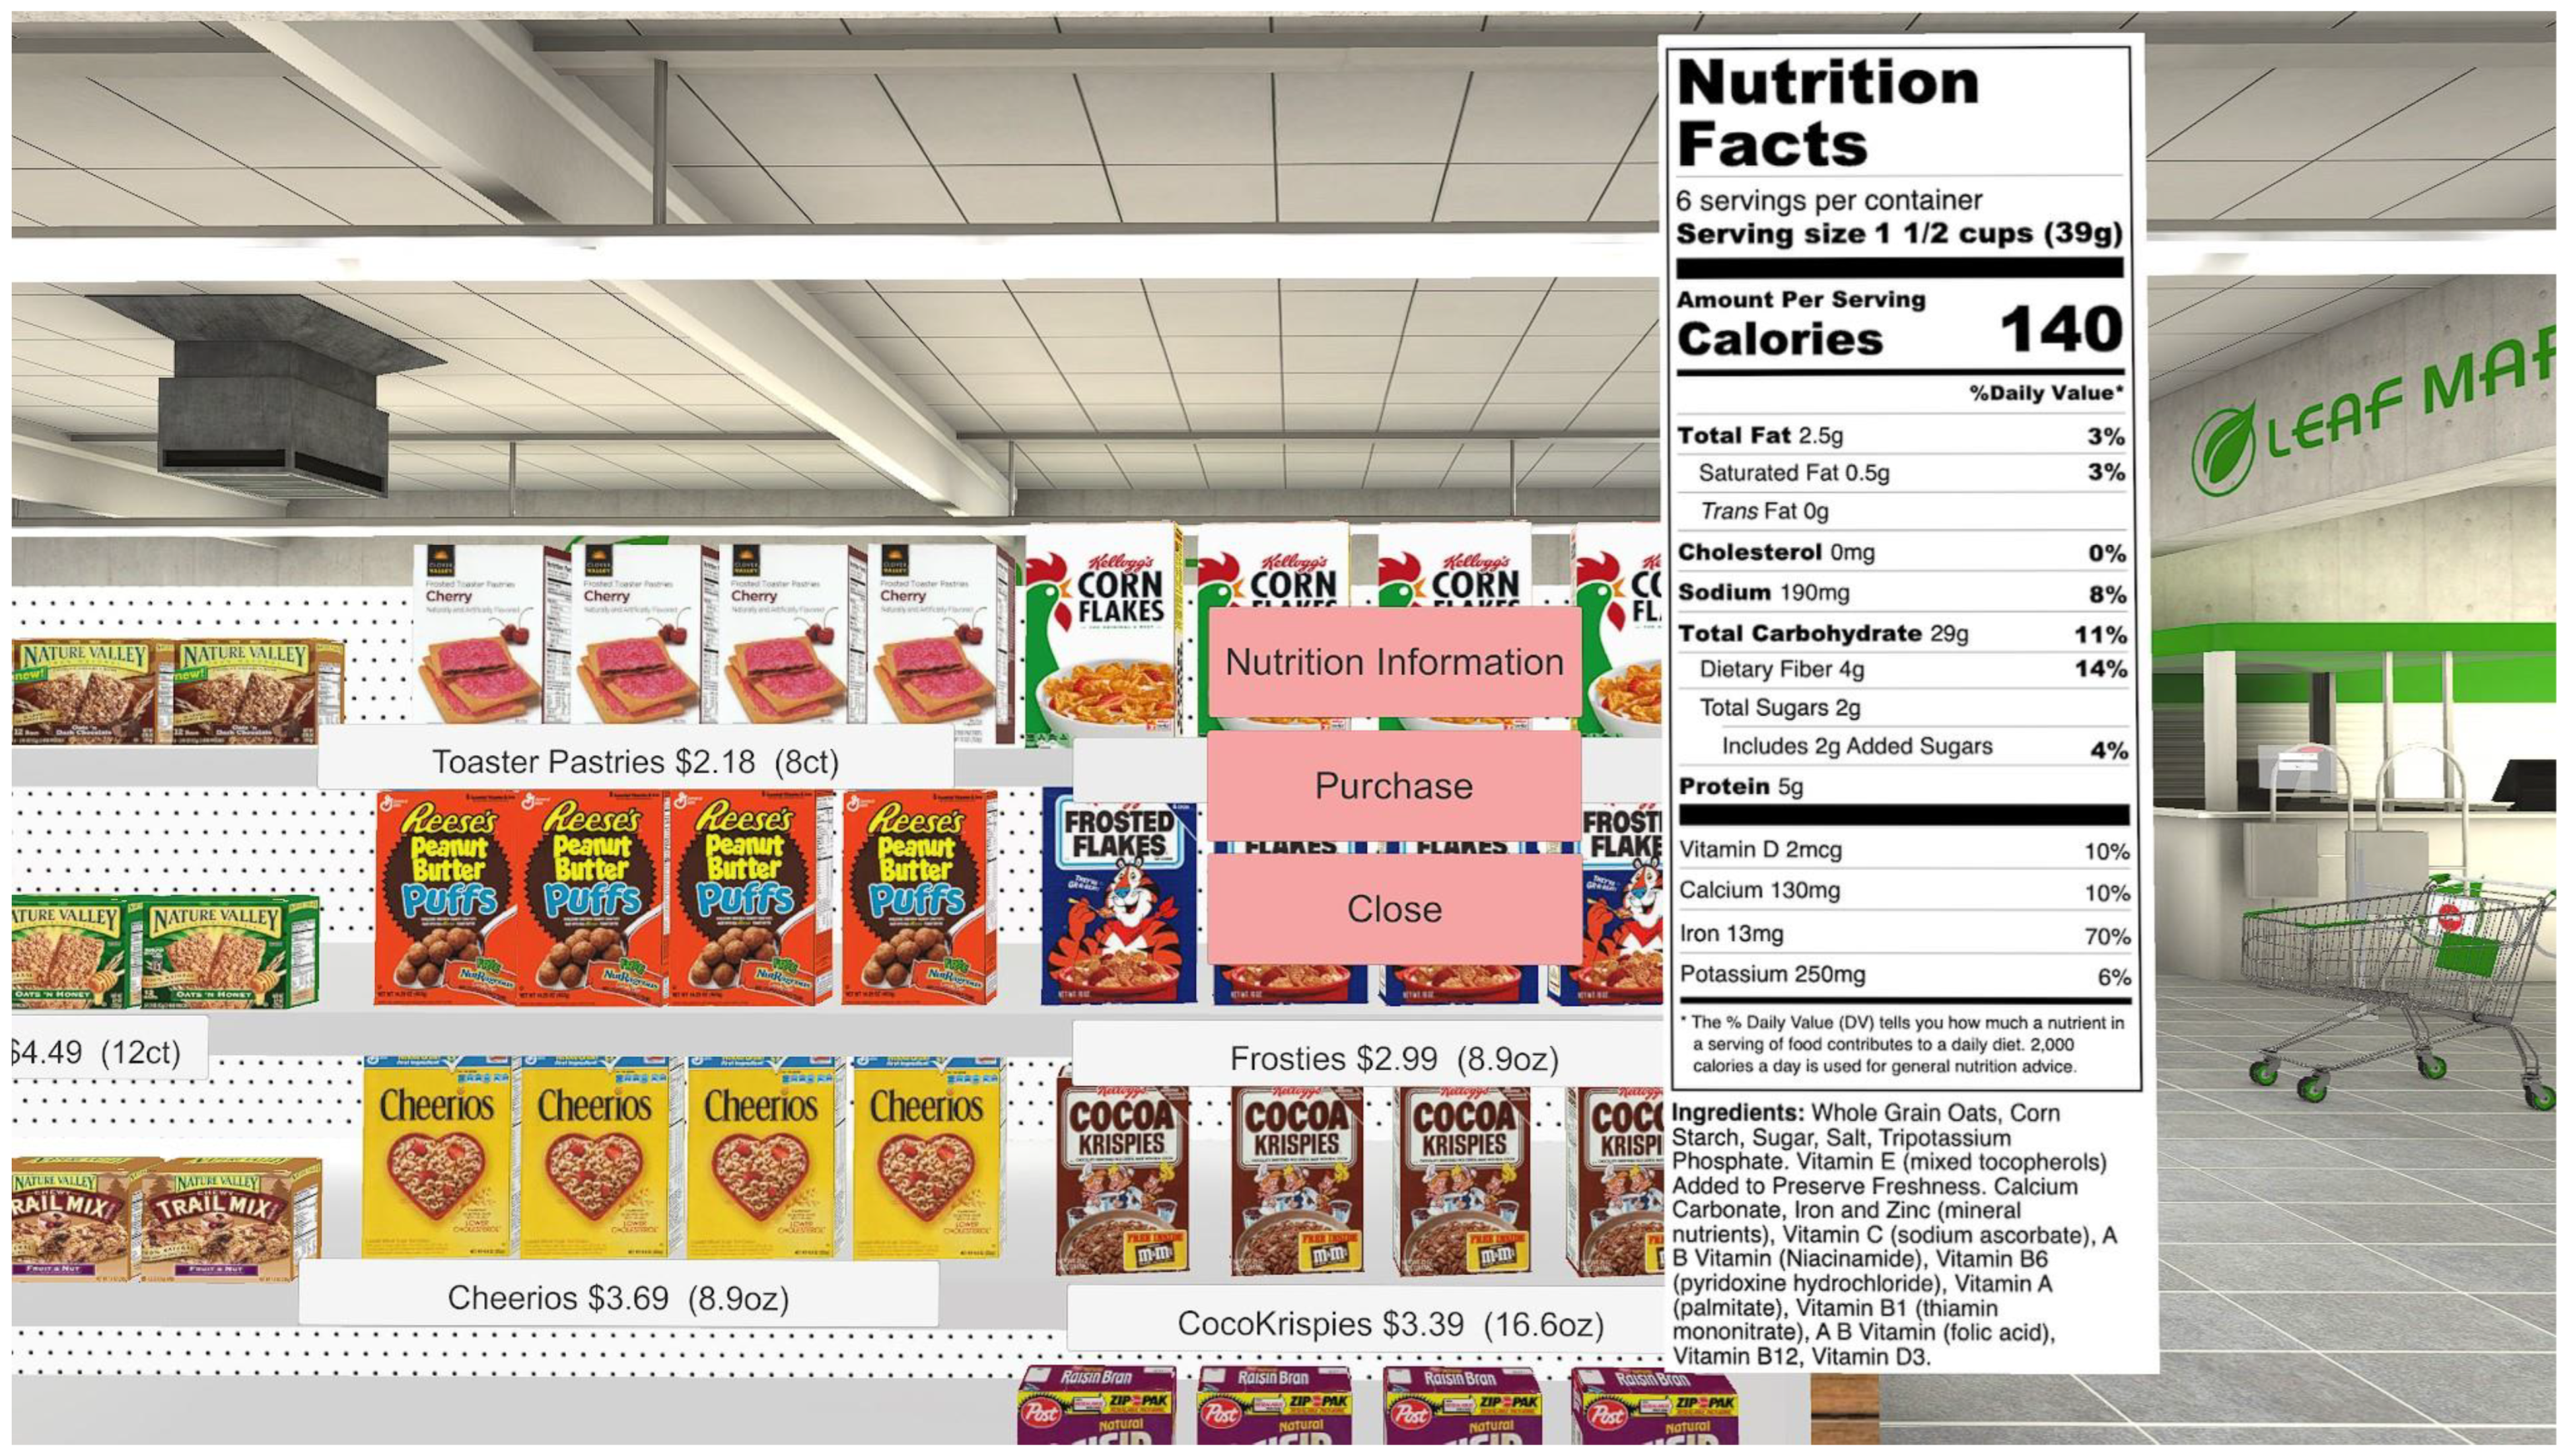
2.2. Virtual Worlds
2.3. Questionnaires
2.4. Physiological Measures
2.5. Procedure
2.6. Statistical Analysis
3. Result
3.1. Demographics
3.2. Questionnaires
3.3. Physiological Measurements
3.4. Time in the Scenes
4. Discussion
5. Limitations
Author Contributions
Funding
Institutional Review Board Statement
Informed Consent Statement
Data Availability Statement
Conflicts of Interest
References
- Anand, S.S.; Hawkes, C.; de Souza, R.J.; Mente, A.; Dehghan, M.; Nugent, R.; Zulyniak, M.A.; Weis, T.; Bernstein, A.M.; Krauss, R.M.; et al. Food Consumption and its Impact on Cardiovascular Disease: Importance of Solutions Focused on the Globalized Food System: A Report From the Workshop Convened by the World Heart Federation. J. Am. Coll. Cardiol. 2015, 66, 1590–1614. [Google Scholar] [CrossRef] [PubMed]
- Zhang, F.F.; Cudhea, F.; Shan, Z.; Michaud, D.S.; Imamura, F.; Eom, H.; Ruan, M.; Rehm, C.D.; Liu, J.; Du, M. Preventable Cancer Burden Associated With Poor Diet in the United States. JNCI Cancer Spectr. 2019, 3, pkz034. [Google Scholar] [CrossRef] [PubMed]
- Khazrai, Y.M.; Defeudis, G.; Pozzilli, P. Effect of diet on type 2 diabetes mellitus: A review. Diabetes Metab. Res. Rev. 2014, 30 (Suppl. S1), 24–33. [Google Scholar] [CrossRef] [PubMed]
- Hruby, A.; Manson, J.E.; Qi, L.; Malik, V.S.; Rimm, E.B.; Sun, Q.; Willett, W.C.; Hu, F.B. Determinants and Consequences of Obesity. Am. J. Public Health 2016, 106, 1656–1662. [Google Scholar] [CrossRef] [PubMed]
- Safiri, S.; Sepanlou, S.G.; Ikuta, K.S.; Bisignano, C.; Salimzadeh, H.; Delavari, A.; Ansari, R.; Roshandel, G.; Merat, S.; Fitzmaurice, C.; et al. The global, regional, and national burden of colorectal cancer and its attributable risk factors in 195 countries and territories, 1990–2017: A systematic analysis for the Global Burden of Disease Study 2017. Lancet Gastroenterol. Hepatol. 2019, 4, 913–933. [Google Scholar] [CrossRef] [PubMed]
- Clark, M.A.; Springmann, M.; Hill, J.; Tilman, D. Multiple health and environmental impacts of foods. Proc. Natl. Acad. Sci. USA 2019, 116, 23357–23362. [Google Scholar] [CrossRef] [PubMed]
- Willett, W.; Rockström, J.; Loken, B.; Springmann, M.; Lang, T.; Vermeulen, S.; Garnett, T.; Tilman, D.; DeClerck, F.; Wood, A. Food in the Anthropocene: The EAT-Lancet Commission on healthy diets from sustainable food systems. Lancet 2019, 393, 447–492. [Google Scholar] [CrossRef]
- Vermeulen, S.J.; Park, T.; Khoury, C.K.; Béné, C. Changing diets and the transformation of the global food system. Ann. N. Y. Acad. Sci. 2020, 1478, 3–17. [Google Scholar] [CrossRef] [PubMed]
- Todd, J.; Scharadin, B. Where Households Get Food in a Typical Week: Findings from USDA’s FoodAPS; U.S. Department of Agriculture, Economic Research Service: Washington, DC, USA, 2016. [Google Scholar]
- Pascall, M.A.; Lee, K.; Fraser, A.; Halim, L. Using focus groups to study consumer understanding and experiences with tamper-evident packaging devices. J. Food Sci. Educ. 2009, 8, 53–59. [Google Scholar] [CrossRef]
- Barlagne, C.; Cornet, D.; Blazy, J.-M.; Diman, J.-L.; Ozier-Lafontaine, H. Consumers’ preferences for fresh yam: A focus group study. Food Sci. Nutr. 2017, 5, 54–66. [Google Scholar] [CrossRef]
- Harnack, L.J.; French, S.A.; Oakes, J.M.; Story, M.T.; Jeffery, R.W.; Rydell, S.A. Effects of calorie labeling and value size pricing on fast food meal choices: Results from an experimental trial. Int. J. Behav. Nutr. Phys. Act. 2008, 5, 63. [Google Scholar] [CrossRef] [PubMed]
- Spanjaard, D.; Freeman, L.; Young, L. Reflections on journeys within the supermarket. Australas. Mark. J. 2015, 23, 303–310. [Google Scholar] [CrossRef]
- Hobin, E.; Bollinger, B.; Sacco, J.; Liebman, E.; Vanderlee, L.; Zuo, F.; Rosella, L.; L’Abbe, M.; Manson, H.; Hammond, D. Consumers’ Response to an On-Shelf Nutrition Labelling System in Supermarkets: Evidence to Inform Policy and Practice. Milbank Q. 2017, 95, 494–534. [Google Scholar] [CrossRef]
- Dubois, P.; Albuquerque, P.; Allais, O.; Bonnet, C.; Bertail, P.; Combris, P.; Lahlou, S.; Rigal, N.; Ruffieux, B.; Chandon, P. Effects of front-of-pack labels on the nutritional quality of supermarket food purchases: Evidence from a large-scale randomized controlled trial. J. Acad. Mark. Sci. 2020, 49, 119–138. [Google Scholar] [CrossRef]
- Brenner, P.S.; DeLamater, J. Lies, Damned Lies, and Survey Self-Reports? Identity as a Cause of Measurement Bias. Soc. Psychol. Q. 2016, 79, 333–354. [Google Scholar] [CrossRef]
- Harbers, M.C.; Beulens, J.W.J.; Rutters, F.; de Boer, F.; Gillebaart, M.; Sluijs, I.; van der Schouw, Y.T. The effects of nudges on purchases, food choice, and energy intake or content of purchases in real-life food purchasing environments: A systematic review and evidence synthesis. Nutr. J. 2020, 19, 103. [Google Scholar] [CrossRef]
- Stuber, J.M.; Hoenink, J.C.; Beulens, J.W.J.; Mackenbach, J.D.; Lakerveld, J. Shifting toward a healthier dietary pattern through nudging and pricing strategies: A secondary analysis of a randomized virtual supermarket experiment. Am. J. Clin. Nutr. 2021, 114, 628–637. [Google Scholar] [CrossRef]
- Harbers, M.C.; Middel, C.N.H.; Stuber, J.M.; Beulens, J.W.J.; Rutters, F.; van der Schouw, Y.T. Determinants of Food Choice and Perceptions of Supermarket-Based Nudging Interventions among Adults with Low Socioeconomic Position: The SUPREME NUDGE Project. Int. J. Env. Res. Public Health 2021, 18, 6175. [Google Scholar] [CrossRef]
- Burke, R.R.; Leykin, A. Identifying the drivers of shopper attention, engagement, and purchase. In Shopper Marketing and the Role of in-Store Marketing; Review of Marketing, Research; Grewal, D., Roggeveen, A.L., Nordfalt, J., Eds.; Emerald Publishing Limited: Bingley, UK, 2014; Volume 11, pp. 147–187. [Google Scholar]
- Burke, R.R. Virtual shopping: Breakthrough in marketing research. Harv. Bus. Rev. 1996, 74, 120–129. [Google Scholar]
- Burke, R.R.; Harlam, B.A.; Kahn, B.E.; Lodish, L.M. Comparing dynamic consumer choice in real and computer-simulated environments. J. Consum. Res. 1992, 19, 71–82. [Google Scholar] [CrossRef]
- Liu, R.; Hooker, N.H.; Parasidis, E.; Simons, C.T. A Natural Experiment: Using Immersive Technologies to Study the Impact of “All-Natural” Labeling on Perceived Food Quality, Nutritional Content, and Liking. J. Food Sci. 2017, 82, 825–833. [Google Scholar] [CrossRef]
- Hoenink, J.C.; Mackenbach, J.D.; Waterlander, W.; Lakerveld, J.; van der Laan, N.; Beulens, J.W.J. The effects of nudging and pricing on healthy food purchasing behavior in a virtual supermarket setting: A randomized experiment. Int. J. Behav. Nutr. Phys. Act. 2020, 17, 98. [Google Scholar] [CrossRef]
- Blitstein, J.L.; Guthrie, J.F.; Rains, C. Low-Income Parents’ Use of Front-of-Package Nutrition Labels in a Virtual Supermarket. J. Nutr. Educ. Behav. 2020, 52, 850–858. [Google Scholar] [CrossRef]
- Schnack, A.; Wright, M.J.; Holdershaw, J.L. Immersive virtual reality technology in a three-dimensional virtual simulated store: Investigating telepresence and usability. Food Res. Int. 2019, 117, 40–49. [Google Scholar] [CrossRef] [PubMed]
- Schnack, A.; Wright, M.J.; Holdershaw, J.L. An exploratory investigation of shopper behaviour in an immersive virtual reality store. J. Consum. Behav. 2020, 19, 182–195. [Google Scholar] [CrossRef]
- Bigné, E.; Llinares, C.; Torrecilla, C. Elapsed time on first buying triggers brand choices within a category: A virtual reality-based study. J. Bus. Res. 2016, 69, 1423–1427. [Google Scholar] [CrossRef]
- Kim, J.-H.; Kim, M.; Park, M.; Yoo, J. Immersive interactive technologies and virtual shopping experiences: Differences in consumer perceptions between augmented reality (AR) and virtual reality (VR). Telemat. Inform. 2023, 77, 101936. [Google Scholar] [CrossRef]
- Smink, A.R.; van Reijmersdal, E.A.; van Noort, G.; Neijens, P.C. Shopping in augmented reality: The effects of spatial presence, personalization and intrusiveness on app and brand responses. J. Bus. Res. 2020, 118, 474–485. [Google Scholar] [CrossRef]
- Lombard, M.; Ditton, T. At the Heart of It All: The Concept of Presence. J. Comput. -Mediat. Commun. 1997, 3, JCMC321. [Google Scholar] [CrossRef]
- Riesenberg, D.; Backholer, K.; Zorbas, C.; Sacks, G.; Paix, A.; Marshall, J.; Blake, M.R.; Bennett, R.; Peeters, A.; Cameron, A.J. Price Promotions by Food Category and Product Healthiness in an Australian Supermarket Chain, 2017–2018. Am. J. Public Health 2019, 109, 1434–1439. [Google Scholar] [CrossRef]
- Ravensbergen, E.A.; Waterlander, W.E.; Kroeze, W.; Steenhuis, I.H. Healthy or Unhealthy on Sale? A cross-sectional study on the proportion of healthy and unhealthy foods promoted through flyer advertising by supermarkets in the Netherlands. BMC Public Health 2015, 15, 470. [Google Scholar] [CrossRef]
- Nakamura, R.; Suhrcke, M.; Jebb, S.A.; Pechey, R.; Almiron-Roig, E.; Marteau, T.M. Price promotions on healthier compared with less healthy foods: A hierarchical regression analysis of the impact on sales and social patterning of responses to promotions in Great Britain. Am. J. Clin. Nutr. 2015, 101, 808–816. [Google Scholar] [CrossRef] [PubMed]
- Hecht, A.A.; Perez, C.L.; Polascek, M.; Thorndike, A.N.; Franckle, R.L.; Moran, A.J. Influence of Food and Beverage Companies on Retailer Marketing Strategies and Consumer Behavior. Int. J. Env. Res. Public Health 2020, 17, 7381. [Google Scholar] [CrossRef] [PubMed]
- Ouyang, Y.X.; Behnke, C.; Almanza, B.; Ghiselli, R. The Influence of Food Aromas on Restaurant Consumer Emotions, Perceptions, and Purchases. J. Hosp. Mark. Manag. 2018, 27, 405–423. [Google Scholar] [CrossRef]
- Seo, H.S. Sensory Nudges: The Influences of Environmental Contexts on Consumers’ Sensory Perception, Emotional Responses, and Behaviors toward Foods and Beverages. Foods 2020, 9, 509. [Google Scholar] [CrossRef] [PubMed]
- Hein, D.; Mai, C.; Hußmann, H. The usage of presence measurements in research: A review. In Proceedings of the 17th Conference of the International Society for Presence Research (ISPR), Prague, Czech Republic, 21–22 May 2018. [Google Scholar]
- Grassini, S.; Laumann, K. Questionnaire Measures and Physiological Correlates of Presence: A Systematic Review. Front. Psychol. 2020, 11, 349. [Google Scholar] [CrossRef] [PubMed]
- Terkildsen, T.; Makransky, G. Measuring presence in video games: An investigation of the potential use of physiological measures as indicators of presence. Int. J. Hum.-Comput. Stud. 2019, 126, 64–80. [Google Scholar] [CrossRef]
- Zizzo, D.J. Experimenter demand effects in economic experiments. Exp. Econ. 2010, 13, 75–98. [Google Scholar] [CrossRef]
- Gorini, A.; Griez, E.; Petrova, A.; Riva, G. Assessment of the emotional responses produced by exposure to real food, virtual food and photographs of food in patients affected by eating disorders. Ann. Gen. Psychiatry 2010, 9, 30. [Google Scholar] [CrossRef]
- van der Waal, N.E.; Janssen, L.; Antheunis, M.; Culleton, E.; van der Laan, L.N. The appeal of virtual chocolate: A systematic comparison of psychological and physiological food cue responses to virtual and real food. Food Qual. Prefer. 2021, 90, 104167. [Google Scholar] [CrossRef]
- Ledoux, T.; Nguyen, A.S.; Bakos-Block, C.; Bordnick, P. Using virtual reality to study food cravings. Appetite 2013, 71, 396–402. [Google Scholar] [CrossRef] [PubMed]
- Rebenitsch, L.; Owen, C. Review on cybersickness in applications and visual displays. Virtual Real. 2016, 20, 101–125. [Google Scholar] [CrossRef]
- Reason, J.T.; Brand, J.J. Motion Sickness; Academic Press: Cambridge, MA, USA, 1975. [Google Scholar]
- LaViola, J.J., Jr. A discussion of cybersickness in virtual environments. ACM Sigchi Bull. 2000, 32, 47–56. [Google Scholar] [CrossRef]
- Regan, C. Some effects of using virtual reality technology. In Virtual Reality, Training’s Future? Springer: Berlin/Heidelberg, Germany, 1997; pp. 77–83. [Google Scholar]
- Cobb, S.V.; Nichols, S.; Ramsey, A.; Wilson, J.R. Virtual reality-induced symptoms and effects (VRISE). Presence Teleoperators Virtual Environ. 1999, 8, 169–186. [Google Scholar] [CrossRef]
- Caserman, P.; Garcia-Agundez, A.; Gámez Zerban, A.; Göbel, S. Cybersickness in current-generation virtual reality head-mounted displays: Systematic review and outlook. Virtual Real. 2021, 25, 1153–1170. [Google Scholar] [CrossRef]
- Lin, J.J.; Parker, D.E. User experience modeling and enhancement for virtual environments that employ wide-field displays. In International Conference on Digital Human Modeling; Springer: Berlin/Heidelberg, Germany, 2007; pp. 423–433. [Google Scholar]
- Usoh, M.; Catena, E.; Arman, S.; Slater, M. Using presence questionnaires in reality. Presence Teleoperators Virtual Environ. 2000, 9, 497–503. [Google Scholar] [CrossRef]
- Weech, S.; Kenny, S.; Barnett-Cowan, M. Presence and Cybersickness in Virtual Reality Are Negatively Related: A Review. Front. Psychol. 2019, 10, 158. [Google Scholar] [CrossRef]
- Price, M.; Anderson, P. The role of presence in virtual reality exposure therapy. J. Anxiety Disord. 2007, 21, 742–751. [Google Scholar] [CrossRef]
- Smeets, P.A.; Erkner, A.; de Graaf, C. Cephalic phase responses and appetite. Nutr. Rev. 2010, 68, 643–655. [Google Scholar] [CrossRef]
- Wiedemann, S.J.; Rachid, L.; Illigens, B.; Böni-Schnetzler, M.; Donath, M.Y. Evidence for cephalic phase insulin release in humans: A systematic review and meta-analysis. Appetite 2020, 155, 104792. [Google Scholar] [CrossRef]
- Zhu, Y.; Hsu, W.H.; Hollis, J.H. Modified sham feeding of foods with different macronutrient compositions differentially influences cephalic change of insulin, ghrelin, and NMR-based metabolomic profiles. Physiol. Behav. 2014, 135, 135–142. [Google Scholar] [CrossRef] [PubMed]
- Latoschik, M.E.; Roth, D.; Gall, D.; Achenbach, J.; Waltemate, T.; Botsch, M. The effect of avatar realism in immersive social virtual realities. In Proceedings of the 23rd ACM Symposium on Virtual Reality Software and Technology, Gothenburg, Sweden, 8–10 November 2017; pp. 1–10. [Google Scholar]
- Jung, S.; Lindeman, R.W. Perspective: Does Realism Improve Presence in VR? Suggesting a Model and Metric for VR Experience Evaluation. Front. Virtual Real. 2021, 2, 693327. [Google Scholar] [CrossRef]
- Regan, E.C.; Price, K.R. The frequency of occurrence and severity of side-effects of immersion virtual reality. Aviat. Space Environ. Med. 1994, 65, 527–530. [Google Scholar] [PubMed]
- Lampton, D.R.; Kolasinski, E.M.; Knerr, B.W.; Bliss, J.P.; Bailey, J.H.; Witmer, B.G. Side Effects and Aftereffects of Immersion in Virtual Environments. Proc. Hum. Factors Ergon. Soc. Annu. Meet. 1994, 38, 1154–1157. [Google Scholar] [CrossRef]
- Christou, C.G.; Aristidou, P. Steering Versus Teleport Locomotion for Head Mounted Displays. In Augmented Reality, Virtual Reality, and Computer Graphics; Springer International Publishing: Cham, Switzerland, 2017; pp. 431–446. [Google Scholar]


| LIVESM | HIVESM | LIVEFFR | HIVEFFR | F Ratio | p-Value | |
|---|---|---|---|---|---|---|
| Rate your sense of being in the SM/FFR scene. | 3.4 (0.3) a | 5.8 (0.2) b | 2.9 (0.3) a | 6.0 (0.2) b | f(3,90) = 37.8 | p < 0.0001 |
| To what extent were there times during the experience when the SM/FFR was the reality for you? | 2.1 (0.3) a | 4.6 (0.3) b | 2.1 (0.3) a | 5.2 (0.3) b | f(3,90) = 44.5 | p < 0.0001 |
| Was the SM/FFR more like images that you saw OR more like somewhere that you visited? | 2.4 (0.3) a | 4.7 (0.3) b | 2.7 (0.4) a | 5.0 (0.3) b | f(3,90) = 18.9 | p < 0.0001 |
| Which was stronger, your sense of being in the SM/FFR or of being elsewhere? | 2.8 (0.3) a | 5.2 (0.2) b | 2.9 (0.4) a | 5.4 (0.2) b | f(3,90) = 23.4 | p < 0.0001 |
| I think of the SM/FFR as a place similar to other places that I’ve been today. | 3.2 (0.3) a | 4.7 (0.3) b | 3.7 (0.4) a | 5.0 (0.3) b | f(3,90) = 8.7 | p < 0.0001 |
| Did you often think to yourself that you were actually in the SM/FFR? | 2.2 (0.3) a | 4.0 (0.4) b | 2.0 (0.3) a | 4.7 (0.3) b | f(3,90) = 17.6 | p < 0.0001 |
| How dizzy, sick, or nauseous did you feel during or as a result of the experience? | 0.3 (0.2) a | 0.4 (0.1) a | 0.0 (0.0) a | 0.5 (0.2) a | f(3,90) = 1.5 | p = 0.200 |
| Rate the extent to which you were aware of background sounds in the laboratory where this was actually taking place. | 3.2 (0.4) a | 2.3 (0.4) a | 3.4 (0.4) a | 2.2 (0.4) a | f(3,90) = 2.6 | p = 0.058 |
| Overall, how well do you think that you achieved your task? | 5.7 (0.2) | 6.0 (0.1) a | 5.7 (0.3) a | 6.2 (0.1) a | f(3,90) = 1.3 | p = 0.200 |
| LIVESM | HIVESM | LIVEFFR | HIVEFFR | F Ratio | p-Value | ||
|---|---|---|---|---|---|---|---|
| Baseline Heart Rate (bpm) | Mean | 78.0 (2.1) | 80.3 (2.3) | 78.4 (2.6) | 77.8 (2.2) | ||
| Treatment Heart Rate (bpm) | Mean | 77.0 (2.3) | 90.6 (3.0) | 77.4 (2.3) | 86.7 (2.2) | ||
| Change in Heart Rate (bpm) | Mean | −1.0 (0.8) a | 10.4 (2.0) b | −1.0 (0.8) a | 8.9 (1.4) b | f(3,90) = 21.4 | <0.0001 |
| Baseline EDA (μmseimans) | Mean | 5.8 (0.7) | 6.8 (1.1) | 5.8 (0.9) | 5.7 (1.0) | ||
| Treatment EDA (μmseimans) | Mean | 6.3 (0.8) | 8.4 (1.2) | 6.1 (1.0) | 7.2 (1.1) | ||
| Change in EDA (μmseimans) | Mean | 0.5 (0.3) a | 1.6 (0.4) b | 0.3 (0.2) a | 1.6 (0.3) b | f(3,90) = 5.10 | <0.0023 |
Disclaimer/Publisher’s Note: The statements, opinions and data contained in all publications are solely those of the individual author(s) and contributor(s) and not of MDPI and/or the editor(s). MDPI and/or the editor(s) disclaim responsibility for any injury to people or property resulting from any ideas, methods, instructions or products referred to in the content. |
© 2024 by the authors. Licensee MDPI, Basel, Switzerland. This article is an open access article distributed under the terms and conditions of the Creative Commons Attribution (CC BY) license (https://creativecommons.org/licenses/by/4.0/).
Share and Cite
Woodall, S.; Hollis, J.H. The Difference between PC-Based and Immersive Virtual Reality Food Purchase Environments on Useability, Presence, and Physiological Responses. Foods 2024, 13, 264. https://doi.org/10.3390/foods13020264
Woodall S, Hollis JH. The Difference between PC-Based and Immersive Virtual Reality Food Purchase Environments on Useability, Presence, and Physiological Responses. Foods. 2024; 13(2):264. https://doi.org/10.3390/foods13020264
Chicago/Turabian StyleWoodall, Shelley, and James H. Hollis. 2024. "The Difference between PC-Based and Immersive Virtual Reality Food Purchase Environments on Useability, Presence, and Physiological Responses" Foods 13, no. 2: 264. https://doi.org/10.3390/foods13020264