
Measuring the Effectiveness of Food Policy Councils in Major Cities in the United States

Abstract
:
1. Introduction
1.1. Importance of Diversity, Equity and Inclusion in the U.S. Food System
1.2. U.S. Food Policy—Bridging Production and Consumption
1.3. Building Inclusive and Effective Food Systems Leadership
2. Materials and Methods
2.1. Analyzing Food Policy Councils (FPCs)
2.2. A Framework for Assessing Food Policy Councils
3. Results
3.1. Descriptive Results of Major Urban Cities and FPCs
3.2. Comparative Results of the Effectiveness of Urban FPCs
4. Discussion
5. Conclusions
Author Contributions
Funding
Data Availability Statement
Acknowledgments
Conflicts of Interest
Appendix A

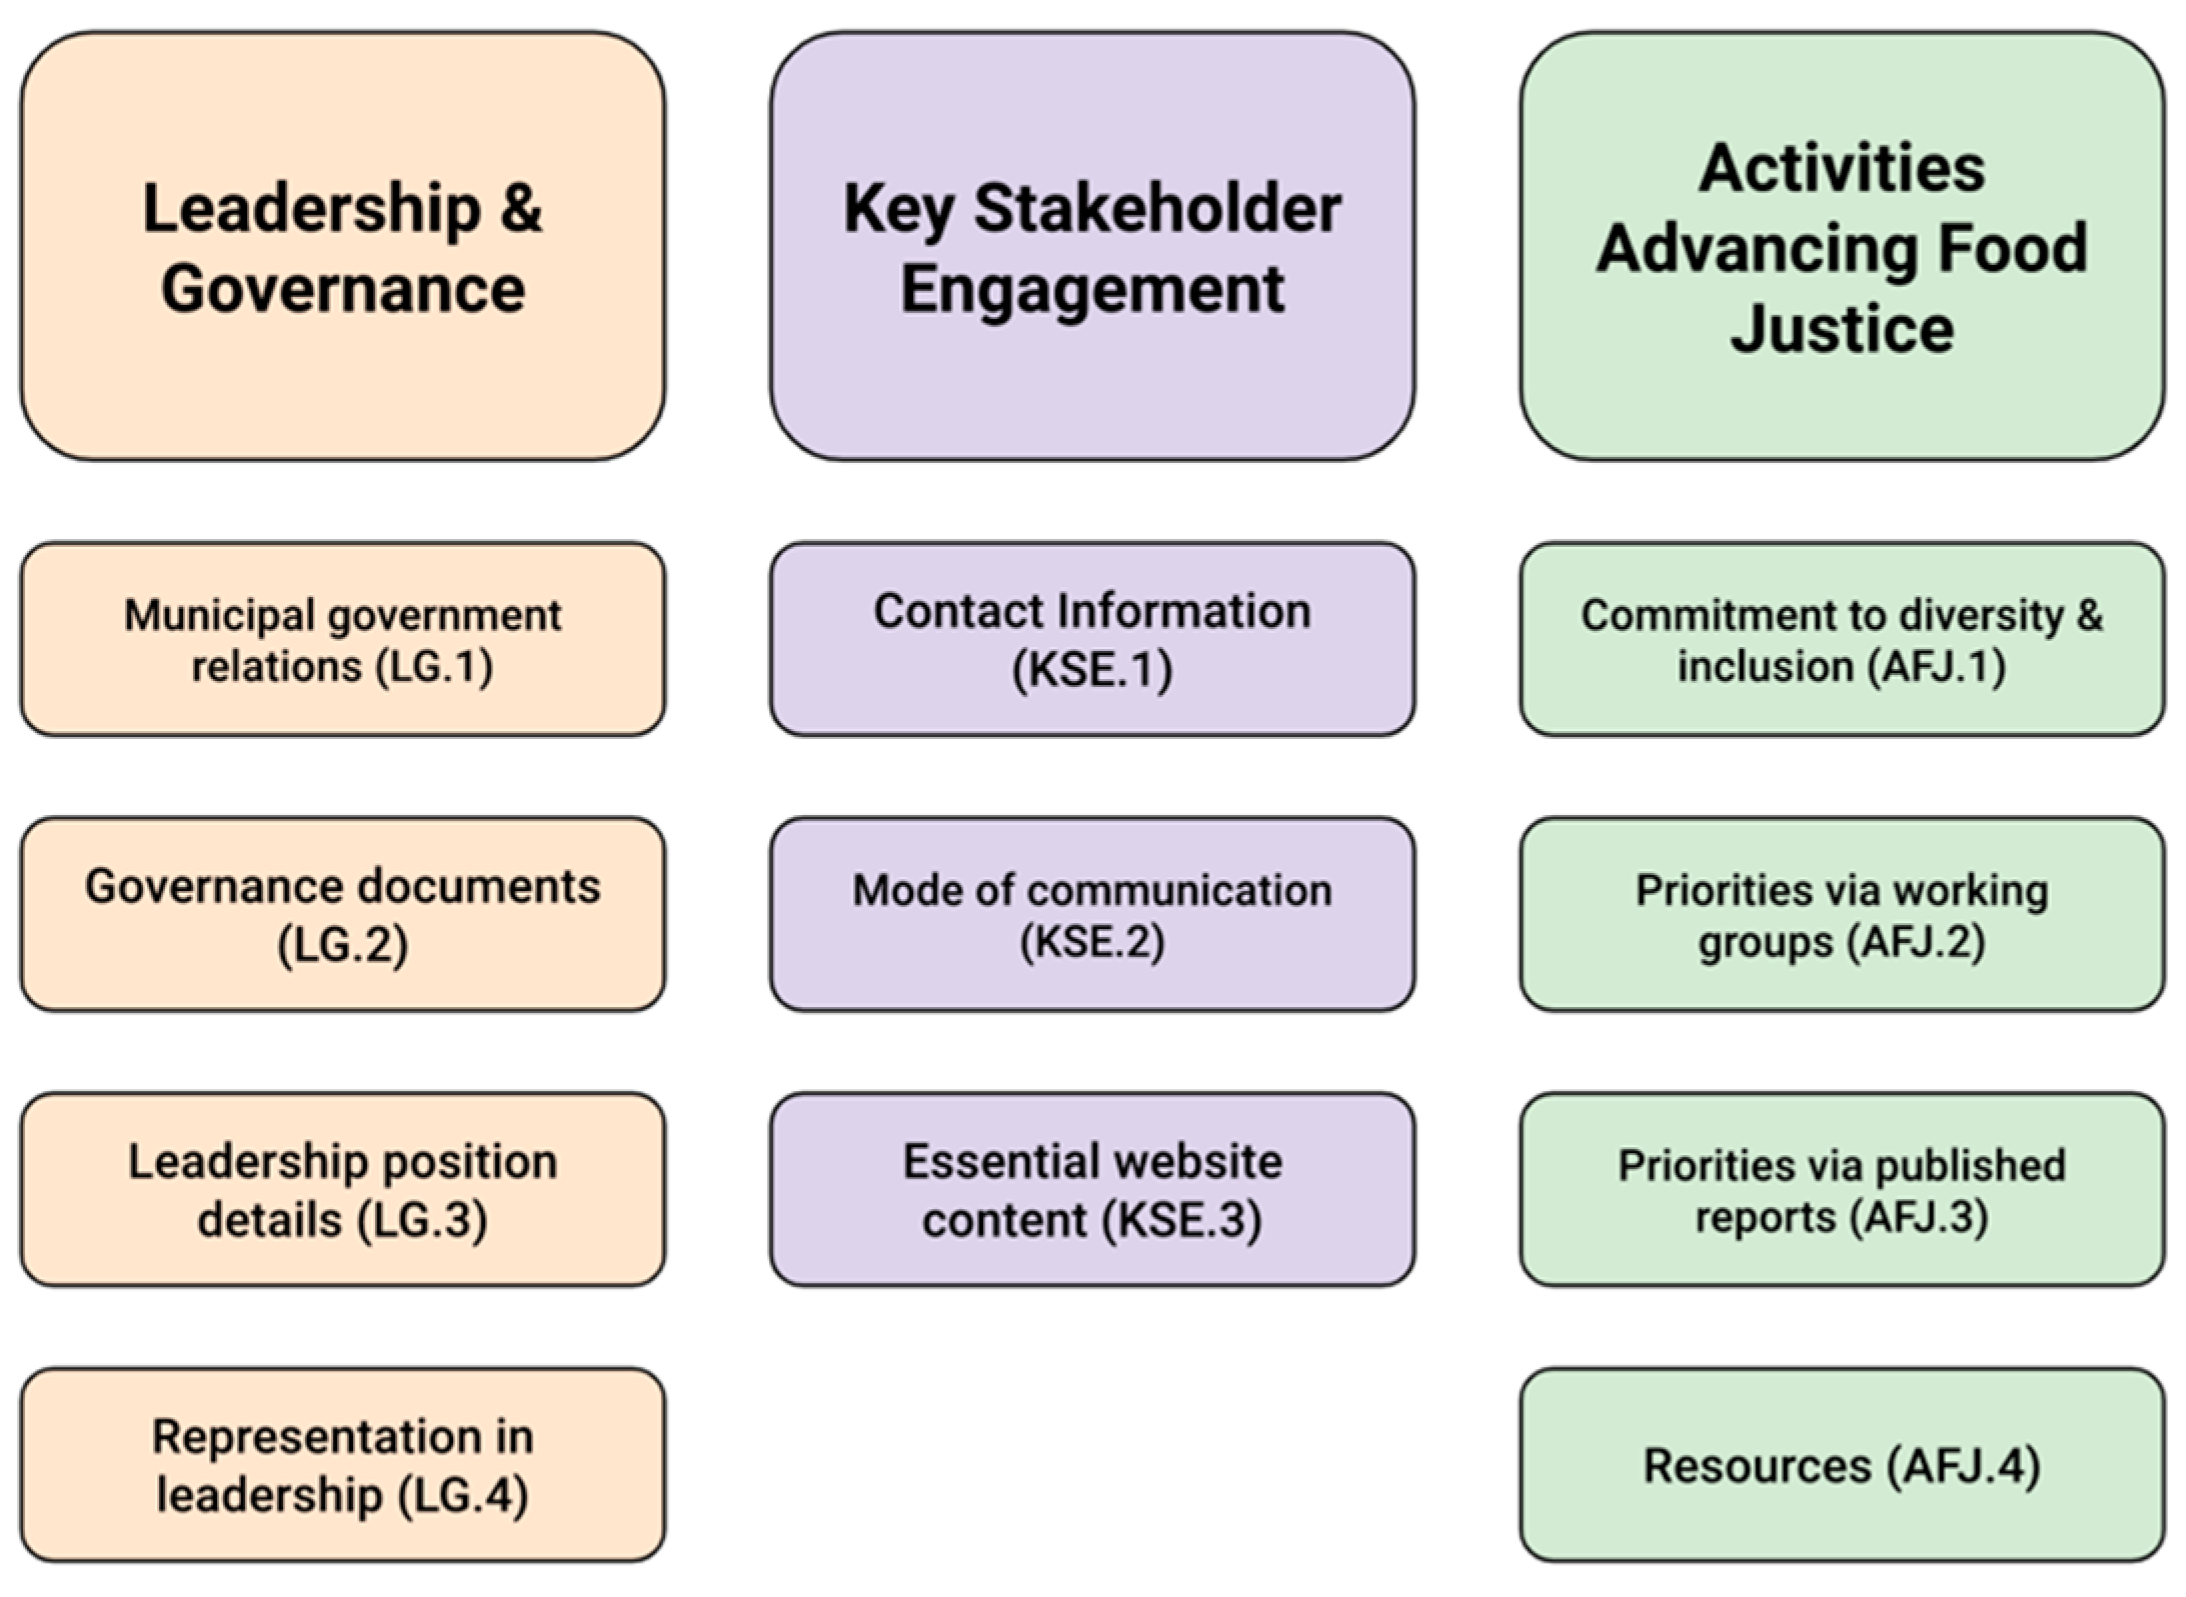
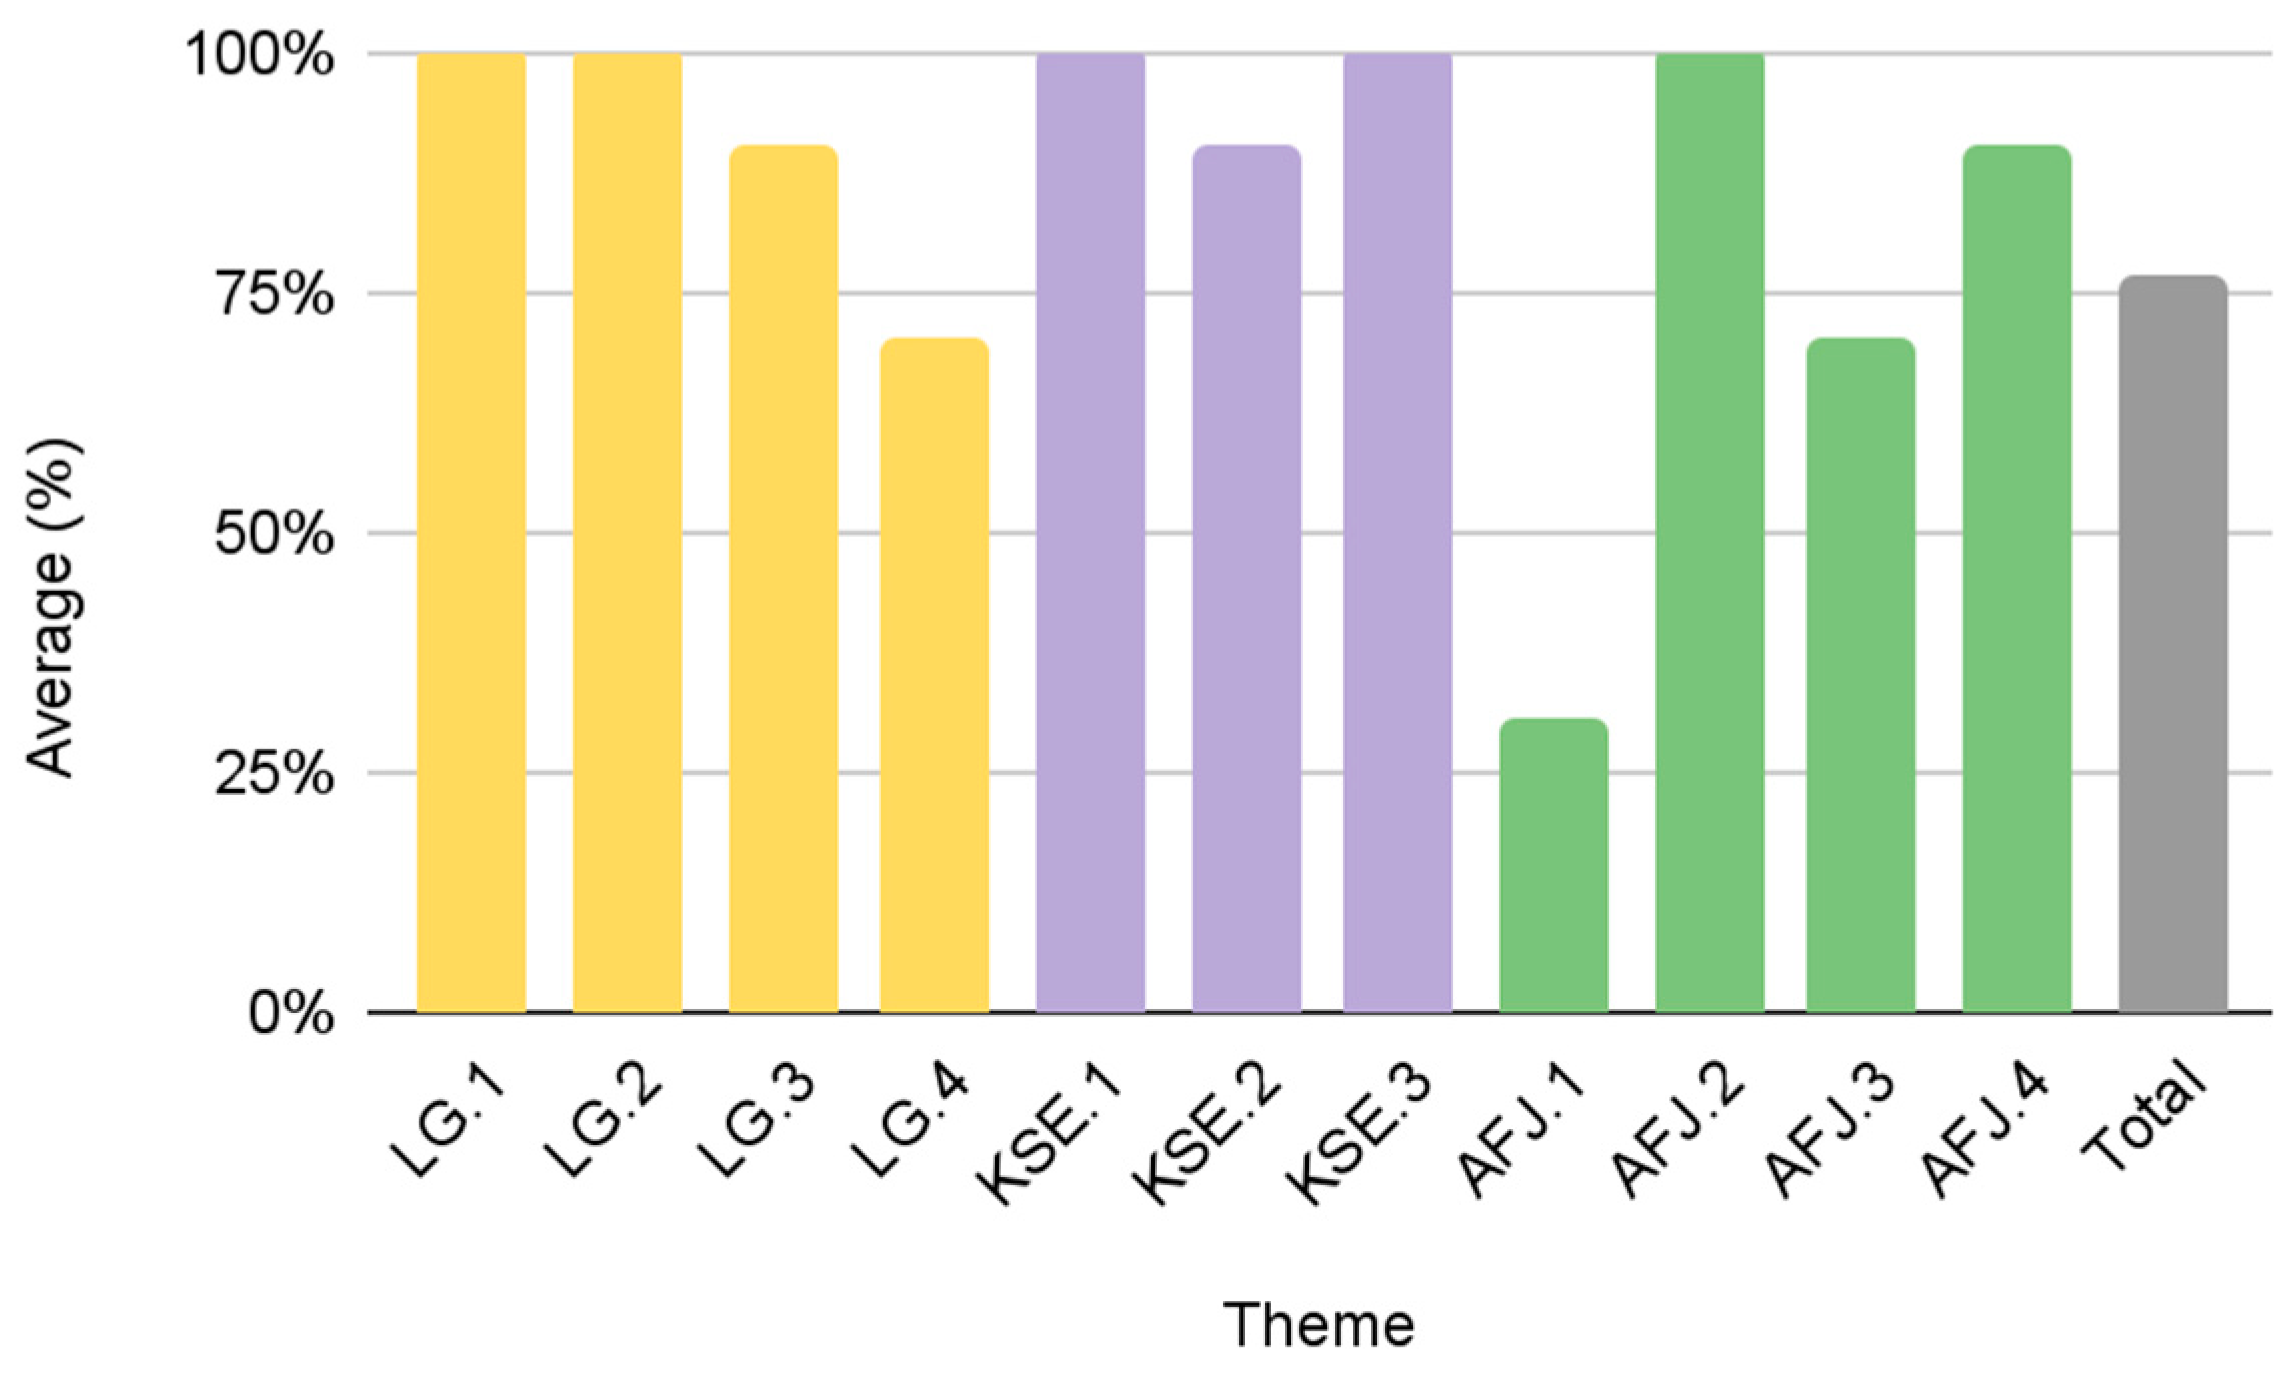
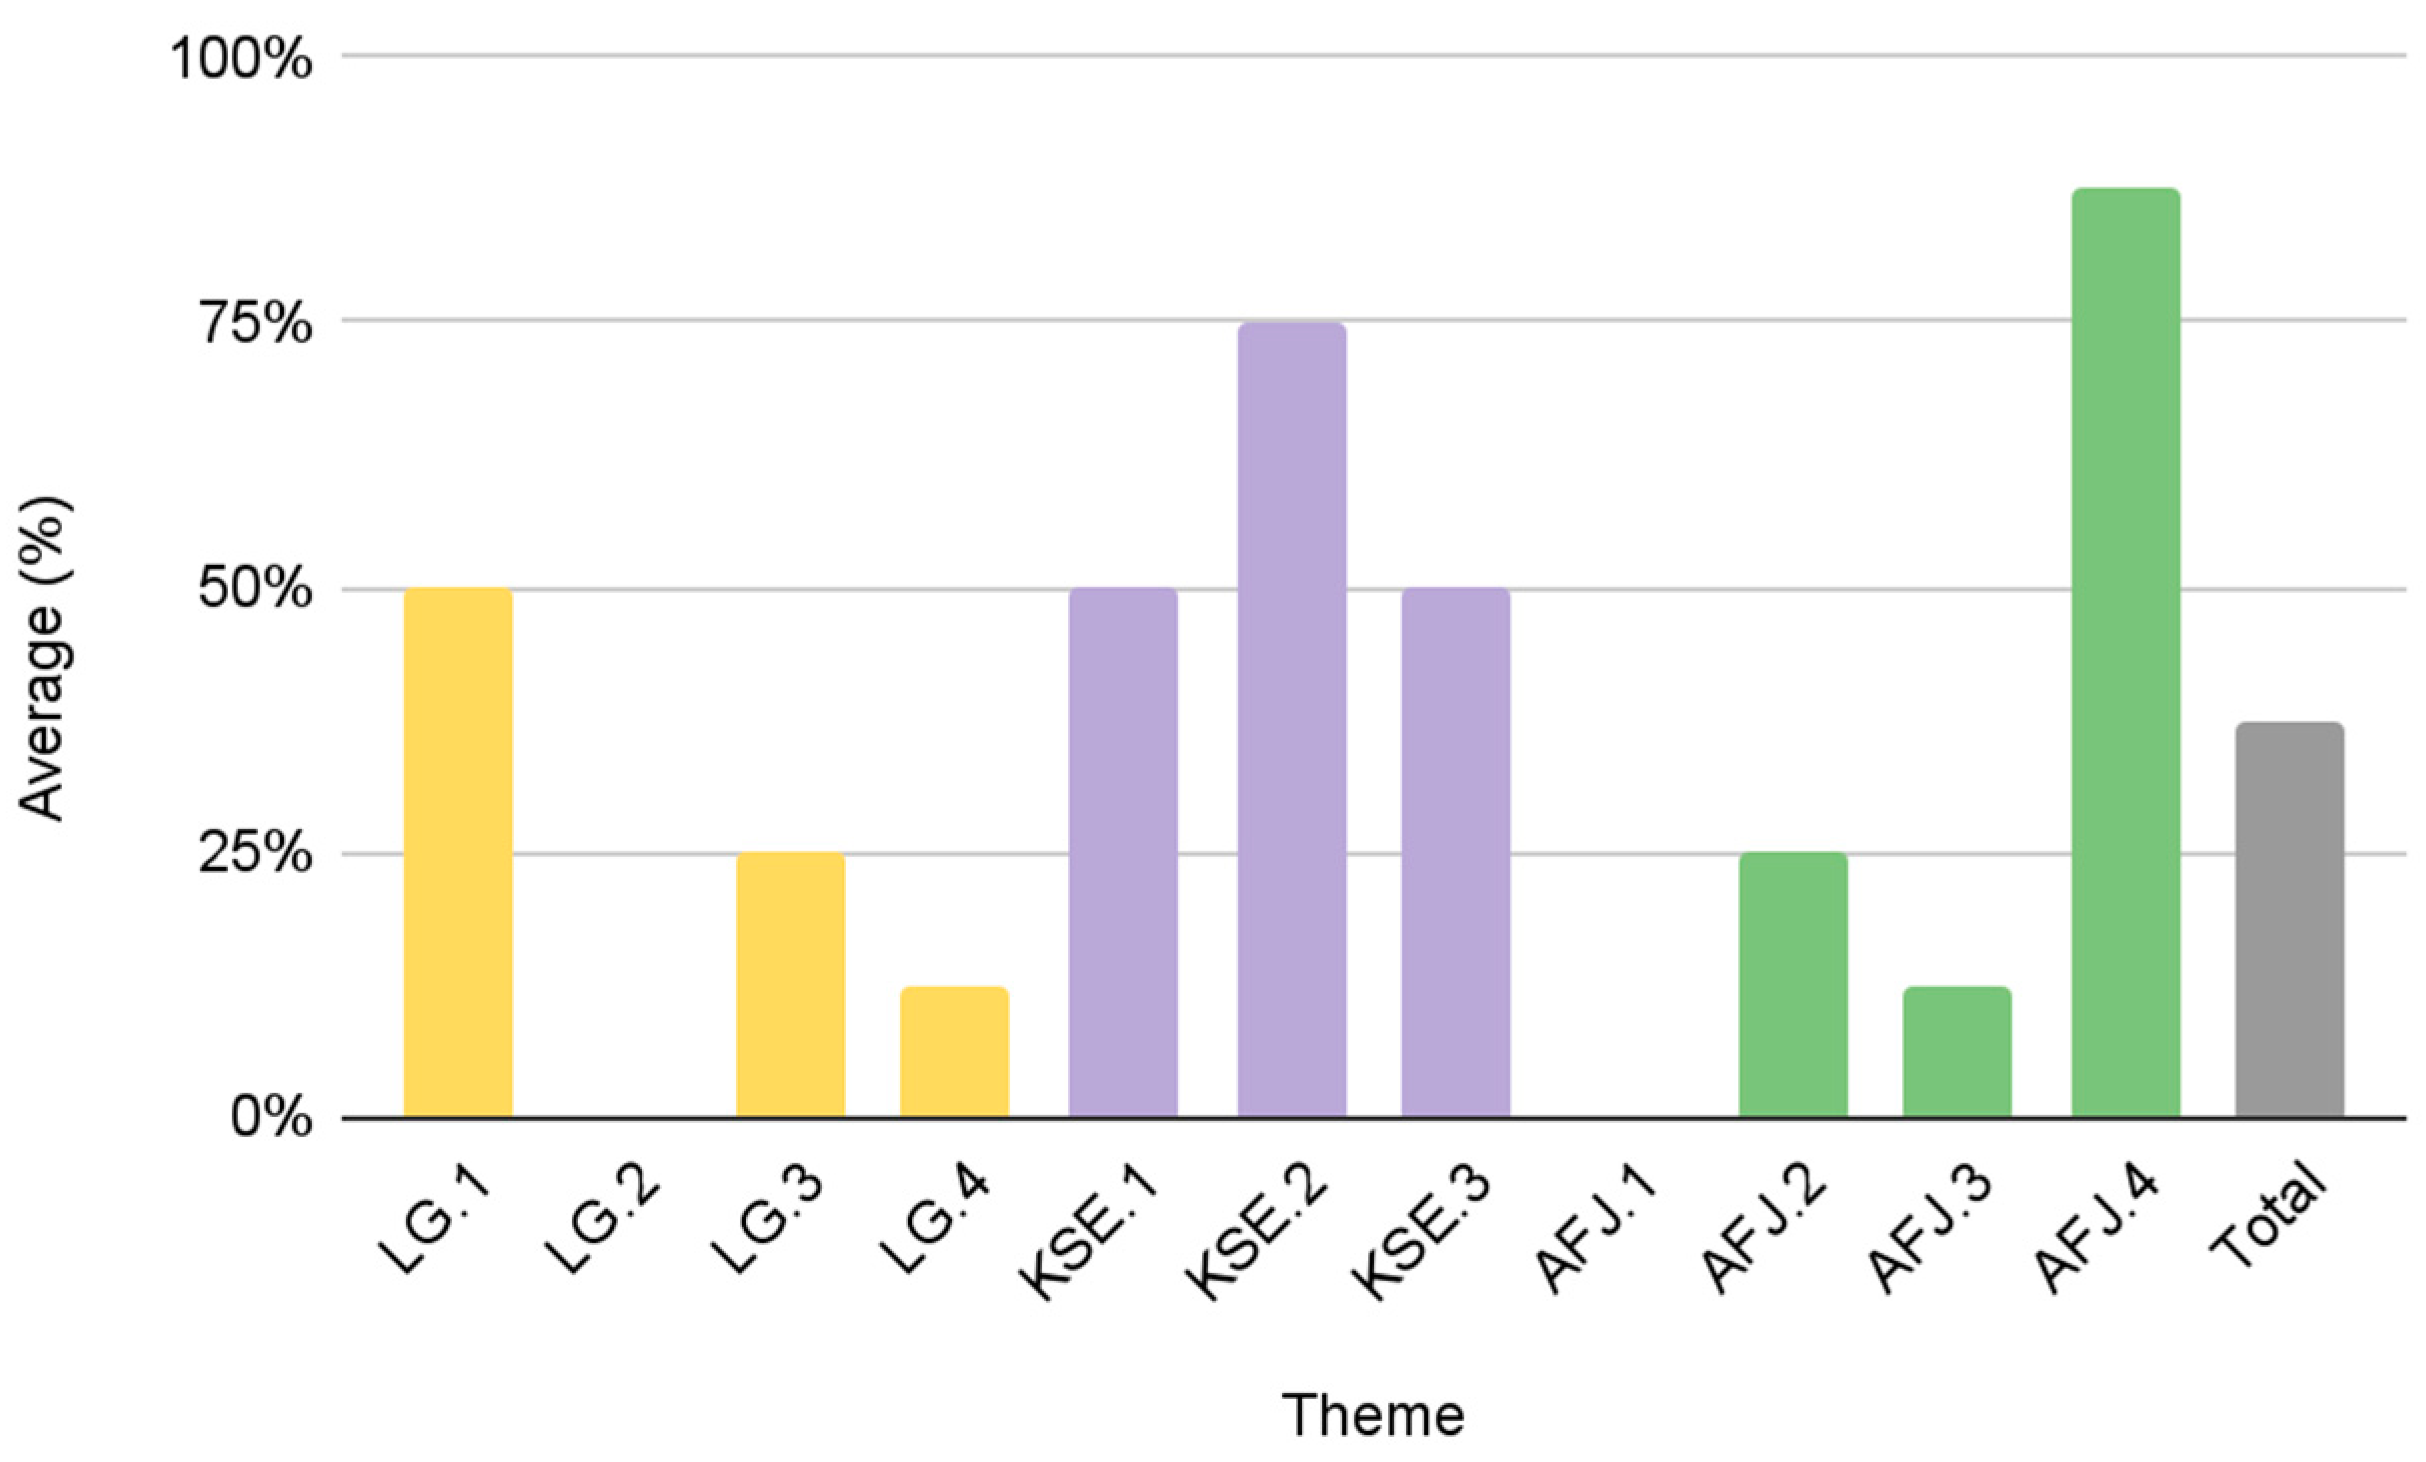
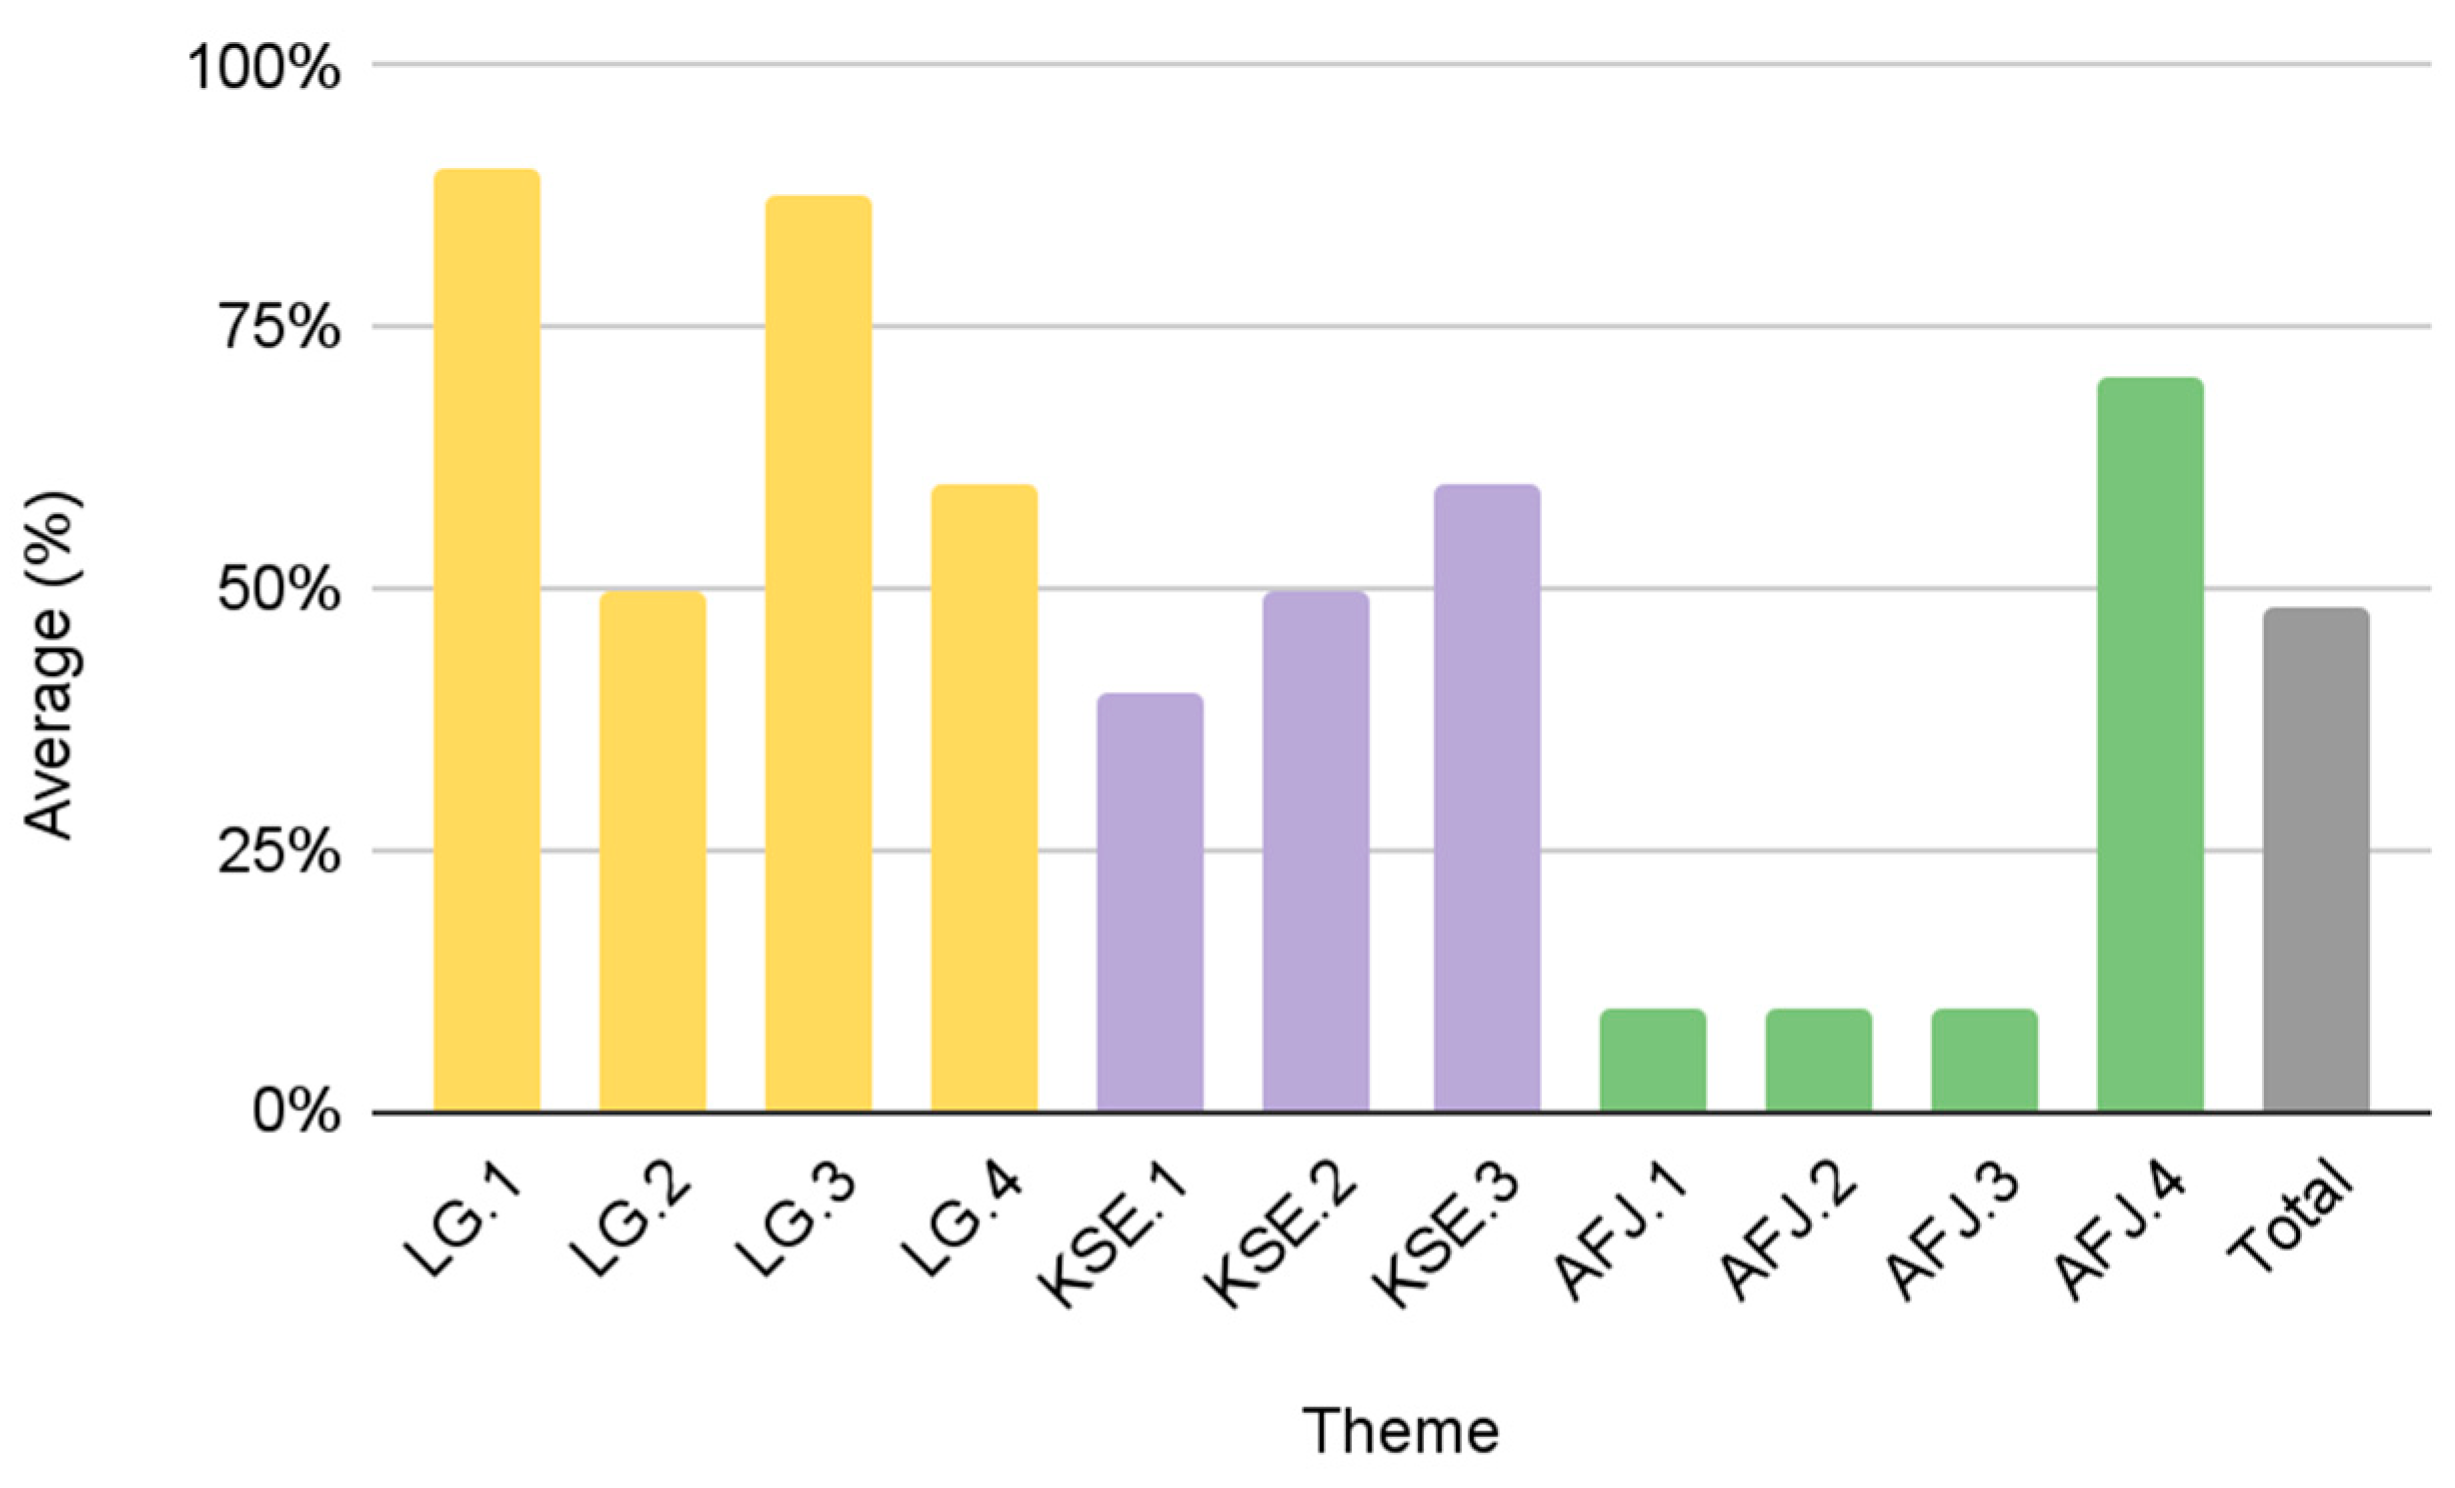
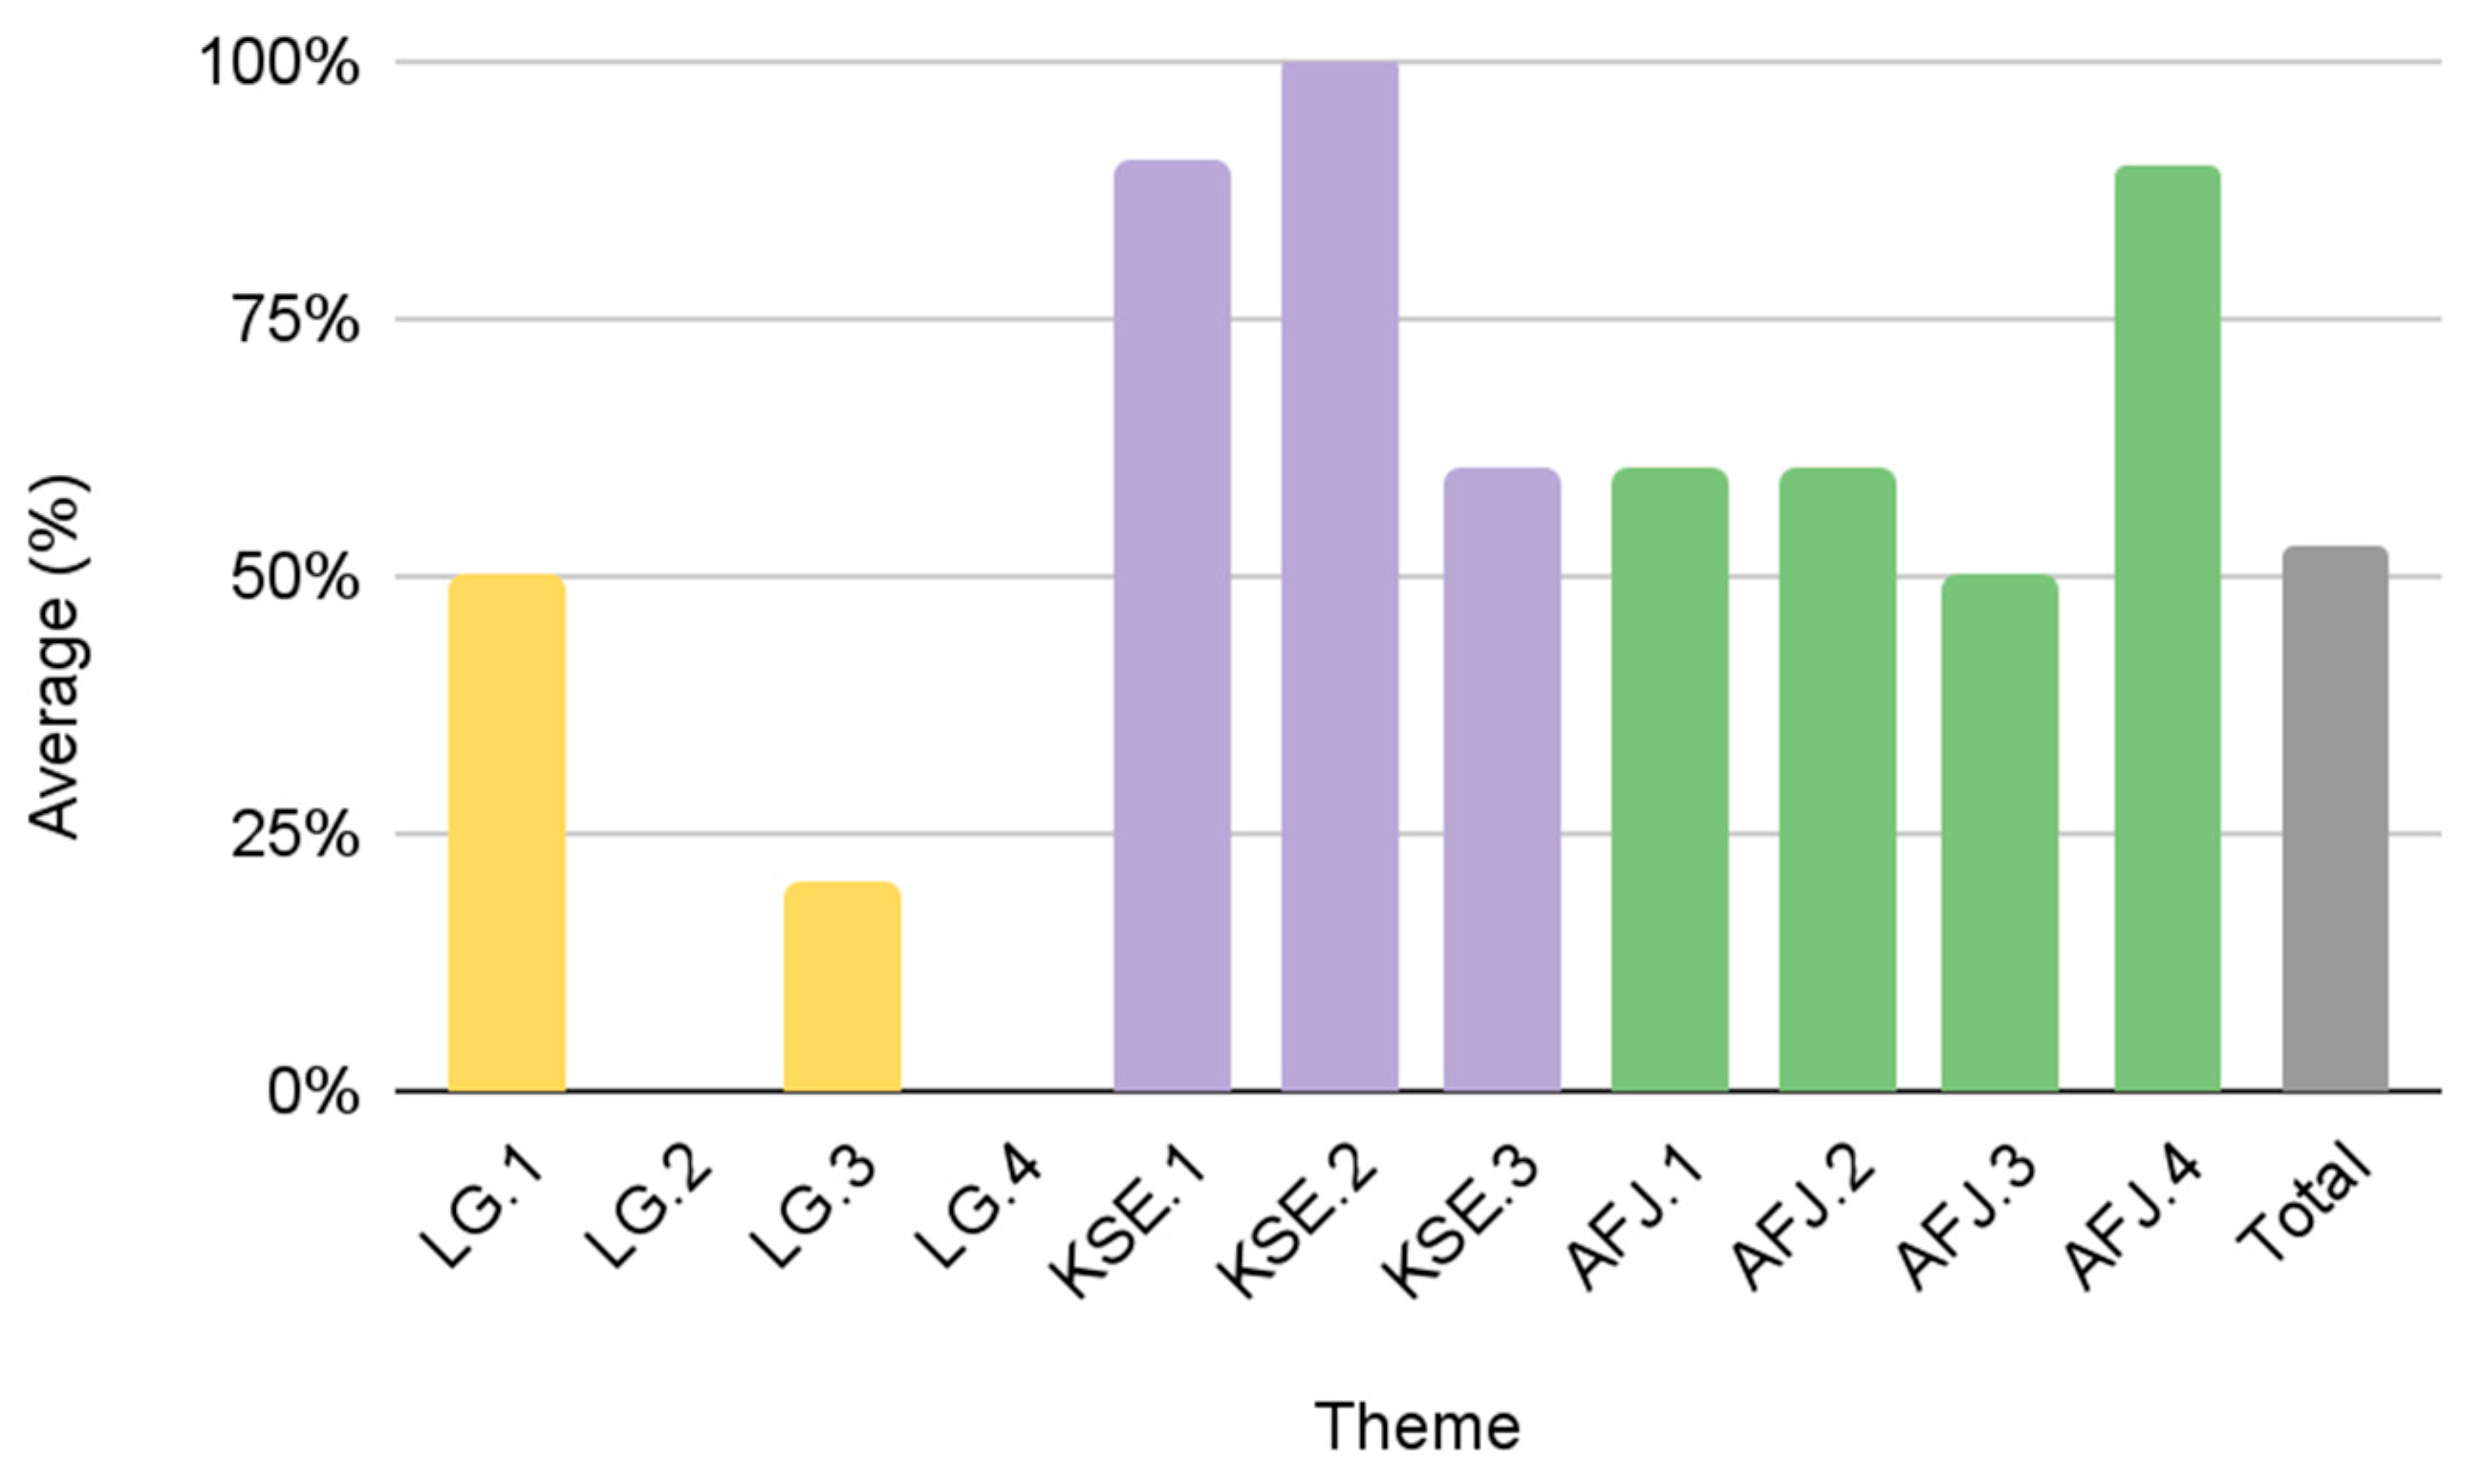
| Theme | Criteria | Rating Description (0) | Rating Description (1) | Rating Description (2) |
|---|---|---|---|---|
| Leadership and governance (LG) | (LG.1) Municipal government relations | None or N/A | Representation in leadership/ meetings | Government-sanctioned advisory/office |
| (LG.2) Governance documents/bylaws | None or N/A | Some information in public documents | Full bylaws available in public documents | |
| (LG.3) Leadership position details (pathway and term limits) | None or N/A | Information of at least one present on in public documents | Information on both present in public documents | |
| (LG.4) Diverse representation in leadership | None or N/A | Details present on in public documents | Requirement within bylaws | |
| Key stakeholder engagement (KSE) | (KSE.1) Contact and meeting information | None or N/A | Information of at least one present on in public documents | Information on both present on in public documents |
| (KSE.2) Mode of information dissemination (Including listserv/newsletter, blog/news update page, social media) | None or N/A | Information of at least one present on in public documents | Information on two or more present on in public documents | |
| (KSE.3) Essential website content including mission/vision, meeting notes, language availability | None or N/A | Information of at least one present on website | Information on two or more present on website | |
| Activities advancing food justice (AFJ) | (AFJ.1) Commitment to Diversity and Inclusion | None or N/A | Statement/position on present website | Statement/position and additional resources present website |
| (AFJ.2) Priorities via Working Groups | None or N/A | Representation for urban producers or consumers | Representation for both urban producers and consumers | |
| (AFJ.3) Priorities via Published Reports | None or N/A | Representation for urban producers or consumers | Representation for both urban producers and consumers | |
| (AFJ.4) Resources | None or N/A | Representation for urban producers or consumers | Representation for both urban producers and consumers |
References
- United States Department of Agriculture (USDA). Available online: https://www.usda.gov/our-agency/about-usda (accessed on 5 April 2023).
- United States Department of Agriculture. Diversity, Equity, Inclusion and Accessibility Strategic Plan Fiscal Year 2022–2026. Available online: https://www.usda.gov/sites/default/files/documents/usda-deia-strategic-plan.pdf (accessed on 11 March 2023).
- O’Hara, S. Valuing Socio-Diversity. Int. J. Soc. Econ. 1995, 22, 31–49. [Google Scholar] [CrossRef]
- Reed, M.; Price, M. UNESCO Biosphere Reserves: Supporting Biocultural Diversity, Sustainability and Society; Routledge: England, UK, 2020. [Google Scholar]
- Hajro, L.; Gibson, C.; Pudelko, M. Knowledge exchange processes in multicultural teams: Linking organizational diversity climates to teams’ effectiveness. Acad. Manag. J. 2017, 60, 345–372. [Google Scholar] [CrossRef]
- Choi, S.; Rainey, H.G. Managing diversity in U.S. federal agencies: Effects of diversity and diversity management on employee perceptions of organizational performance. Public Adm. Rev. 2010, 70, 109–121. [Google Scholar] [CrossRef]
- Kunze, F.; Boehm, S.; Bruch, H. Age diversity, age discrimination climate and performance consequences-a cross organizational study. J. Organ. Behav. 2010, 32, 264–290. [Google Scholar] [CrossRef]
- Tasheva, S.; Hillman, A. Integrating diversity at different levels: Multilevel human capital, social capital, and demographic diversity and their implications for team Effectiveness. Acad. Manag. Rev. 2019, 44, 746–765. [Google Scholar] [CrossRef]
- Hopkins, B. Cultural Differences and Improving Performance: How Values and Beliefs Influence Organizational Performance; Gower: Surrey, UK, 2009. [Google Scholar]
- American Public Health Association. Racial Equity and Public Health. Available online: https://www.apha.org/-/media/Files/PDF/advocacy/SPEAK/210825_Racial_Equity_Fact_Sheet.ashx (accessed on 16 April 2022).
- Range, C.; Belleny-Lewis, D. Embracing diversity and embodying inclusive leadership in nutrition and dietetics. In Effective Leadership and Management in Nutrition and Dietetics; Grim, J., Roberts, S., Eds.; Academy of Nutrition and Dietetics: Chicago, IL, USA, 2023. [Google Scholar]
- Ashikali, T.; Groeneveld, S.; Kuipers, B. The role of inclusive leadership in supporting an inclusive climate in diverse public-sector teams. Rev. Public Pers. Adm. 2021, 41, 497–519. [Google Scholar] [CrossRef]
- Miller, R.A.; Howell, C.D.; Struve, L. “Constantly, Excessively, and All the Time”: The Emotional Labor of Teaching Diversity Courses. Int. J. Teach. Learn. High. Educ. 2019, 31, 491–502. [Google Scholar]
- Jones, B.A.; Nichols, E.J. Cultural Competence in America’s Schools: Leadership, Engagement and Understanding; IAP: Charlotte, NC, USA, 2013. [Google Scholar]
- Pezzuti, C. What Food Policy Councils Should Know about the Farm Bill: A Guide for Advocacy. FPN 2022. Available online: https://www.foodpolicynetworks.org/food-policy-resources/index.html?resource=1459 (accessed on 31 October 2022).
- Gupta, C.; Campbell, D.; Munden-Dixon, K.; Sowerwine, J.; Capps, S.; Feenstra, G.; Kim, J.V.S. Food policy councils and local governments: Creating effective collaboration for food systems change. J. Agric. Food Syst. Community Dev. 2018, 8, 11–28. [Google Scholar] [CrossRef]
- Moore, K.; Swisher, M.E. The food movement: Growing white privilege, diversity, or empowerment? J. Agric. Food Syst. Community Dev. 2015, 5, 115–119. [Google Scholar] [CrossRef]
- O’Brien, J.; Cobb, T.D. The food policy audit: A new tool for community food system planning. J. Agric. Food Syst. Community Dev. 2012, 2, 177–191. [Google Scholar] [CrossRef]
- Calancie, L.; Stritzinger, N.; Konich, J.; Horton, C.; Allen, N.E.; Ng, S.W.; Weiner, B.J.; Ammerman, A.S. Food policy council case study describing cross-sector collaboration for food system change in a rural setting. Prog. Community Health Partnersh. Res. Educ. Act. 2017, 11, 441–447. [Google Scholar] [CrossRef]
- Frey, W.H. Census: Big Cities Grew and Became More Diverse, Especially among Their Youth. Available online: https://www.brookings.edu/research/2020-census-big-cities-grew-and-became-more-diverse-especially-among-their-youth/ (accessed on 12 October 2022).
- Cronquist, K. Characteristics of Supplemental Nutrition Assistance Program Households: Fiscal Year 2019 (SNAP-20-CHAR). USDA 2021. Available online: https://fns-prod.azureedge.us/sites/default/files/resource-files/Characteristics2019.pdf (accessed on 28 January 2023).
- Johnson, R.; Monke, J. What is the farm bill? (RS22131). Available online: https://sgp.fas.org/crs/misc/RS22131.pdf (accessed on 12 October 2022).
- United States Department of Agriculture. Selected Charts from Ag and Food Statistics: Charting the Essentials. ERS 2020, 083. Available online: https://www.ers.usda.gov/webdocs/publications/96957/ap-083.pdf?v=2378.1 (accessed on 28 January 2023).
- United States Department of Agriculture National Agricultural Statistics Service (USDA NASS). 2017 Census of Agriculture Highlights: Farm Producers CA 2019. Available online: https://www.nass.usda.gov/Publications/Highlights/2019/2017Census_Farm_Producers.pdf (accessed on 28 January 2023).
- United States Department of Agriculture (USDA). Former Secretaries. n.d.b. Available online: https://www.usda.gov/our-agency/about-usda/history/former-secretaries (accessed on 12 October 2022).
- United States Department of Agriculture Economic Research Service (USDA ERS). FAQs. 2022. Available online: https://www.ers.usda.gov/faqs (accessed on 28 January 2023).
- Library of Congress (LOC). History of the United States Farm Bill. LOC n.d. Available online: https://www.loc.gov/ghe/cascade/index.html?appid=1821e70c01de48ae899a7ff708d6ad8b&bookmark=What%20is%20the%20Farm%20Bil (accessed on 12 October 2022).
- Hassenburg, A.H. Nurturing the Revolution: The black panther party and the early seeds of the food justice movement. In Black Food Matters; Garth, H., Reese, A., Eds.; UMP: Minneapolis, MN, USA, 2020. [Google Scholar]
- Saied, T.; Jordan, W.; Leslie, H. The Food and Nutrition Assistance Landscape: Fiscal Year 2020 Annual Report. ERS 2021, 227. Available online: https://www.ers.usda.gov/publications/pub-details/?pubid=101908 (accessed on 28 January 2023).
- Dawes, D.E.; Williams, D.R. The Political Determinants of Health; JHUP: Baltimore, MD, USA, 2020. [Google Scholar]
- Garth, H.; Reese, A. Black Food Matters; UMP: Minneapolis, MN, USA, 2020. [Google Scholar]
- Odoms-Young, A.; Bruce, M.A. Examining the impact of structural racism on food insecurity: Implications for addressing racial/ethnic disparities. FCH 2018, 41, S3–S6. [Google Scholar] [CrossRef] [PubMed]
- Coleman-Jensen, A.; Rabbitt, M.P.; Gregory, C.A.; Singh, A. Household Food Security in the United States in 2021 (ERR-309). USDAERS 2022. Available online: https://www.ers.usda.gov/webdocs/publications/104656/err-309.pdf?v=9292.4 (accessed on 28 January 2023).
- United States Department of Agriculture. USDA Actions on Nutrition Security. [Video] Youtube. Available online: https://www.youtube.com/watch?v=PRW_vnzpdbc (accessed on 17 March 2022).
- Boden, S.; Hoover, B.M. Food policy councils in the mid-Atlantic: Working toward justice. J. Agric. Food Syst. Community Dev. 2018, 8, 39–52. [Google Scholar] [CrossRef]
- Berglund, E.; Hassanein, N.; Lachapelle, P.; Stephens, C. Advancing food democracy: The potential and limits of food policy positions in local government. J. Agric. Food Syst. Community Dev. 2021, 11, 1–18. [Google Scholar] [CrossRef]
- Bassarab, K.; Clark, J.K.; Santo, R.; Palmer, A. Finding our way to food democracy: Lessons from US food policy council governance. Politics Gov. 2019, 7, 32–47. [Google Scholar] [CrossRef]
- Scherb, A.; Palmer, A.; Frattaroli, S.; Pollack, K. Exploring food system policy: A survey of food policy councils in the United States. J. Agric. Food Syst. Community Dev. 2012, 2, 3–14. [Google Scholar] [CrossRef]
- O’Hara, S.; Toussaint, E.C. Food access in crisis: Food security and COVID-19. Ecol. Econ. 2021, 180, 106859. [Google Scholar] [CrossRef]
- Stuiver, M.; O’Hara, S. Food connects Washington DC in 2050-a vision for urban food systems as the centerpieces of a circular economy. Sustainability 2021, 13, 7821. [Google Scholar] [CrossRef]
- Lange, S.J.; Calancie, L.; Onufrak, S.J.; Reddy, K.T.; Palmer, A.; Lowry, W.A. Associations between food policy councils and policies that support healthy food access: A national survey of community policy supports. Nutrients 2021, 13, 683. [Google Scholar] [CrossRef] [PubMed]
- Santo, R.; Bassarab, K.; Kessler, M.; Palmer, A. State of the research: An annotated bibliography on existing, emerging, and needed research on food policy groups (2nd edition). Baltim. MD John Hopkins Univ. 2020. Available online: https://assets.jhsph.edu/clf/mod_clfResource/doc/Main-FPN%20Annotated%20Bibliography-2020_final.pdf (accessed on 12 October 2022).
- Santo, R.; Misiaszek, C.; Bassarab, K.; Harris, D.; Palmer, A. Pivoting Policy, Programs and Partnerships: Food Policy Councils’ Responses to the Crises of 2020; John Hopkins, Center for a Livable Future: 2020. Available online: https://www.foodpolicynetworks.org/food-policy-resources/index.html (accessed on 12 October 2022).
- Glaros, A.; Alexander, C.; Koberinski, J.; Scott, S.; Quilley, S.; Si, Z. A systems approach to navigating food security during COVID-19: Gaps, opportunities, and policy support. J. Agric. Food Syst. Community Dev. 2021, 10, 211. [Google Scholar] [CrossRef]
- Clark, J.K. From Civic Group to Advocacy Coalition: Using a Food Policy Audit as a Tool for Change. J. Agric. Food Syst. Community Dev. 2018, 8, 21–38. [Google Scholar] [CrossRef]
- Schiff, R. The Role of Food Policy Councils in Developing Sustainable Food Systems. J. Hunger Environ. Nutr. 2008, 3, 206–228. [Google Scholar] [CrossRef]
- Clayton, M.L.; Frattaroli, S.; Palmer, A.; Pollack, K.M. The role of partnerships in US food policy council policy activities. PLoS ONE 2015, 10, e0122870. [Google Scholar] [CrossRef]
- Office of Urban Agriculture and Innovative Production Urban Agriculture. USDA (n.d.c). Available online: https://www.usda.gov/topics/urban (accessed on 28 January 2023).
- Johnson, R.; Cowan, T. Farm Bill Primer; CRS: Washington, DC, USA, 2019. [Google Scholar]
- Siegner, A.; Sowerwine, J.; Acey, C. Does urban agriculture improve food security? Examining the nexus of food access and distribution of urban produced foods in the United States: A Systematic Review. Sustainability 2018, 10, 2988. [Google Scholar] [CrossRef]
- United States Census Bureau Geography Division. Census Regions and Divisions of the United States (n.d.). Available online: https://www2.census.gov/geo/pdfs/maps-data/maps/reference/us_regdiv.pdf (accessed on 12 January 2023).
- Vaismoradi, M.; Turunen, H.; Bondas, T. Content analysis and thematic analysis: Implications for conducting a qualitative descriptive dtudy. Nurs. Health Sci. 2013, 15, 398–405. [Google Scholar] [CrossRef]
- Krippendorff, K. Content Analysis: An Introduction to Its Methodology; SP: Philadelphia, PA, USA, 2018. [Google Scholar]
- Shariatmadari, H.; O’Hara, S.; Graham, R.; Stuiver, M. Are food hubs sustainable? An analysis of social and environmental objectives of U.S. food hubs. Sustainability 2023, 15, 2308. [Google Scholar] [CrossRef]
- Calancie, L.; Allen, N.E.; Ng, S.W.; Weiner, B.J.; Ward, D.S.; Ware, W.B.; Ammerman, A.S. Evaluating food policy councils using structural equation modeling. Am. J. Community Psychol. 2018, 61, 251–264. [Google Scholar] [CrossRef] [PubMed]
- Calancie, L.; Cooksey-Stowers, K.; Palmer, A.; Frost, N.; Calhoun, H.; Piner, A.; Webb, K. Toward a community impact assessment for food policy councils: Identifying potential impact domains. J. Agric. Food Syst. Community Dev. 2018, 8, 123–136. [Google Scholar] [CrossRef]
- Coplen, A.K.; Cueno, M. Dissolved: Lessons learned from the Portland Multnomah food policy council. J. Agric. Food Syst. Community Dev. 2015, 5, 91–107. [Google Scholar] [CrossRef]
- Moschetti, W.P.; Horn, E.; Bain, J.; Freishta, H.; Roy, P. Funding Food Policy Councils: Stories from the Field. Available online: https://assets.jhsph.edu/clf/mod_clfResource/doc/FundingFPCsStoriesfromtheField_6-12-15.pdf (accessed on 31 October 2022).
- Burgan, M.; Bassarab, K.; Palmer, A.; Santo, R.; Winne, M. From Partnerships to Policy: Promising Practices for New Food Policy Councils. Available online: https://assets.jhsph.edu/clf/mod_clfResource/doc/FPC-action-guide_2022-06-24.pdf (accessed on 31 October 2022).
- Fink, J. Equitable Compensation for Food Policy Council Engagement. Available online: https://www.foodpolicynetworks.org/food-policy-resources/?resource=1469 (accessed on 31 October 2022).
- Hall, L.; Nchako, C. A Closer Look at Who Benefits from SNAP: State-by-State Fact Sheets. Available online: https://www.cbpp.org/research/food-assistance/a-closer-look-at-who-benefits-from-snap-state-by-state-fact-sheets (accessed on 28 January 2023).


| Category | Type | N (%) | Cumulative Score (%) |
|---|---|---|---|
| Organizational Affiliation | Government advisory group, office of intergovernmental task force | 14 (56%) | 63 |
| Nonprofit organization 501(c)(3) | 8 (32%) | 48 | |
| Coalition | 0 (0%) | 0 | |
| N/A | 3 (12%) | 0 | |
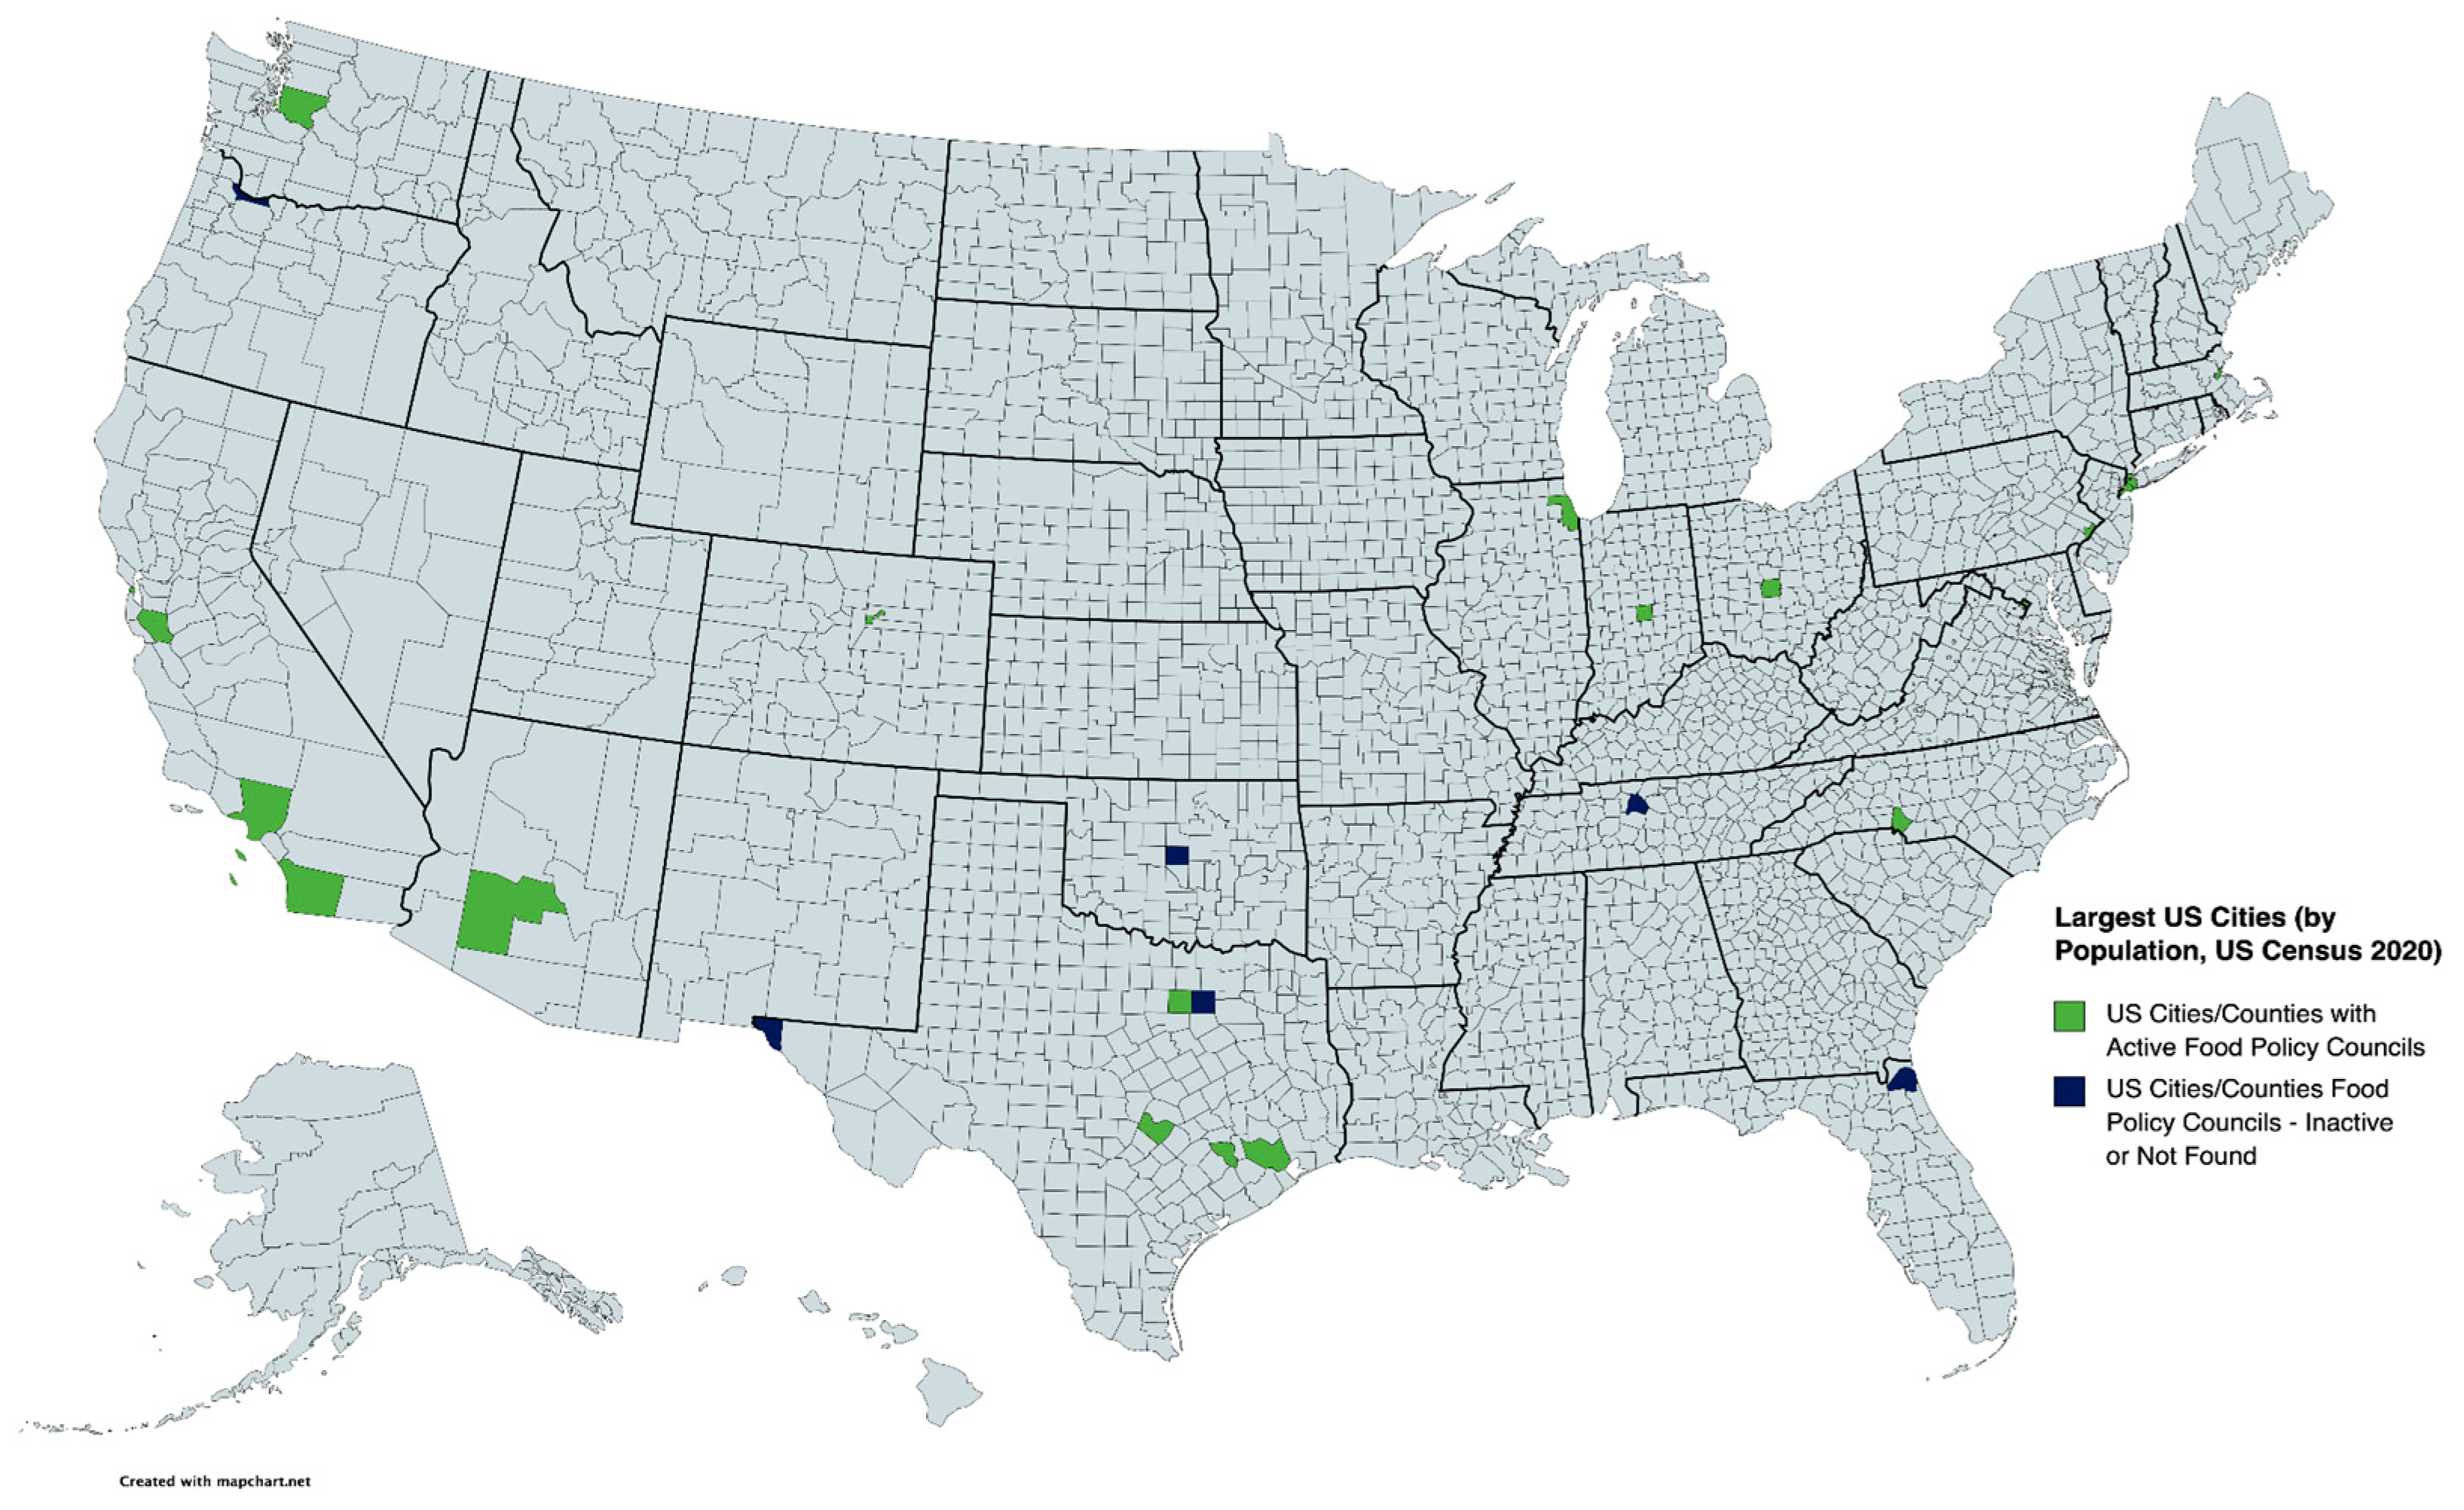
| Locale Representation | City/Municipality | 11 (44%) | 56 |
| City–County | 7 (28%) | 62 | |
| County | 4 (16%) | 50 | |
| N/A | 3 (12%) | 0 | |
| Pathway of Inception | Municipality Government (Mayoral/ Executive Order; Municipal Legislation) | 13 (52%) | 63 |
| Coalition | 5 (20%) | 46 | |
| Grant | 4 (16%) | 48 | |
| N/A | 3 (12%) | 0 | |
| Region in the U.S. | West | 8 (32%) | 52 |
| South | 11 (44%) | 58 | |
| Midwest | 3 (12%) | 59 | |
| Northeast | 3 (12%) | 65 |
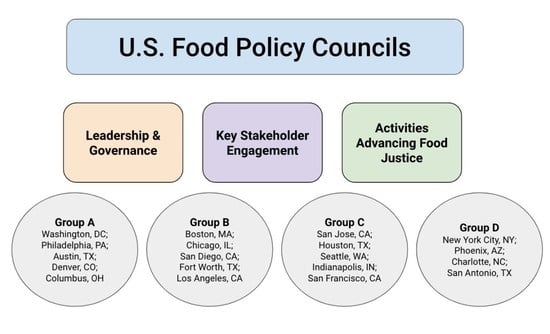
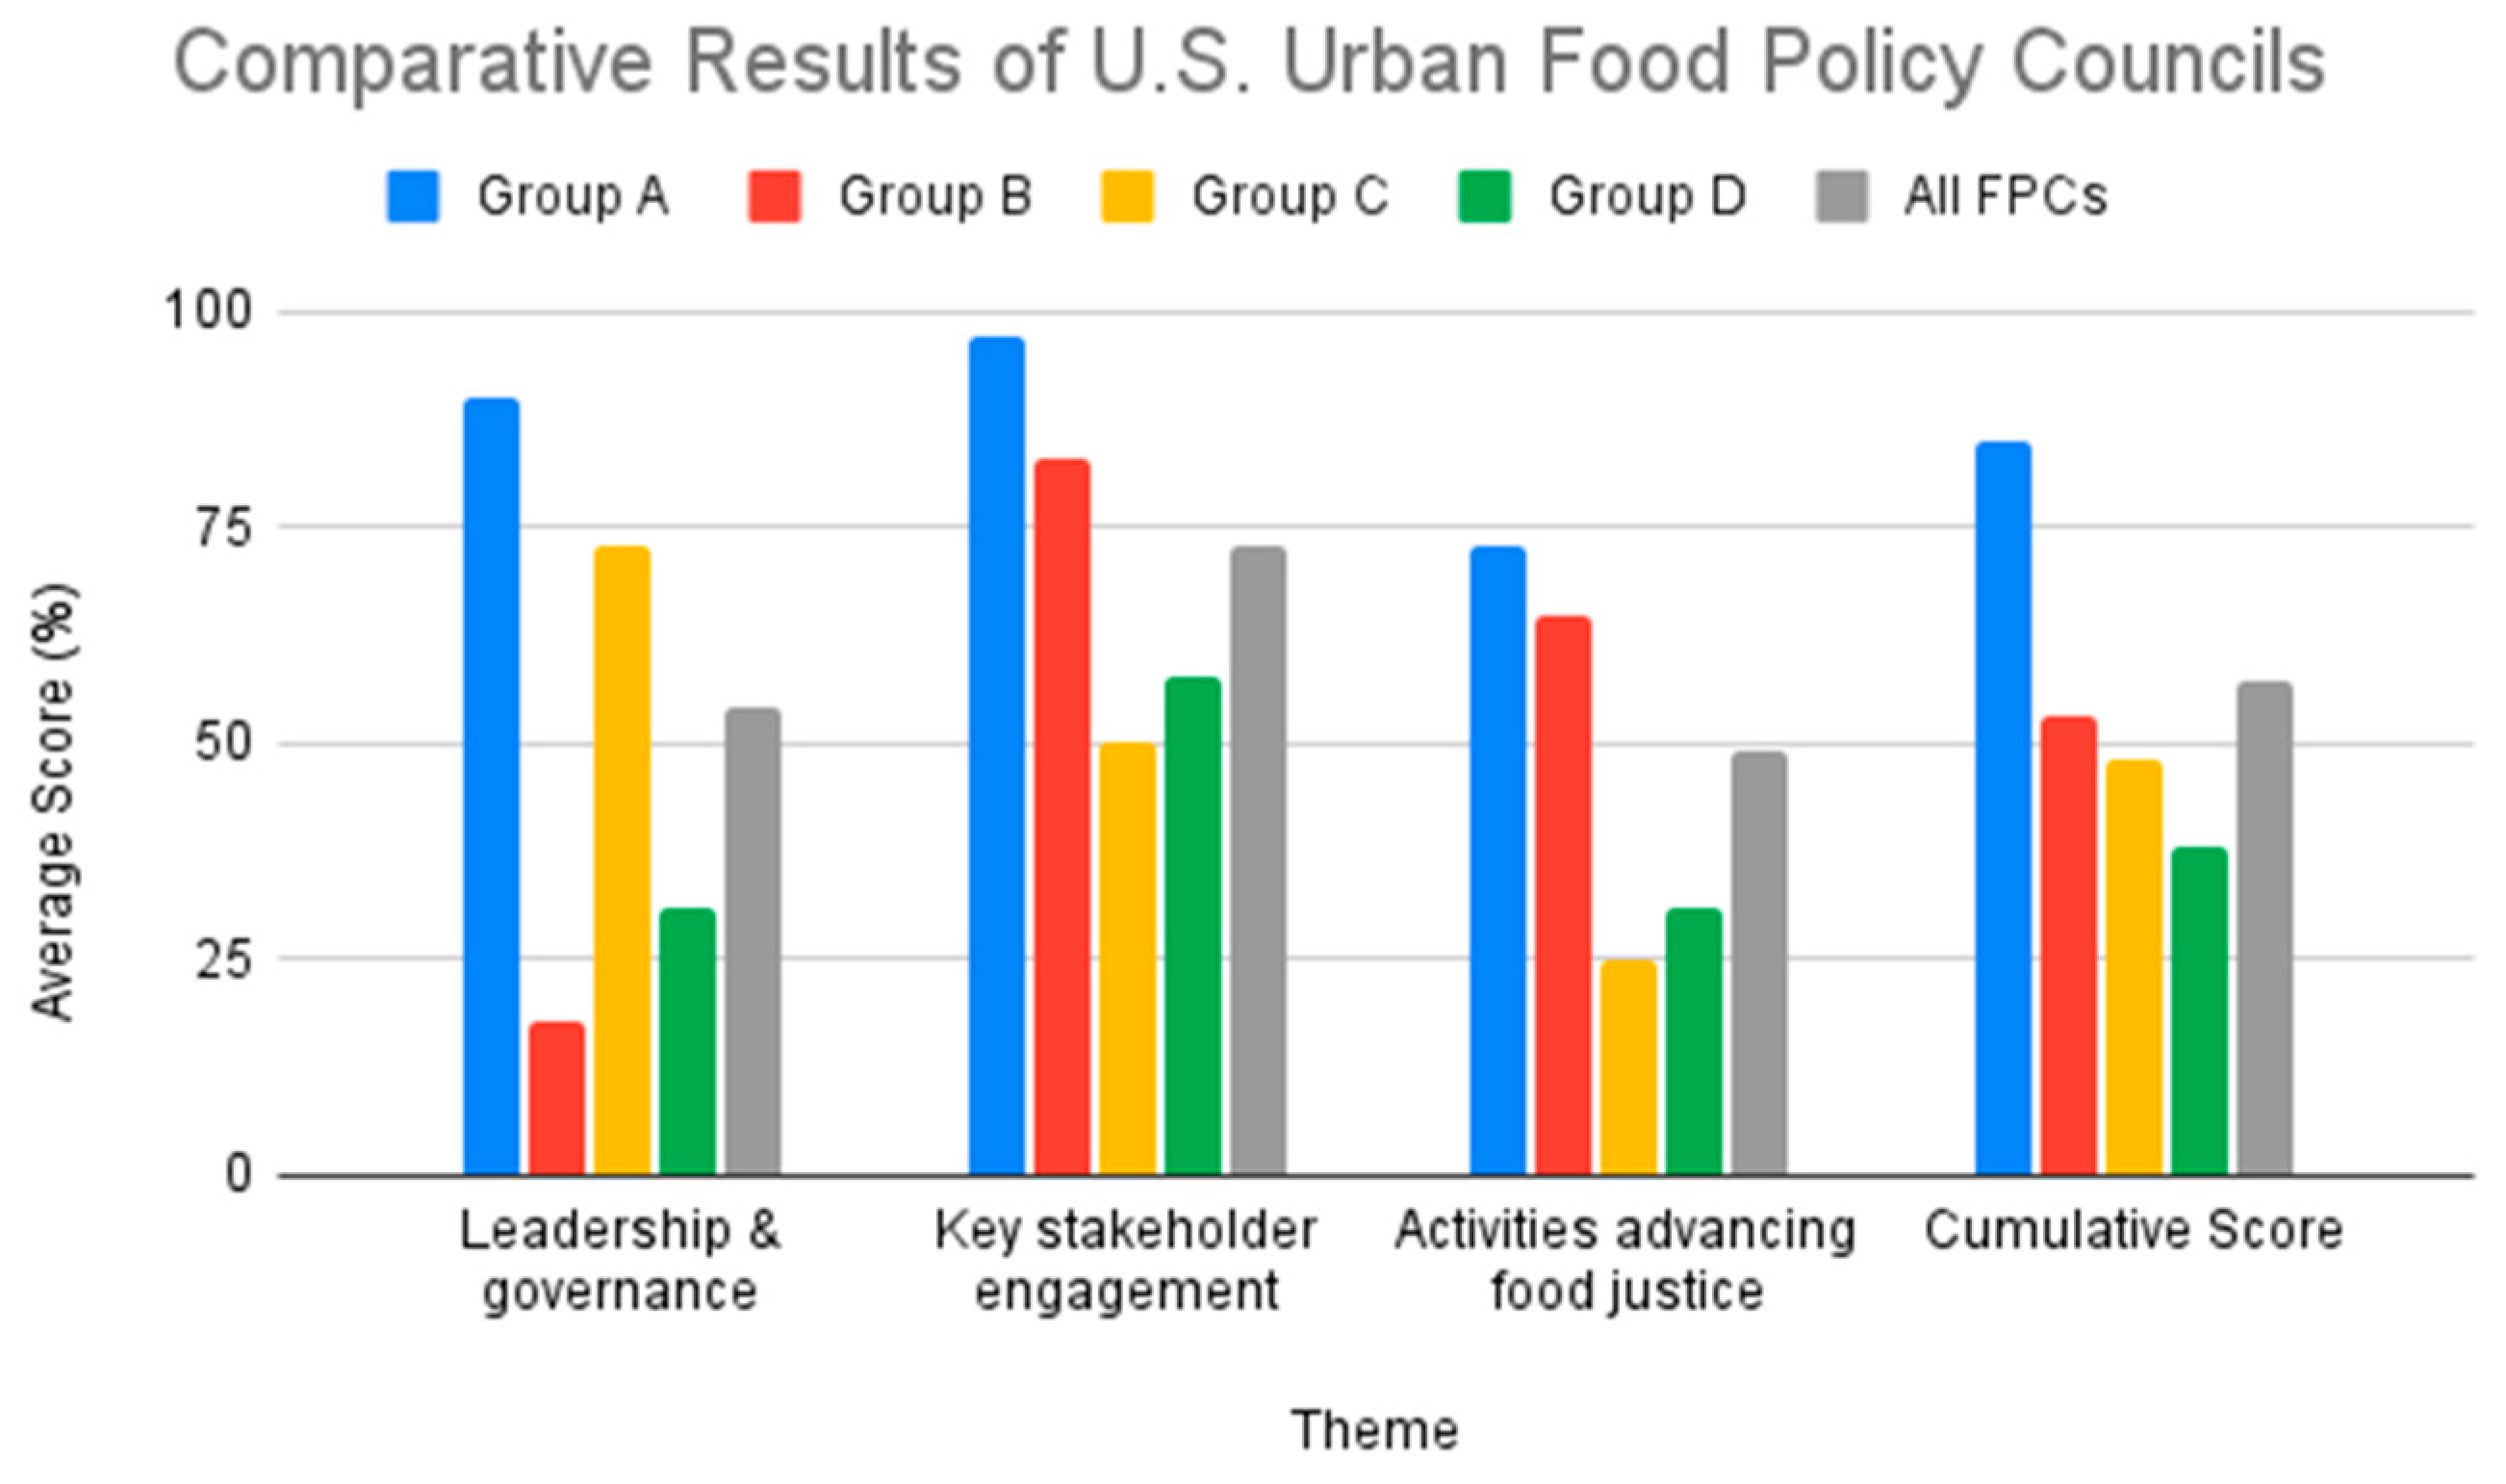
| Group | Total (n) | FPCs in Group | LG (%) | KSE (%) | AFJ (%) | Cumulative Score (%) |
|---|---|---|---|---|---|---|
| All | 19 | - | 54 | 73 | 49 | 57 |
| Group A | 5 | Washington, DC, USA; Philadelphia, PA, USA; Austin, TX, USA; Denver, CO, USA; Columbus, OH, USA | 90 (High) | 97 (High) | 73 (High) | 85 |
| Group B | 5 | Boston, MA, USA; Chicago, IL, USA; San Diego, CA, USA; Fort Worth, TX, USA; Los Angeles, CA, USA | 18 (Low) | 83 (High) | 65 (High) | 53 |
| Group C | 5 | San Jose, CA, USA; Houston, TX, USA; Seattle, WA, USA; Indianapolis, IN, USA; San Francisco, CA, USA | 73 (High) | 50 (Low) | 25 (Low) | 48 |
| Group D | 4 | New York, NY, USA; Phoenix, AZ, USA; Charlotte, NC, USA; San Antonio, TX, USA | 31 (Low) | 58 (Low) | 31 (Low) | 38 |
Disclaimer/Publisher’s Note: The statements, opinions and data contained in all publications are solely those of the individual author(s) and contributor(s) and not of MDPI and/or the editor(s). MDPI and/or the editor(s) disclaim responsibility for any injury to people or property resulting from any ideas, methods, instructions or products referred to in the content. |
© 2023 by the authors. Licensee MDPI, Basel, Switzerland. This article is an open access article distributed under the terms and conditions of the Creative Commons Attribution (CC BY) license (https://creativecommons.org/licenses/by/4.0/).
Share and Cite
Range, C.; O’Hara, S.; Jeffery, T.; Toussaint, E.C. Measuring the Effectiveness of Food Policy Councils in Major Cities in the United States. Foods 2023, 12, 1854. https://doi.org/10.3390/foods12091854
Range C, O’Hara S, Jeffery T, Toussaint EC. Measuring the Effectiveness of Food Policy Councils in Major Cities in the United States. Foods. 2023; 12(9):1854. https://doi.org/10.3390/foods12091854
Chicago/Turabian StyleRange, Camille, Sabine O’Hara, Tia Jeffery, and Etienne C. Toussaint. 2023. "Measuring the Effectiveness of Food Policy Councils in Major Cities in the United States" Foods 12, no. 9: 1854. https://doi.org/10.3390/foods12091854