Effect of Different Vegetable Oils on the Flavor of Fried Green Onion (Allium fistulosum L.) Oil

Abstract
:1. Introduction
2. Materials and Methods
2.1. Materials and Chemicals
2.2. Oil Preparation
2.3. Isolation of the Volatiles by Solvent-Assisted Flavor Evaporation (SAFE)
2.4. Gas Chromatography-Mass Spectrometry (GC-MS) Analysis
2.5. Identification of Volatiles
2.6. Electronic Nose Analysis
2.7. Determination of the Fatty Acids Contents
2.8. Sensory Analysis
2.9. Statistical Analysis
3. Results and Discussions
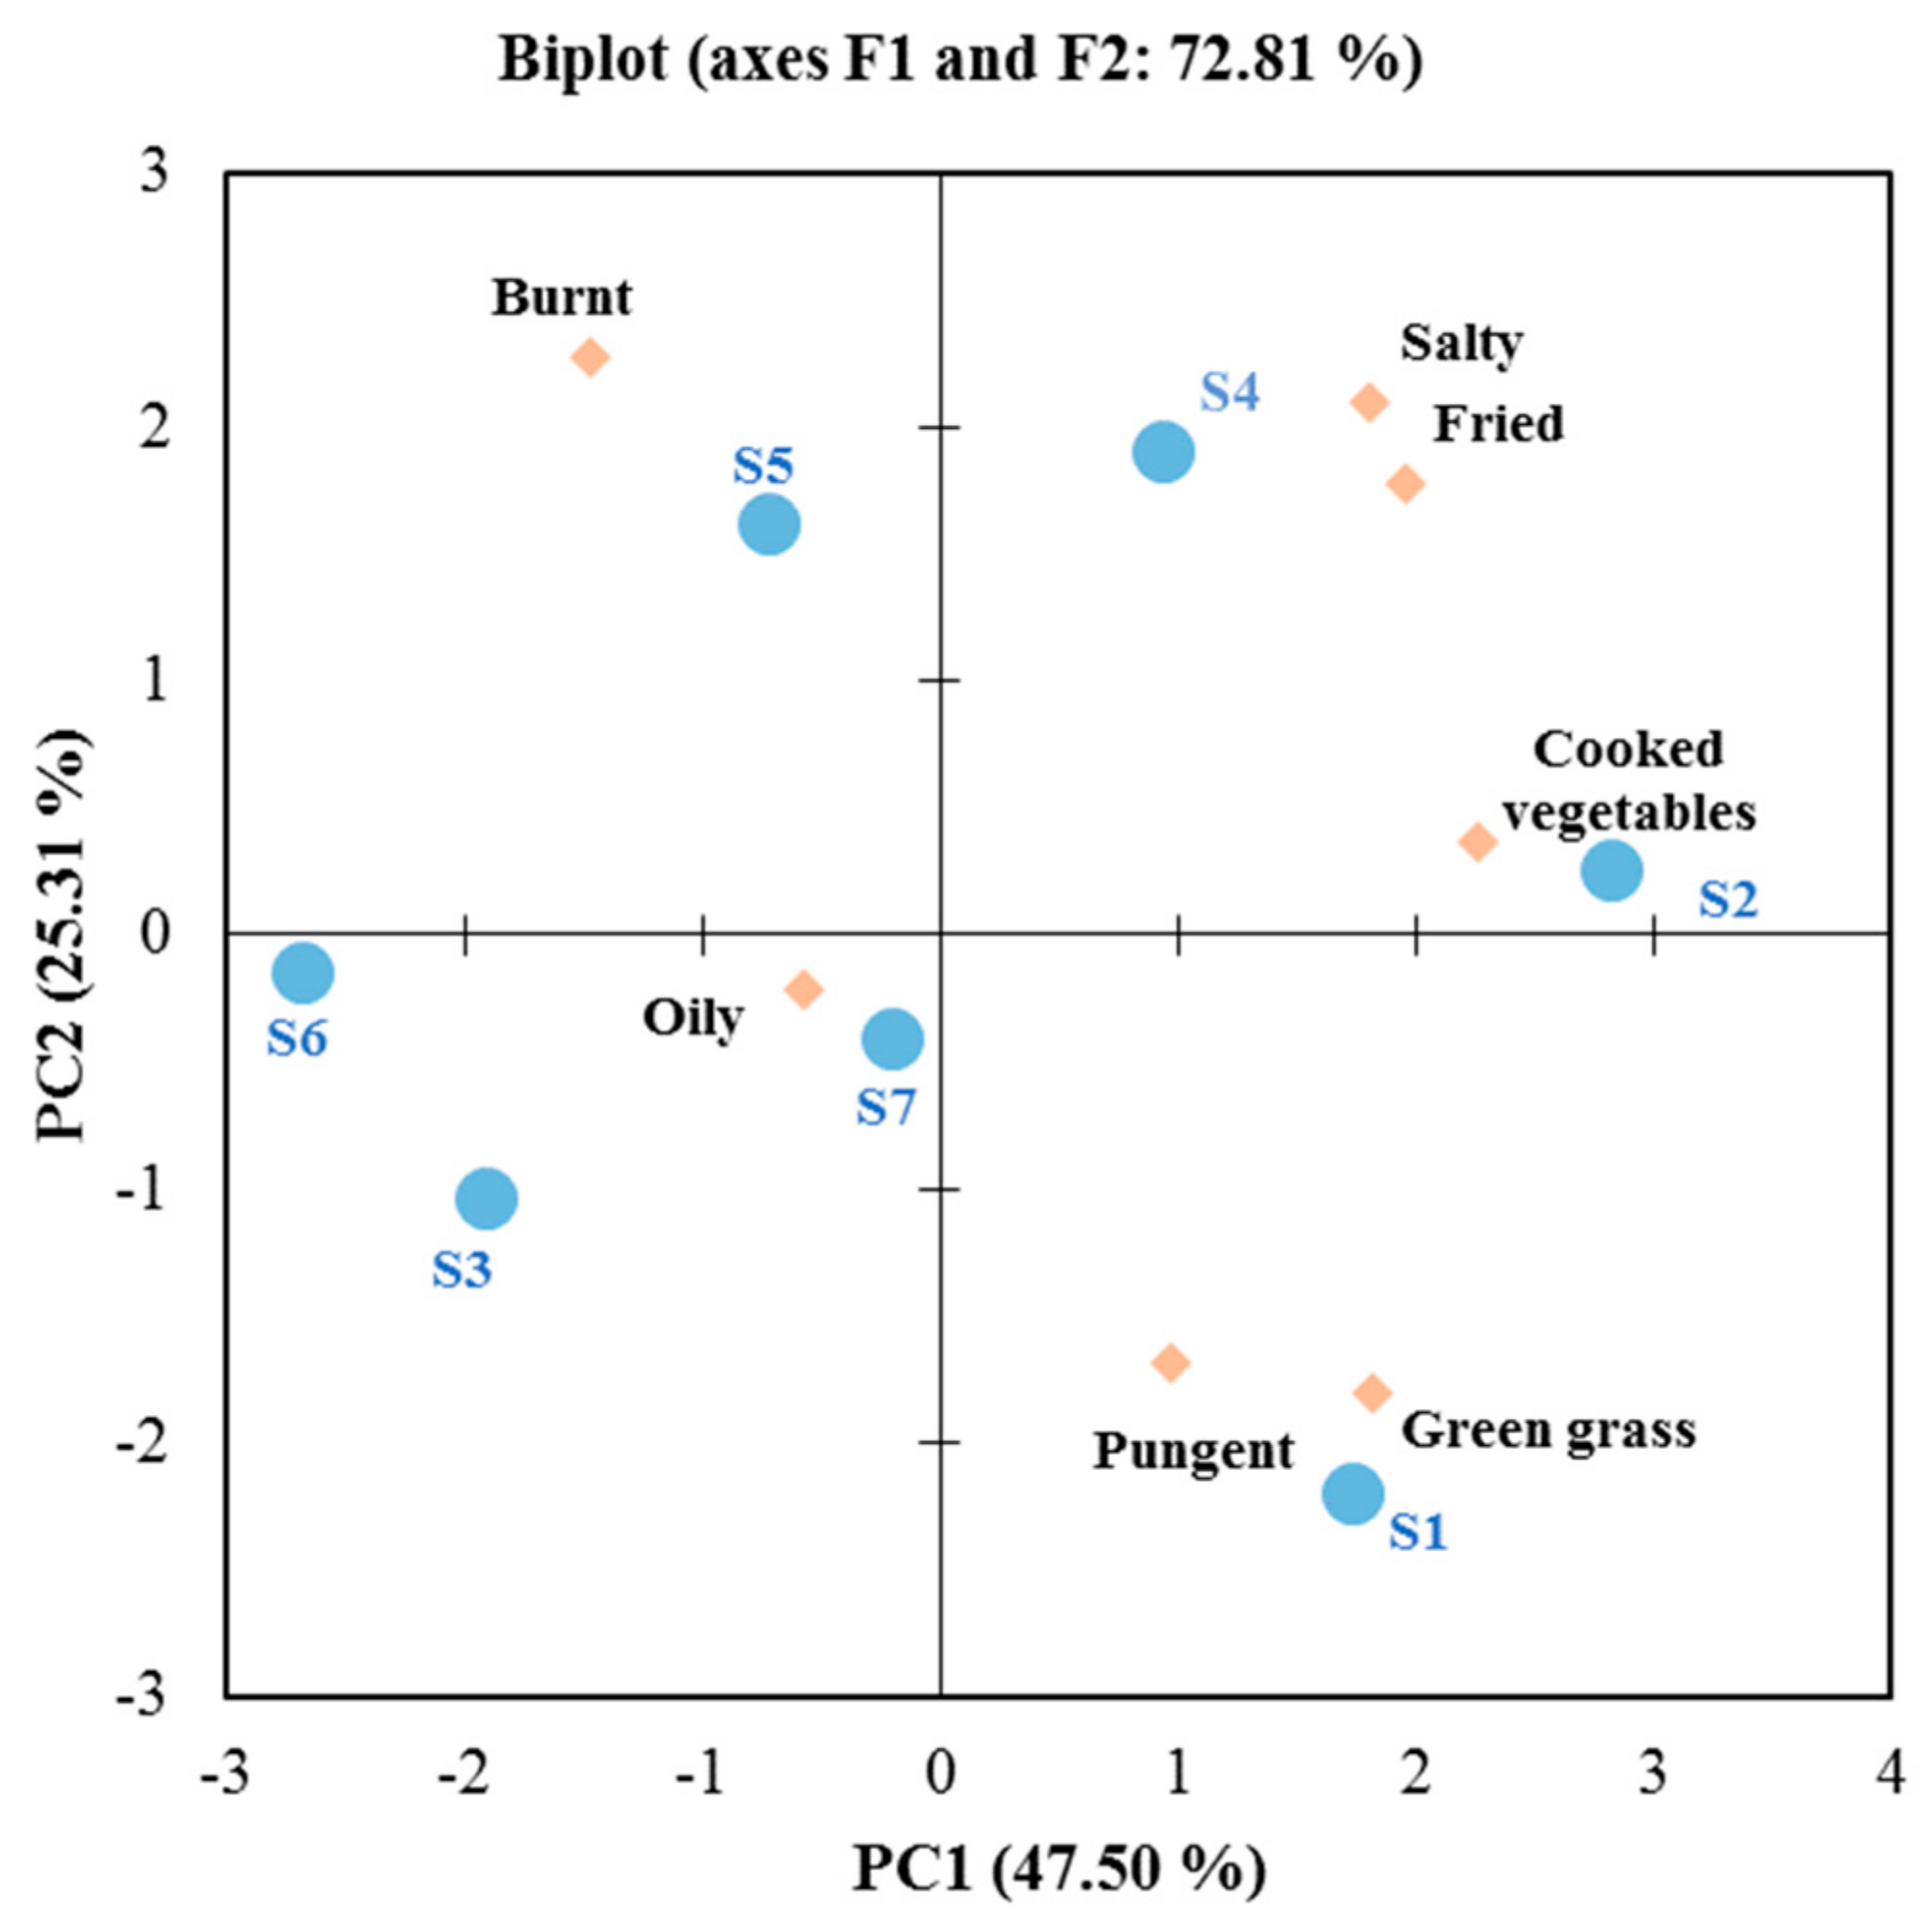
3.1. Sensory Analysis of Fried Oils
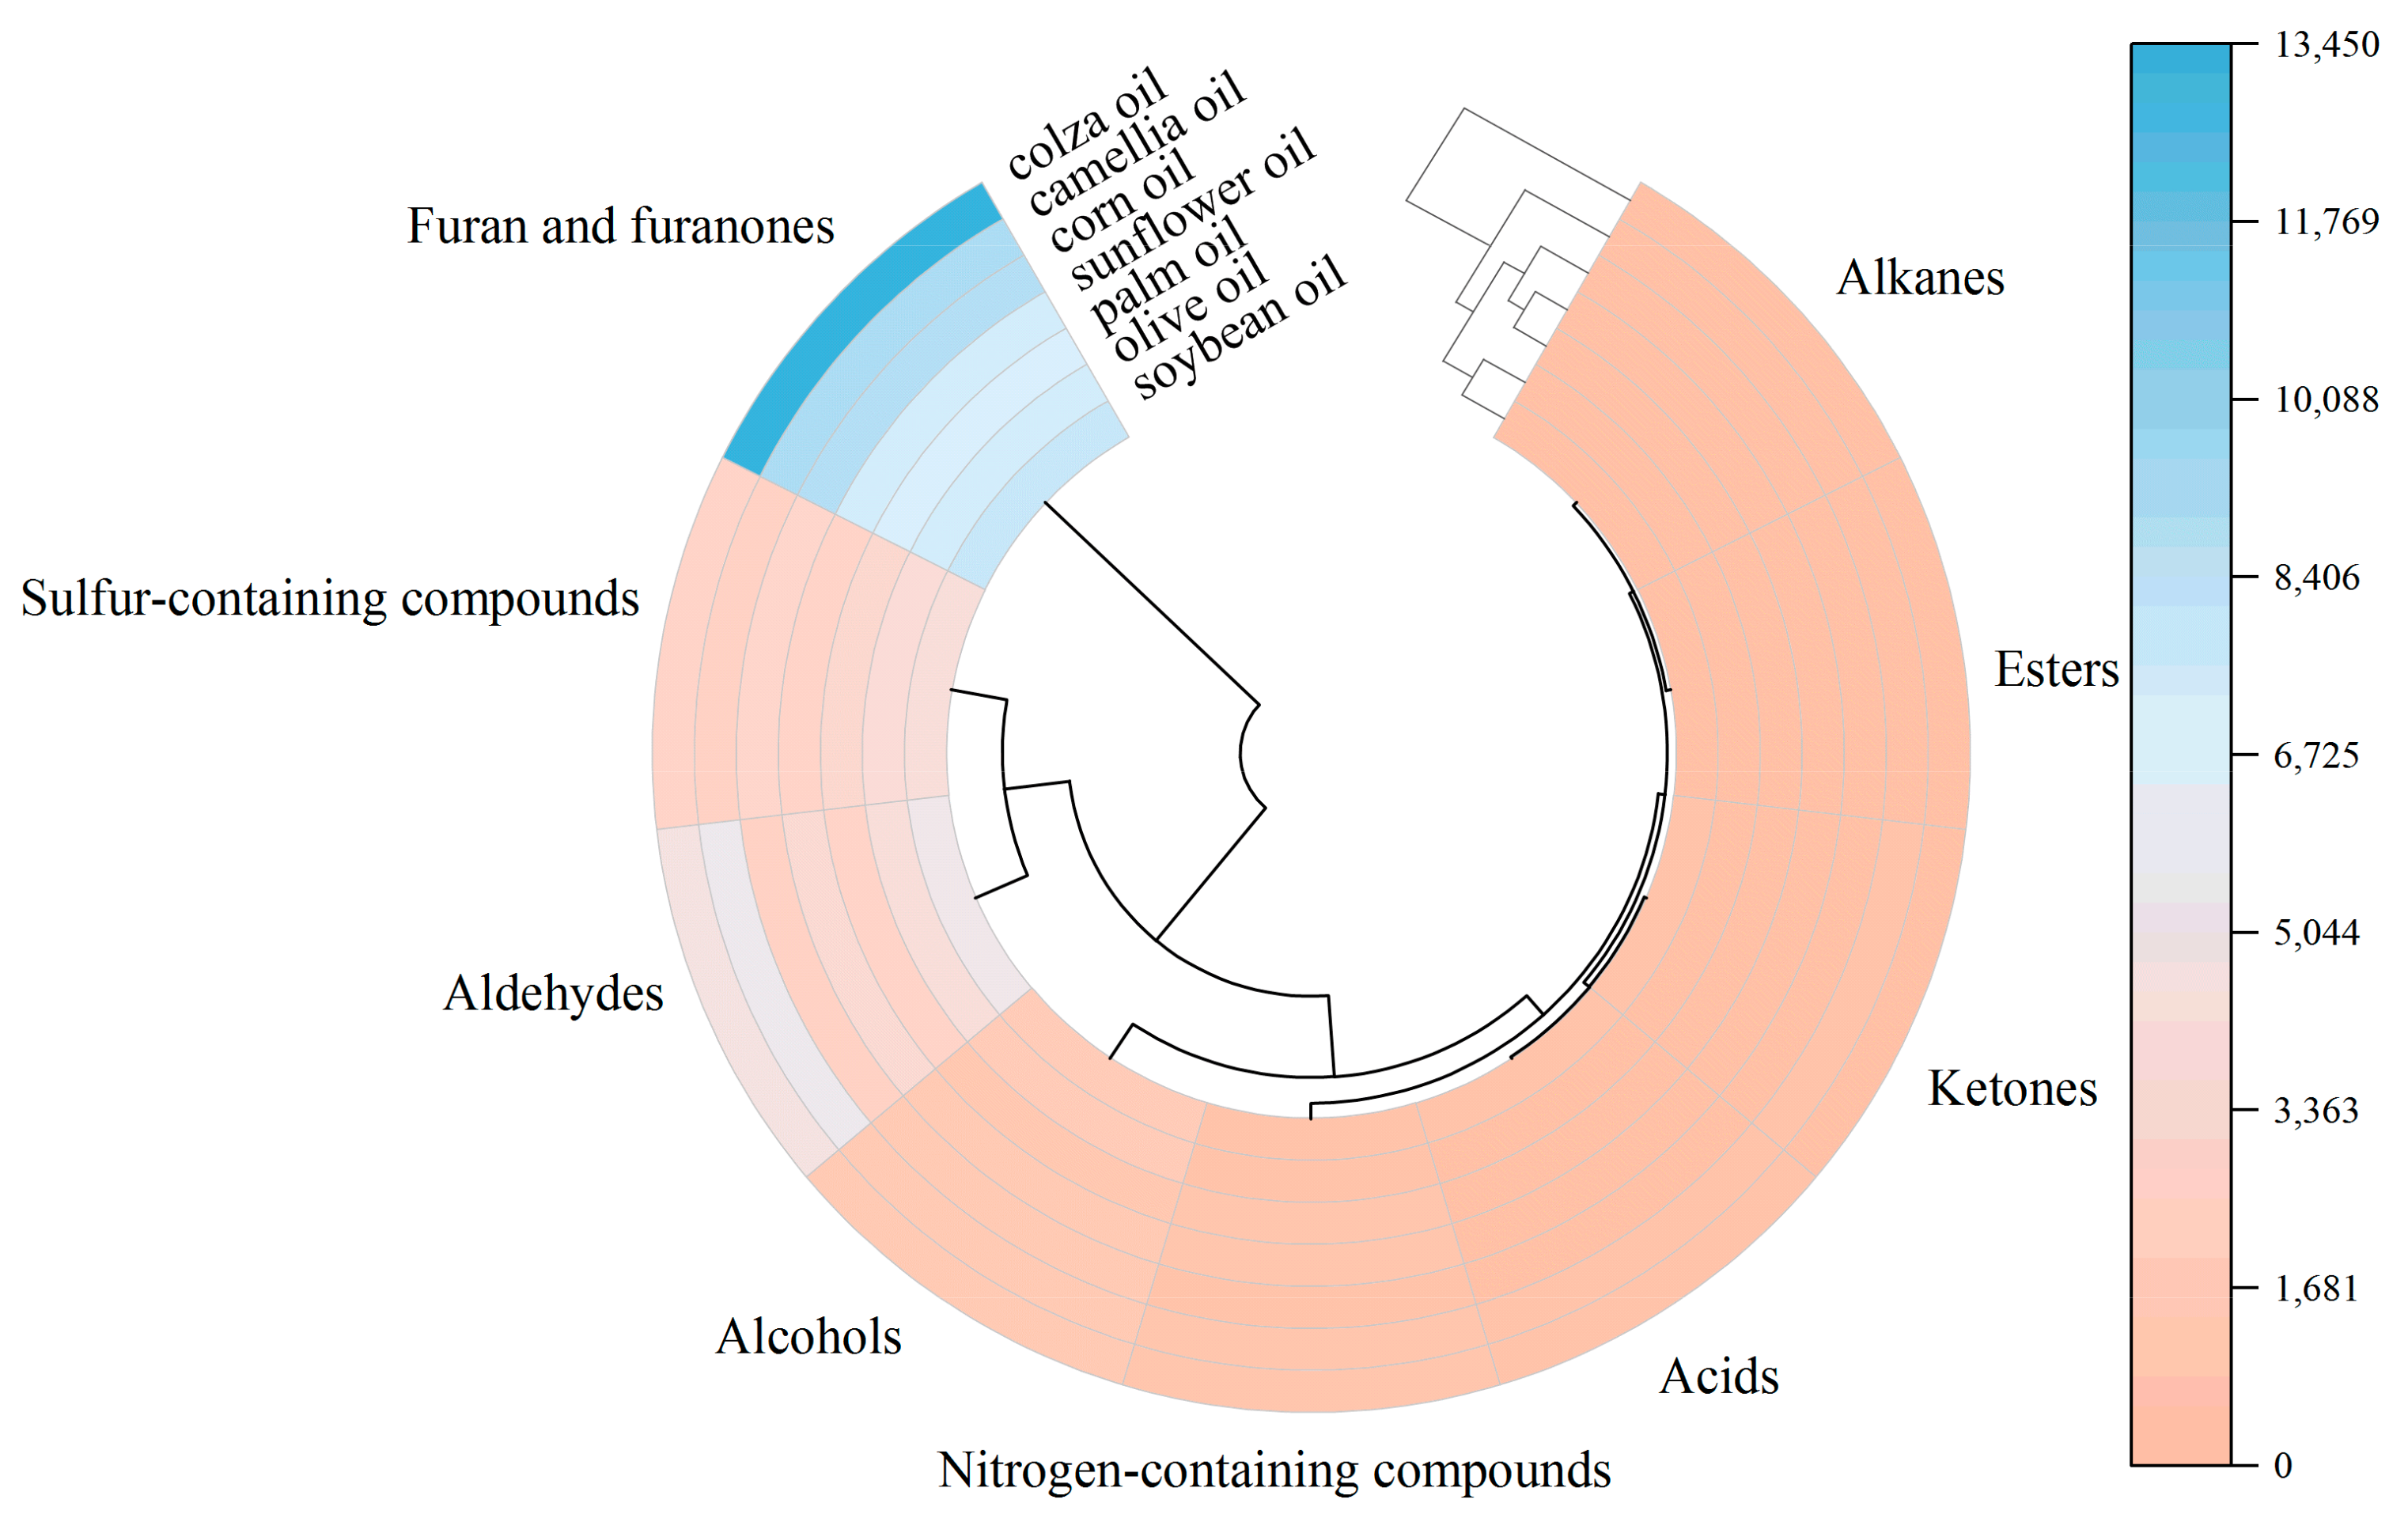
3.2. Volatile Compound Analysis of Fried Oils
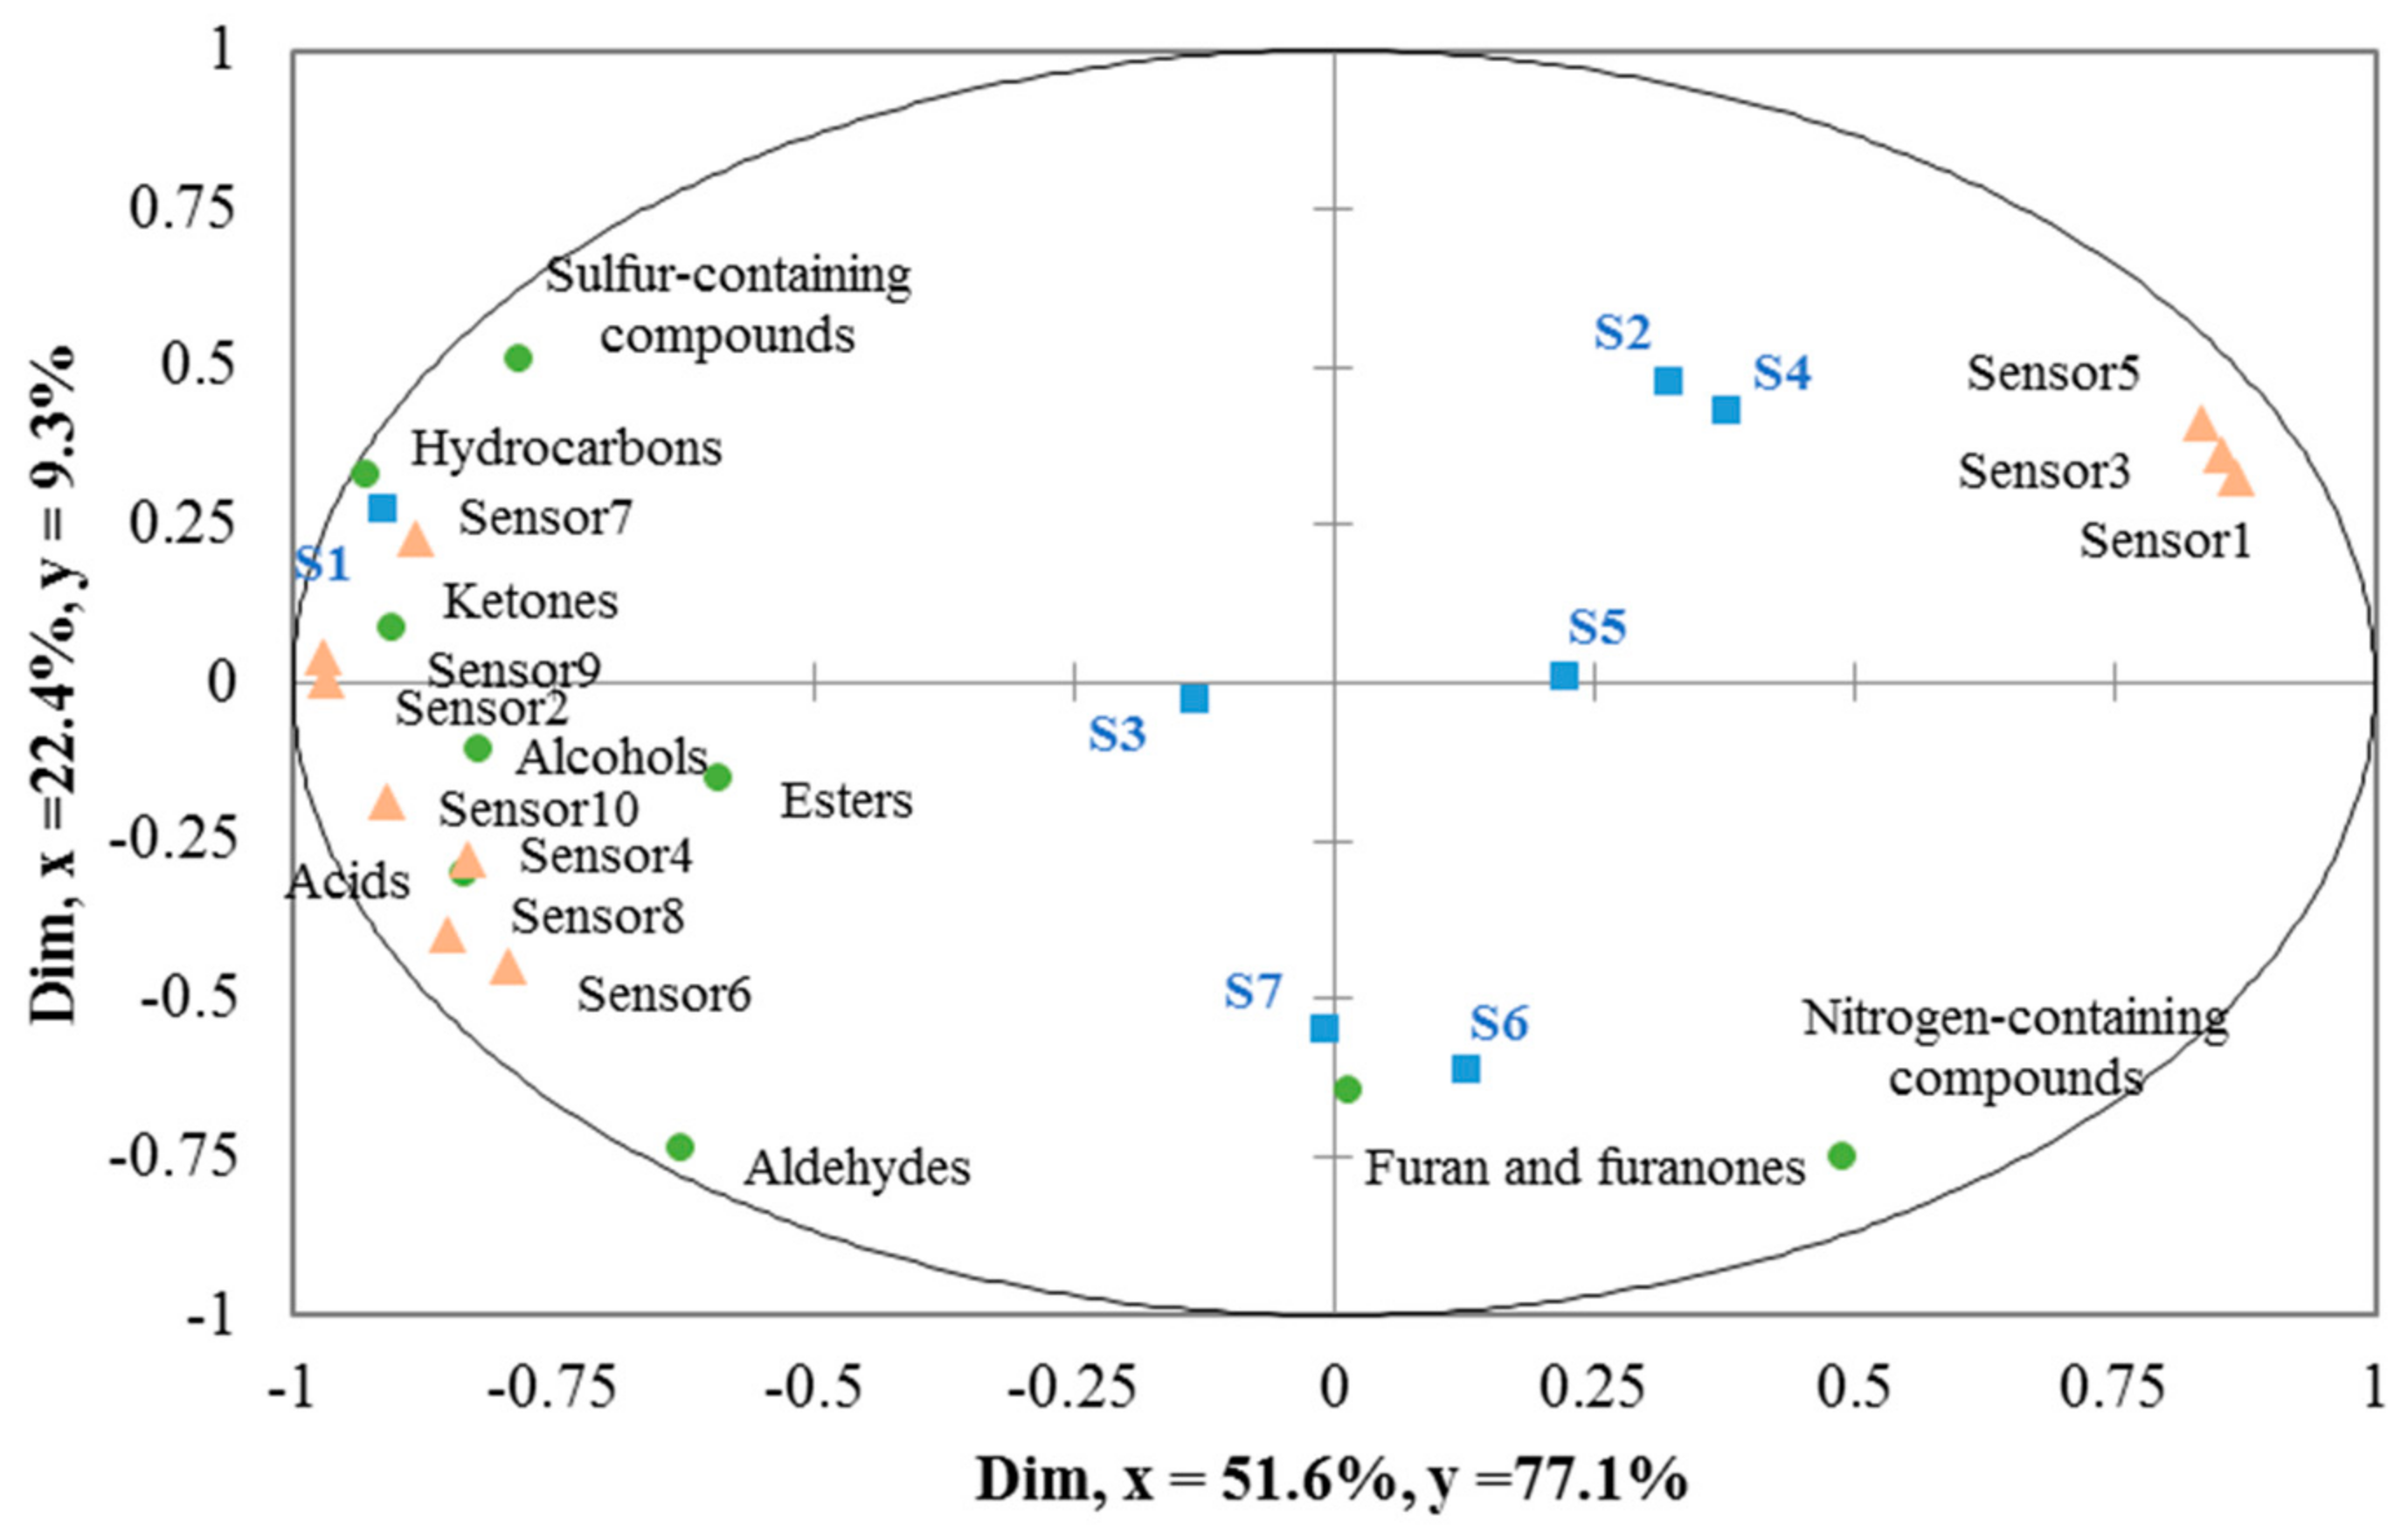
3.3. Electronic Nose Analysis of the Fried Oils
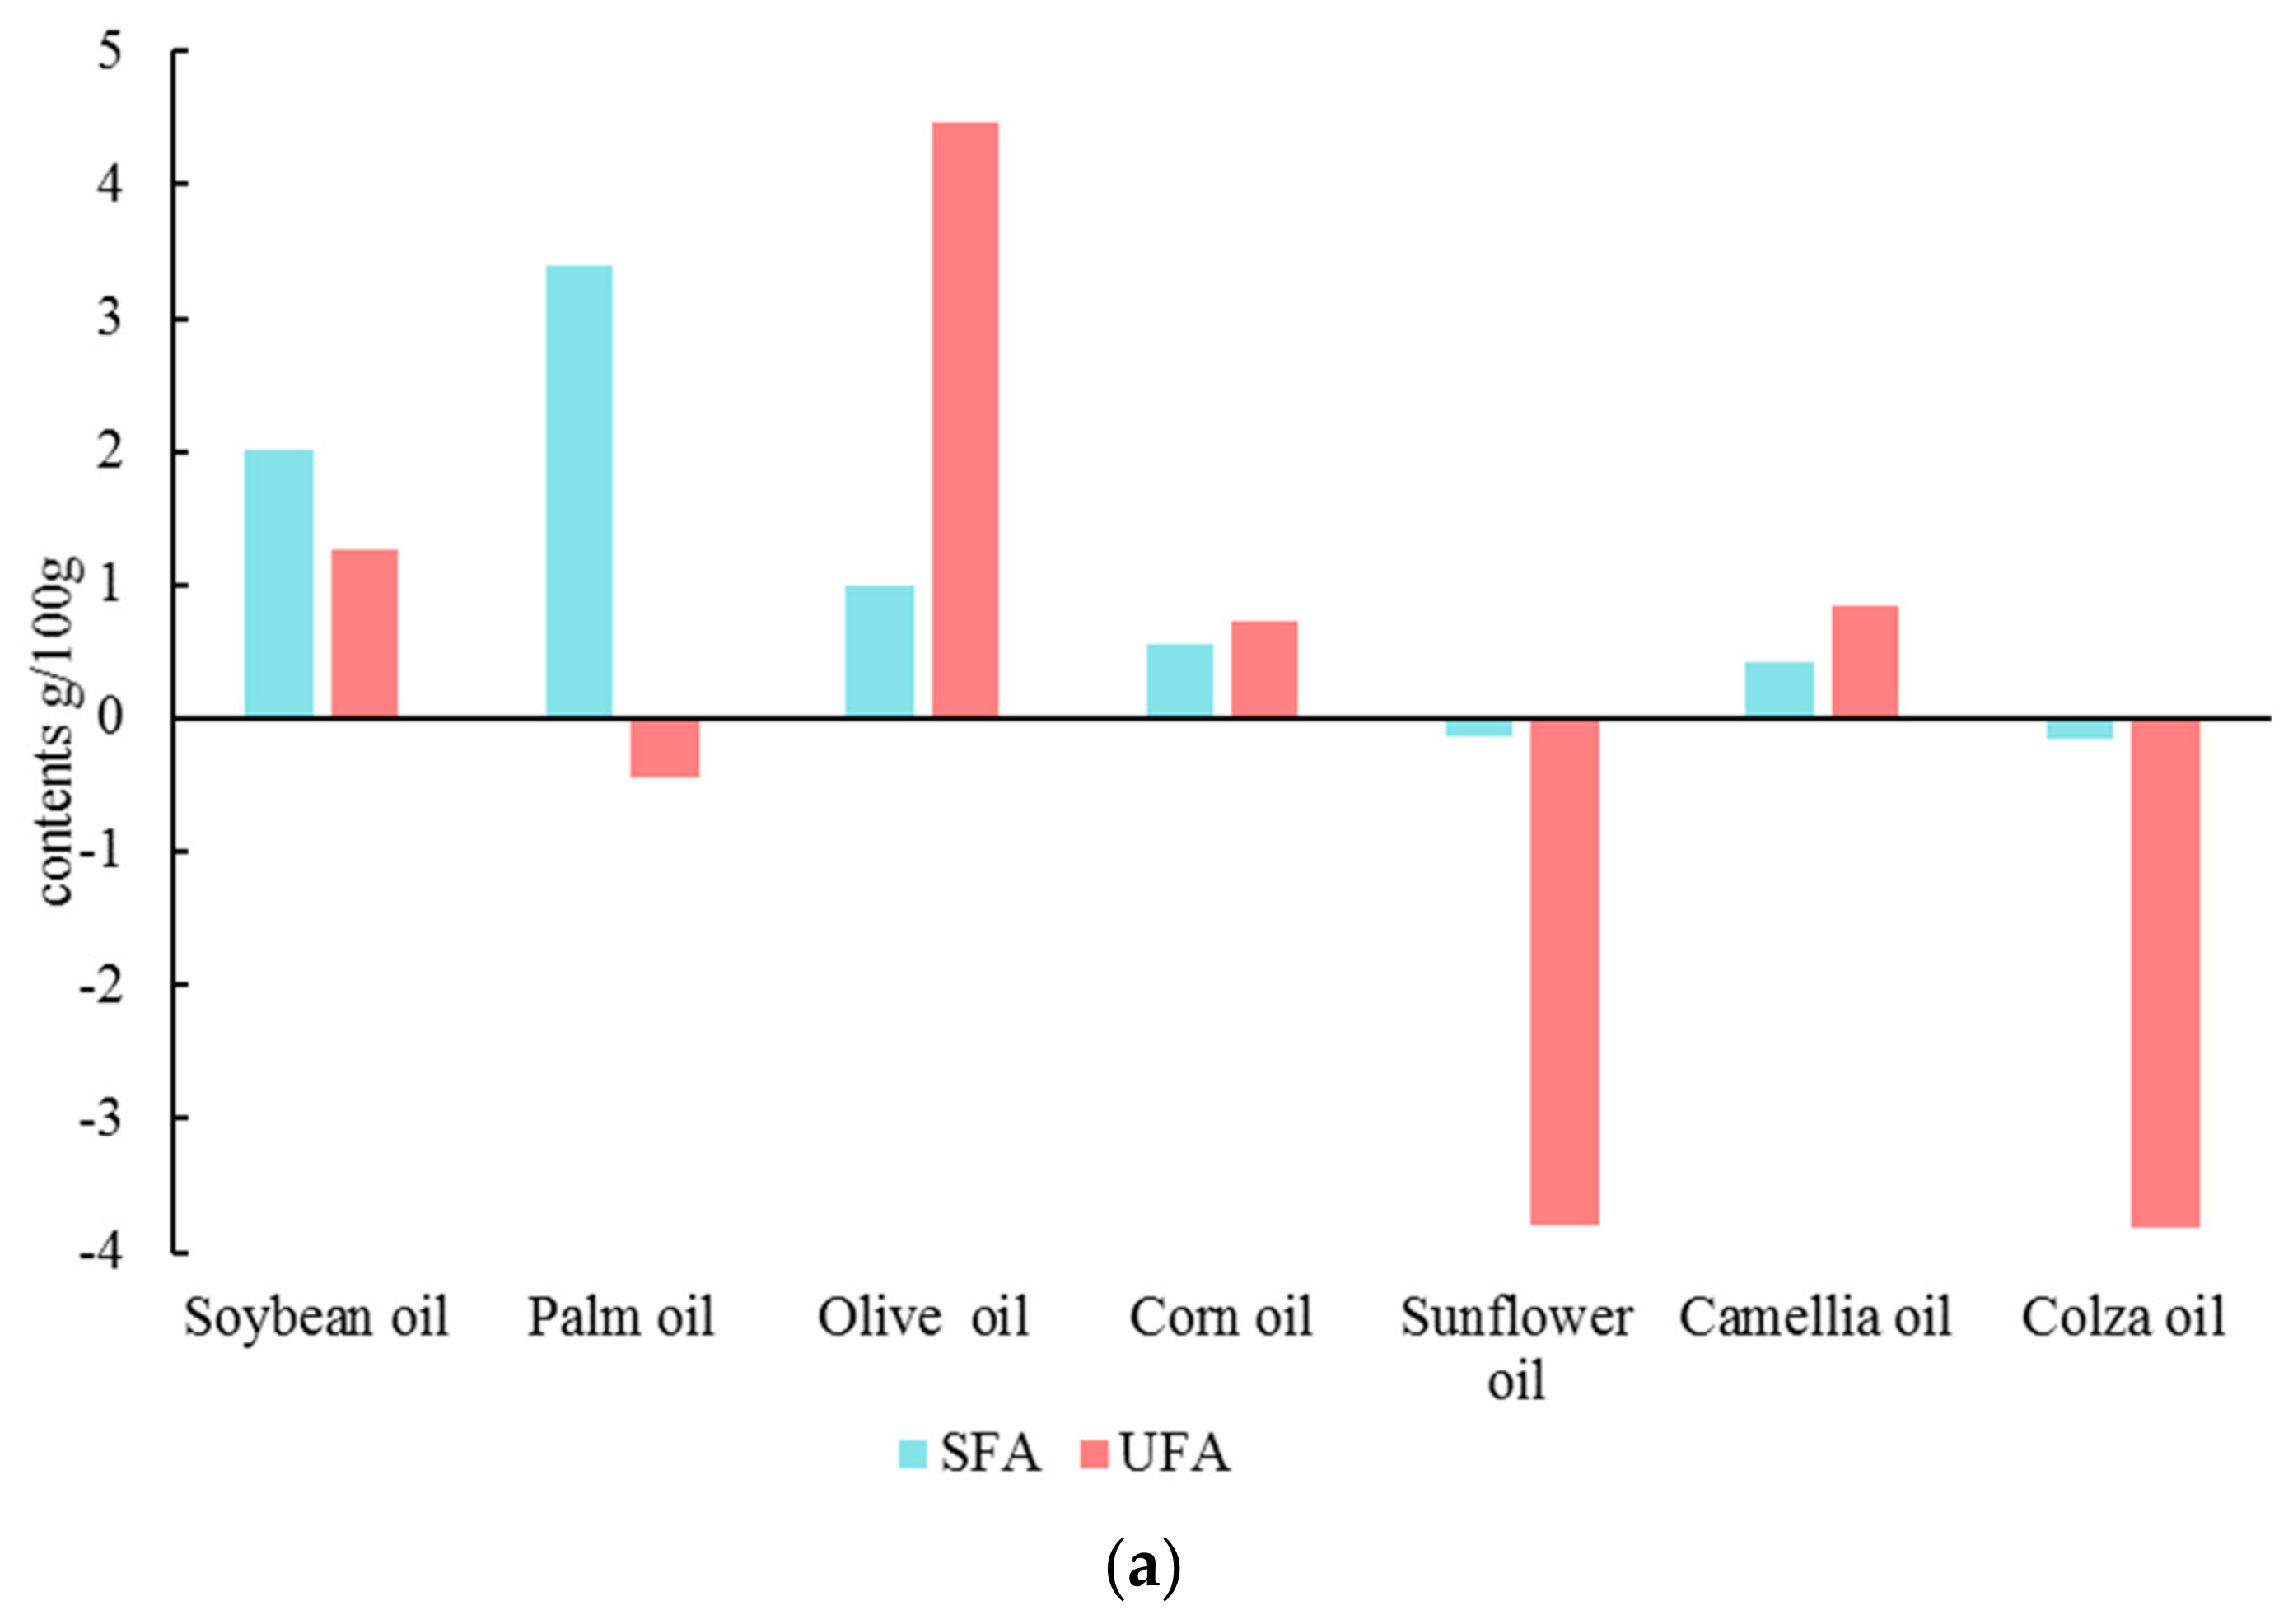
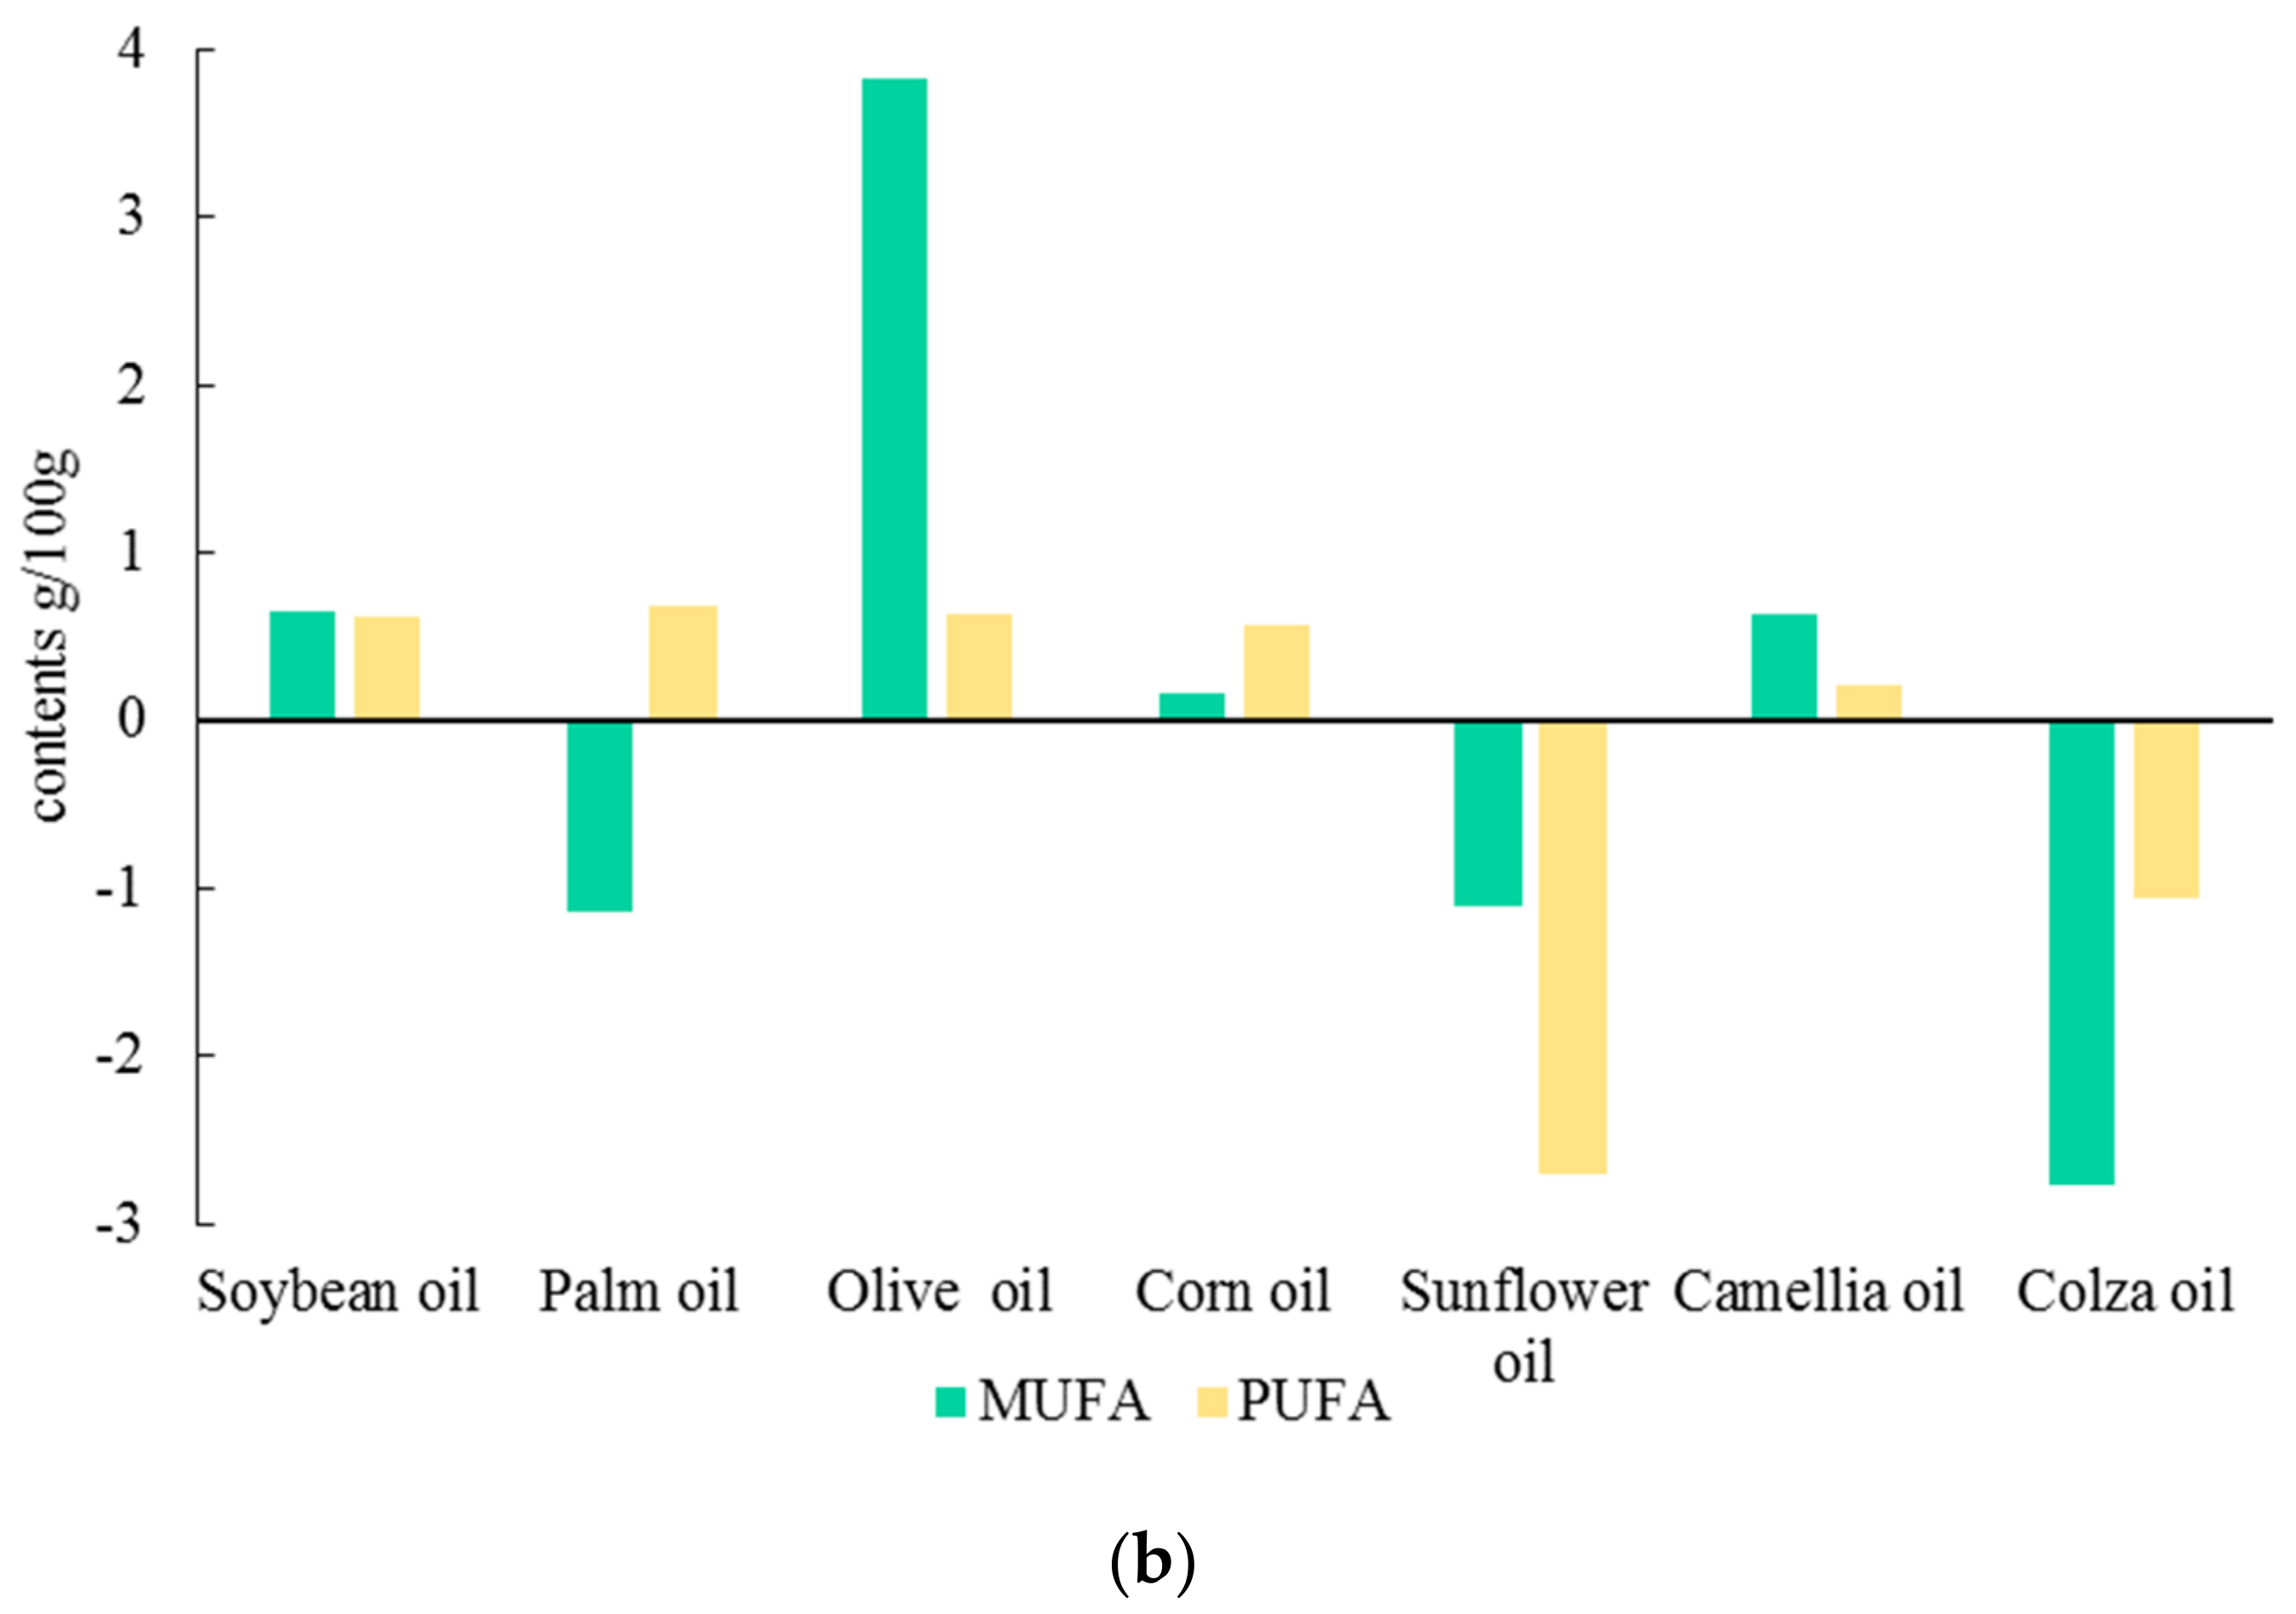
3.4. Fatty Acid Compositions of Fried Oils
4. Conclusions
Author Contributions
Funding
Data Availability Statement
Acknowledgments
Conflicts of Interest
References
- Zhang, N.; Sun, B.; Mao, X.; Chen, H.; Zhang, Y. Flavor formation in frying process of green onion (Allium fistulosum L.) deep-fried oil. Food Res. Int. 2019, 121, 296–306. [Google Scholar] [CrossRef] [PubMed]
- Wu, J.L.; Chou, C.C.; Chen, M.H.; Wu, C.M. Volatile flavor compounds from shallots. J. Food Sci. 1982, 47, 606–608. [Google Scholar] [CrossRef]
- Gao, S.; Liu, X.; Liu, Y.; Cao, B.; Chen, Z.; Xu, K. Response characteristics of green onion (Allium fistulosum L.) to LED light quality under artificial climate chamber. Sci. Agric. Sin. 2020, 53, 2919–2928. [Google Scholar] [CrossRef]
- Tian, P.; Zhan, P.; Tian, H.; Wang, P.; Lu, C.; Zhao, Y.; Ni, R.; Zhang, Y. Analysis of volatile compound changes in fried shallot (Allium cepa L. var. aggregatum) oil at different frying temperatures by GC-MS, OAV, and multivariate analysis. Food Chem. 2021, 345, 128748. [Google Scholar] [CrossRef]
- Saguy, I.S.; Dana, D. Integrated approach to deep fat frying: Engineering, nutrition, health and consumer aspects. J. Food Eng. 2003, 56, 143–152. [Google Scholar] [CrossRef]
- Qing, Z.; Chong, W.; Chenzhi, W.; Hong, C.; Yaowen, L.; Suqing, L.; Derong, L.; Dingtao, W.; Wen, Q. Evaluation of the non-aldehyde volatile compounds formed during deep-fat frying process. Food Chem. 2018, 243, 151–161. [Google Scholar] [CrossRef]
- Bansal, G.; Zhou, W.B.; Barlow, P.J.; Joshi, P.S.; Lo, H.L.; Chung, Y.K. Review of Rapid Tests Available for Measuring the Quality Changes in Frying Oils and Comparison with Standard Methods. Crit. Rev. Food Sci. Nutr. 2010, 50, 503–514. [Google Scholar] [CrossRef]
- Sahin, S.; Sumnu, S.G. Advances in Deep fat Frying of Foods; Middle East Tech. Univ.: Ankara, Turkey, 2008; p. 360. [Google Scholar]
- Zhang, Q.; Saleh, A.S.M.; Chen, J.; Shen, Q. Chemical alterations taken place during deep-fat frying based on certain reaction products: A review. Chem. Phys. Lipids 2012, 165, 662–681. [Google Scholar] [CrossRef]
- Hemmler, D.; Roullier-Gall, C.; Marshall, J.W.; Rychlik, M.; Taylor, A.J.; Schmitt-Kopplin, P. Insights into the Chemistry of Non-Enzymatic Browning Reactions in Different Ribose-Amino Acid Model Systems. Sci. Rep. 2018, 8, 16879. [Google Scholar] [CrossRef] [Green Version]
- Zhang, W.N.; Zhang, H.L.; Lu, C.Q.; Luo, J.P.; Zha, X.Q. A new kinetic model of ultrasound-assisted extraction of polysaccharides from Chinese chive. Food Chem. 2016, 212, 274–281. [Google Scholar] [CrossRef]
- Nieva-Echevarria, B.; Goicoechea, E.; Manzanos, M.J.; Guillen, M.D. The influence of frying technique, cooking oil and fish species on the changes occurring in fish lipids and oil during shallow-frying, studied by H-1 NMR. Food Res. Int. 2016, 84, 150–159. [Google Scholar] [CrossRef]
- Hammouda, I.B.; Freitas, F.; Ammar, S.; Silva, M.D.R.G.d.; Bouaziz, M. Comparison and characterization of volatile compounds as markers of oils stability during frying by HS-SPME-GC/MS and Chemometric analysis. J. Chromatogr. B 2017, 1068–1069, 322–334. [Google Scholar] [CrossRef] [PubMed]
- Peng, T.; Ping, Z.; Honglei, T.; Peng, W.; Cong, L.; Yu, Z. Effects of different vegetable oils on the aroma characteristics of deep-fried shallot flavoring evaluated by HS-SPME/GC-MS coupled with PLSR. J. Food Process. Preserv. 2020, 44, e14698. [Google Scholar] [CrossRef]
- Chu, Y.H.; Hsu, H.F. Comparative studies of different heat treatments on quality of fried shallots and their frying oils. Food Chem. 2001, 75, 37–42. [Google Scholar] [CrossRef]
- Tung-Hsi, Y.; Chung-May, W.; Chi-Tang, H. Volatile compounds of deep-oil fried, microwave-heated, and oven-baked garlic slices. J. Agric. Food Chem. 1993, 41, 800–805. [Google Scholar] [CrossRef]
- Sun Min, K.; Chung May, W.; Kobayashi, A.; Kubota, K.; Okumura, J. Volatile compounds in stir-fried garlic. J. Agric. Food Chem. 1995, 43, 2951–2955. [Google Scholar] [CrossRef]
- Kreissl, J.; Schieberle, P. Characterization of Aroma-Active Compounds in Italian Tomatoes with Emphasis on New Odorants. J. Agric. Food Chem. 2017, 65, 5198–5208. [Google Scholar] [CrossRef]
- Engel, W.; Bahr, W.; Schieberle, P. Solvent assisted flavour evaporation—A new and versatile technique for the careful and direct isolation of aroma compounds from complex food matrices. Eur. Food Res. Technol. 1999, 209, 237–241. [Google Scholar] [CrossRef]
- Kanjana, M.; Torsak, L.; Rouseff, R. Comparison of aroma character impact volatiles of Thummong leaves (Litsea petiolata Hook. f.), Mangdana water beetle (Lethocerus indicus), and a commercial product as flavoring agents in Thai traditional cooking. J. Agric. Food Chem. 2018, 66, 2480–2484. [Google Scholar] [CrossRef]
- Morrison, W.R.; Smith, L.M. Preparation of fatty acid methyl esters and dimethylacetals from lipids with boron fluoride-methanol. J. Lipid Res. 1964, 5, 600–608. [Google Scholar] [CrossRef] [PubMed]
- Yunzi, F.; Zhiyao, C.; Ning, L.; Haifeng, Z.; Chun, C.; Mouming, Z. Changes in fatty acid composition and lipid profile during koji fermentation and their relationships with soy sauce flavour. Food Chem. 2014, 158, 438–444. [Google Scholar]
- Lirong, X.; Xu, L.; Jianhua, H.; Pan, G.; Qingzhe, J.; Xingguo, W. Rapid measuring flavor quality changes of frying rapeseed oils using a flash gas chromatography electronic nose. Eur. J. Lipid Sci. Technol. 2019, 121, 1800260. [Google Scholar] [CrossRef]
- Shiota, M.; Iwasawa, A.; Suzuki-Iwashima, A.; Iida, F. Effects of Flavor and Texture on the Sensory Perception of Gouda-Type Cheese Varieties during Ripening Using Multivariate Analysis. J. Food Sci. 2015, 80, C2740–C2750. [Google Scholar] [CrossRef] [PubMed]
- Dandan, P.; Huiying, Z.; Yuyu, Z.; Baoguo, S.; Fazheng, R.; Haitao, C.; Junfei, X. Characterization of the oral breakdown, sensory properties, and volatile release during mastication of white bread. Food Chem. 2019, 298, 125003. [Google Scholar] [CrossRef]
- Mimura, N.; Isogai, A.; Iwashita, K.; Bamba, T.; Fukusaki, E. Gas chromatography/mass spectrometry based component profiling and quality prediction for Japanese sake. J. Biosci. Bioeng. 2014, 118, 406–414. [Google Scholar] [CrossRef] [PubMed]
- Dobarganes MC and Márquez-Ruiz, G. Formation and Analysis of Oxidized Monomeric, Dimeric, and Higher Oligomeric Triglycerides. In Deep Frying. Chemistry, Nutrition, and Practical Applications, 2nd ed.; AOCS Press: Cambridge, MA, USA, 2007. [Google Scholar]
- Perkins, E.G. Volatile Odor and Flavor Components Formed in Deep Frying. In Deep Frying: Chemistry, Nutrition, and Practical Applications, 2nd ed.; AOCS Press: Cambridge, MA, USA, 2007. [Google Scholar]
- Chen, S.; Bobe, G.; Zimmerman, S.; Hammond, E.G.; Luhman, C.M.; Boylston, T.D.; Freeman, A.E.; Beitz, D.C. Physical and sensory properties of dairy products from cows with various milk fatty acid compositions. J. Agric. Food Chem. 2004, 52, 3422–3428. [Google Scholar] [CrossRef] [PubMed]
- Protim Mahanta, B.; Kumar Bora, P.; Phirose, K.; Gitasree, B.; Mohan, L.; Saikat, H. Thermolabile essential oils, aromas and flavours: Degradation pathways, effect of thermal processing and alteration of sensory quality. Food Res. Int. 2021, 145, 110404. [Google Scholar] [CrossRef]


| No. | Compound | Concentration (μg/kg) 1 | RI 2 (Exp/Lit) | ||||||
|---|---|---|---|---|---|---|---|---|---|
| Soybean Oil | Palm Oil | Olive Oil | Corn Oil | Sunflower Oil | Camellia Oil | Colza Oil | |||
| A1 | Dimethyl disulfide | 241.99 ± 47.52 | 107.96 ± 4.65 | 139.04 ± 22.07 | 78.58 ± 2.34 | 66.73 ± 6.03 | 63.52 ± 7.86 | 51.52 ± 11.67 | 1080/1071 |
| A2 | Hexanal | 697.71 ± 96.14 | 97.87 ± 0.95 | 436.75 ± 80.36 | 115.33 ± 6.94 | 265.05 ± 24.58 | 173.89 ± 22.65 | 64.21 ± 10.27 | 1090/1097 |
| A3 | 2-Methyl-2-butenal | 31.43 ± 4.46 | 17.39 ± 2.93 | 32.01 ± 7.76 | 28.69 ± 2.87 | 21.76 ± 3.97 | 17.38 ± 2.16 | 14.01 ± 2.42 | 1102/1093 |
| A4 | 4-Pentenal | nd 3 | nd | nd | nd | nd | nd | 8.83 ± 1.24 | 1114/1123 |
| A5 | 3-Methyl-thiophene | 10.16 ± 2.08 | 4.01 ± 0.21 | 7.19 ± 1.44 | 4.21 ± 0.09 | 21.76 ± 3.97 | 3.51 ± 0.49 | 5.72 ± 1.83 | 1125/1123 |
| A6 | (E)-2-Pentenal | 60.89 ± 8.61 | 6.32 ± 0.47 | 27.22 ± 8.99 | 5.68 ± 0.14 | 3.83 ± 0.47 | 8.22 ± 1.33 | 34.61 ± 4.38 | 1134/1128 |
| A7 | Pentyl-oxirane | 12.64 ± 1.31 | nd | nd | nd | nd | nd | nd | 1146/1153 |
| A8 | 1-Penten-3-ol | 95.75 ± 17.48 | 11.6 ± 1.19 | 64.64 ± 2.33 | 9.96 ± 0.18 | 8.49 ± 0.92 | 15.3 ± 1.14 | 35.71 ± 7.46 | 1162/1176 |
| A9 | β-Myrcene | 9.31 ± 0.9 | nd | nd | nd | nd | nd | nd | 1167/1169 |
| A10 | 3-Penten-2-ol | 803.38 ± 149.17 | 576.45 ± 41.85 | 923.16 ± 169.27 | 708.55 ± 49.59 | 687.3 ± 92.12 | 540.74 ± 48.68 | 583.58 ± 165.59 | 1174/1178 |
| A11 | 2-Heptanone | 44.59 ± 3.89 | nd | nd | nd | nd | nd | nd | 1186/1187 |
| A12 | Heptanal | 48.89 ± 4.23 | 18.28 ± 0.32 | 65.82 ± 7.38 | 12.59 ± 0.92 | 22.63 ± 1.33 | 54.94 ± 3.97 | 21.59 ± 1.62 | 1189/1188 |
| A13 | 2,4-Dimethyl-thiophene | 18.63 ± 3.28 | 10.6 ± 0.68 | 18.71 ± 3.29 | 12.44 ± 0.57 | 14.78 ± 2.86 | 9.75 ± 0.88 | 8.83 ± 1.81 | 1194/1197 |
| A14 | Limonene | 69.36 ± 5.8 | 14.7 ± 0.19 | 23.37 ± 3.26 | 7.7 ± 0.51 | 6.91 ± 0.21 | 9.01 ± 0.56 | 5.34 ± 0.29 | 1199/1209 |
| A15 | 3-Methyl-2-butenal | 62.24 ± 11.58 | 50.03 ± 17.49 | 67.03 ± 11.17 | 42.62 ± 3.91 | 36.78 ± 2.9 | 38.95 ± 8.42 | 35.78 ± 4.6 | 1205/1202 |
| A16 | 2,3-Dimethyl-2-butanol | 45.49 ± 9.29 | 38.41 ± 5.6 | 66.95 ± 15.6 | 36.48 ± 3.53 | 37.36 ± 5.89 | 35.06 ± 8.07 | 40.62 ± 6.82 | 1214/— |
| A17 | 3-Hexen-2-one | 7.32 ± 1.49 | nd | nd | nd | nd | nd | 6.4 ± 1.02 | 1218/1209 |
| A18 | (E)-2-Hexenal | 94.49 ± 12.99 | 18.49 ± 0.65 | 48.75 ± 9.92 | 29.48 ± 0.36 | 41.3 ± 4.21 | 30.18 ± 3.25 | 24.42 ± 3.4 | 1222/1218 |
| A19 | 4-Octanone | nd | nd | nd | nd | nd | 2.75 ± 0.28 | nd | 1228/1224 |
| A20 | Methyl propyl disulfide | 49.86 ± 7.97 | 44.88 ± 4.04 | 52.24 ± 6.38 | 28.29 ± 1.05 | 33.96 ± 4.74 | 33.13 ± 5.72 | 25.65 ± 4.04 | 1232/1242 |
| A21 | 2-Pentyl-furan | 108.33 ± 6.03 | 25.31 ± 1.22 | 82.88 ± 10.17 | 33.87 ± 1.25 | 65.28 ± 6.65 | 40.22 ± 4.8 | 15.59 ± 1.89 | 1234/1233 |
| A22 | 3-Hydroxy-3-methyl-2-butanone | 29.58 ± 3.17 | 19.49 ± 1.7 | 34.49 ± 7.09 | 19.68 ± 0.55 | 22.52 ± 2.16 | 18.93 ± 1.79 | 20.09 ± 3.71 | 1244/1247 |
| A23 | 1-Pentanol | 57.44 ± 5.01 | 21.36 ± 1.43 | 36.74 ± 2.73 | 12.96 ± 0.86 | 32.48 ± 2.35 | 62.54 ± 3.59 | 13.13 ± 0.84 | 1252/1252 |
| A24 | 3,4-Dimethyl-thiophene | 246.79 ± 28.99 | 153.56 ± 10.09 | 241.91 ± 29.62 | 172.47 ± 10.74 | 187.96 ± 13.1 | 155.25 ± 11.82 | 146.26 ± 19.08 | 1254/1250 |
| A25 | (E)-1-Methyl-2-(prop-1-en-1-yl)disulfane | 247.81 ± 31.82 | 145.04 ± 6.56 | 206.8 ± 31.53 | 129.3 ± 2.77 | 119.86 ± 9.58 | 94.65 ± 11.9 | 98.61 ± 15.08 | 1264/— |
| A26 | Methyl 1-propenyl disulfide | 983.84 ± 131.68 | 687.34 ± 21.95 | 899.81 ± 118.97 | 650.15 ± 21.91 | 661.94 ± 54.55 | 514.91 ± 46.92 | 525.01 ± 50.43 | 1290/1274 |
| A27 | Octanal | 37.25 ± 1.49 | 18.31 ± 5.41 | 68.17 ± 2.66 | 9.09 ± 3.51 | 8.31 ± 2.86 | 79.72 ± 1.63 | 21.33 ± 1.1 | 1292/1291 |
| A28 | 2-Heptanol | 60.79 ± 6.61 | 62.03 ± 6.14 | 77.07 ± 13.76 | 52.23 ± 2.48 | 61.4 ± 2.73 | 47.86 ± 2.43 | 48.44 ± 8.15 | 1311/1286 |
| A29 | Prenol | 23.94 ± 2.7 | 19.14 ± 0.88 | 32.7 ± 5.37 | 21.42 ± 0.32 | 20.99 ± 2.34 | 20.15 ± 3.61 | 22.88 ± 2.46 | 1324/1328 |
| A30 | (E)-2-Heptenal | 1275.27 ± 112.83 | 148.22 ± 10.43 | 388.62 ± 31.43 | 295.99 ± 8.47 | 570.6 ± 23.15 | 360.89 ± 18.07 | 210.45 ± 13.95 | 1326/1317 |
| A31 | 2,3-Octanedione | 209.26 ± 6 | nd | nd | nd | nd | 17.46 ± 1.87 | nd | 1330/1336 |
| A32 | 1,4-Pentadien-3-ol | 15.1 ± 0.88 | 20.03 ± 0.74 | 25.12 ± 1.99 | 17.55 ± 1.45 | 17.23 ± 1.98 | 19.18 ± 1.85 | 21.31 ± 3.85 | 1340/— |
| A33 | 2-Cyclopenten-1-one | 29.88 ± 2.53 | 19 ± 2.05 | 32.08 ± 1.67 | 21.9 ± 1.6 | 23.72 ± 0.97 | 23.2 ± 1.04 | 25.74 ± 3.54 | 1355/1349 |
| A34 | Dimethyl trisulfide | 983.34 ± 86.74 | 790.9 ± 7.05 | 855.51 ± 93.78 | 640.16 ± 15.39 | 628.49 ± 31.57 | 569.62 ± 37.54 | 511.38 ± 33.31 | 1377/1369 |
| A35 | Nonanal | 159.07 ± 13.95 | 294.15 ± 27.81 | 634.53 ± 25.84 | 101.19 ± 10.28 | 124.88 ± 3.31 | 833 ± 36.99 | 373.73 ± 79.14 | 1395/1379 |
| A36 | Isoxazole | 58.39 ± 6.19 | 28.21 ± 2.97 | 39.73 ± 4.15 | 27.95 ± 2.48 | 29.72 ± 1.55 | 13.89 ± 1.94 | 35.72 ± 4.96 | 1401/— |
| A37 | Propyl sulfide | 174.8 ± 24.33 | 185.82 ± 2.09 | 252.26 ± 30.53 | 156.88 ± 7.22 | 121.84 ± 12.52 | 48.58 ± 15.3 | 124.59 ± 7.25 | 1408/1069 |
| A38 | (E)-2-Octenal | 205.92 ± 6.35 | 66.32 ± 2.37 | 179.61 ± 5.98 | 66.63 ± 5.32 | 110.59 ± 3.39 | 192.08 ± 9.49 | 77.49 ± 11.81 | 1430/1426 |
| A39 | 1-Allyl-2-isopropyldisulfane | 75.01 ± 0.67 | 65.68 ± 1.54 | 76.56 ± 8.64 | 51.45 ± 3.21 | 58.96 ± 2.23 | 71.14 ± 1.98 | 46.6 ± 2.77 | 1435/— |
| A40 | 1-Octen-3-ol | 238.57 ± 1.02 | 43.34 ± 1.57 | 80.36 ± 0.95 | 84.81 ± 6.38 | 166.37 ± 4.79 | 103.28 ± 6.47 | 85.24 ± 14.31 | 1454/1476 |
| A41 | Methional | 25.65 ± 6.12 | nd | 40.43 ± 12.6 | 11.82 ± 3.97 | 13.82 ± 2.43 | nd | nd | 1457/1474 |
| A42 | 1-Heptanol | nd | nd | nd | nd | nd | 38.75 ± 7.5 | nd | 1457/1467 |
| A43 | Acetic acid | 101.22 ± 16.23 | 70.35 ± 7.87 | nd | 50.46 ± 24.39 | 41.52 ± 19.6 | 88.57 ± 12.01 | 73.22 ± 47.03 | 1464/1484 |
| A44 | Furfural | 1897.96 ± 249.09 | 1103.1 ± 28.87 | 1685.38 ± 314.83 | 1029.43 ± 42.3 | 1197.84 ± 112.87 | 1099.88 ± 74.34 | 1528.11 ± 164.48 | 1468/1471 |
| A45 | 2-Ethyl-1-hexanol | 13.83 ± 0.19 | 14.5 ± 4.67 | 14.64 ± 2.44 | 12.24 ± 0.47 | 15.09 ± 0.65 | 13.89 ± 2.22 | 16.69 ± 1.43 | 1492/1494 |
| A46 | (E,E)-2,4-Heptadienal | 578.21 ± 10.94 | 54.57 ± 1.28 | 191.56 ± 4.32 | 46.94 ± 4.1 | 8.83 ± 0.33 | 151.51 ± 7.45 | 1044.81 ± 167.79 | 1495/1490 |
| A47 | 1-(Ethylthio)-2-methyl-1-propene | 31.43 ± 4.05 | 36.1 ± 0.97 | 34.12 ± 7.31 | 35.13 ± 2.26 | 24.26 ± 2.86 | 12.37 ± 6.85 | 22.05 ± 1.37 | 1498/— |
| A48 | 1-(2-Furanyl)-ethanone | 203.08 ± 17.33 | 196.44 ± 2.58 | 245.85 ± 22.63 | 147.46 ± 8.5 | 183.15 ± 6.2 | 203.22 ± 8.83 | 179.65 ± 3.74 | 1506/1512 |
| A49 | 3-Nonen-2-one | 32.16 ± 4.99 | 26.27 ± 3.16 | 30.12 ± 4.86 | 17.33 ± 3.59 | 28.88 ± 3.02 | 45.56 ± 4.15 | 25.07 ± 8.77 | 1512/1508 |
| A50 | 3-Methoxy-1-butanol | 39.71 ± 1.55 | 38.98 ± 0.99 | 35.98 ± 13.39 | 39.78 ± 1.91 | 36.63 ± 6.25 | 42.34 ± 4.98 | 71.46 ± 14.85 | 1518/— |
| A51 | 3,5-Octadien-2-one | nd | nd | nd | nd | nd | nd | 9.66 ± 2.51 | 1524/1531 |
| A52 | Methyl propyl trisulfide | 77.71 ± 4.3 | 92.75 ± 3.08 | 94.03 ± 5.56 | 68.61 ± 5.64 | 13.08 ± 1.98 | 71.21 ± 5.92 | 90.66 ± 5.14 | 1523/1529 |
| A53 | (E)-2-Nonenal | 19.56 ± 2.16 | 15.18 ± 0.42 | 39.35 ± 5.84 | 12.94 ± 1.47 | 22.81 ± 3.11 | 127.67 ± 10.97 | 51.48 ± 17.62 | 1536/1535 |
| A54 | 4-Ethylcyclohexanol | 74.89 ± 17.22 | nd | nd | 35.27 ± 6.09 | 75.22 ± 10.22 | 42.24 ± 3.73 | 39.15 ± 6.54 | 1539/— |
| A55 | 2,4-Dimethyl-cyclohexanol | 82.07 ± 3.02 | 10.76 ± 0.68 | 47.42 ± 4.5 | 25.98 ± 2.39 | 48.35 ± 3.7 | 26.63 ± 4.23 | 23.2 ± 0.33 | 1542/— |
| A56 | Linalool | 18.63 ± 2.61 | nd | nd | nd | nd | nd | nd | 1551/1554 |
| A57 | 2-Pyridinecarboxaldehyde | nd | 11.88 ± 3.59 | 16.3 ± 3.63 | 6.68 ± 2.94 | nd | nd | 6.13 ± 1.13 | 1551/1470 |
| A58 | Linalyl acetate | 51.95 ± 13.89 | nd | nd | nd | nd | nd | nd | 1559/1556 |
| A59 | 1-Octanol | nd | nd | 63.64 ± 4.5 | nd | nd | 79.52 ± 8.74 | 36.34 ± 11.58 | 1559/1540 |
| A60 | Dimethyl sulfoxide | 79.37 ± 2.23 | 61.53 ± 0.94 | 63.77 ± 19.7 | 62.15 ± 10.12 | 56.56 ± 3.97 | 68.65 ± 4.8 | 125.8 ± 40.41 | 1569/1620 |
| A61 | 5-Methyl-2-furancarboxaldehyde | 433.16 ± 16.5 | 601.08 ± 17.05 | 587.71 ± 41.34 | 370.12 ± 29.01 | 473.5 ± 5.92 | 644.35 ± 22.33 | 477.68 ± 48.77 | 1576/1610 |
| A62 | 4-Cyclopentene-1,3-dione | 73.67 ± 0.83 | 70.67 ± 14.38 | 63.34 ± 16.59 | 56.02 ± 3.61 | 62.54 ± 3.91 | 56.2 ± 13.29 | nd | 1587/1573 |
| A63 | (E)-1-Methyl-3-(prop-1-en-1-yl)trisulfane | 621.9 ± 72.03 | 634.74 ± 40.89 | 462.56 ± 46.64 | 529.91 ± 74.19 | 532.18 ± 25.16 | 497.15 ± 28.12 | 723.03 ± 114.38 | 1596/1588.7 |
| A64 | Butyrolactone | 15.58 ± 2.23 | 30.38 ± 1.78 | 28.42 ± 2.15 | 21.24 ± 3.08 | 25.15 ± 1.61 | 18.58 ± 0.36 | nd | 1628/1626 |
| A65 | Benzeneacetaldehyde | 642.02 ± 34.9 | 892.03 ± 56.84 | 920.11 ± 45.81 | 948.68 ± 62.97 | 624.12 ± 15.97 | 1030.56 ± 79.47 | 1199.87 ± 235.09 | 1643/1638 |
| A66 | 2-Furanmethanol | 415.36 ± 40.24 | 376.09 ± 15.64 | 423.39 ± 51.9 | 311.61 ± 17.46 | 370.04 ± 26.66 | 416.17 ± 31.23 | 313.78 ± 14.87 | 1665/1649 |
| A67 | 3-Methyl-1H-pyrazole | nd | nd | nd | nd | nd | 17.73 ± 2.12 | nd | 1683/1690.3 |
| A68 | 5-Ethyldihydro-2(3H)-furanone | 71.39 ± 16.12 | nd | nd | nd | nd | nd | 144.94 ± 35.41 | 1697/1687 |
| A69 | (E,E)-2,4-Nonadienal | 14.83 ± 3.23 | 5.48 ± 0.36 | 23.6 ± 2.6 | 10.94 ± 3.25 | 17.28 ± 0.92 | 39.01 ± 6.49 | 10.4 ± 3.53 | 1704/1703 |
| A70 | 5-Methyl-2-furanmethanol | 121.24 ± 20.22 | 95.5 ± 9.32 | 123.03 ± 44.15 | 91.08 ± 8.19 | 110.71 ± 22.4 | 74.5 ± 14.35 | 42.79 ± 4.94 | 1725/1722 |
| A71 | 2-Undecenal | 57.82 ± 3.37 | 79.14 ± 1.81 | 131.86 ± 8.07 | 53.12 ± 10.62 | 53.82 ± 3.83 | 277.22 ± 37.15 | 145.22 ± 47.28 | 1752/1736 |
| A72 | 2,4-Decadienal | 414.19 ± 50.89 | 320.12 ± 16.75 | 324.24 ± 40.1 | 203.17 ± 24.76 | 567.46 ± 25.52 | 770 ± 94.11 | 440.71 ± 157.85 | 1766/1767 |
| A73 | 2-Hydroxy-2-cyclopenten-1-one | 46.56 ± 2.16 | 55.86 ± 5.63 | 51.15 ± 3.22 | 47.9 ± 4.3 | 37.54 ± 0.2 | 58.74 ± 2.22 | 56.52 ± 11.02 | 1772/1769 |
| A74 | 1-(2-Butoxyethoxy)-ethanol | 108.94 ± 15.84 | 95.49 ± 28.26 | 192.47 ± 62.22 | 95.28 ± 9.24 | 73.22 ± 9.9 | 76.97 ± 14.56 | 299.47 ± 194.71 | 1791/1800 |
| A75 | 1,3-Butadiene-1-carboxylic acid | nd | nd | nd | nd | 35.44 ± 1.46 | nd | 52.49 ± 14.58 | 1805/1879.0 |
| A76 | (E,E)-2,4-Decadienal | 750.94 ± 79.66 | 589.93 ± 34.1 | 600.26 ± 73.53 | 433.43 ± 46.73 | 1002.09 ± 25.2 | 1414.77 ± 148.71 | 897.69 ± 313.2 | 1810/1807 |
| A77 | 3-Methyl-1,2-cyclopentanedione | 18.03 ± 0.91 | 29 ± 2.4 | 21.01 ± 2.96 | 20.2 ± 1.24 | 17.98 ± 0.6 | 29.73 ± 3.19 | 34.07 ± 13.21 | 1829/1800.1 |
| A78 | 2-(Ethylthio)-ethanol | 89.1 ± 2.83 | 79.25 ± 3.51 | 83.02 ± 5.22 | 70.57 ± 10.08 | 63.59 ± 0.74 | 65.88 ± 5.07 | 89.02 ± 20.11 | 1834/— |
| A79 | 5,6-Dihydro-2H-pyran-2-one | 12.78 ± 2.77 | 14.71 ± 1.22 | 19.83 ± 4.88 | 11.44 ± 2.92 | 11.78 ± 3 | 25.38 ± 6.9 | 29.35 ± 8.18 | 1852/1838 |
| A80 | 3-(2-Furanyl)-2-propenal | nd | nd | nd | nd | nd | 7.71 ± 2.44 | nd | 1858/1851 |
| A81 | Hexanoic acid | 293.68 ± 40.49 | 71.91 ± 11.63 | 143.26 ± 14.63 | 41.85 ± 9.57 | 33.22 ± 2.58 | 59.55 ± 2.49 | 33.06 ± 12.67 | 1861/1854 |
| A82 | Dihydro-5-pentyl-2(3H)-furanone | nd | nd | nd | nd | nd | 11 ± 1.23 | nd | 1912/2011 |
| A83 | 2-Propenamide | 15.44 ± 2.74 | 18.09 ± 1.47 | nd | 11.82 ± 0.12 | 10.55 ± 0.91 | 13.49 ± 0.56 | 23.93 ± 6.66 | 1940/1943 |
| A84 | 1-(1H-Pyrrol-2-yl)-ethanone | 274 ± 39.15 | 366.65 ± 11.97 | 338.54 ± 23.55 | 299.06 ± 43.52 | 409.82 ± 119.15 | 421.81 ± 59.14 | 439.08 ± 140.43 | 1970/1969 |
| A85 | S-Methyl methanethiosulphonate | 111.4 ± 36.92 | 89.18 ± 15.52 | 69.05 ± 13.06 | 52.5 ± 14.43 | 63 ± 6.01 | 88.45 ± 16.5 | 105.74 ± 27.57 | 1976/— |
| A86 | 2,5-Furandicarboxaldehyde | 33.42 ± 7.46 | 40.55 ± 3.95 | 42.24 ± 4.32 | 32.8 ± 7.22 | 32.68 ± 4.5 | 92.04 ± 16.56 | 68.63 ± 20.79 | 1982/1982.7 |
| A87 | Furyl hydroxymethyl ketone | 270.79 ± 36.17 | 408.53 ± 23 | 346.17 ± 35.71 | 289.25 ± 48.46 | 316.33 ± 19.01 | 542.79 ± 82.05 | 616.99 ± 213.62 | 2002/1989 |
| A88 | 1H-Pyrrole-2-carboxaldehyde | 16.16 ± 3.16 | 23.96 ± 2.1 | 20.87 ± 3.19 | 20.6 ± 4.18 | 21.47 ± 6.31 | 24.49 ± 3.54 | 29.49 ± 5.83 | 2023/2032 |
| A89 | Furaneol | 21.49 ± 5.95 | 21.23 ± 2.85 | 13.01 ± 4.27 | 24.92 ± 3.63 | 26.83 ± 4.07 | 23.7 ± 5.95 | 19.58 ± 5.57 | 2033/2031 |
| A90 | 5-Methyl-1H-pyrrole-2-carboxaldehyde | 28.01 ± 4.03 | 43.89 ± 3.56 | 37.79 ± 3.12 | 29.84 ± 2.42 | 36.15 ± 2.35 | 43.47 ± 15.52 | 52.37 ± 22.13 | 2104/2088.1 |
| A91 | Nonanoic acid | nd | nd | nd | nd | 36.44 ± 13.5 | 107.34 ± 23.89 | 36.19 ± 9.05 | 2174/2172 |
| A92 | 5-Acetoxymethyl-2-furaldehyde | 11.84 ± 5.34 | 15.48 ± 5.61 | 24.15 ± 8.84 | 13.6 ± 3.83 | 13.52 ± 2.54 | 30.41 ± 7.85 | 30.05 ± 9.29 | 2196/2194 |
| A93 | Pyranone | 1353.16 ± 353.41 | 1175.05 ± 144.23 | 830 ± 167.92 | 1334.23 ± 86.09 | 1006.09 ± 517.03 | 1066.88 ± 220.03 | 1110.83 ± 342.4 | 2264/2267 |
| A94 | 3,5-Dihydroxy-2-methyl-4H-pyran-4-one | 211.34 ± 87.82 | 310.31 ± 48.35 | 92.78 ± 88.34 | 1684.56 ± 258.29 | 751.88 ± 267.35 | 1461.29 ± 314.68 | 2468.79 ± 958.78 | 2305/2309 |
| A95 | (S)-( + )-2’,3’-Dideoxyribonolactone | 33.7 ± 7.05 | 50.23 ± 5.99 | 30.74 ± 14.35 | 43.73 ± 5.9 | 42.96 ± 5.2 | 74.15 ± 11.23 | 79.78 ± 31.09 | 2475/— |
| A96 | 5-Hydroxymethylfurfural | 2824.54 ± 118.56 | 2782.52 ± 170.58 | 2823.73 ± 236.2 | 3296.32 ± 420.13 | 2972.4 ± 185.56 | 3305.51 ± 293.79 | 6344.05 ± 2309.27 | 2502/2512 |
| A97 | 1,2-Benzenedicarboxylic acid, bis(2-methylpropyl) ester | 39.38 ± 22.62 | 22.29 ± 2.66 | 30.85 ± 8.08 | 26.32 ± 2.31 | 27.73 ± 3.57 | 19.35 ± 0.98 | 59.37 ± 25.28 | 2539/2526 |
| A98 | 3-Thiopheneethanol | 43.84 ± 9.17 | 44.94 ± 3.54 | 25.56 ± 9.65 | 55.29 ± 6.34 | 49.18 ± 4.31 | 42.76 ± 10.59 | 56.9 ± 15.79 | 2577/— |
| A99 | Dihydro-4-hydroxy-2(3H)-furanone | nd | 25.8 ± 5.27 | nd | 20.95 ± 0.93 | 17.11 ± 1.28 | 38.16 ± 1.76 | 43.21 ± 8.27 | 2596/— |
| A100 | Benzyl benzoate | 21.51 ± 3.88 | 20.29 ± 0.59 | 23.25 ± 6.42 | 25.03 ± 5.15 | 24.65 ± 7.1 | 16.98 ± 2.67 | 29.3 ± 10.2 | 2620/2624.7 |
| A101 | Dibutyl phthalate | 36.17 ± 8.49 | 33.72 ± 3.04 | 45.04 ± 7.54 | 40.68 ± 3.76 | 41.91 ± 10.97 | 32.92 ± 1.95 | 97.33 ± 51.62 | 2692/2680 |
| A102 | Ethyl N-(o-anisyl)formimidate | 72.77 ± 16.75 | 134.66 ± 19.75 | 119.68 ± 34.37 | 97.33 ± 13.96 | 92.36 ± 9.33 | 156.85 ± 24.81 | 146.48 ± 61.29 | 2754/— |
| A103 | n-Hexadecanoic acid | 56.63 ± 14.17 | 100.85 ± 35.67 | 81.9 ± 19.06 | 61.39 ± 12.02 | 103.79 ± 33.98 | 63.33 ± 6.64 | 137.04 ± 45.4 | >2900/2906 |
Disclaimer/Publisher’s Note: The statements, opinions and data contained in all publications are solely those of the individual author(s) and contributor(s) and not of MDPI and/or the editor(s). MDPI and/or the editor(s) disclaim responsibility for any injury to people or property resulting from any ideas, methods, instructions or products referred to in the content. |
© 2023 by the authors. Licensee MDPI, Basel, Switzerland. This article is an open access article distributed under the terms and conditions of the Creative Commons Attribution (CC BY) license (https://creativecommons.org/licenses/by/4.0/).
Share and Cite
Wang, R.; Qiao, L.; Wang, J.; Wang, J.; Zhang, N.; Chen, H.; Sun, J.; Wang, S.; Zhang, Y. Effect of Different Vegetable Oils on the Flavor of Fried Green Onion (Allium fistulosum L.) Oil. Foods 2023, 12, 1442. https://doi.org/10.3390/foods12071442
Wang R, Qiao L, Wang J, Wang J, Zhang N, Chen H, Sun J, Wang S, Zhang Y. Effect of Different Vegetable Oils on the Flavor of Fried Green Onion (Allium fistulosum L.) Oil. Foods. 2023; 12(7):1442. https://doi.org/10.3390/foods12071442
Chicago/Turabian StyleWang, Ruifang, Lina Qiao, Jing Wang, Junyi Wang, Ning Zhang, Haitao Chen, Jie Sun, Shuqi Wang, and Yu Zhang. 2023. "Effect of Different Vegetable Oils on the Flavor of Fried Green Onion (Allium fistulosum L.) Oil" Foods 12, no. 7: 1442. https://doi.org/10.3390/foods12071442