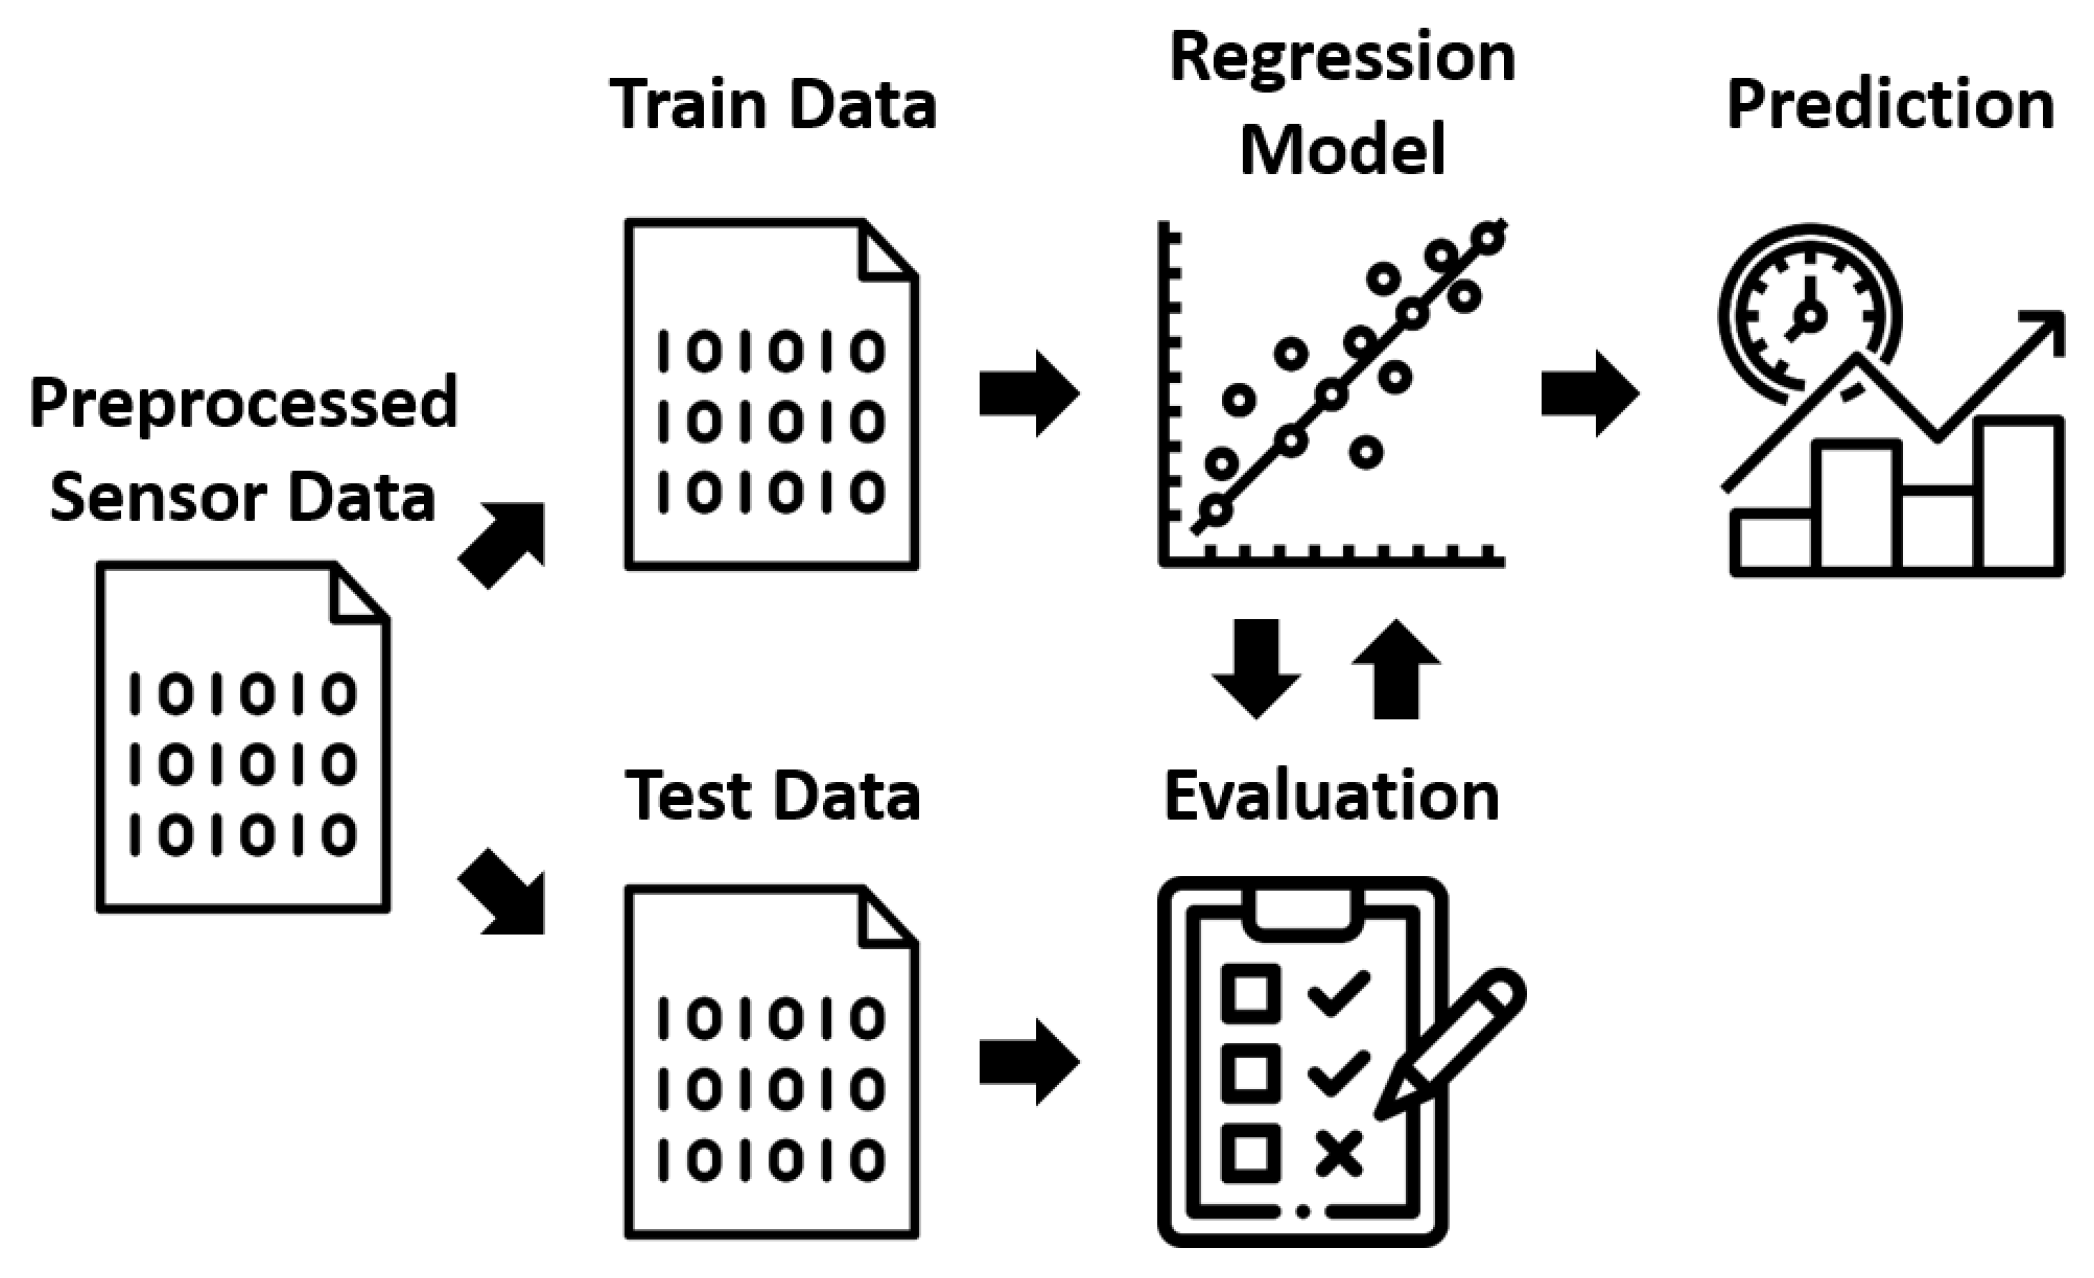
4.3. Evaluation
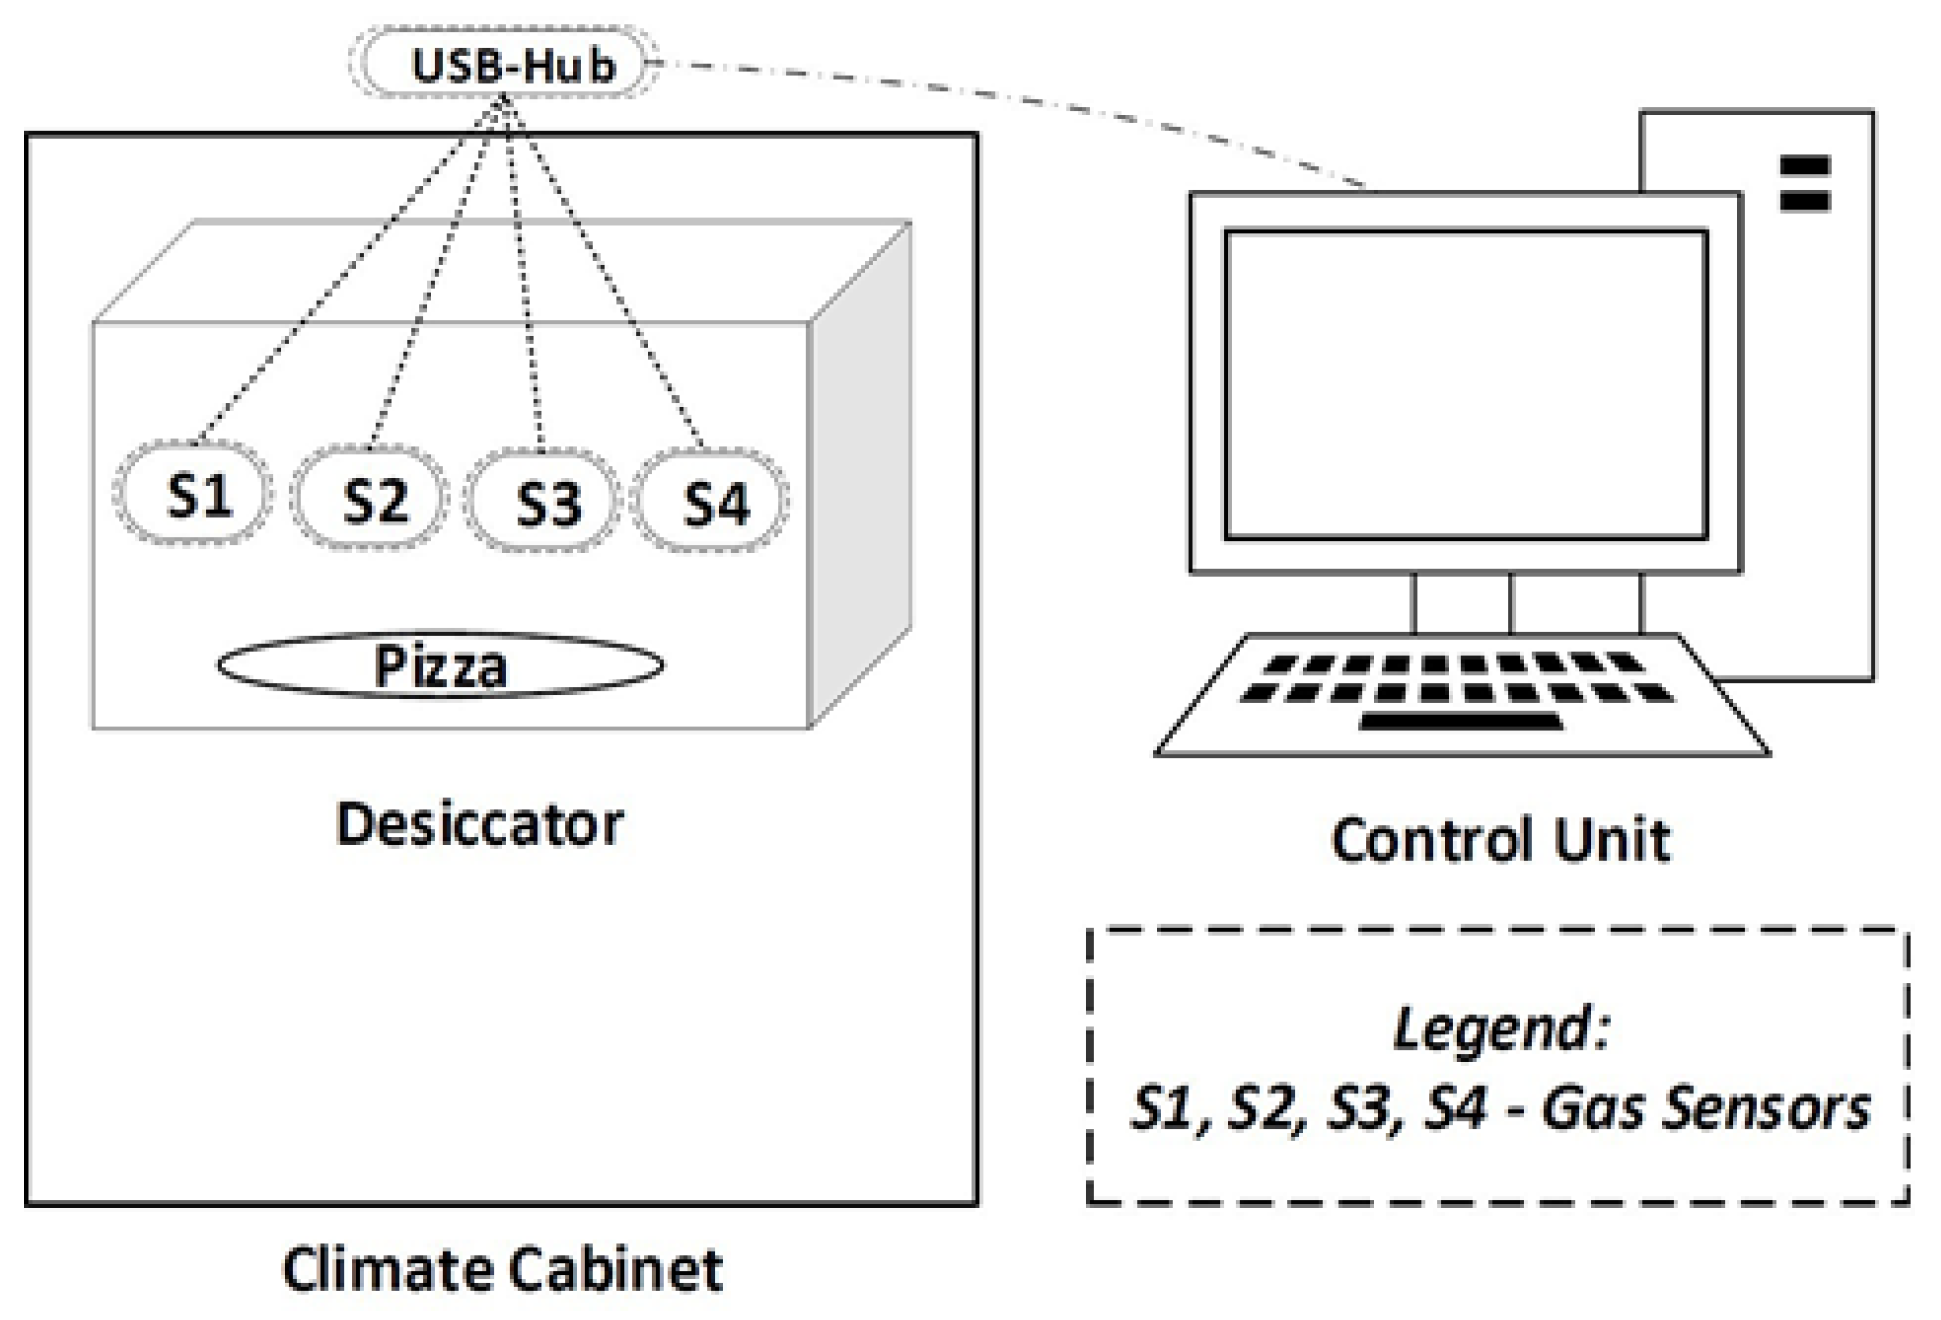
A Random Forest Regressor and an XGBoost Regressor were trained for each of the different sensors from
Section 3.2. The models will be evaluated in the following, and their performance will be determined using various metrics. Listed below are the metrics that were utilized:
R-Squared ()
Mean Squared Error (MSE)
Root Mean Squared Error (RMSE)
Mean Absolute Error (MAE)
Symmetric Mean Absolute Percentage Error (SMAPE)
[
44] is a statistical measure used to evaluate the goodness of fit of a regression. Its range of values goes from 0 to 1, where 1 represents a perfect model.
The Mean Squared Error (MSE) [
45] is a metric commonly used in regression analysis. It measures the expected squared distance between the predicted values of the regression model and the true values. The formula for MSE is given by:
where
n is the number of observations,
is the true value of the
i-th observation, and
is the predicted value of the
i-th observation. Although there is no absolute value to imply whether a model is good, MSE can be used to compare models to one another, as well as other metrics. The other metrics also hold true in this regard.
Root Mean Squared Error (RMSE) [
46] is calculated by taking the square root of the mean squared errors. RMSE is a popular evaluation metric in regression analysis and machine learning. It is similar to MSE but easier to interpret since the RMSE value has the same scale as the predicted values. The formula for RMSE is given by:
The Mean Absolute Error (MAE) [
46] measures the average magnitude of the errors in a prediction, indicating how far off the predicted values are from the true values. It does not indicate the direction of the deviation. The formula for calculating MAE is given by:
Here, n is the number of data points, is the true value for the i-th data point, and is the predicted value for the i-th data point. By taking the absolute value of the difference between the true and predicted values and averaging over all data points, MAE provides a measure of the average magnitude of the errors in the predictions.
The Symmetric Mean Absolute Percentage Error (SMAPE) [
47] is a measure of accuracy based on percentage errors, which can be calculated using the following equation:
SMAPE is very similar to the Mean Absolute Percentage Error (MAPE) [
48], but SMAPE is preferred in situations where estimates close to zero are important, as MAPE does not provide any information on such estimates. However, one disadvantage of SMAPE is its interpretability. While MAPE has a range of values from 0 to 100%, SMAPE has a range of values from 0 to 200%, with 0% being the best value.
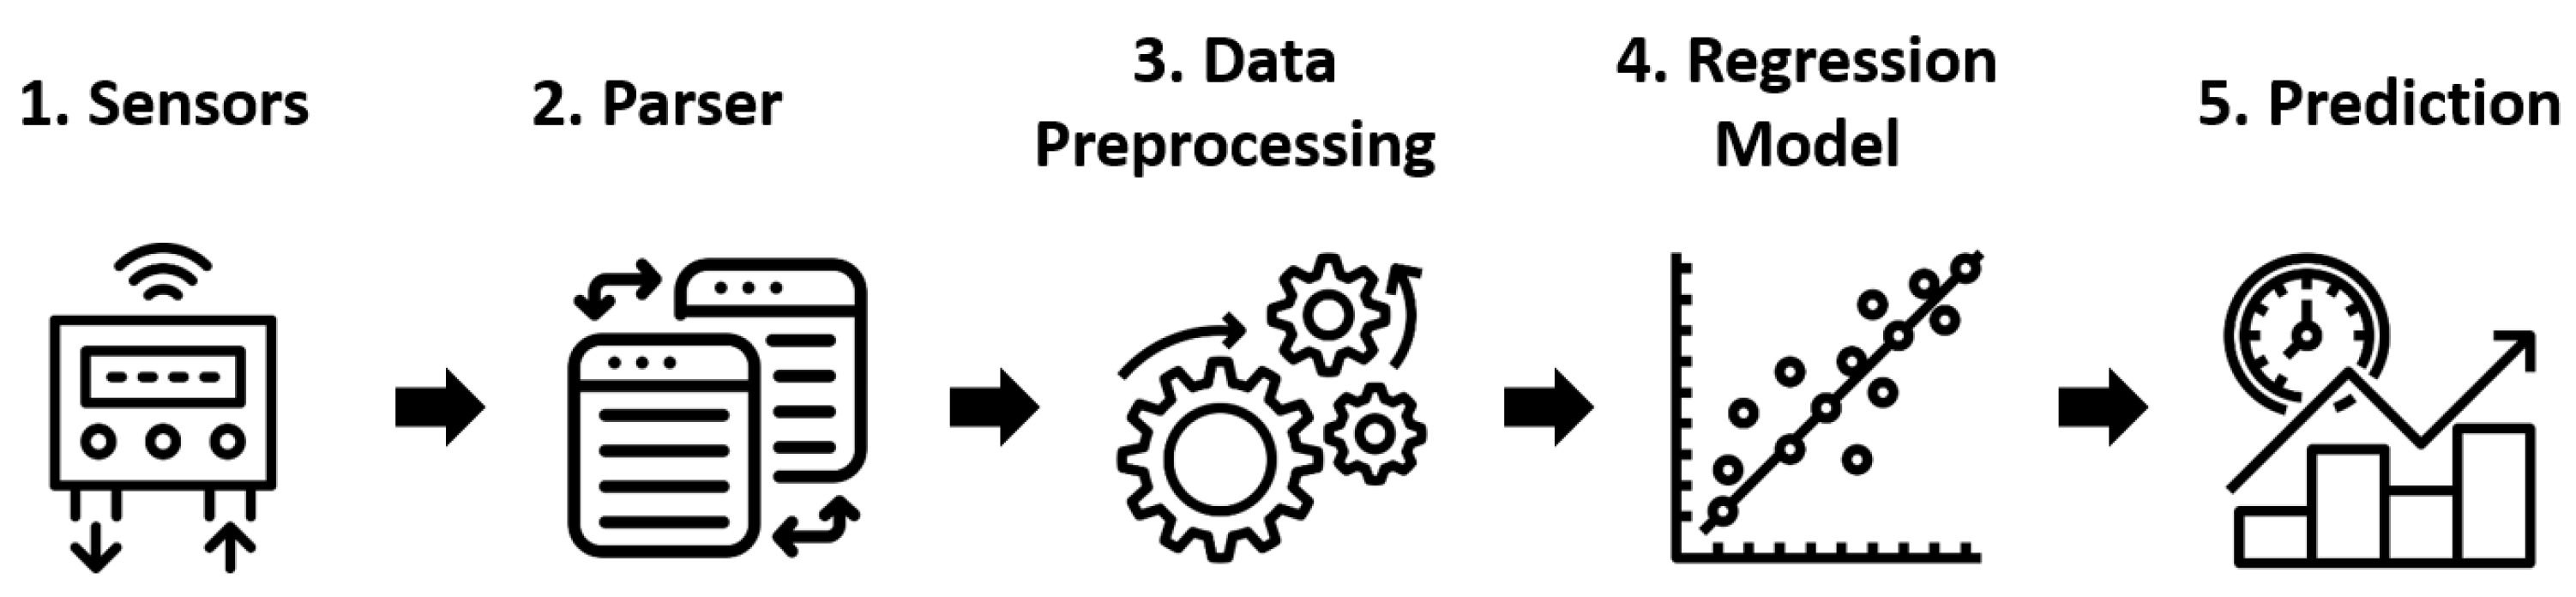
A basic linear regression model [
49] serves as a benchmark for better assessing the performance of the Random Forest Regressor and XGBoost Regressor. The results of this model are shown in the following
Table 4. This table contains valuable metrics such as
, MSE, RMSE, MAE, and SMAPE, which reflect the performance of the regressor for each sensor. With these results, we can assess the strength of the relationship between the sensors and the output, as well as the accuracy of the model.
The CO2 sensor has the highest value of 0.60, indicating that it explains about 60% of the variability in the data. The NIR sensor also has a high value of 0.86, indicating a strong linear relationship between the sensor and the output. On the other hand, the pH sensor has the lowest value of 0.26, indicating a weaker linear relationship. The MSE values range from 5.50 for the CO2 sensor to 11.02 for the pH sensor, with the NIR sensor having the lowest value of 1.89. Similarly, the RMSE values range from 2.34 for the CO2 sensor to 3.32 for the pH sensor, with the NIR sensor having the lowest value of 1.37. The MAE values range from 1.70 for the CO2 sensor to 2.82 for the pH sensor, with the NIR sensor having the lowest value of 1.04. Finally, the SMAPE values range from 72.32% for the CO2 sensor to 121.95% for the pH sensor, with the NIR sensor having the lowest value of 63.27%. In summary, the results of the benchmark linear regression model show that the NIR sensor has the best performance in terms of , MSE, RMSE, MAE, and SMAPE among the sensors used, while the pH sensor has the worst performance.
The results of the evaluation of the Random Forest Regressor are presented in
Table 5.
The VOC sensor has the highest value of 0.99, indicating that it explains almost 99% of the variability in the data. The CO2 sensor also has a high value of 0.98, indicating a strong relationship between the sensor and the output. On the other hand, the Ethanol sensor has the lowest value of 0.56, indicating a weaker relationship. The MSE values range from 0.14 for the VOC sensor to 5.52 for the Ethanol sensor, with the CO2 sensor having the second lowest value of 0.34. Similarly, the RMSE values range from 0.37 for the VOC sensor to 2.35 for the Ethanol sensor, with the CO2 sensor having the second lowest value of 0.58. The MAE values range from 0.15 for the VOC sensor to 1.78 for the Ethanol sensor, with the CO2 sensor having the second lowest value of 0.23. Finally, the SMAPE values range from 12.52% for the VOC sensor to 93.38% for the Ethanol sensor, with the CO2 sensor having the second lowest value of 15.76%. In summary, The results of the Random Forest Regressor model show that the VOC sensor has the best performance in terms of , MSE, RMSE, MAE, and SMAPE among the sensors used, while the Ethanol sensor has the worst performance.
The results of the XGBoost Regressor evaluation are shown in
Table 6.
The VOC sensor has the highest value of 0.99, indicating that it explains almost 99% of the variability in the data. The CO2 sensor also has a high value of 0.97, indicating a strong relationship between the sensor and the output. On the other hand, the Ethanol sensor has the lowest value of 0.56, indicating a weaker relationship. The MSE values range from 0.14 for the VOC sensor to 5.51 for the Ethanol sensor, with the CO2 sensor having the second lowest value of 0.42. Similarly, the RMSE values range from 0.38 for the VOC sensor to 2.35 for the Ethanol sensor, with the CO2 sensor having the second lowest value of 0.65. The MAE values range from 0.18 for the VOC sensor to 1.72 for the Ethanol sensor, with the CO2 sensor having the second lowest value of 0.30. Finally, the SMAPE values range from 24.73% for the VOC sensor to 86.91% for the Ethanol sensor, with the CO2 sensor having the second lowest value of 30.99%. In summary, The results of the XGBoost Regressor model show that the VOC sensor has the best performance in terms of , MSE, RMSE, and SMAPE among the sensors used. On the other hand, the Ethanol sensor has the worst performance in and SMAPE, while the NIR sensor has the worst performance in terms of MAE.
The NIR sensor has the best performance among the sensors used in the benchmark linear regression model, while the VOC sensor has the best performance in the Random Forest Regressor model and XGBoost Regressor model. The Ethanol sensor has the worst performance in all three models. Overall, the VOC sensor has the highest value and the best performance in terms of MSE, RMSE, MAE, and SMAPE among the sensors used in all three models.


 ,
, 


