

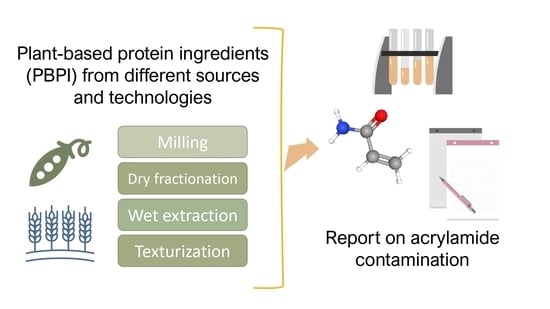
Screening of Acrylamide Content in Commercial Plant-Based Protein Ingredients from Different Technologies
 , ,
, ,  ,
,  and
and
Abstract
:
1. Introduction
2. Materials and Methods
2.1. Chemicals and Reagents
2.2. Plant-Based Protein Ingredients Collection
2.3. Acrylamide Extraction
2.4. LC-MS Analysis
2.5. Statistical Analysis
3. Results
4. Conclusions
Supplementary Materials
Author Contributions
Funding
Data Availability Statement
Conflicts of Interest
References
- EFSA Panel on Contaminants in the Food Chain (CONTAM). Scientific opinion on acrylamide in food. EFSA J. 2015, 13, 4104. [Google Scholar]
- IARC. IARC Monographs on the Evaluation of Carcinogenic Risks to Humans; IARC: Lyon, France, 1994; Volume 60, pp. 389–433. [Google Scholar]
- Swedish National Food Administration. Information about Acrylamide in Food; Swedish National Food Administration: Uppsala, Sweden, 2002; Volume 4, p. 24. [Google Scholar]
- Matoso, V.; Bargi-Souza, P.; Ivanski, F.; Romano, M.A.; Romano, R.M. Acrylamide: A review about its toxic effects in the light of Developmental Origin of Health and Disease (DOHaD) concept. Food Chem. 2019, 283, 422–430. [Google Scholar] [CrossRef] [PubMed]
- Mottram, D.S.; Wedzicha, B.L.; Dodson, A.T. Acrylamide is formed in the Maillard reaction. Nature 2002, 419, 448–449. [Google Scholar] [CrossRef] [PubMed]
- Tareke, E.; Rydberg, P.; Karlsson, P.; Eriksson, S.; Törnqvist, M. Analysis of acrylamide, a carcinogen formed in heated foodstuffs. J. Agric. Food Chem. 2002, 50, 4998–5006. [Google Scholar] [CrossRef]
- Zyzak, D.V.; Sanders, R.A.; Stojanovic, M.; Tallmadge, D.H.; Eberhart, B.L.; Ewald, D.K.; Gruber, D.C.; Morsch, T.R.; Strothers, M.A.; Rizzi, G.P.; et al. Acrylamide formation mechanism in heated foods. J. Agric. Food Chem. 2003, 51, 4782–4787. [Google Scholar] [CrossRef]
- Gertz, C.; Klostermann, S. Analysis of acrylamide and mechanisms of its formation in deep-fried products. Eur. J. Lipid Sci. Technol. 2002, 104, 762–771. [Google Scholar] [CrossRef]
- Mestdagh, F.; Castelein, P.; Van Peteghem, C.; De Meulenaer, B. Importance of oil degradation components in the formation of acrylamide in fried foodstuffs. J. Agric. Food Chem. 2008, 56, 6141–6144. [Google Scholar] [CrossRef]
- Bachir, N.; Haddarah, A.; Sepulcre, F.; Pujola, M. Formation, mitigation, and detection of acrylamide in foods. Food Anal. Methods 2022, 15, 1736–1747. [Google Scholar] [CrossRef]
- Claus, A.; Weisz, G.M.; Schieber, A.; Carle, R. Pyrolytic acrylamide formation from purified wheat gluten and gluten-supplemented wheat bread rolls. Mol. Nutr. Food Res. 2006, 50, 87–93. [Google Scholar] [CrossRef]
- Mousavi Khaneghah, A.; Fakhri, Y.; Nematollahi, A.; Seilani, F.; Vasseghian, Y. The concentration of acrylamide in different food products: A global systematic review, meta-analysis, and meta-regression. Food Rev. Int. 2020, 38, 1286–1304. [Google Scholar] [CrossRef]
- EC (European Commission). Commission Regulation of 20 November 2017 on Establishing Mitigation Measures and Benchmark Levels for the Reduction of the Presence of Acrylamide in Food. 2018. Available online: http://eur-lex.europa.eu/eli/reco/2017/2158/oj (accessed on 3 December 2022).
- Krishnakumar, T.; Visvanathan, R. Acrylamide in food products: A review. J. Food Process. Technol. 2014, 5, 344. [Google Scholar]
- Pasqualone, A.; Haider, N.N.; Summo, C.; Coldea, T.E.; George, S.S.; Altemimi, A.B. Biscuit contaminants, their sources and mitigation strategies: A review. Foods 2021, 10, 2751. [Google Scholar] [CrossRef] [PubMed]
- GFI—The Good Food Institute. Record $5 Billion Invested in Alt Proteins in 2021, Surging 60 Percent Since 2020. Available online: https://gfi.org/press/record-5-billion-invested-in-alt-proteins-in-2021/ (accessed on 4 December 2022).
- Wickramasinghe, K.; Breda, J.; Berdzuli, N.; Rippin, H.; Farrand, C.; Halloran, A. The shift to plant-based diets: Are we missing the point? Glob. Food Sec. 2021, 29, 100530. [Google Scholar] [CrossRef]
- Nehete, J.; Bhambar, R.; Narkhede, M.; Gawali, S. Natural proteins: Sources, isolation, characterization and applications. Pharmacogn. Rev. 2013, 7, 107–116. [Google Scholar] [CrossRef] [PubMed] [Green Version]
- Langyan, S.; Yadava, P.; Khan, F.N.; Dar, Z.A.; Singh, R.; Kumar, A. Sustaining protein nutrition through plant-based foods. Front. Nutr. 2022, 8, 772573. [Google Scholar] [CrossRef] [PubMed]
- Boye, J.; Zare, F.; Pletch, A. Pulse proteins: Processing, characterization, functional properties and applications in food and feed. Food Res. Int. 2010, 43, 414–431. [Google Scholar] [CrossRef]
- De Angelis, D.; Pasqualone, A.; Allegretta, I.; Porfido, C.; Terzano, R.; Squeo, G.; Summo, C. Antinutritional factors, mineral composition and functional properties of dry fractionated flours as influenced by the type of pulse. Heliyon 2021, 7, e06177. [Google Scholar] [CrossRef]
- McClements, D.J.; Grossmann, L. The science of plant-based foods: Constructing next-generation meat, fish, milk, and egg analogs. Compr. Rev. Food Sci. Food Saf. 2021, 20, 4049–4100. [Google Scholar] [CrossRef]
- De Angelis, D.; Kaleda, A.; Pasqualone, A.; Vaikma, H.; Tamm, M.; Tammik, M.L.; Squeo, G.; Summo, C. Physicochemical and sensorial evaluation of meat analogues produced from dry-fractionated pea and oat proteins. Foods 2020, 9, 1754. [Google Scholar] [CrossRef]
- Galani, J.H.Y.; Patel, N.J.; Talati, J.G. Acrylamide-forming potential of cereals, legumes and roots and tubers analyzed by UPLC-UV. Food Chem. Toxicol. 2017, 108, 244–248. [Google Scholar] [CrossRef]
- Portman, D.; Maharjan, P.; Blanchard, C.; Naiker, M.; Panozzo, J.F. Impact of thermal processing on levels of acrylamide in a wheat-lentil flour matrix. Legume Sci. 2021, 3, 78. [Google Scholar] [CrossRef]
- Joshi, M.; Adhikari, B.; Aldred, P.; Panozzo, J.F.; Kasapis, S. Physicochemical and functional properties of lentil protein isolates prepared by different drying methods. Food Chem. 2011, 129, 1513–1522. [Google Scholar] [CrossRef]
- Zhang, Z.; Zhang, L.; He, S.; Li, X.; Jin, R.; Liu, Q.; Chen, S.; Sun, H. High-moisture extrusion technology application in the processing of textured plant protein meat analogues: A review. Food Rev. Int. 2022, 1–36. [Google Scholar] [CrossRef]
- Mastovska, K.; Lehotay, S.J. Rapid sample preparation method for LC−MS MS or GC−MS analysis of acrylamides in various food matrices. J. Agric. Food Chem. 2006, 54, 7001–7008. [Google Scholar] [CrossRef] [PubMed]
- Kyriakopoulou, K.; Keppler, J.K.; van der Goot, A.J. Functionality of ingredients and additives in plant-based meat analogues. Foods 2021, 10, 600. [Google Scholar] [CrossRef] [PubMed]
- Shih, F.F.; Boué, S.M.; Daigle, K.W.; Shih, B.Y. Effects of flour sources on acrylamide formation and oil uptake in fried batters. J. Am. Oil Chem. Soc. 2004, 81, 265–268. [Google Scholar] [CrossRef]
- Žilić, S.; Aktağ, I.G.; Dodig, D.; Filipović, M.; Gökmen, V. Acrylamide formation in biscuits made of different wholegrain flours depending on their free asparagine content and baking conditions. Int. Food Res. J. 2020, 132, 109109. [Google Scholar] [CrossRef]
- Taeymans, D.; Wood, J.; Ashby, P.; Blank, I.; Studer, A.; Stadler, R.H.; Gondé, P.; Van Eijck, P.; Lalljie, S.; Lingnert, H.; et al. A review of acrylamide: An industry perspective on research, analysis, formation, and control. Crit. Rev. Food Sci. Nutr. 2004, 44, 323–347. [Google Scholar] [CrossRef]
- Bou, R.; Navarro-Vozmediano, P.; Domínguez, R.; López-Gómez, M.; Pinent, M.; Ribas-Agustí, A.; Benedito, J.J.; Lorenzo, J.M.; Terra, X.; García-Pérez, J.V.; et al. Application of emerging technologies to obtain legume protein isolates with improved techno-functional properties and health effects. Compr. Rev. Food Sci. Food Saf. 2022, 21, 2200–2232. [Google Scholar] [CrossRef]
- Ciesarová, Z.; Kukurová, K.; Torbica, A.; Belović, M.; Horváthová, J.; Daško, L.; Jelemenská, V. Acrylamide and 5-hydroxymethylfurfural in thermally treated non-wheat flours and respective breads. Food Chem. 2021, 365, 130491. [Google Scholar] [CrossRef]
- Witten, S.; Böhm, H.; Aulrich, K. Effect of variety and environment on the contents of crude nutrients and amino acids in organically produced cereal and legume grains. Org. Agric. 2022, 10, 199–219. [Google Scholar] [CrossRef]
- Hasan, G.A.; Das, A.K.; Satter, M.A. Detection of acrylamide traces in some commonly consumed heat-treated carbohydrate-rich foods by GC-MS/MS in Bangladesh. Heliyon 2022, 8, e11092. [Google Scholar] [CrossRef] [PubMed]
- Pasqualone, A.; Costantini, M.; Coldea, T.E.; Summo, C. Use of legumes in extrusion cooking: A review. Foods 2020, 9, 958. [Google Scholar] [CrossRef] [PubMed]


| Type | Protein Source | Protein Content on the Label (g 100 g−1) | ACRYLAMIDE (µg kg−1) | |
|---|---|---|---|---|
| F | Lentil (Supplier 1) | 29 | 381 ± 49 | de |
| F | Lentil (Supplier 1) | 28 | 273 ± 14 | fg |
| F | Mung Bean (Supplier 1) | 25 | 185 ± 7 | g |
| DF | Chickpea (Supplier 2) | 50 | 474 ± 44 | bcd |
| DF | Pea (Supplier 2) | 55 | 430 ± 36 | cde |
| DF | Lentil (Supplier 2) | 55 | 400 ± 22 | cde |
| DF | Fava bean (Supplier 2) | 55 | 353 ± 26 | ef |
| DF | Mung Bean (Supplier 2) | 56 | 349 ± 20 | ef |
| DF | Lentil (Supplier 2) | 65 | 280 ± 30 | fg |
| WE | Chickpea (Supplier 3) | >90 | 748 ± 42 | a |
| WE | Wheat gluten (Supplier 4) | 80 | 537 ± 52 | b |
| WE | Oat (Supplier 5) | 55 | 485 ± 21 | bc |
| WE | Chickpea (Supplier 3) | >90 | 383 ± 29 | de |
| WE | Soy (Supplier 6) | 60 | 349 ± 26 | ef |
| WE | Soy (Supplier 7) | 87 | 203 ± 10 | g |
| TVP | Pea (Supplier 6) | 80 | 439 ± 48 | cd |
| TVP | Sunflower (Supplier 8) | 80 | 270 ± 15 | fg |
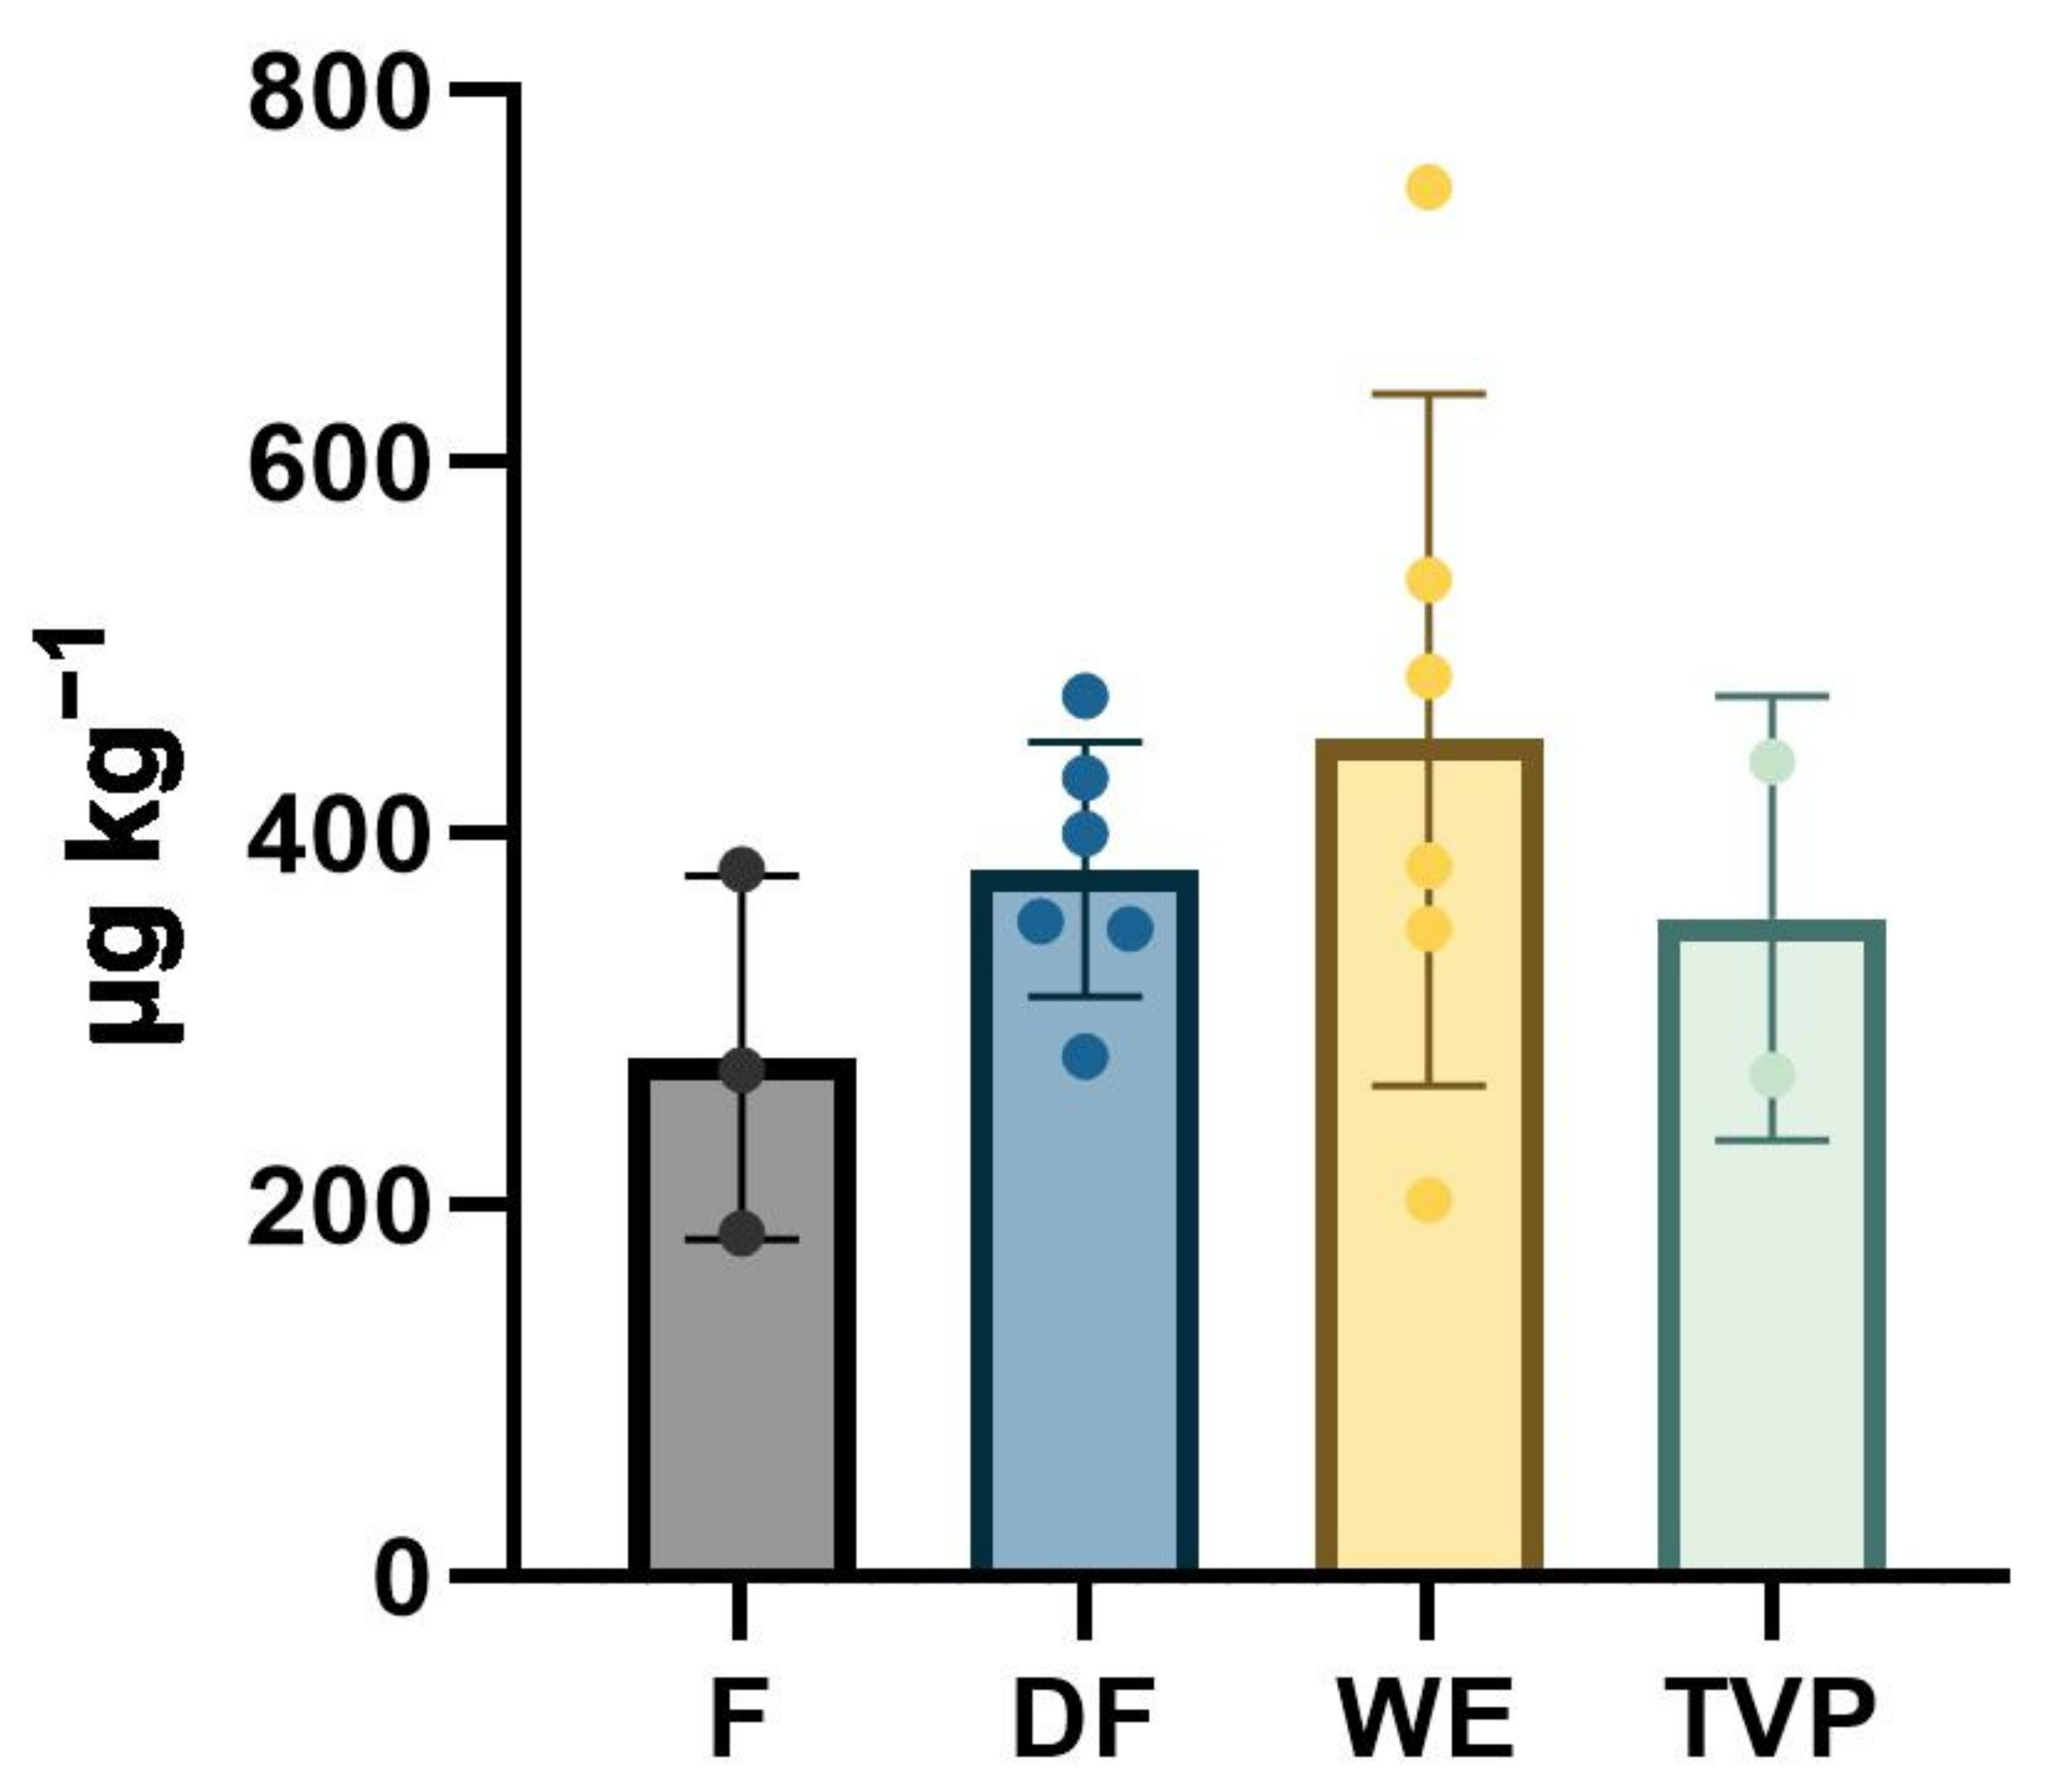
| PBPI Class | N | Mean | SD | RSD | Min | Max | Range | Median | Q1 | Q3 | IQR |
|---|---|---|---|---|---|---|---|---|---|---|---|
| F | 3 | 280 | 98 | 35 | 185 | 381 | 196 | 273 | 229 | 327 | 98 |
| DF | 6 | 381 | 69 | 18 | 280 | 474 | 194 | 376 | 350 | 423 | 73 |
| WE | 6 | 451 | 186 | 41 | 203 | 748 | 545 | 434 | 357 | 524 | 167 |
| TVP | 2 | 354 | 119 | 34 | 270 | 439 | 169 | 354 | 312 | 396 | 84 |
Disclaimer/Publisher’s Note: The statements, opinions and data contained in all publications are solely those of the individual author(s) and contributor(s) and not of MDPI and/or the editor(s). MDPI and/or the editor(s) disclaim responsibility for any injury to people or property resulting from any ideas, methods, instructions or products referred to in the content. |
© 2023 by the authors. Licensee MDPI, Basel, Switzerland. This article is an open access article distributed under the terms and conditions of the Creative Commons Attribution (CC BY) license (https://creativecommons.org/licenses/by/4.0/).
Share and Cite
Squeo, G.; De Angelis, D.; Caputi, A.F.; Pasqualone, A.; Summo, C.; Caponio, F. Screening of Acrylamide Content in Commercial Plant-Based Protein Ingredients from Different Technologies. Foods 2023, 12, 1331. https://doi.org/10.3390/foods12061331
Squeo G, De Angelis D, Caputi AF, Pasqualone A, Summo C, Caponio F. Screening of Acrylamide Content in Commercial Plant-Based Protein Ingredients from Different Technologies. Foods. 2023; 12(6):1331. https://doi.org/10.3390/foods12061331
Chicago/Turabian StyleSqueo, Giacomo, Davide De Angelis, Antonio Francesco Caputi, Antonella Pasqualone, Carmine Summo, and Francesco Caponio. 2023. "Screening of Acrylamide Content in Commercial Plant-Based Protein Ingredients from Different Technologies" Foods 12, no. 6: 1331. https://doi.org/10.3390/foods12061331