
Analysis of Pig Farmers’ Preference and Adoption Behavior for Food Safety Information Labels in China


School of Economics, Zhejiang Gongshang University, Hangzhou 310018, China
Foods 2023, 12(6), 1260; https://doi.org/10.3390/foods12061260
Submission received: 30 December 2022
/
Revised: 7 March 2023
/
Accepted: 14 March 2023
/
Published: 16 March 2023
(This article belongs to the Special Issue Food Security and Structural Transformation of the Food Industry)
Abstract
:Food labels are used to reduce the inefficiencies that arise from information asymmetry. Since food certification and traceability labels are commonly food safety information labels used in China, it is of great importance to study producer preference and adoption behavior towards these food safety information labels. This study constructs a profile of food labels that includes different levels of four safety information attributes, including place of origin, edible agricultural products conformity certificate, traceability code, and organic/green certification. Based on the primary data of pig farmers in Zhejiang Province and using Random Parameters Logit Model and Latent Class Model, this paper analyzed farmers’ willingness to supply pork with food safety information labels and discussed farmers’ adoption behaviors in the production process. Results indicate that among the four information attributes, farmers were more likely to supply pork with the place of origin and organic/green certification. They had a negative willingness to provide pork with a conformity certificate that is certificated by a third party. The preferences for food safety information labels were heterogeneous among farmers. 13.5% of the farmers belonged to the certification-inclined class, and 37.9% of the farmers were traceability preferred. However, the adoption rate by farmers of pork with traceability labels in production was only 7.69%. Therefore, governments and markets should increase incentives for farmers to participate in the traceability system and encourage farmers to issue certificates, and further strengthen the education and training of farmers.
1. Introduction
In recent years, food safety has become a major issue of public concern in China. One of the factors contributing to the incidence of food safety issues is information asymmetry [1]. Due to information asymmetry, consumers cannot assess the safety of food before making a purchase [2]. Food labels are one of the instruments to effectively eliminate information asymmetry, reduce the asymmetry of knowledge on food safety, and prevent food safety risks [3,4]. Through information transmission, food labels can convey information about the safety and quality of food and improve consumers’ perceptions of credibility attribute performance evaluations [5]. This will improve consumers’ confidence in the safety of food and alter their purchasing behavior [6].
Food quality and safety certification traceability systems are commonly used to bridge the information gap between producers and consumers and reduce inefficiencies that arise from information asymmetry [7]. Currently, food safety information labels used in China mainly include the place of origin, green/organic certification, traceability code, and edible agricultural products conformity certificate (hereinafter referred to as conformity certificate). The place of origin information is one of the most important attributes that affect consumers’ food choices [8]. Green/organic certificate label was implemented in the 1990s [9], which aims to certify foods that are produced environment-friendly and safe for human consumption [10]. In 2004, China started to use the food traceability system to facilitate meat traceability. By monitoring the food production process through traceability, it can determine the source of food safety problems and recall the food [11]. The conformity certificate was trial implemented in 2016. Using the practice of industrial certificate, a conformity certificate is a commitment made by producers to consumers for the food quality [12].
In recent years, these food safety information labels have been utilized in blends. For instance, some cities in China have implemented “Conformity Certificate + Traceability Code” and “Conformity Certificate + Place of Origin” labels on a trial basis, aiming to create a composite method for transmitting information on food safety [12]. The efficiency of food safety risk communication by food labels is affected by the food providers. As producers’ behavior plays an important role in the supply of food with information labels, it is crucial to analyze their behavior in adopting these labels.
2. Literature Review
Since food labels may affect consumers’ purchase behaviors, a considerable body of literature has investigated consumer perception and willingness to pay for food with labels in recent years [13,14,15,16]. Consumers’ awareness of food safety information labels with various attributes is quite different, and their willingness to pay (WTP) varies [17]. Xia and Zeng used a meta-analysis to summarize 96 pieces of research on consumers’ WTP for organic food and concluded that the premium WTP by consumers for organic food ranges from 2.3% to 509.2% [18]. The additional payment of Chinese consumers for traceable pork is 15%–30% [19]. Consumers are more concerned with the identification of quality certification or quality standards than origin certification and traceability labels [20,21]. Loureiro and Umberger also confirmed that consumers pay more attention to the certification of the United States Department of Agriculture safety inspection than the county of origin and traceability information [22]. Compared with test/measurement indicators such as traceability and organic certification, consumers prefer cues such as product origin certification [23].
Consumers’ preference for different information attributes depends on the correlation between information labels and food safety [24]. The more comprehensive the information is, the higher the WTP of consumers [25]. However, too many information labels will increase the difficulty for consumers to process information. For example, BPOM in Indonesia reported that consumers were not paying enough attention to the information on food labels which contained complex terminology and number [26]. Therefore, it does not mean that the more information contained in the food safety information labels, the better. Studies have analyzed food safety information labels with different attributes. Take pork, for example, Chen et al. [27] included the origin attribute in the research of the traceability information attribute system and discussed consumers’ WTP for the place of origin label. Taking origin as an attribute of quality assurance ex-ante, Wu et al. [28] studied consumers’ WTP of three different information attributes: traceability, traceability with authentication, and place of origin.
Adding food safety information labels will increase production costs [29]. Because of costs and other factors, farmers’ preference for pork with information labels on different attributes is different. Schulz and Tonsor identified farmers’ preferences for traceability systems from the USA and found the heterogeneity of preferences as well as the welfare effects of mandating traceability among farmers [30]. The aim of producers’ selection of product attributes is to seek the maximum profit, and producers will not provide such product attributes unless they find it profitable to supply or they are required to do so by the government [31]. In order to incentive farmers to comply with higher product safety and quality standards, a small price premium is needed. Ortega et al. found that a majority of farmers in China are willing to comply with the standards when given a modest product premium [7].
Previous studies mainly focused on consumers’ WTP of different information attributes of pork. However, fewer studies have examined the determinants of food safety information label adoption from the producer’s side. Understanding producer preferences towards food safety information attributes is crucial to improve the food safety systems that incentivize producers to supply the desired food. In this context, the purpose of this paper is to examine pig farmers’ willingness to adopt different food safety information labels and discuss farmers’ supply behavior of pork with different information labels in the actual production. Specifically, the study focuses on four food safety information labels of pork: the place of origin, conformity certificate, traceability code, and green/organic certification. And these labels are divided into different levels depending on how comprehensive the information is. Farmers’ willingness to produce pork with different information attributes and levels is assessed using a field survey with choice experiment, and survey results are analyzed using a Random Parameters Logit Model and Latent Class Model. By analyzing the supply of food safety information labels from the producer’s side, this paper aimed to improve the efficiency of food safety risk communication by food labels in the food industry.
3. Methodology
3.1. Attributes and Levels Design
Information labels record, preserve and communicate the information about pork in the supply chain. The attributes and corresponding levels were set according to the content conveyed by the information labels [32]. Farmers use the place of origin to inform consumers of the villages or countries where pigs are raised. Because the quality of pork may affect by the geographical environment, locally-produced pigs are more popular among consumers. Therefore, the place of origin label was divided into the “local production” label (LOCAL) and the “production in other locations” labels (OTHER). In addition, the “no place of origin” label (NOPO) was included as a base point. In the pork supply chain, food safety mainly occurs in stages of farming, processing, and marketing. Because farmers do not involve in the marketing stage, the attribute of the traceability code was divided into three levels: “no traceability” label (NOINF), “processing traceability” label (PROCESS), including information of pig buyers, and “farming traceability” label (FARM), including information of pig feeding farmers. The conformity certificate is issued by pig farmers who promise not to use prohibited and restricted veterinary drugs and illegal additives. At present, the conformity certificate in the market is mostly in the form of producer self-inspection and third-party inspection. Therefore, the conformity certificates of pork were divided into three levels: the “no conformity certificate” label (NOCC) as a base point, the “certificate passing by self-inspection” label (SELF), and the “certificate passing by a third-party inspection” label (THIRD). For the certification label, the certified food on the market is mainly divided into “green food” certification and “organic food” certification. Therefore, the certification label was also divided into three levels: “no certification” label (NOGO), “green certification” label (GREEN), and “organic certification” label (ORGANIC).
Adding food safety information labels will increase production costs. The cost depends on the structure of the supply chain and the complexity of the information transmitted [33]. For example, traceable information increased the cost of production by 1%–10% [34]. Two main factors contribute to the cost of food safety information labels. One is the additional labor paid for the information recording, sorting, and archiving of information, as well as the expenses associated with recording tools and equipment. The other is the cost of obtaining certification and conducting the inspection, as well as the additional investment to enhance the production environment and update inputs.
Through pre-research, we calculated the average price of pork from December 2018 to January 2019 and took the average price of hind leg meat as the base price of pork, which is 32 CNY/kg (around 4.8 USD/kg). The hind leg meat was used because it is the common pork product in the market and can be accepted by consumers in most areas of China. Furthermore, there is no large price difference among hind leg meat, and the profit will not be affected by the differences among the pork products [35]. According to previous research, consumers paid an additional price ranging from 15% to 40% for green, organic, and traceable pork. The price of pork with four information labels raised between 25% and 50%. As a result, three price levels were established: 32 CNY/kg, 40 CNY/kg (around 6.0 USD/kg), and 48 CNY/kg (around 7.2 USD/kg). Using effect codes to assign values to the attributes and their corresponding levels of food safety information labels and prices. The design of the attributes and definition of the variables are shown in Table 1.
3.2. Choice Experiment Design
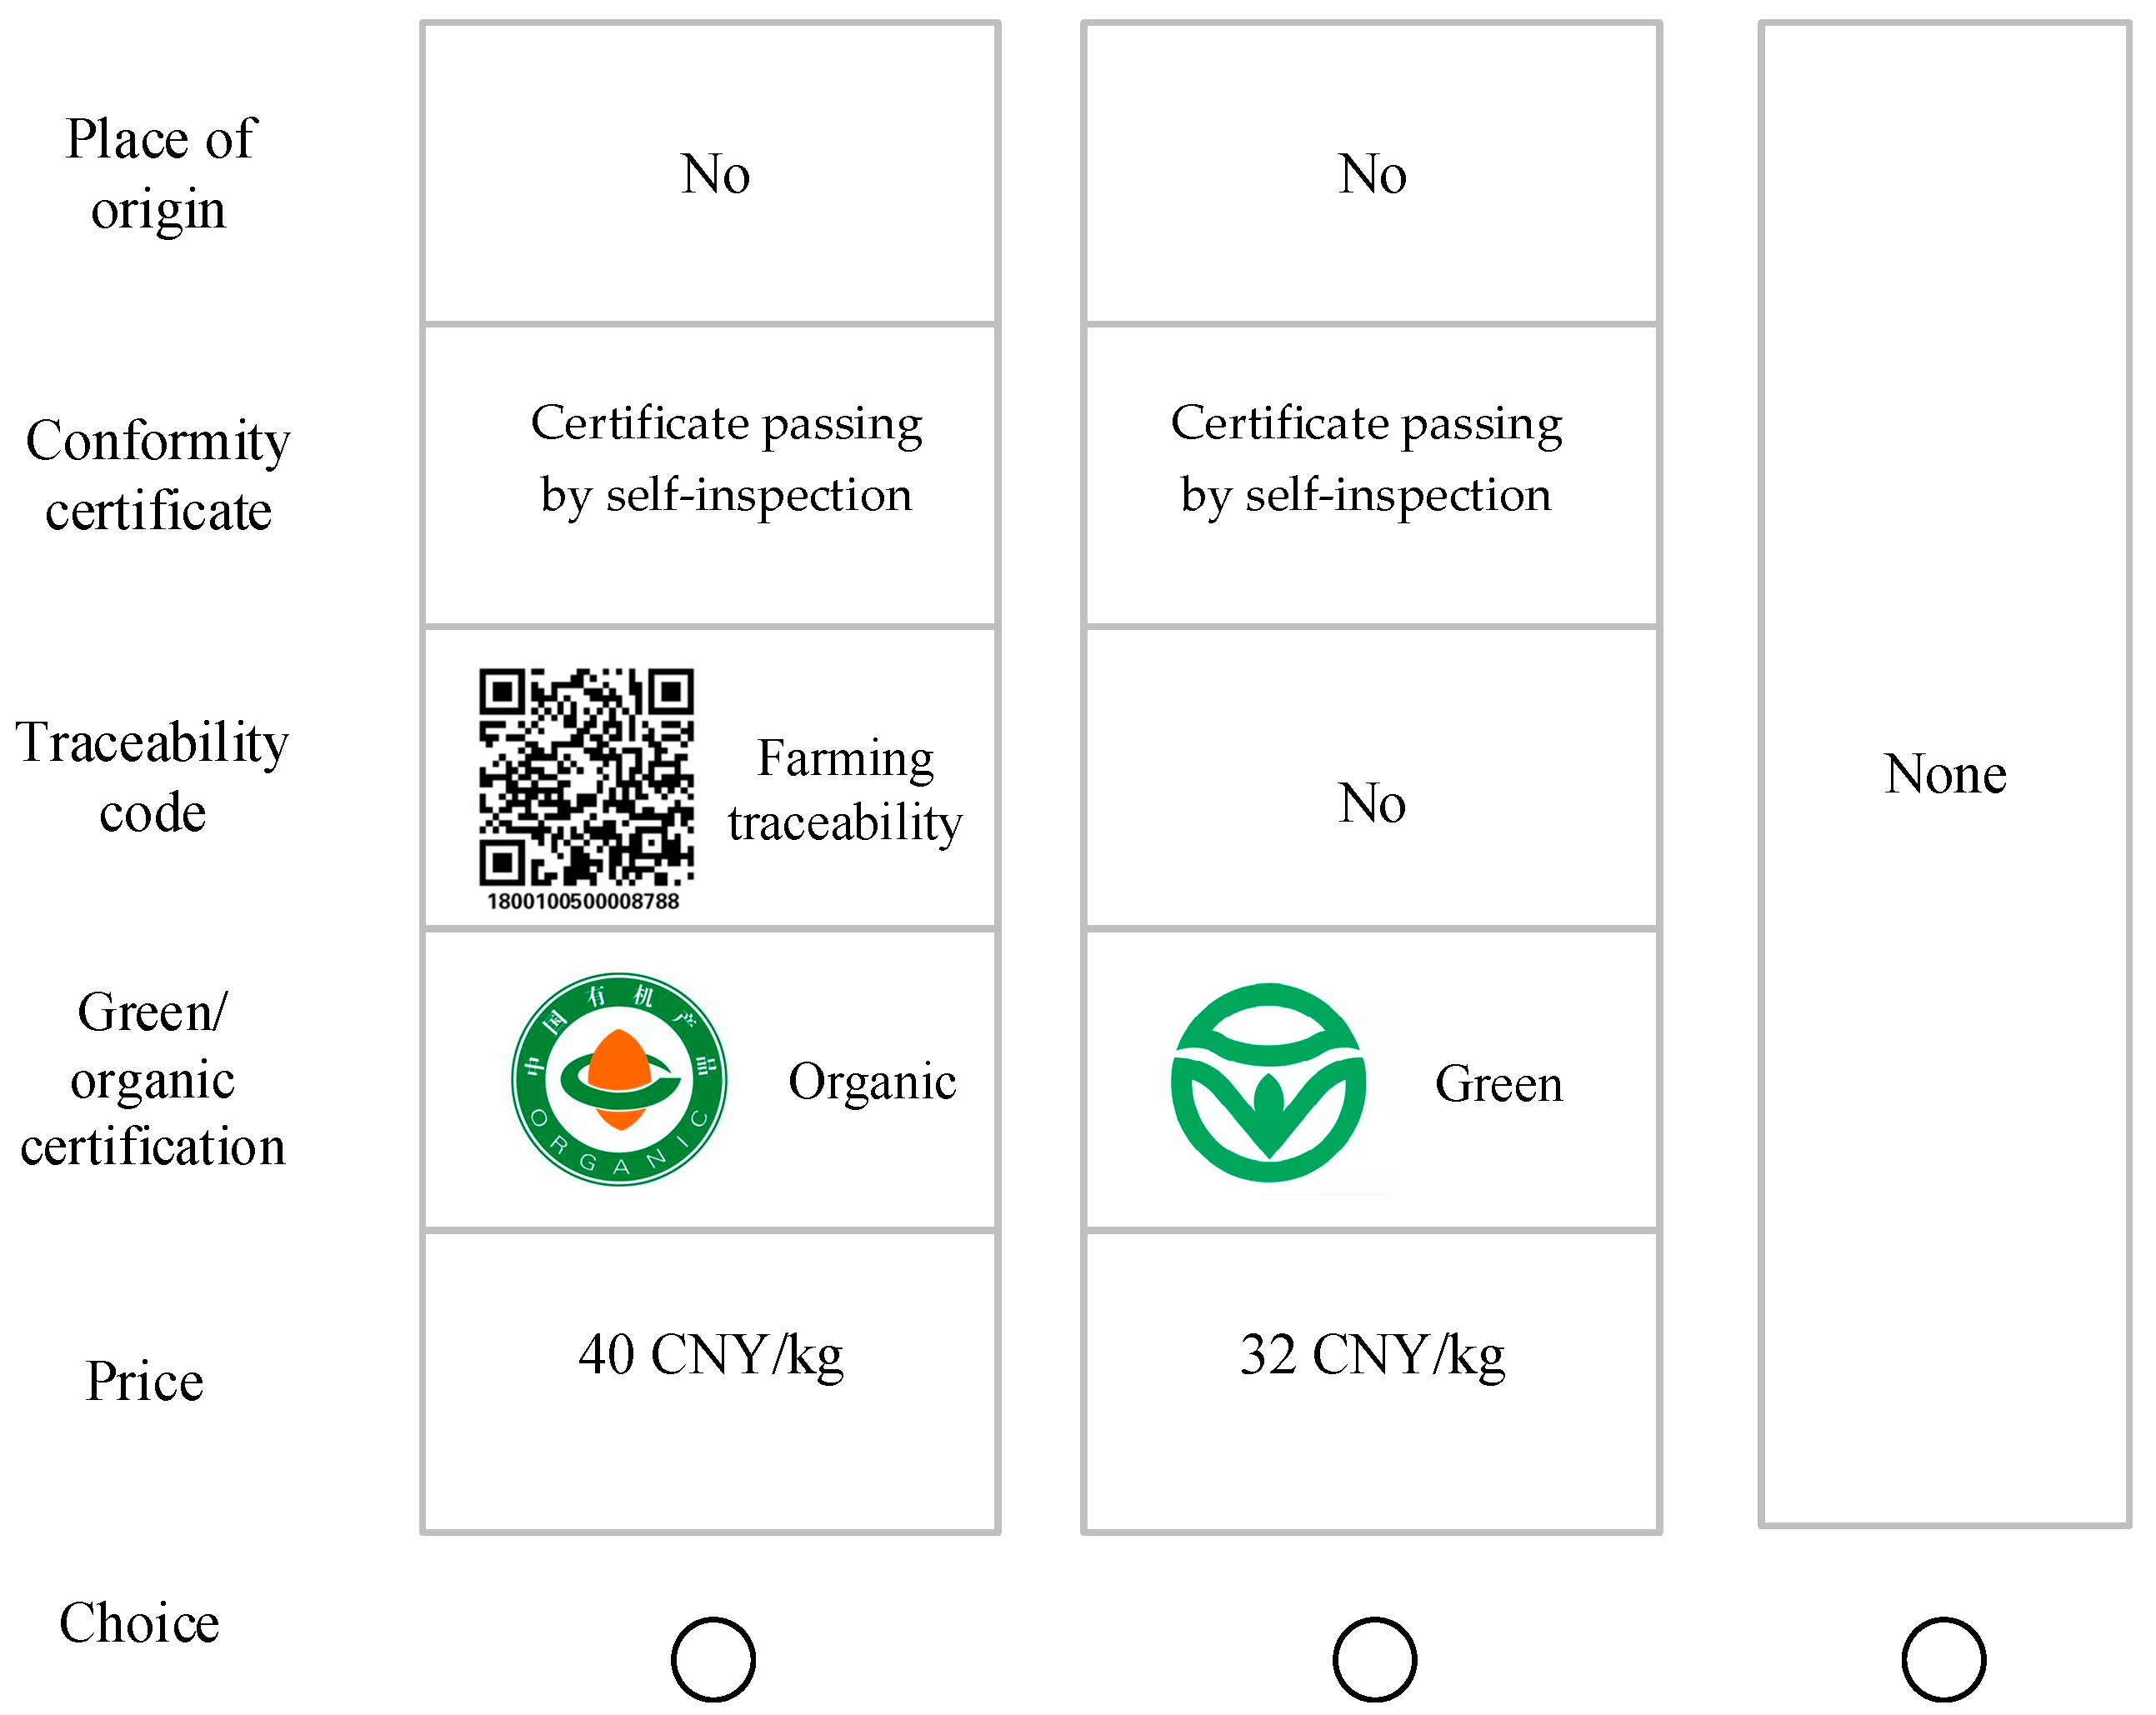
Based on the attributes and level setting, 243 (3 × 3 × 3 × 3 × 3) product profiles were constructed, which required respondents to compare and select from 29,403 tasks. Because it is not practically feasible, a fractional factorial design was used. Using Sawtooth Software SSI Web 7.1, 10 versions of the questionnaire were generated at random, and each included 8 tasks. In each task, the respondents were asked to choose one and only one option. The choice sets were displayed to the respondents in color photographs in order to carry out choice experiments in accordance with best practices [22,36]. See Figure 1 for a sample choice set. To control the respondents’ learning effects, the choice sets were presented in a random order [37]. Since omitting the opt-out option would limit respondents’ decision-making and lead them to delay or even refuse to make a choice, “opt-out” was included in the choice set design [38,39]. Therefore, each choice set included two product profiles and an opt-out option.
3.3. Economic Modelling
In the choice experiment, farmers selected their preferred alternative from multiple product profiles that consist of different levels of various attributes. Farmers’ willingness to produce pork with different food safety information labels depends on the profit from each information attribute. According to the random utility theory [40], an individual selects an alternative from a finite set of alternatives contained in a choice situation . The probability of an individual choosing an alternative is given by:
where is a deterministic component which depends on the attributes of an alternative. It is the product of the parameter vector () to be estimated and the attribute vector () found in the information alternative. The coefficient of the parameter vector to be estimated is also called the part worth of the information alternative. is a stochastic component, indicating the influence of unobservable factors on producer choice. Assuming that the error is independently, identically distributed type , and the producer is homogeneous, then the choice probability would be standard logit, the probability that the producer selects pork with the information attribute label given in the Multinomial Logit Model (MNL) is:
In fact, respondents are heterogeneous in preference for each attribute; therefore, Random Parameters Logit Model (RPL) is appropriate. Since we do not know and cannot condition on , the unconditional choice probability is, therefore, the integral of overall possible values of the unknown parameters. The unconditional probability of the sequence of choices is the mixed logit probability formula; thus, the probability of an individual choosing alternative in the Random Parameters Logit Model is:
If is discrete, the multinomial Logit Model becomes the Latent Class Model (LCM). The heterogeneity of farmers’ preferences can be further analyzed through the Latent Class Model. The probability of an individual falling into the class and choosing an alternative is:
where is the parameter vector of the farmers in class , is the probability that farmers fall into class . Assume is the observed value that affects farmers in a certain class , is the parameter vector of farmers in class , and represents the potential class , therefore:
3.4. Survey and Data
As the supply of pork with information involved in this study mainly depends on pig farmers and the labels contain information from the breeding stage, this study chose pig farmers as the respondents. The survey was conducted in January 2020 at the main pig breeding districts in Zhejiang Province, where the agricultural product conformity certificate system was on trial in 2016. The districts of the survey were selected with the stratified sampling method, and pig farmers were randomly investigated. The investigation was carried out one-to-one by experienced graduate students with the assistance of staff from the local animal husbandry department. In total, 270 questionnaires were distributed, and 221 questionnaires from the qualified respondents were obtained, with the effective rate of questionnaire recovery being 79.26%. The sample covered 9 districts from 3 cities (that is, Jinhua, Quzhou, and Wenzhou).
The survey obtained more male respondents than females; the percentage of male respondents was 54.30%. The age of respondents was concentrated between 51–70 years old. Compared to the Chinese population, the sample had a low education level; more than 40% of respondents only completed elementary school. The family income of respondents mainly ranged from 30,000 to 60,000 CNY per year. The farming scale of respondents was small, with large-scale farming (that is, with an output of more than 1000 per year) accounting for 23.08%, and the average output size of respondents was 1164. The proportion of specialized farming accounted for 60.63%, and respondents who have been farming for more than 10 years accounted for 71.04%. Descriptive statistics of samples are shown in Table 2.
4. Results and Discussion
4.1. Farmers’ Preference for Food Safety Information Labels
Using Nlogit 6.0 to estimate farmers’ preference for different levels of food safety information labels with Multinomial Logit Model (MNL)and Random Parameter Logit Model (RPL). The results are presented in Table 3. The third column shows that variances of most variables are significant at the level of 5%, which proves that there is heterogeneity in the preference of farmers. Therefore, the regression results of the random parameter Logit model shall prevail.
Results of both the MNL model and the RPL model show that the variables of OTHER, LOCAL, GREEN, and ORGANIC have significant positive coefficients. Implies that farmers would rather produce pork with labels of the place of origin and organic/green certification than pork without these labels. In addition, farmers’ preference for pork containing processing traceability and certificate passing by self-inspection labels is also significantly higher than that without information labels. These results are consistent with the findings of Ortega et al. [7], which concluded that farmers’ optimal decision in China is adopting environmentally sustainable practices and avoiding using antibiotics. However, farmers’ willingness to produce pork with a certificate passing by a third-party inspection is negative, and they are unwilling to produce pork containing farming traceability labels. The possible reason is that adding certificate labels passing by a third-party inspection and farming traceability label may raise farmers’ production costs; however, consumers’ awareness and acceptance of the pork with these labels are low [8], leading to a low premium making farmers prefer not to provide them.
4.2. Preference Heterogeneity of Farmers for Different Food Safety Information Labels
Using Latent Class Model (LCM) to analyze farmers’ preference heterogeneity, the results are shown in Table 4. Farmers could be divided into three classes: those who value green/organic certification labels (certification inclined), those who value traceability labels (traceability preferred), and those who value place of origin labels (origin concerned). 13.5% of the respondents belong to the first class, and the coefficient of green/organic labels is significantly positive, which reveals that farmers in this group obtain profit from certification labels. So that we refer to this class of farmers as “certification inclined.” The second class, which accounts for 37.9% of the respondents, could be referred to as “traceability preferred” farmers, for the coefficient of both effect of processing traceability and farming traceability of this group is significantly positive. The third class, which comprises the vast majority of the respondents (48.6%), is characterized by farmers who put more consideration in place of origin. The coefficient of local production and production in other locations is positive and significant at the 1% level, and they can be referred to as “origin concerned.”
4.3. The Order of Importance of Food Safety Information Labels by Farmers
On the basis of the proportion of the difference between the highest and the lowest part-worth of each food safety information attribute and the sum of all the differences, this study calculated the order of importance of the four information attributes based on farmers’ production preference. Table 5 shows the four information attributes in the following order: green/organic certification (56.36%), place of origin (23.72%), traceability code (14.82%), and compliance certificate (5.10%).
It is interesting to note that among these four information attributes, farmers rank green/organic certification label and conformity certificate label as the most important and the least important, respectively. One possible reason is that farmers’ preference for different information labels mainly depends on consumers’ acceptance and the premium they pay for the pork with these labels [41]. The conformity certificate is a food safety information label on the trial, and consumers do not have a clear understanding of this label [42]. Because consumers’ awareness and acceptance are low, farmers believe it to be of the least importance. However, consumers are relatively familiar with the organic/green labels, so farmers are more prefer to produce pork with certification labels [18,43].
4.4. Farmers’ Adoption Behavior of Food Safety Information Labels
Farmers’ adoption behavior in practical productions is shown in Table 5. In general, the proportion of farmers who produce pork with these labels accounts for 56.56% of the investigated samples. The majority of them (30.77%) produce pork with conformity certificate labels. And the proportion of farmers who produce pork with the place of origin, traceability, and green/organic certification label accounts for 16.29%, 7.69%, and 1.81%, respectively. By comparing the production intention of farmers, it is found that farmers have the highest preference for producing pork with green/organic certification labels, but only 1.81% of farmers adopted the green/organic certification label in their production behavior. Farmers have the least preference for the conformity certificate label, but the proportion of adoption behavior in practice is the highest.
Farmers’ preference for information labels is inconsistent with their adoption behavior in practice. The production costs, application processes, convenience, and productivity of providing information labels may all have an impact on farmers’ adoption behavior [44]. Farmers prefer to produce pork with green/organic certification labels because these products can bring them higher profits. Green/organic pork, on the other hand, must pass the certification by a specific certification body, and the application and certification procedures are complicated and time-consuming [45]. Farmers are willing to adopt these labels. However, the majority of farmers have not reached the standard that certification requires and have not yet gotten the certification in reality. Resulting in a low adoption rate of green /organic labels in the production practice. In comparison to the green/organic certification label, adding the conformity certificate label is simple [42]. The conformity certificate label is easy to be obtained, and it is issued by pig farmers. Farmers are required to promise not to use prohibited veterinary drugs and illegal additives and to comply with the withdrawal period of veterinary drugs [12]. Therefore, the adoption ratio of the conformity certificate label by farmers is much higher. Similarly, farmers prefer to produce pork with traceability codes, but only 7.69% of the respondents adopt traceability codes during the production practice.
4.5. Implications
Understanding farmers’ preference and their adoption behavior for food safety information labels are important because it can help improve regulation policies and rebuild consumer confidence in the food industry. The inconsistency between farmers’ preferences and behavior reduced the efficiency of food safety risk communication by information labels. Therefore, to improve farmers’ willingness to produce pork with certain food safety information labels, the market should improve the incentives for farmers to make up for the increase in production costs. Government should provide subsidies for farmers to increase their motivation to participate in the traceability system and issue conformity certificate labels. Furthermore, to promote farmers’ adoption behavior, governments should simplify the certification and approval procedures of green/organic certification labels, improve the convenience of traceability code information recording and strengthen the education and training of farmers. Farmers should provide food safety information labels with a higher level of information to meet the requirements of the market. Furthermore, they should participate in the education and training of information recording and comply with the requirements for recording and issuing information labels.
5. Conclusions
This research analyzed farmers’ preference and their adoption behavior for different food safety information labels. The results show that farmers’ preference for pork with labels of the place of origin, green/organic certificate, processing traceability and certificate passing by self-inspection is significantly higher than that without these information labels. However, their perception does not associate with their adoption behavior. Farmers consider green/organic certification as the most important label, but only 1.81% of the surveyed farmers adopt green/organic certification in the production practice. For the conformity certificate label, although most farmers consider it as the least important, there are more than 30% of the surveyed farmers provide it in the actual production.
This study contains some limitations. The results are based on data obtained from a field survey, and the limitation on sample size and the sample selection may result in biased results. In addition, the results show that farmers’ perception is inconsistent with their adoption behavior, but the study did not analyze the reason for the inconsistency. One possible reason is farmers’ adoption behavior is not only based on the consideration of production cost but also on the convenience of the information recording and the efficiency of corresponding certification and approval procedures. Even in the case of high preference of farmers, they may be reluctant to supply pork with these labels unless the label issuance and approval procedures are convenient. In order to confirm this reason, further investigation and research are needed.
Funding
This research was funded by The Nature Science Foundation of Zhejiang Province (grant number LQ20G030008), The National Nature Science Foundation of China (grant number 72203204) and The Humanities and Social Sciences project of the Ministry of Education (grant number 22YJC790185).
Data Availability Statement
Data are contained within the article.
Conflicts of Interest
The authors declare no conflict of interest.
References
- Resende-Filho, M.A.; Hurley, T.M. Information asymmetry and traceability incentives for food safety. Int. J. Production Economics 2012, 139, 596–603. [Google Scholar] [CrossRef]
- Quan, S.W.; Yu, X.H.; Zeng, Y.C. Research of consumer’s preference on milk power origin in China-Based on comparative analysis of choice experiment and revealed preference data. J. Agrotech. Econ. 2017, 1, 52–66. [Google Scholar] [CrossRef]
- van Rijswijk, W.; Frewer, L.J.; Menozzi, D.; Faioli, G. Consumer Perceptions of Traceability: A Cross national Comparison of the Associated Benefits. Food Qual. Prefer. 2008, 19, 452–464. [Google Scholar] [CrossRef]
- Unnevehr, L.; Eales, J.; Jensen, H.; Lusk, J.; McCluskey, J.; Kinsey, J. Food and Consumer Economics. Am. J. Agric. Econ. 2010, 92, 506–521. [Google Scholar] [CrossRef]
- Gao, Z.F.; Schroeder, T.C.; Yu, X.H. Consumer willingness to pay for cue attribute: The value beyond its own. J. Int. Food Agribus. Mark. 2010, 22, 108–124. [Google Scholar] [CrossRef]
- Yin, S.; Lv, S.; Chen, Y.; Wu, L.; Chen, M.; Yan, J. Consumer preference for infant milk: Based formula with select food safety information attributes: Evidence from a choice experiment in China. Can. J. Agric. Econ. 2018, 66, 557–569. [Google Scholar] [CrossRef]
- Ortega, D.L.; Wang, H.H.; Olynk, N.J.; Wu, L.P. Chinese producer behavior: Aquaculture farmers in southern China. China Econ. Rev. 2014, 28, 17–24. [Google Scholar] [CrossRef]
- Chern, W.S.; Chang, C.Y. Benefit evaluation of the country of origin labeling in Taiwan: Results from an auction experiment. Food Policy 2012, 37, 511–519. [Google Scholar] [CrossRef]
- Liu, R.; Pieniak, Z.; Verbeke, W. Consumers’ attitudes and behaviour towards safe food in China: A review. Food Control. 2013, 33, 93–104. [Google Scholar] [CrossRef]
- Wang, Y.Q.; Wang, J.B.; Han, D.; Lv, S.S.; Chen, M.; Yin, S.J. The interaction relationships among agricultural certification labels orbrands: Evidence from Chinese consumer preference for fresh produce. Int. Food Agribus. Manag. Rev. 2022, 25, 211–229. [Google Scholar] [CrossRef]
- Regattieri, A.; Gamberi, M.; Manzini, R. Traceability of food products: General framework and experimental evidence. J. Food Eng. 2007, 81, 347–356. [Google Scholar] [CrossRef]
- Yu, Y.J.; Chen, K.; Wang, J.; Tang, T.; Chen, S. Research on the management effect and influencing factors of the edible agricultural conformity certificate. Acta Agric. Zhejiangensis 2018, 30, 1798–1803. [Google Scholar]
- Lewis, K.E.; Grebitus, C.; Colson, G.; Hu, W.Y. German and British consumer willingness to pay for beef labeled with food safety attributes. J. Agric. Econ. 2017, 68, 451–470. [Google Scholar] [CrossRef]
- Bernard, J.C.; Duke, J.M.; Albrecht, S.E. Do labels that convey minimal, redundant, or no information affect consumer perceptions and willingness to pay? Food Qual. Prefer. 2018, 71, 149–157. [Google Scholar] [CrossRef]
- Yang, S.H.; Suhandoko, A.A.; Dennis, C. Impact of nutritional information on consumers’ willingness to pay for meat products in traditional wet markets of Taiwan. Foods 2020, 9, 1086–1099. [Google Scholar] [CrossRef]
- Duke, J.M.; Bernard, J.C.; Vitz, G. A new food label to aid farmland preservation programs: Evidence from a field experiment. Food Policy 2021, 99, 102011. [Google Scholar] [CrossRef]
- Ortega, D.L.; Wang, H.H.; Wu, L.; Olynka, N.J. Modeling heterogeneity in consumer preferences for select food safety attributes in China. Food Policy 2011, 36, 318–324. [Google Scholar] [CrossRef] [Green Version]
- Xia, W.; Zeng, Y. Consumer’s willingness to pay for organic food in the perspective of meta-analysis. In Proceedings of the International Conference on Applied Economics (ICOAE), Kastoria, Greece, 23 October 2008. [Google Scholar] [CrossRef]
- Wu, L.H.; Qin, S.S.; Zhu, D. Government subsidy and market share of traceable pork. Financ. Trade Res. 2014, 25, 80–86. [Google Scholar] [CrossRef]
- Verbeke, W.; Ward, R.W. Consumer interest in information cues denoting quality, traceability and origin: An application of ordered probit models to beef labels. Food Qual. Prefer. 2006, 17, 453–467. [Google Scholar] [CrossRef]
- Gao, Z.; Yu, X.; Li, C.; McFadden, B.R. The interaction between country of origin and genetically modified orange juice in urban China. Food Qual. Prefer. 2019, 71, 475–484. [Google Scholar] [CrossRef]
- Loureiro, M.L.; Umberger, W.J. A choice experiment model for beef: What US consumer responses tell us about relative preferences for food safety, country-of-origin labeling and traceability. Food Policy 2007, 32, 496–514. [Google Scholar] [CrossRef]
- Wang, E.P.; Gao, Z.F.; Heng, Y.; Shi, L. Chinese consumers’ preferences for food quality test/measurement indicators and cues of milk powder: A case of Zhengzhou, China. Food Policy 2019, 89, 101791. [Google Scholar] [CrossRef]
- Yin, S.J.; Wang, Y.Q.; Li, K. Pre-certification or post-traceability: A study on consumer preference for food safety information label and their interactive relationship. China Rural Surv. 2019, 5, 127–144. [Google Scholar]
- Xu, F.; Chen, H.H. Consumers’ willingness to pay for different traceable food products and its influencing factors. Res. Agric. Mod. 2020, 41, 1011–1019. [Google Scholar] [CrossRef]
- Wibowo, C.P.; Syahlani, S.P.; Nurtini, S. Study of Animal-Based Food Product Labeling use. Bull. Anim. Sci. 2019, 43, 151–156. [Google Scholar] [CrossRef] [Green Version]
- Chen, X.J.; Qin, S.S.; Yin, S.J.; Wu, L.H. Study on supply-side reform of traceable pork supply based on the consumers’ preference of origin information attributes. China Popul. Resour. Environ. 2016, 26, 92–100. [Google Scholar]
- Wu, L.H.; Gong, X.R.; Chen, X.J.; Zhu, D. Attribute with pre-incident quality assurance and post-incident traceability. China Popul. Resour. Environ. 2018, 216, 151–163. [Google Scholar]
- Caswell, J.A. How labeling of safety and process attributes affects markets for food. Agric. Resour. Econ. Rev. 1998, 27, 151–158. [Google Scholar] [CrossRef] [Green Version]
- Schulz, L.; Tonsor, G.T. Cow-calf producer preferences for voluntary traceability systems. J. Agric. Econ. 2010, 61, 138–162. [Google Scholar] [CrossRef]
- Olynk, N.J.; Tonsor, G.T.; Wolf, C.A. Verifying credence attributes in livestock production. J. Agric. Appl. Econ. 2010, 42, 439–452. [Google Scholar] [CrossRef] [Green Version]
- Zhang, J.; Waldron, S.; Dong, X. Evidence from a Choice Experiment in Consumer Preference towards Infant Milk Formula (IMF) in the Context of Dairy Revitalization and COVID-19 Pandemic. Foods 2022, 11, 2689. [Google Scholar] [CrossRef]
- Asioli, D.; Alfnes, F. The Norwegian food market: Main issues and trends. Br. Food J. 2016, 118, 2358. [Google Scholar] [CrossRef] [Green Version]
- Shan, L.J.; Xu, X.; Xie, L.B. The effects of food traceability technology on social welfare: Based on the perspective of vertical differential game. J. Public Manag. 2013, 10, 103–109. [Google Scholar]
- Wang, H.M.; Ni, C.J.; Xu, R.Z. On consumer’s willingness to pay on food quality and label safety: A case study of pork consumption in Nanjing city. J. Nanjing Agric. Univ. (Soc. Sci. Ed.) 2011, 11, 21–29. [Google Scholar]
- Lusk, J.L.; Schroeder, T.C. Are choice experiments incentive compatible? A test with quality differentiated beef steaks. Am. J. Agric. Econ. 2004, 86, 467–482. [Google Scholar] [CrossRef] [Green Version]
- Savage, S.J.; Waldman, D.M. Learning and fatigue during choice experiments: A comparison of online and mail survey modes. J. Appl. Econom. 2008, 23, 351–371. [Google Scholar] [CrossRef]
- Ladenburg, J.; Olsen, S.B. Augmenting short cheap talk scripts with a repeated opt-out reminder in choice experiment surveys. Resour. Energy Econ. 2014, 37, 39–63. [Google Scholar] [CrossRef] [Green Version]
- De-Magistris, T.; Akaichi, F.; Youssef, B.K. Testing the effectiveness of the oath script in reducing the hypothetical bias in the Contingent Valuation Method. Agric. Econ. 2016, 62, 378–384. [Google Scholar] [CrossRef] [Green Version]
- Lancaster, K.J. A new approach to consumer theory. J. Political Econ. 1966, 74, 132–157. [Google Scholar] [CrossRef]
- Lusk, J.L.; Hudson, D. Willingness-to-pay estimates and their relevance to agribusiness decision making. Rev. Agric. Econ. 2004, 26, 152–169. [Google Scholar] [CrossRef]
- Yu, Y.J.; Chen, K.; Wang, W.M.; Chen, S. Certification management system innovation and practice research of edible agricultural products: Case study of Zhejiang Province. Food Nutr. China 2018, 24, 16–19. [Google Scholar]
- Ueasangkomsate, P.; Santiteerakul, S. A Study of consumers’ attitudes and intention to buy organic foods for sustainability. Procedia Environ. Sci. 2016, 34, 423–430. [Google Scholar] [CrossRef] [Green Version]
- Zhong, Y.Q.; Huang, Z.H. The difference between consumption preference and production willingness of pork with food safety information label. Res. Agric. Mod. 2022, 43, 38–47. [Google Scholar] [CrossRef]
- Zhang, L.; Lu, M.W.; Li, X.T. Problems and countermeasures in green certification of agricultural products of scattered farmers. South China Agric. 2020, 26, 97–98. [Google Scholar]
Figure 1.
Sample choice set in a task.


Table 1.
Attributes design and variables definition of Choice Experiment.
| Information Attributes | Attribute Levels | Variables Name | Variables Assignment |
|---|---|---|---|
| Place of origin | No place of origin | NOPO | OTHER = −1, LOCAL = −1 |
| Production in other locations | OTHER | OTHER = 1, LOCAL = 0 | |
| Local production | LOCAL | OTHER = 0, LOCAL = 1 | |
| Traceability code | No traceability | NOINF | PROCESS = −1, FARM = −1 |
| Processing traceability | PROCESS | PROCESS = 1, FARM = 0 | |
| Farming traceability | FARM | PROCESS = 0, FARM = 1 | |
| Conformity certificate | No conformity certificate | NOCC | SELF = −1, THIRD = −1 |
| Certificate passing by self-inspection | SELF | SELF = 1, THIRD = 0 | |
| Certificate passing by a third-party inspection | THIRD | SELF = 0, THIRD = 1 | |
| Green/organic certification | No certification | NOGO | GREEN = −1, ORGANIC = −1 |
| Green certification | GREEN | GREEN = 1, ORGANIC = 0 | |
| Organic certification | ORGANIC | GREEN = 0, ORGANIC = 1 | |
| Price | Base price | PRICE | 32 CNY/kg (4.8 USD/kg) |
| Middle price, rise 25% | MPRICE | 40 CNY/kg (6.0 USD/kg) | |
| High price, rise 50% | HPRICE | 48 CNY/kg (7.2 USD/kg) |
Table 2.
Descriptive statistics of sample characteristics.
| Variables | Categories | Number of Respondents | Percentage of Sample (%) |
|---|---|---|---|
| Gender | Male | 120 | 54.30 |
| Female | 101 | 45.70 | |
| Age | Under 30 | 3 | 1.36 |
| 30–50 | 62 | 28.05 | |
| 51–70 | 136 | 61.54 | |
| Above 70 | 20 | 9.05 | |
| Education | Elementary school education and under | 89 | 40.27 |
| Junior high school | 81 | 36.65 | |
| High school (including secondary occupation education) | 39 | 17.65 | |
| College (including higher vocational technology education) | 9 | 4.07 | |
| Bachelor’s degree and above | 3 | 1.36 | |
| Family income | Under 30,000 CNY (4500 USD) per year | 57 | 25.79 |
| 30,000–60,000 CNY (4500–9000 USD) per year | 69 | 31.22 | |
| 60,000–100,000 CNY (9000–15,000 USD) per year | 45 | 20.36 | |
| 100,000–150,000 CNY (15,000–22,500 USD) per year | 32 | 14.48 | |
| Above 150,000 CNY (22,500 USD) per year | 18 | 8.14 | |
| Output of pigs | Under 30 | 14 | 6.33 |
| 31–100 | 72 | 32.58 | |
| 101–1000 | 84 | 38.01 | |
| Over 1000 | 51 | 23.08 | |
| Farming year | Under 10 | 64 | 28.96 |
| 11–30 | 114 | 51.58 | |
| Over 30 | 43 | 19.46 | |
| Specialization | Yes | 134 | 60.63 |
| No | 87 | 39.37 |
Table 3.
Famers’ preference for different food safety information labels.
| Variables | Multinomial Logit Model | Random Parament Logit Model | ||
|---|---|---|---|---|
| Coefficients | Standard Error | Coefficients | Standard Error | |
| OTHER | 0.171 *** | 0.047 | 0.224 *** | 0.060 |
| LOCAL | 0.184 *** | 0.050 | 0.244 *** | 0.061 |
| SELF | 0.165 *** | 0.047 | 0.160 *** | 0.057 |
| THIRD | −0.016 | 0.049 | −0.059 | 0.060 |
| PROCESS | 0.230 *** | 0.047 | 0.288 *** | 0.056 |
| FARM | −0.004 | 0.048 | 0.005 | 0.060 |
| GREEN | 0.397 *** | 0.048 | 0.556 *** | 0.080 |
| ORGANIC | 0.435 *** | 0.049 | 0.558 *** | 0.061 |
| PRICE | 0.114 *** | 0.017 | 0.147 *** | 0.060 |
| ASC | 0.553 | 0.354 | 1.231 *** | 0.061 |
| NSOTHER | — | — | 0.295 *** | 0.080 |
| NSLOCAL | — | — | 0.295 *** | 0.080 |
| NSSELF | — | — | 0.104 | 0.096 |
| NSTHIRD | — | — | 0.245 ** | 0.118 |
| NSPROCESS | — | — | 0.188 * | 0.127 |
| NSFARM | — | — | 0.029 | 0.125 |
| NSGREEN | — | — | 1.018 *** | 0.090 |
| NSORGANIC | — | — | 0.080 | 0.129 |
| Log-likelihood | −1360 | −1300 | ||
| R2 | 0.130 | 0.311 | ||
| AIC | 2741 | 2634 | ||
| N | 221 | 221 | ||
Note: ***, **, and * indicate that the parameters are significant at 1%, 5%, and 10% levels, respectively. ASC represents the opt-out option, NSOTHER, NSLOCAL, NSSELF, NSTHIRD, NSPROCESS, NSFARM, NSGREEN, and NSORGANIC represent the variance of the variables OTHER, LOCAL, SELF, THIRD, PROCESS, FARM, GREEN, and ORGANIC respectively.
Table 4.
Famers’ preference heterogeneity for different food safety information labels.
| Variables | Class1 Certification Inclined | Class 2 Traceability Preferred | Class 3 Origin Concerned | |||
|---|---|---|---|---|---|---|
| Coefficients | Standard Error | Coefficients | Standard Error | Coefficients | Standard Error | |
| OTHER | 2.555 ** | 1.060 | 0.133 | 0.184 | 0.355 *** | 0.093 |
| LOCAL | −0.056 | 0.542 | 0.644 *** | 0.182 | 0.479 *** | 0.112 |
| SELF | 2.601 *** | 0.920 | 0.235 | 0.185 | 0.504 *** | 0.100 |
| THIRD | −5.478 *** | 1.838 | −0.115 | 0.193 | −0.072 | 0.096 |
| PROCESS | 3.113 *** | 1.086 | 0.332 * | 0.180 | 0.475 *** | 0.094 |
| FARM | −5.308 *** | 1.855 | 0.534 *** | 0.207 | −0.183 * | 0.104 |
| GREEN | 4.948 *** | 1.449 | 3.714 *** | 0.386 | −0.936 *** | 0.153 |
| ORGANIC | 2.597 ** | 1.031 | 0.202 | 0.292 | 1.412 *** | 0.148 |
| PRICE | 4.267 *** | 1.363 | −0.024 | 0.078 | 0.101 *** | 0.034 |
| ASC | 4.899 | 1.522 | −0.896 | 1.574 | −0.713 | 0.708 |
| Class Prob. | 0.135 | 0.379 | 0.486 | |||
Note: ***, **, and * indicate that the parameters are significant at 1%, 5%, and 10% levels, respectively.
Table 5.
Comparison of farmers’ production preferences and behaviors for different information labels.
Table 5.
Comparison of farmers’ production preferences and behaviors for different information labels.
| Information Labels | Production Preference (%) | Production Behavior (%) |
|---|---|---|
| Place of origin | 23.72 | 16.29 |
| Conformity certificate | 5.10 | 30.77 |
| Traceability code | 14.82 | 7.69 |
| Green/organic certification | 56.36 | 1.81 |
| Total | 100 | 56.56 |
Disclaimer/Publisher’s Note: The statements, opinions and data contained in all publications are solely those of the individual author(s) and contributor(s) and not of MDPI and/or the editor(s). MDPI and/or the editor(s) disclaim responsibility for any injury to people or property resulting from any ideas, methods, instructions or products referred to in the content. |
© 2023 by the author. Licensee MDPI, Basel, Switzerland. This article is an open access article distributed under the terms and conditions of the Creative Commons Attribution (CC BY) license (https://creativecommons.org/licenses/by/4.0/).
Share and Cite
MDPI and ACS Style
Zhong, Y. Analysis of Pig Farmers’ Preference and Adoption Behavior for Food Safety Information Labels in China. Foods 2023, 12, 1260. https://doi.org/10.3390/foods12061260
AMA Style
Zhong Y. Analysis of Pig Farmers’ Preference and Adoption Behavior for Food Safety Information Labels in China. Foods. 2023; 12(6):1260. https://doi.org/10.3390/foods12061260
Chicago/Turabian StyleZhong, Yingqi. 2023. "Analysis of Pig Farmers’ Preference and Adoption Behavior for Food Safety Information Labels in China" Foods 12, no. 6: 1260. https://doi.org/10.3390/foods12061260
Note that from the first issue of 2016, this journal uses article numbers instead of page numbers. See further details here.