
Role of PI3K-AKT Pathway in Ultraviolet Ray and Hydrogen Peroxide-Induced Oxidative Damage and Its Repair by Grain Ferments
 , ,
, ,
Abstract
:
1. Introduction
2. Materials and Methods
2.1. Materials
2.2. Preparation of S. commune Fermented Broths
2.3. Cell Culture and the Cell Viability Measurement
2.4. UVA/H2O2-Induced Model Establishment
2.5. Transcriptome Sequencing
2.6. Screening for Differential Expressed Genes (DEGs) and Functional Analysis
2.7. RT-qPCR
2.8. Statistics
3. Results
3.1. The Establishment of UVA/H2O2-Induced Models and Identification of DEGs
3.2. Gene Ontology (GO) and KEGG Pathway Analysis
3.3. Key DEGs Functioned in PI3K-AKT Pathway
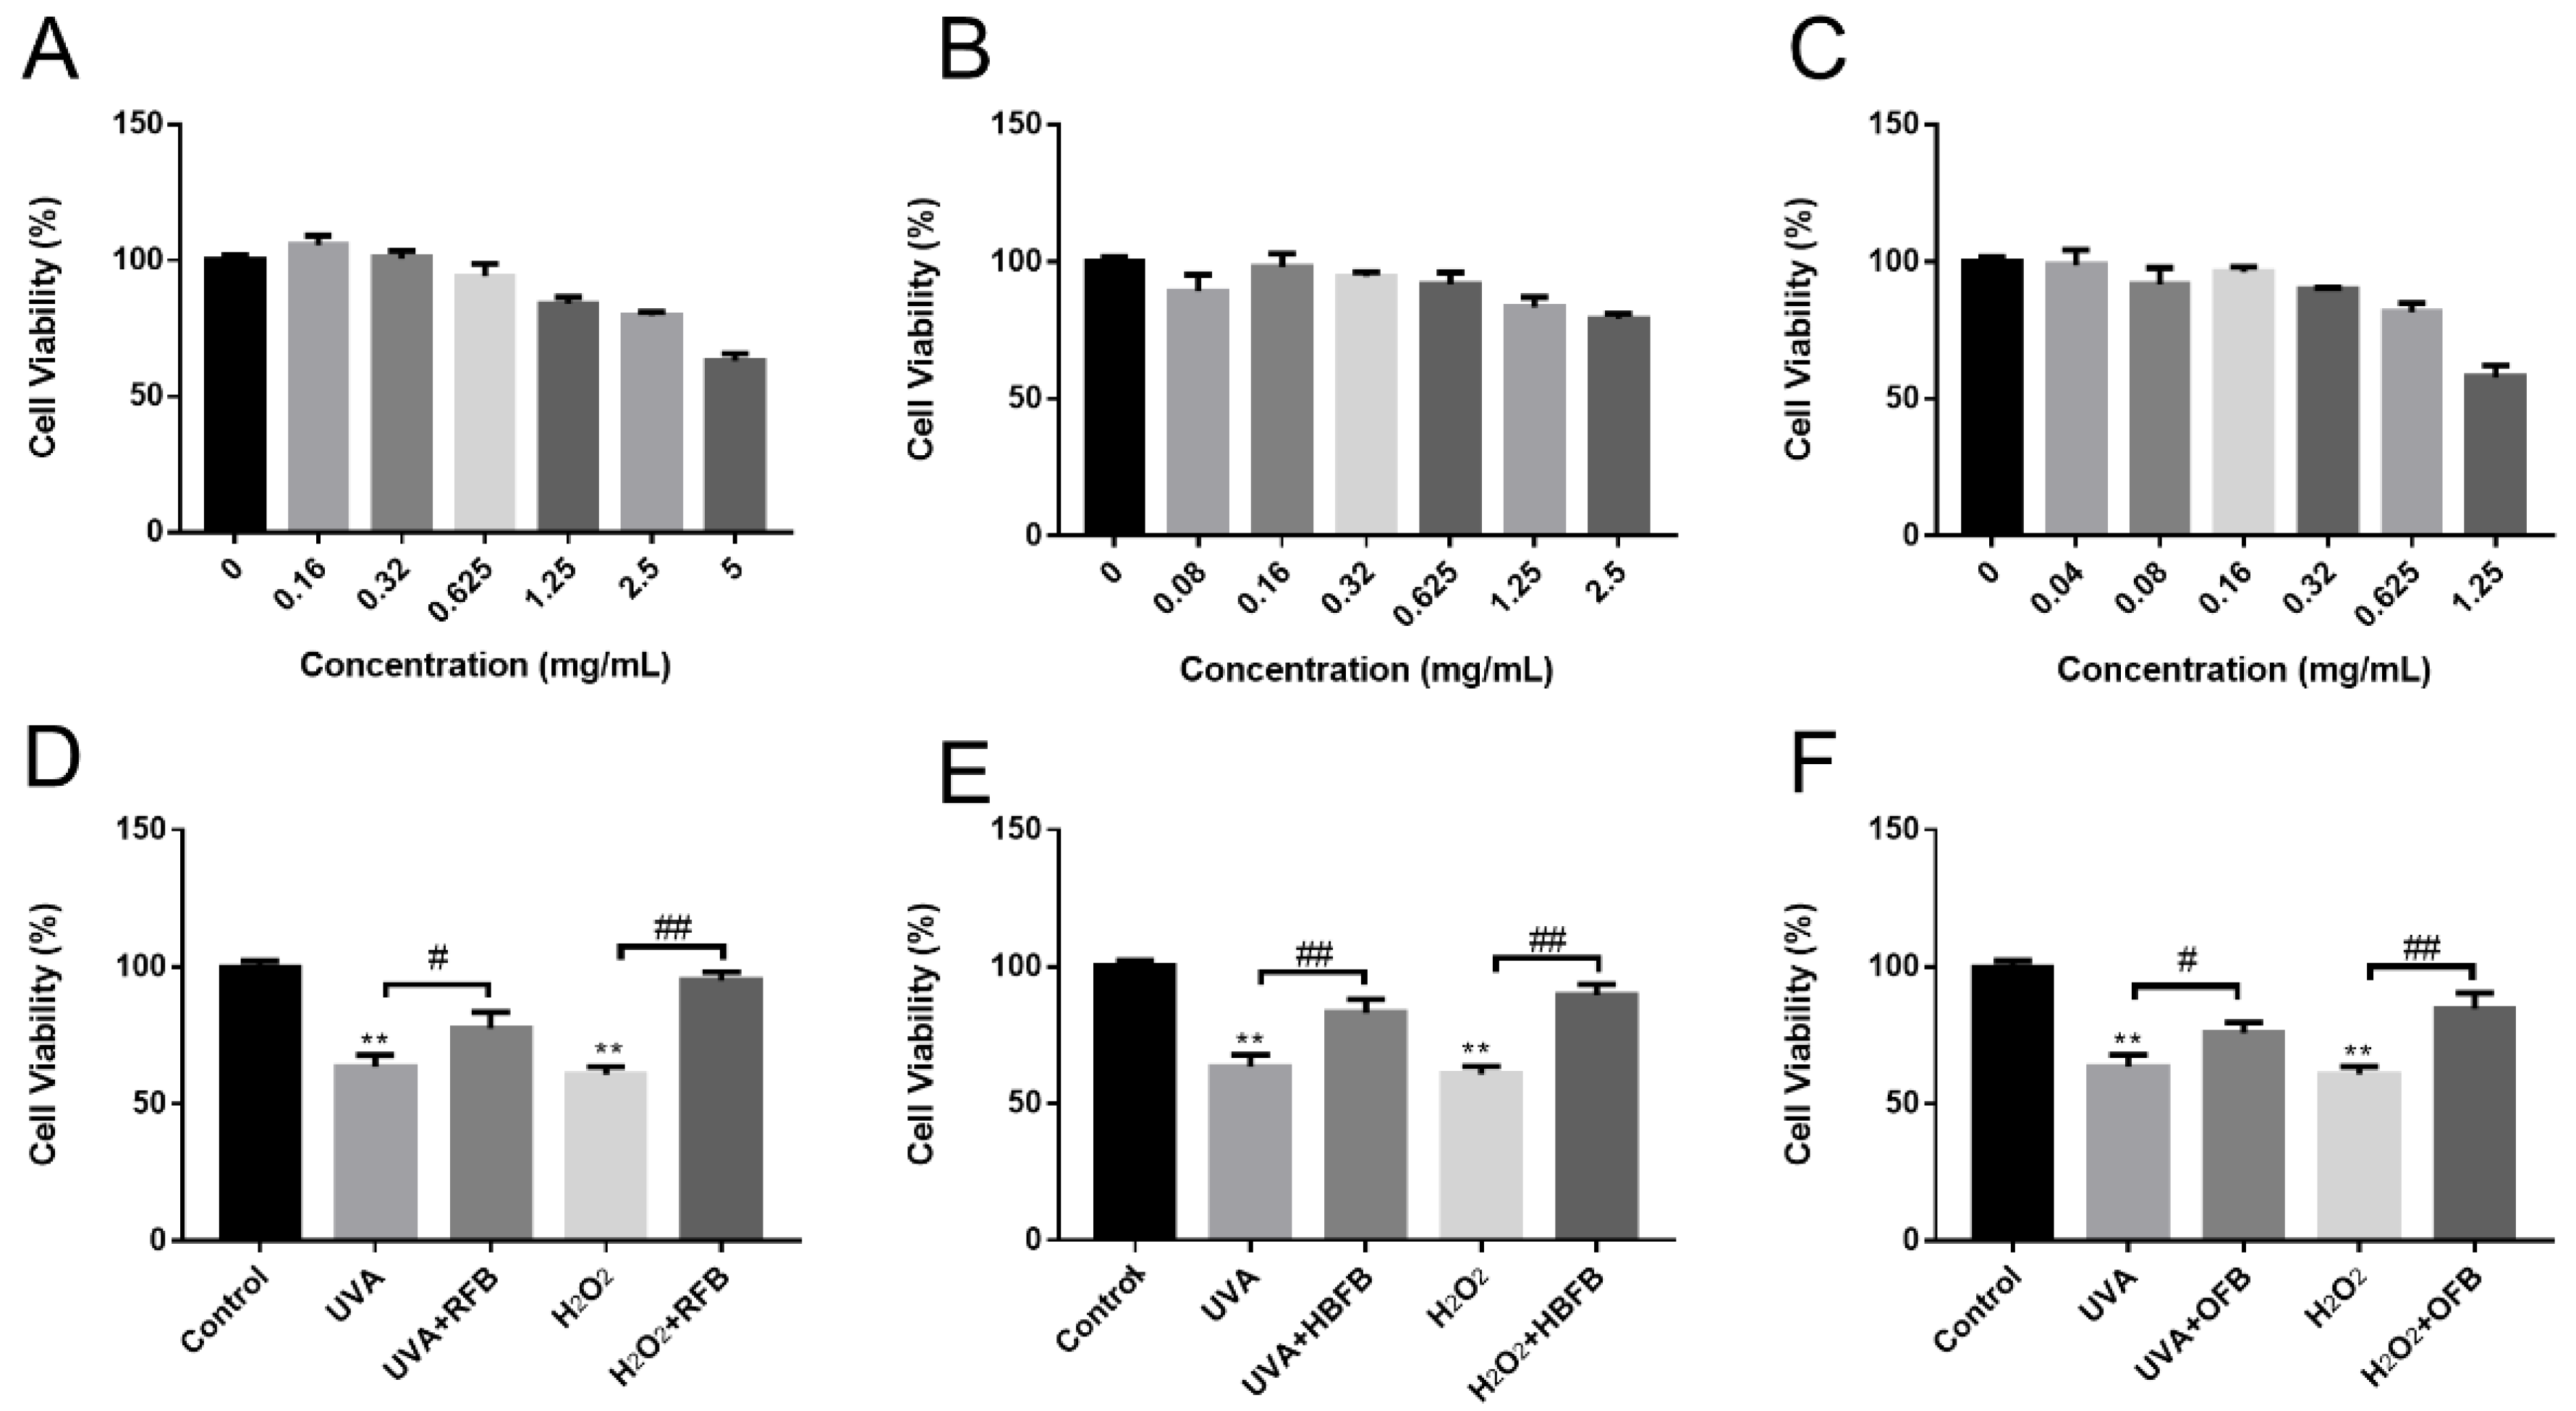
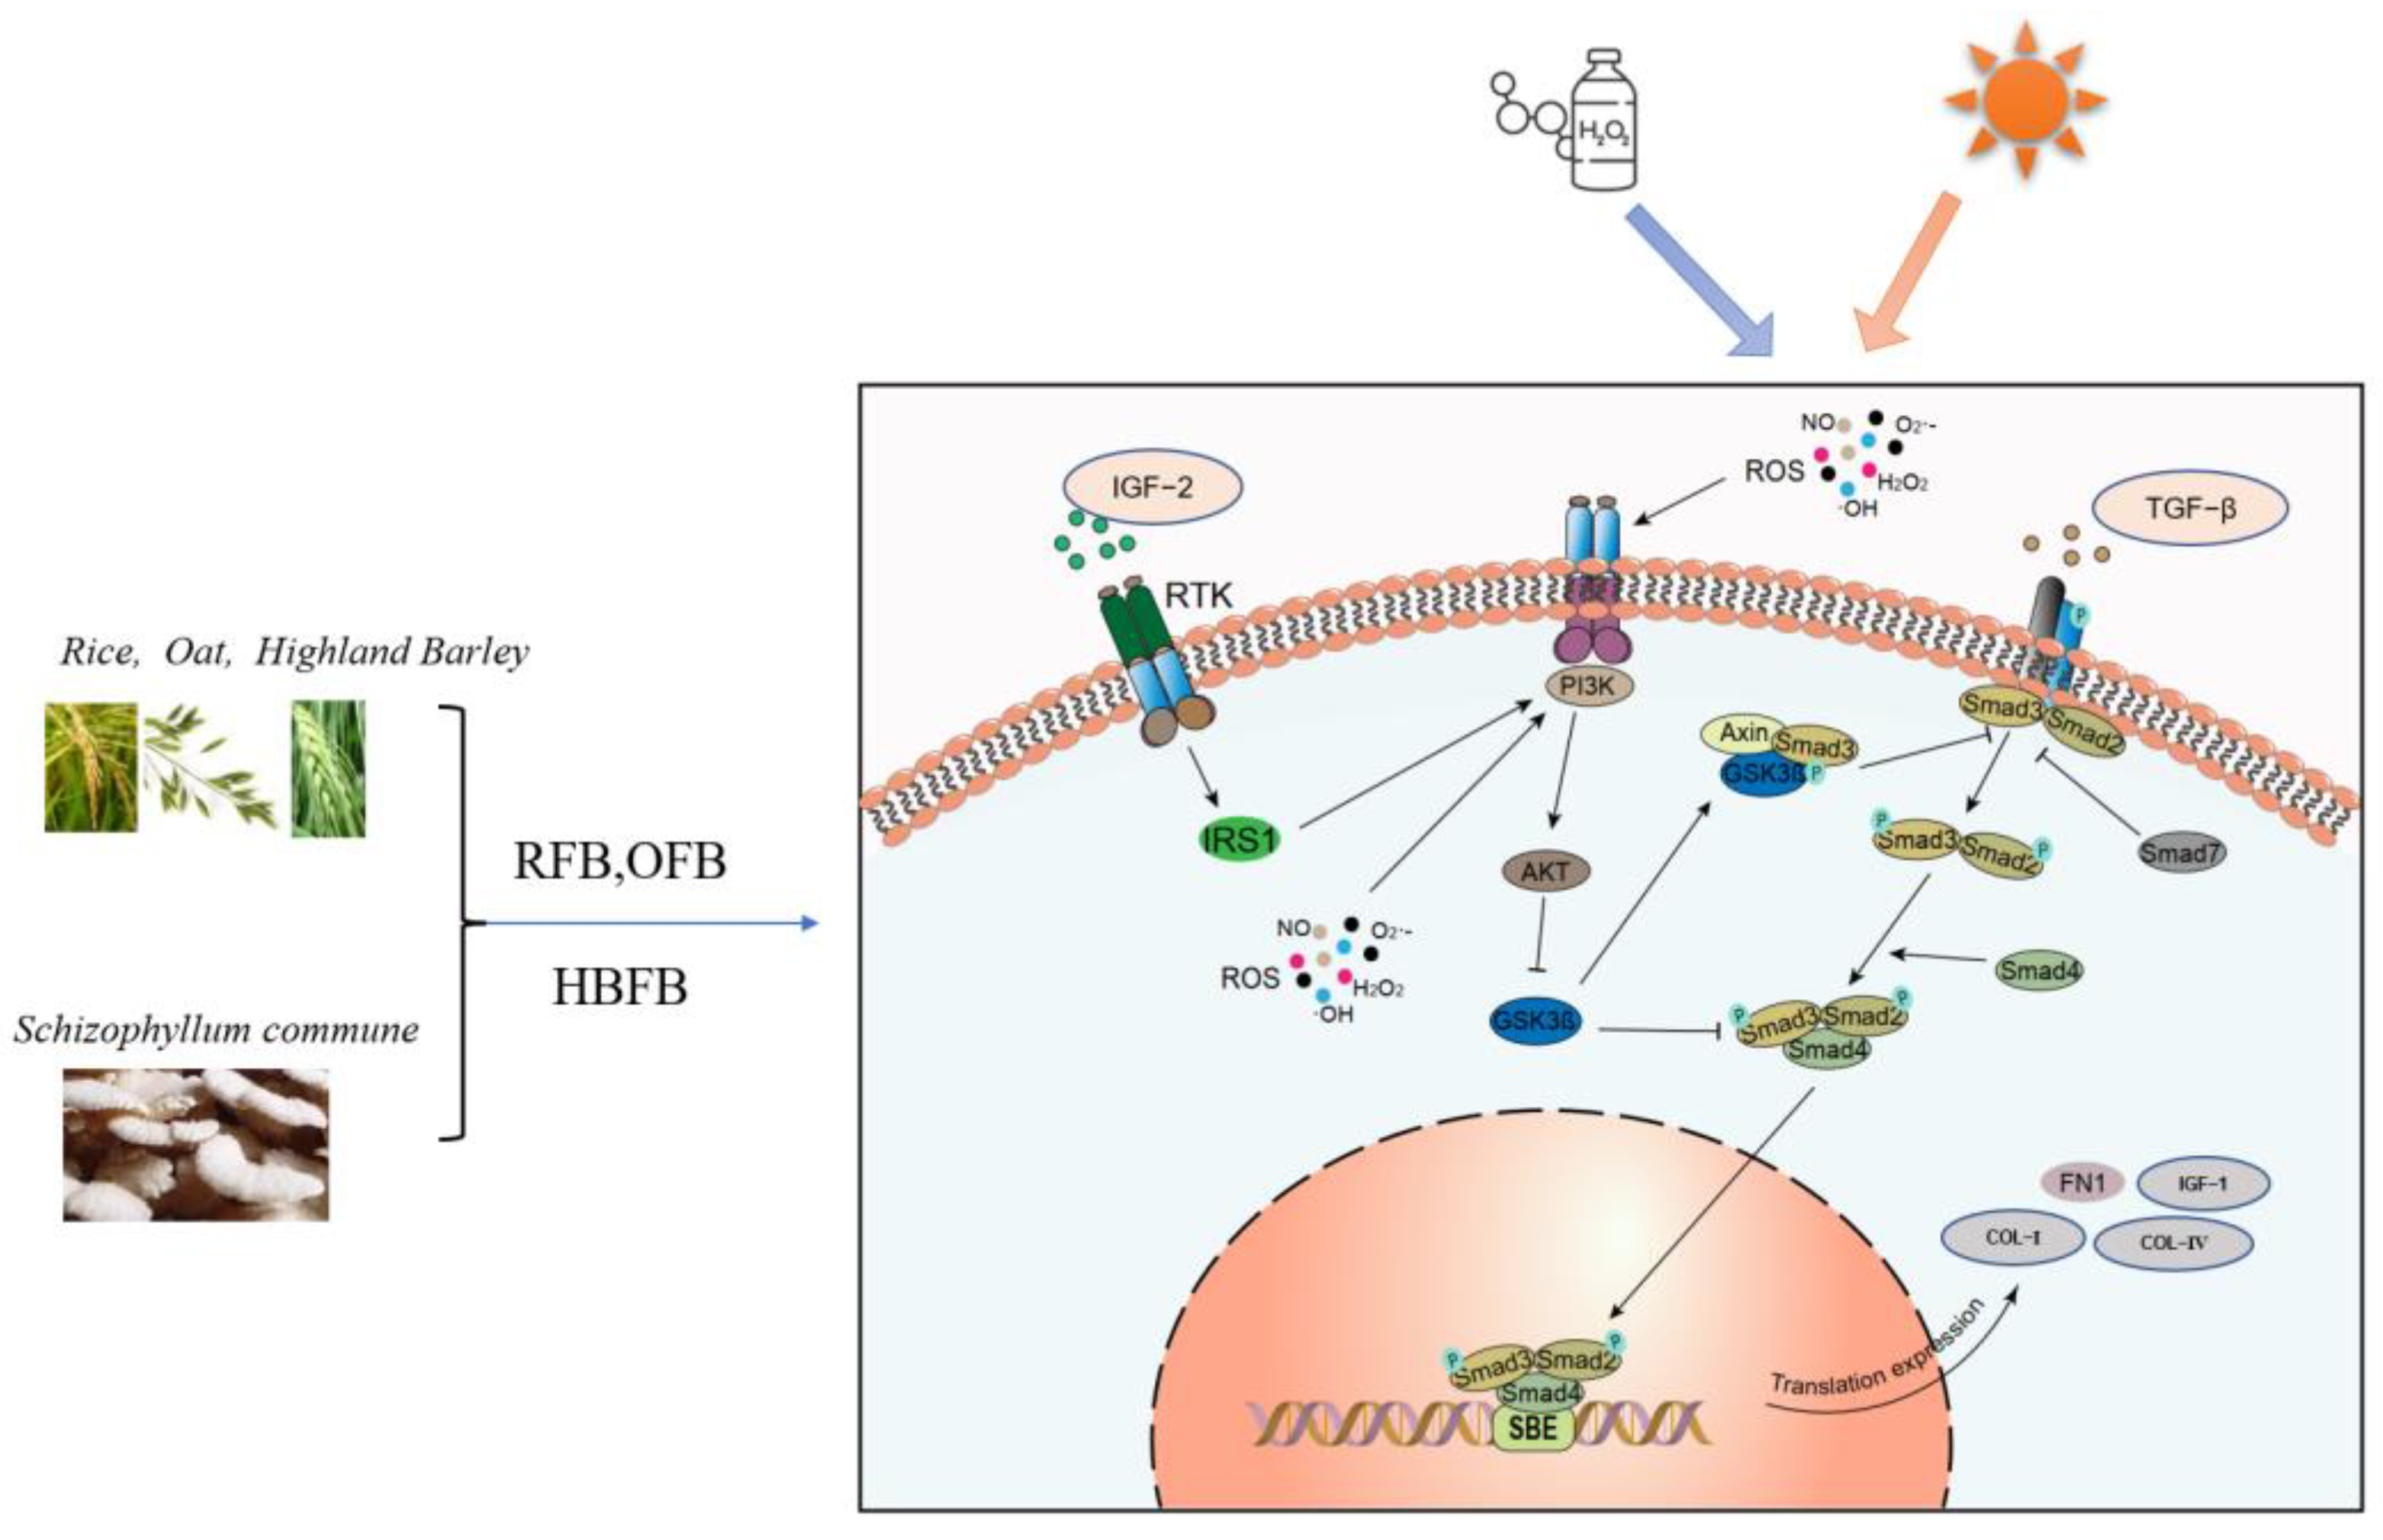
3.4. Composition Analysis and Protective Effects of RFB, HBFB and OFB
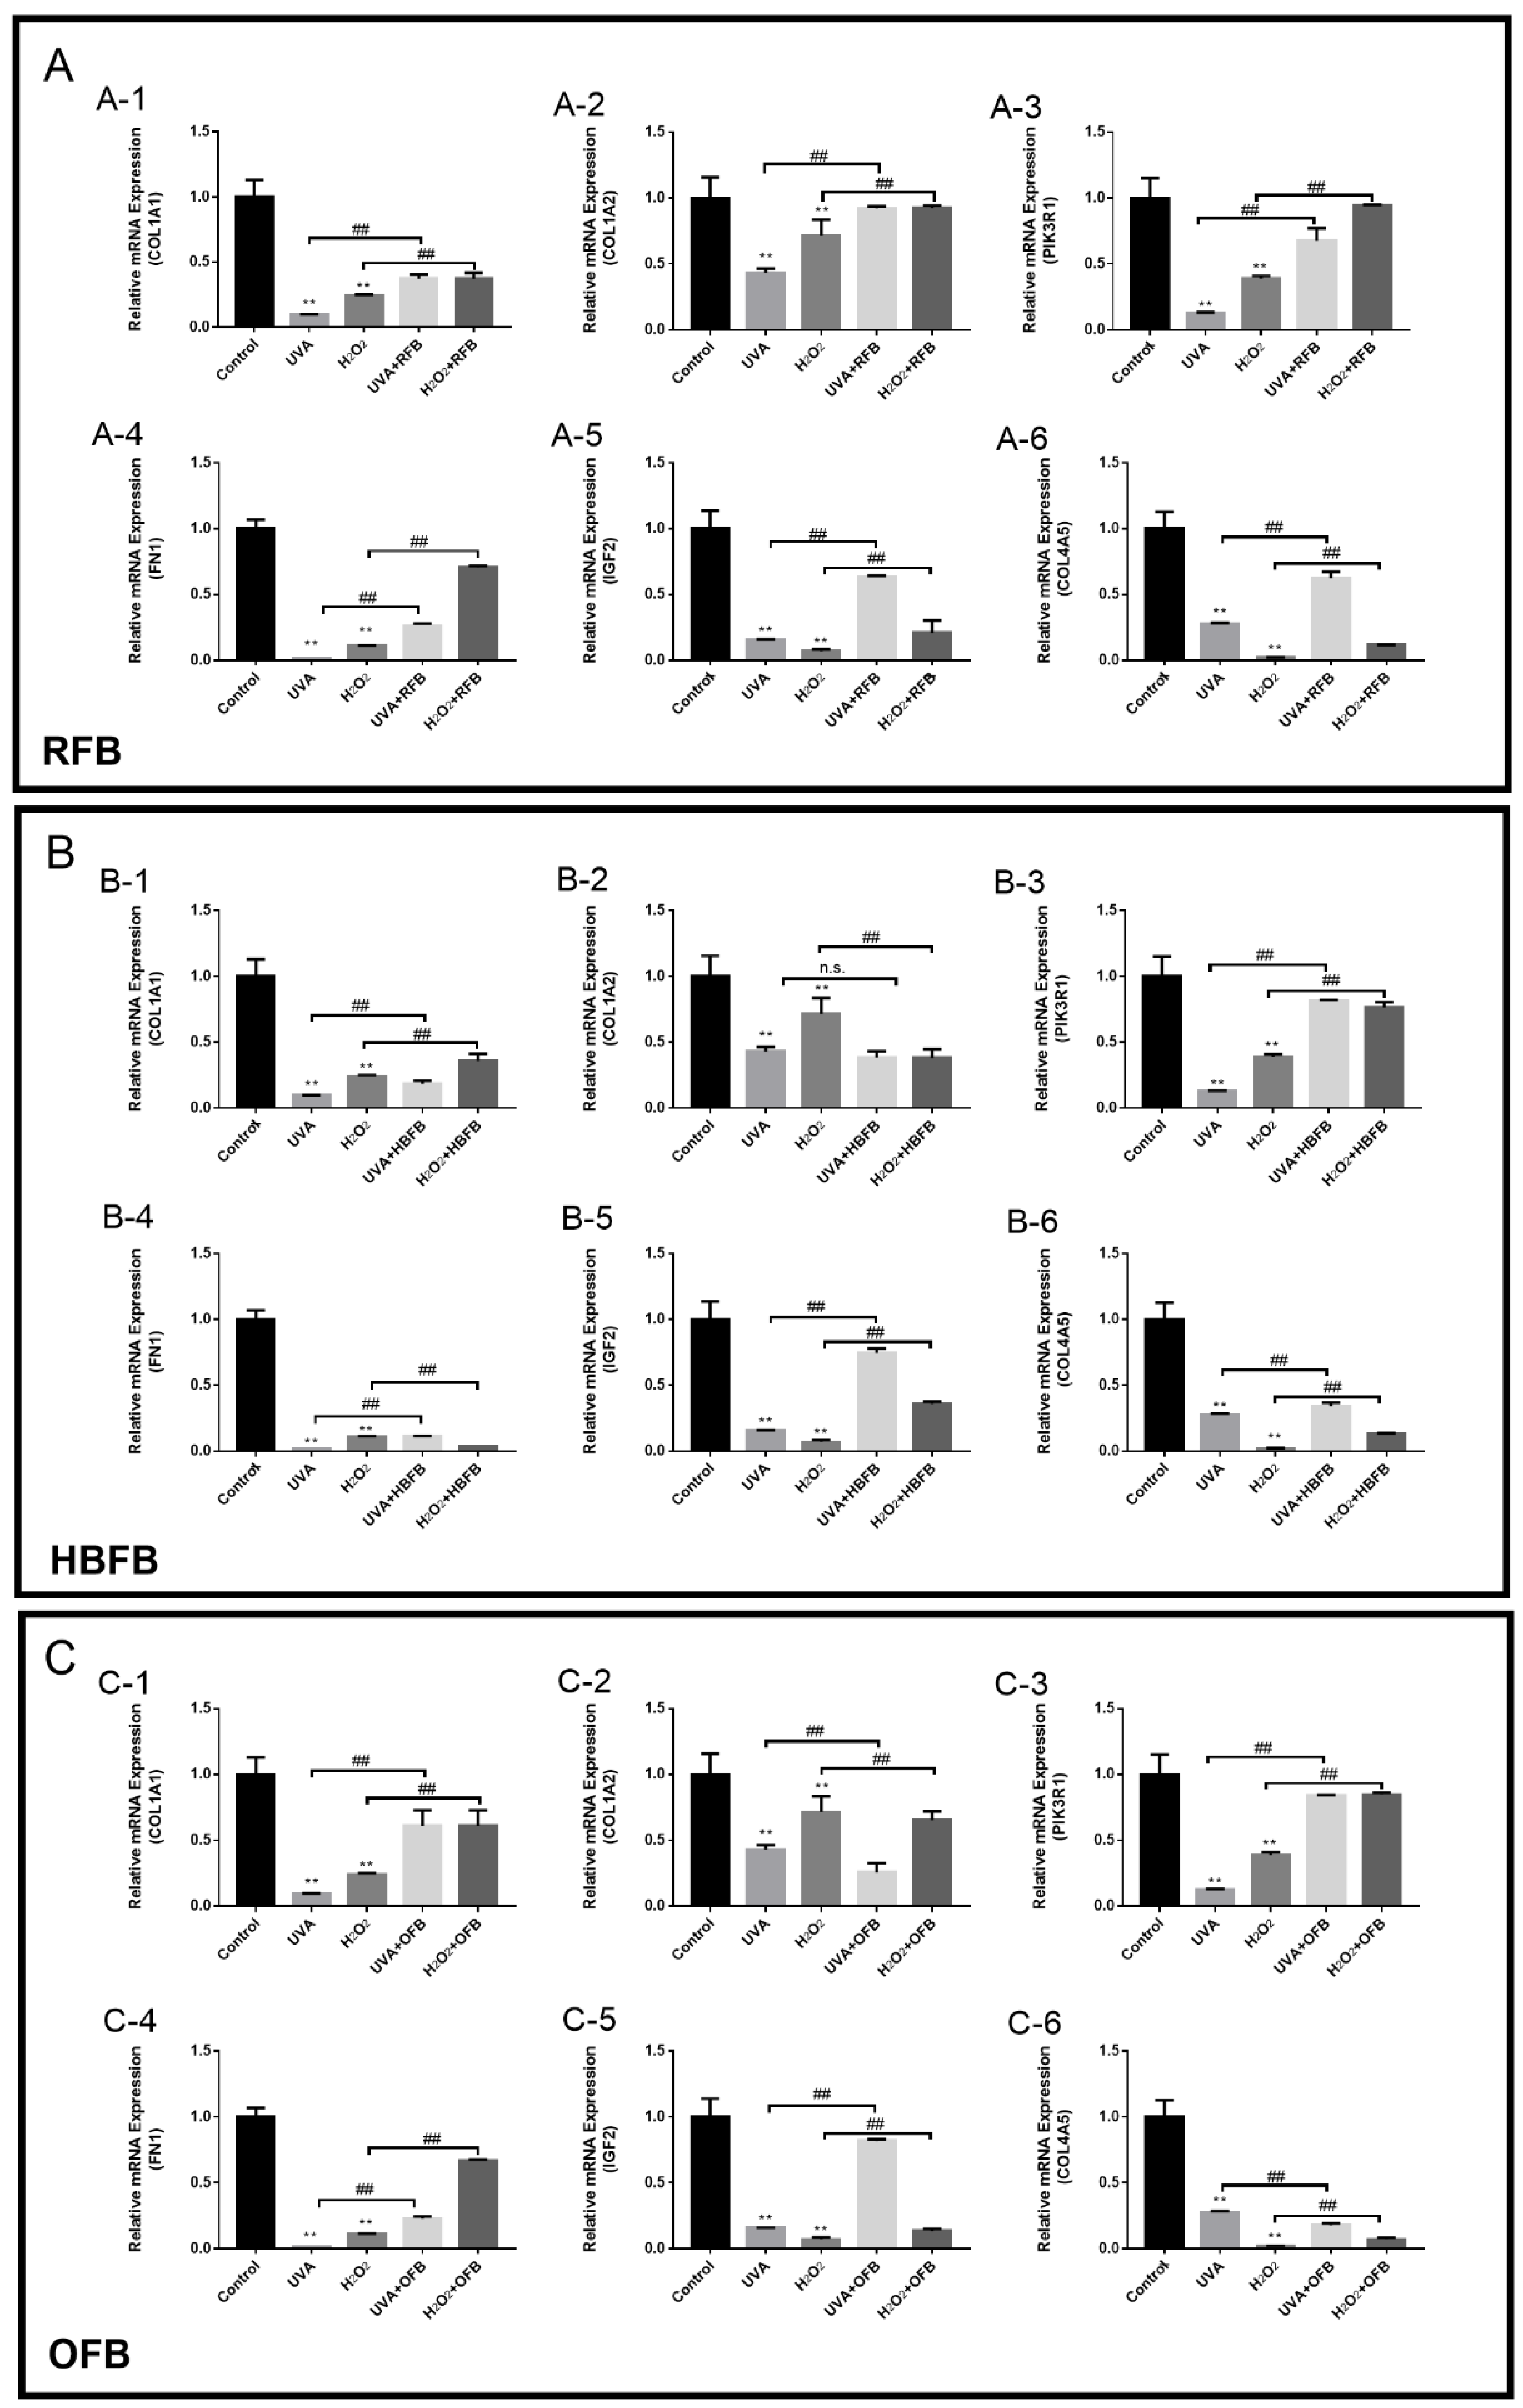
3.5. Validation of Key DEGs by RT-qPCR
4. Discussion
5. Conclusions
Supplementary Materials
Author Contributions
Funding
Data Availability Statement
Acknowledgments
Conflicts of Interest
References
- Pollman, M.J.; Hall, J.L.; Gibbons, G.H. Determinants of vascular smooth muscle cell apoptosis after balloon angioplasty injury. Influence of redox state and cell phenotype. Circ. Res. 1999, 84, 113–121. [Google Scholar] [CrossRef]
- Fu, H.; Zhang, Y.; An, Q.; Wang, D.; You, S.; Zhao, D.; Zhang, J.; Wang, C.; Li, M. Anti-Photoaging effect of rhodiola rosea fermented by lactobacillus plantarum on UVA-damaged fibroblasts. Nutrients 2022, 14, 2324. [Google Scholar] [CrossRef] [PubMed]
- Kang, K.A.; Wang, Z.H.; Zhang, R.; Piao, M.J.; Kim, K.C.; Kang, S.S.; Kim, Y.W.; Lee, J.; Park, D.; Hyun, J.W. Myricetin protects cells against oxidative stress-induced apoptosis via regulation of PI3K/AKT and MAPK Signaling Pathway. Int. J. Mol. Sci. 2010, 11, 4348–4360. [Google Scholar] [CrossRef] [PubMed]
- Morry, J.; Ngamcherdtrakul, W.; Yantasee, W. Oxidative stress in cancer and fibrosis: Opportunity for therapeutic intervention with antioxidant compounds, enzymes, and nanoparticles. Redox Biol. 2017, 11, 240–253. [Google Scholar] [CrossRef]
- Yang, S.S.; Zhou, L.; Nephrology, D.O. Resveratrol inhibits oxidative stress-mediated apoptosis in renal tubular epithelial cells by activating PI3K/AKT pathway. Mod. Chin. Med. 2019, 21, 913–919. [Google Scholar]
- Cheng, W.; An, Q.; Zhang, J.; Shi, X.; Wang, C.; Li, M.; Zhao, D. Protective effect of ectoin on UVA/H2O2-induced oxidative damage in human skin fibroblast cells. Appl. Sci. 2022, 12, 8531. [Google Scholar] [CrossRef]
- Abadie, S.; Bedos, P.; Rouquette, J. A human skin model to evaluate the protective effect of compounds against UVA damage. Int. J. Cosmet. Sci. 2019, 41, 594–603. [Google Scholar] [CrossRef] [PubMed]
- Yaar, M.; Gilchrest, B.A. Photoageing: Mechanism, prevention and therapy. Br. J. Dermatol. 2007, 157, 874–887. [Google Scholar] [CrossRef]
- Chen, T.; Guo, Z.P.; Jiao, X.Y.; Zhang, Y.H.; Li, J.Y.; Liu, H.J. Protective effects of peoniflorin against hydrogen peroxide-induced oxidative stress in human umbilical vein endothelial cells. Can. J. Physiol. Pharmacol. 2011, 89, 445–453. [Google Scholar] [CrossRef]
- Park, K.J.; Kim, Y.J.; Kim, J.; Kim, S.; Lee, S.Y.; Bae, J.W. Protective effects of peroxiredoxin on hydrogen peroxide induced oxidative stress and apoptosis in cardiomyocytes. Korean Circ. J. 2012, 42, 23–32. [Google Scholar] [CrossRef]
- Zhu, L.; Chang, R.Z.; Qiu, L.J. Application of serial analysis of gene expression in the analysis of gene expression in plant. Sci. Agric. Sin. 2003, 36, 1233–1240. [Google Scholar]
- Su, Z.Q.; Fang, H.; Hong, H.X.; Shi, L.M.; Zhang, W.Q.; Zhang, Y.Y. An investigation of biomarkers derived from legacy microarray data for their utility in the RNA-seq era. Genome Biol. 2014, 15, 523. [Google Scholar] [CrossRef] [PubMed] [Green Version]
- Wang, C.B.; Lu, W.H.; Lin, Y.; Luo, J.Z. Development and application of transcriptome sequencing. Environ. Sci. Technol. 2018, 35, 20–26. [Google Scholar]
- Qi, Y.X.; Liu, Y.B.; Rong, W.H. RNA-Seq and its applications: A new technology for transcriptomics. Hereditas 2011, 33, 1191–1202. [Google Scholar] [CrossRef]
- Bhatt, G.; Gupta, A.; Rangan, L.; Limaye, A.M. Global transcriptome analysis reveals partial estrogen-like effects of karanjin in MCF-7 breast cancer cells. Gene 2022, 830, 146507. [Google Scholar] [CrossRef]
- Deng, Y.; Huang, Q.; Hu, L.; Liu, T.; Zheng, B.; Lu, D.; Guo, C.; Zhou, L. Enhanced exopolysaccharide yield and antioxidant activities of Schizophyllum Sommune fermented products by the addition of radix puerariae. RSC Adv. 2021, 11, 38219–38234. [Google Scholar] [CrossRef]
- Caseiro, C.; Ribeiro Dias, J.N.; Godinho de Andrade Fontes, C.M.; Bule, P. From cancer therapy to winemaking: The molecular structure and applications of β-glucans and β-1,3-glucanases. Int. J. Mol. Sci. 2022, 23, 3156. [Google Scholar] [CrossRef]
- Badalyan, S.M.; Barkhudaryan, A.; Rapior, S. Medicinal macrofungi as cosmeceuticals: A review. Int. J. Med. Mushrooms 2022, 24, 1–13. [Google Scholar] [CrossRef]
- Vuong, V.; Muthuramalingam, K.; Singh, V.; Choi, C.; Kim, Y.M.; Unno, T.; Cho, M. Schizophyllum commune-derived β-glucan improves intestinal health demonstrating protective effects against constipation and common metabolic disorders. Appl. Biol. Chem. 2022, 65, 9. [Google Scholar]
- Shen, Y.; Hu, C.; Zhang, H.; Jiang, H. Characteristics of three typical chinese highland barley varieties: Phenolic compounds and antioxidant activities. J. Food Biochem. 2018, 42, e12488. [Google Scholar] [CrossRef]
- Okonogi, S.; Kaewpinta, A.; Junmahasathien, T.; Yotsawimonwat, S. Effect of rice variety and modification on antioxidant and anti-inflammatory activities. Drug Discov. Ther. 2018, 12, 206–213. [Google Scholar] [CrossRef] [PubMed]
- Zhu, Y.; Li, T.; Fu, X.; Brennan, M.; Abbasi, A.M.; Zheng, B.; Liu, R.H. The use of an enzymatic extraction procedure for the enhancement of highland barley (Hordeum vulgare L.) phenolic and antioxidant compounds. Int. J. Food Sci. Tech. 2016, 51, 1916–1924. [Google Scholar] [CrossRef]
- Chang, Y.W.; Alli, I.; Konishi, Y.; Ziomek, E. Characterization of protein fractions from Chickpea (Cicer Arietinum L.) and Oat (Avena Sativa L.) seeds using proteomic techniques. Food Res. Int. 2011, 44, 3094–3104. [Google Scholar] [CrossRef]
- Abd Razak, D.L.; Abd Rashid, N.Y.; Jamaluddin, A.; Sharifudin, S.A.; Long, K. Enhancement of phenolic acid content and antioxidant activity of rice bran fermented with rhizopus oligosporus and monascus purpureus. Biocatal. Agric. Biotechnol. 2015, 4, 33–38. [Google Scholar] [CrossRef]
- Wu, H.; Liu, H.N.; Ma, A.M.; Zhou, J.Z.; Xia, X.D. Synergetic effects of lactobacillus plantarum and rhizopus oryzae on physicochemical, nutritional and antioxidant properties of whole-grain Oats (Avena Sativa L.) during solid-state fermentation. LWT 2022, 154, 112687. [Google Scholar] [CrossRef]
- Deng, Y.; Liu, H.; Huang, Q.; Tu, L.; Hu, L.; Zheng, B.; Sun, H.; Lu, D.; Guo, C.; Zhou, L. Mechanism of longevity extension of caenorhabditis elegans induced by Schizophyllum Commune fermented supernatant with added radix puerariae. Front. Nutr. 2022, 9, 847064. [Google Scholar] [CrossRef]
- Liu, W.; Chen, Y.; Wang, Q. Attenuated and synergistic effects of liquid fermentation polysaccharide of Schizophyllum on tumor-bearing mice treated with chemotherapy. Lishizhen Med. Mater. Med. Res. 2012, 23, 321–322. [Google Scholar]
- Song, Y.R.; Han, A.R.; Park, S.G. Effect of enzyme-assisted extraction on the physicochemical properties and bioactive potential of lotus leaf polysaccharides. Int. J. Biol. Macromol. 2020, 153, 169–179. [Google Scholar] [CrossRef]
- You, C.H.; Heng, W.L.; Mallikarjuna, K. Dermato-protective properties of ergothioneine through induction of Nrf2/ARE-mediated antioxidant genes in UVA-irradiated Human keratinocytes. Free Radical Bio. Med. 2015, 86, 102–117. [Google Scholar]
- Li, Q.; Bai, D.; Qin, L.; Shao, M.; Zhang, S.; Yan, C.; Yu, G.; Hao, J. Protective effect of D-tetramannuronic acid tetrasodium salt on UVA-induced photo-aging in HaCaT cells. Biomed. Pharmacother. 2020, 126, 110094. [Google Scholar] [CrossRef]
- Livak, K.J.; Schmittgen, T.D. Analysis of relative gene expression data using real-time quantitative PCR and the 2 (-Delta C(T)) Method. Methods 2001, 25, 402–408. [Google Scholar] [CrossRef] [PubMed]
- Reiter, R.J.; Tan, D.X.; Rosales-Corral, S.; Galano, A.; Zhou, X.J.; Xu, B. Mitochondria: Central Organelles for Melatonin’s Antioxidant and Anti-Aging Actions. Molecules 2018, 23, 509. [Google Scholar] [CrossRef] [PubMed]
- Sun, Q.; Fang, J.; Wang, Z.; Song, Z.; Geng, J.; Wang, D.; Wang, C.; Li, M. Two Laminaria japonica Fermentation Broths Alleviate Oxidative Stress and Inflammatory Response Caused by UVB Damage: Photoprotective and Reparative Effects. Mar. Drugs 2022, 20, 650. [Google Scholar] [CrossRef] [PubMed]
- Schieber, M.; Chandel, N.S. ROS Function in Redox Signaling and Oxidative Stress. Curr. Biol. 2014, 24, R453–R462. [Google Scholar] [CrossRef]
- Kim, J.W.; Jo, E.H.; Moon, J.E.; Cha, H.; Chang, M.H.; Cho, H.T. In vitro and in vivo inhibitory effect of citrus junos tanaka peel extract against oxidative stress-induced apoptotic death of Lung cells. Antioxidants 2020, 9, 1231. [Google Scholar] [CrossRef]
- Zhou, F.; Huang, X.; Pan, Y.; Cao, D.; Liu, C.; Liu, Y.; Chen, A. Resveratrol protects HaCaT cells from ultraviolet B-induced photoaging via upregulation of HSP27 and modulation of mitochondrial caspase-dependent apoptotic pathway. Biochem. Biophys. Res. Commun. 2018, 499, 662–668. [Google Scholar] [CrossRef]
- Sies, H. Role of metabolic H2O2 generation: Redox signaling and oxidative stress. J. Biol. Chem. 2014, 289, 8735–8741. [Google Scholar] [CrossRef]
- Feehan, R.P.; Coleman, C.S.; Ebanks, S.; Lang, C.H.; Shantz, L.M. REDD1 interacts with AIF and regulates mitochondrial reactive oxygen species generation in the keratinocyte response to UVB. Biochem. Bioph. Res. Commun. 2022, 616, 56–62. [Google Scholar] [CrossRef]
- Baumann, L. Skin ageing and its treatment. J. Pathol. 2007, 211, 241–251. [Google Scholar] [CrossRef]
- Su, Y.; Zhang, Y.; Fu, H.; Yao, F.; Liu, P.; Mo, Q.; Wang, D.; Zhao, D.; Wang, C.; Li, M. Physicochemical and anti-UVB-induced skin inflammatory properties of Lacticaseibacillus paracasei Subsp. paracasei SS-01 strain exopolysaccharide. Fermentation 2022, 8, 198. [Google Scholar]
- Alafiatayo, A.A.; Lai, K.S.; Ahmad, S.; Mahmood, M.; Shaharuddin, N.A. RNA-seq analysis revealed genes associated with UV-induced cell necrosis through MAPK/TNF-α pathways in human dermal fibroblast cells as an inducer of premature photoaging. Genomics 2020, 112, 484–493. [Google Scholar] [CrossRef] [PubMed]
- Zheng, Y.; Xu, Q.; Chen, H. Transcriptome analysis of ultraviolet A-induced photoaging cells with deep sequencing. J. Dermatol. 2018, 45, 175–181. [Google Scholar] [CrossRef] [PubMed]
- Barandalla, M.; Shi, H.; Xiao, H.; Colleoni, S.; Galli, C.; Lio, P.; Trotter, M.; Lazzari, G. Global gene expression profiling and senescence biomarker analysis of hESC exposed to H2O2 induced non-cytotoxic oxidative stress. Stem Cell Res. Ther. 2017, 8, 160. [Google Scholar] [CrossRef] [PubMed]
- Yang, M.; Song, Y.; Zhang, H.; Ji, J.; Yang, J. IL-17 inhibits apoptosis of Hep-2 cells by regulating PI3K/AKT/FAS/FASL signaling pathway. Acta Univ. Med. Anhui 2018, 53, 1681–1684. [Google Scholar]
- Zha, L.; He, L.; Liang, Y.; Qin, H.; Yu, B.; Chang, L.; Xue, L. TNF-Alpha Contributes to Postmenopausal Osteoporosis by Synergistically Promoting RANKL-Induced Osteoclast Formation. Biomed. Pharmacother. 2018, 102, 369–374. [Google Scholar] [CrossRef] [PubMed]
- Zou, Z.R.; Long, X.; Zhao, Q.; Zheng, Y.D.; Song, M.S.; Ma, S. A Single-Cell Transcriptomic Atlas of Human Skin Aging. Dev. Cell 2020, 3, 383. [Google Scholar] [CrossRef]
- Hao, D.; Wen, X.; Liu, L.; Wang, L.; Zhou, X.; Li, Y. Sanshool improves UVB-induced skin photodamage by targeting JAK2/STAT3-dependent autophagy. Cell Death Dis. 2019, 10, 485–494. [Google Scholar] [CrossRef]
- Ma, C.; Jia, X. Research progress on the role of extracellular matrix in skin cryopreservation. Acad. J. PLA Postgrad. Med. Sch. 2006, 27, 398–400. [Google Scholar]
- Miller, L.S.; Cho, J.S. Immunity against staphylococcus aureus cutaneous infections. Nat. Rev. Immunol. 2011, 11, 505–518. [Google Scholar] [CrossRef] [Green Version]
- Sun, Y.; Zhang, J.; Zhou, Z.; Wu, P.; Huo, R.; Wang, B.; Shen, Z.; Li, H.; Zhai, T.; Shen, B.; et al. CCN1, a pro-inflammatory factor, aggravates psoriasis skin lesions by promoting keratinocyte activation. J. Investig. Dermatol. 2015, 135, 2666–2675. [Google Scholar] [CrossRef]
- Kalutharage, N.K.; Rathnasinghe, D.L. A Study of Chitosan and Glucosamine Isolated from Sri Lankan Local Mushroom Schizophyllum Commune and Oyster Mushroom (Pleurotus Ostreatus). Mater. Today Proc. 2020, 23, 119–122. [Google Scholar] [CrossRef]
- Kumar, A.; Bharti, A.K.; Bezie, Y. Schizophyllum Commune: A Fungal Cell-Factory for Production of Valuable Metabolites and Enzymes. Bioresources 2022, 17, 5420–5436. [Google Scholar] [CrossRef]
- Patel, S.; Goyal, A. Recent developments in mushrooms as anti-cancer therapeutics: A review. 3 Biotech 2011, 2, 1–15. [Google Scholar] [CrossRef] [PubMed]
- Chen, Z.; Yin, C.; Fan, X.; Ma, K.; Yao, F.; Zhou, R.; Shi, D.; Cheng, W.; Gao, H. Characterization of physicochemical and biological properties of Schizophyllum Commune polysaccharide extracted with different methods. Int. J. Biol. Macromol. 2020, 156, 1425–1434. [Google Scholar] [CrossRef]
- Meade, B.; Thome, K. International Food Security Assessment, 2017–2027; U.S. Department of Agriculture: Washington, DC, USA, 2017; pp. 26–37. [Google Scholar]
- Zhang, F.; Jiang, G.; Li, W.; Qin, S.; Li, H.; Gao, Z.; Cai, G.; Lin, T. MaxENT modeling for predicting the spatial distribution of three reptors in the Sanjiangyuan National Park. China Ecol. Evol. 2019, 9, 6643–6654. [Google Scholar] [CrossRef]
- Zhang, T.; Wang, Q.; Li, J.; Zhao, S.; Qie, M.; Wu, X.; Bai, Y.; Zhao, Y. Study on the origin traceability of tibet highland barley (Hordeum Vulgare L.) based on its nutrients and mineral elements. Food Chem. 2021, 346, 128928. [Google Scholar] [CrossRef]
- Obadi, M.; Sun, J.; Xu, B. Highland barley: Chemical composition, bioactive compounds, health effects, and applications. Food Res. Int. 2021, 140, 110065. [Google Scholar] [CrossRef] [PubMed]
- Ren, C.; Yan, J.; Dong, R.; Hu, X. Research progress on oat nutrients, functional properties and related products. Sci. Technol. Food Ind. 2022, 5, 1–14. [Google Scholar]
- Yang, C.; Chen, M.; Dai, T.; Chen, J. Research advances in functional properties and application of Oat β-glucan. J. Chin. Inst. Food Sci. Technol. 2021, 6, 301–311. [Google Scholar]


| Term | Sample | Raw Reads | Clean Reads | Total Reads | Multiple Mapped | Uniquely Mapped |
|---|---|---|---|---|---|---|
| H2O2 | control1 | 52,006,260 | 51,489,806 | 51,489,806 | 1,585,446 (3.08%) | 48,550,893 (94.29%) |
| control2 | 51,434,366 | 51,007,382 | 51,007,382 | 1,656,100 (3.25%) | 48,073,211(94.25%) | |
| contro13 | 47,992,480 | 47,570,278 | 47,570,278 | 1,767,599 (3.72%) | 44,528,485 (93.61%) | |
| model1 | 42,375,544 | 41,851,304 | 41,851,304 | 2,523,225 (6.03%) | 37,561,116 (89.75%) | |
| model2 | 55,834,672 | 55,256,324 | 55,256,324 | 1,946,513 (3.52%) | 51,879,913 (93.89%) | |
| model3 | 53,168,944 | 52,654,864 | 52,654,864 | 1,852,768 (3.52%) | 49,508,846 (94.03%) | |
| UVA | control1 | 203,492,014 | 201,140,460 | 201,140,460 | 9,220,602 (4.58%) | 108,745,918 (54.06%) |
| control2 | 214,473,458 | 212,140,016 | 212,140,016 | 10,108,543 (4.77%) | 114,327,168 (53.89%) | |
| control3 | 201,264,476 | 199,240,206 | 199,240,206 | 8,290,552 (4.16%) | 103,655,047 (52.03%) | |
| model1 | 183,171,608 | 180,873,264 | 180,873,264 | 10,508,759 (5.81%) | 117542871 (64.99%) | |
| model2 | 219,499,948 | 216,959,018 | 216,959,018 | 12,593,146 (5.8%) | 137,233,440 (63.25%) | |
| model3 | 207,223,010 | 204,370,646 | 204,370,646 | 12,256,006 (6.0%) | 131,192,428 (64.19%) |
| Gene | Direction | Primer Pair Sequence (5′→3′) |
|---|---|---|
| GAPDH | F | TCAGACACCATGGGGAAGGT |
| R | TCCCGTTCTCAGCCATGTAG | |
| COL4A5 | F | CAAGGTCTACCAGGTCCAGAA |
| R | TCATTCCATTGAGACCCGGC | |
| FN1 | F | CCCAATTGAGTGCTTCATGCC |
| R | CCTCCAGAGCAAAGGGCTTA | |
| IGF2 | F | TCCTGTGAAAGAGACTTCCAG |
| R | GTCTCACTGGGGCGGTAAG | |
| COL1A1 | F | GAGGGCCAAGACGAAGACATC |
| R | CAGATCACGTCATCGCACAAC | |
| COL1A2 | F | GTTGCTGCTTGCAGTAACCTT |
| R | AGGGCCAAGTCCAACTCCTT | |
| PIK3R1 | F | ACCACTACCGGAATGAATCTCT |
| R | GGGATGTGCGGGTATATTCTTC |
| Gene_Id | Gene Name | Gene Description | Log2FC | P-Adjust | Function |
|---|---|---|---|---|---|
| ENSG00000187961 | KLHL17 | kelch like family member 17 | 0.457 | 8.97 × 10⁻⁵ | Cytoskeleton organization |
| ENSG00000125817 | CENPB | centromere protein B | 0.342 | 1.87 × 10⁻¹⁰ | Cytoskeleton organization |
| ENSG00000011426 | ANLN | anillin actin binding protein | −0.299 | 3.31 × 10⁻² | Cytoskeleton organization |
| ENSG00000123384 | LRP1 | LDL receptor related protein 1 | −0.435 | 2.99 × 10⁻¹⁶ | Cytoskeleton organization |
| ENSG00000288380 | CRIPAK | cysteine rich PAK1 inhibitor | −0.401 | 1.97 × 10⁻² | Cytoskeleton organization |
| ENSG00000275993 | SIK1B | salt inducible kinase 1B (putative) | −2.211 | 1.70 × 10⁻²² | Cytoskeleton organization |
| ENSG00000147202 | DIAPH2 | diaphanous related formin 2 | −0.334 | 1.34 × 10⁻⁸ | Cytoskeleton organization |
| ENSG00000160551 | TAOK1 | TAO kinase 1 | −0.264 | 4.71 × 10⁻⁹ | Cytoskeleton organization |
| ENSG00000075826 | SEC31B | SEC31 homolog B, COPII coat complex component | 0.370 | 6.71 × 10⁻⁵ | Transport |
| ENSG00000137700 | SLC37A4 | solute carrier family 37 member 4 | 0.485 | 1.26 × 10⁻³ | Transport |
| ENSG00000225697 | SLC26A6 | solute carrier family 26 member 6 | 0.448 | 3.28 × 10⁻¹² | Transport |
| ENSG00000155287 | SLC25A28 | solute carrier family 25 member28 | 0.403 | 3.14 × 10⁻⁶ | Transport |
| ENSG00000153291 | SLC25A27 | solute carrier family 25 member 27 | 0.278 | 6.30 × 10⁻⁴ | Transport |
| ENSG00000213901 | SLC23A3 | solute carrier family 23 member 3 | 0.340 | 3.43 × 10⁻² | Transport |
| ENSG00000197208 | SLC22A4 | solute carrier family 22 member4 | 0.292 | 2.76 × 10⁻⁵ | Transport |
| ENSG00000101194 | SLC17A9 | solute carrier family 17 member 9 | 0.421 | 2.03 × 10⁻⁵ | Transport |
| ENSG00000105643 | ARRDC2 | arrestin domain containing 2 | 0.276 | 4.49 × 10⁻² | Transport |
| ENSG00000205593 | DENND6B | DENN domain containing 6B | 0.293 | 4.04 × 10⁻² | Transport |
| ENSG00000157514 | TSC22D3 | TSC22 domain family member 3 | 0.285 | 7.88 × 10⁻⁴ | Transport |
| ENSG00000140104 | CLBA1 | clathrin binding box of aftiphilin containing 1 | 0.328 | 2.62 × 10⁻² | Transport |
| ENSG00000106266 | SNX8 | sorting nexin 8 | 0.294 | 2.33 × 10⁻⁴ | Transport |
| ENSG00000274512 | TBC1D3L | TBC1 domain family member 3L | 0.377 | 2.85 × 10⁻³ | Transport |
| ENSG00000104886 | PLEKHJ1 | pleckstrin homology domain containing J1 | 0.311 | 9.15 × 10⁻³ | Transport |
| ENSG00000177096 | PHETA2 | PH domain containing endocytic trafficking adaptor 2 | 0.305 | 1.35 × 10⁻² | Transport |
| ENSG00000257390 | AC023055.1 | novel protein | 0.467 | 1.20 × 10⁻³ | Transport |
| ENSG00000254852 | NPIPA2 | nuclear pore complex interacting protein family member A2 | 0.279 | 4.98 × 10⁻³ | Transport |
| ENSG00000095066 | HOOK2 | hook microtubule tethering protein 2 | 0.297 | 1.92 × 10⁻² | Transport |
| ENSG00000101199 | ARFGAP1 | ADP ribosylation factor GTPase activating protein 1 | 0.280 | 9.43 × 10⁻⁷ | Transport |
| ENSG00000213983 | AP1G2 | adaptor related protein complex 1 subunit gamma 2 | 0.318 | 1.78 × 10⁻² | Transport |
| ENSG00000181404 | WASHC1 | WASH complex subunit 1 | 0.450 | 6.60 × 10⁻¹⁸ | Transport |
| ENSG00000139190 | VAMP1 | vesicle associated membrane protein 1 | 0.601 | 5.83 × 10⁻⁶ | Transport |
| ENSG00000162341 | TPCN2 | two pore segment channel 2 | 0.292 | 1.43 × 10⁻² | Transport |
| ENSG00000114268 | PFKFB4 | 6-phosphofructo-2-kinase/fructose-2,6-biphosphatase 4 | 0.632 | 1.33 × 10⁻³ | Transport |
| ENSG00000196655 | TRAPPC4 | trafficking protein particle complex 4 | 0.275 | 4.52 × 10⁻² | Transport |
| ENSG00000102287 | GABRE | gamma-aminobutyric acid type A receptor epsilon subunit | 0.317 | 4.13 × 10⁻⁴ | Transport |
| ENSG00000225663 | MCRIP1 | MAPK regulated corepressor interacting protein 1 | 0.270 | 4.63 × 10⁻³ | Transport |
| ENSG00000081692 | JMJD4 | jumonji domain containing 4 | 0.353 | 2.60 × 10⁻² | Transport |
| ENSG00000168026 | TTC21A | tetratricopeptide repeat domain 21A | 0.383 | 4.65 × 10⁻² | Transport |
| ENSG00000108932 | SLC16A6 | solute carrier family 16 member 6 | −0.416 | 1.95 × 10⁻⁴ | Transport |
| ENSG00000117479 | SLC19A2 | solute carrier family 19 member 2 | −1.360 | 6.72 × 10−42 | Transport |
| ENSG00000140199 | SLC12A6 | solute carrier family 12 member6 | −0.279 | 2.21 × 10⁻⁵ | Transport |
| ENSG00000171488 | LRRC8C | leucine rich repeat containing 8 VRAC subunit C | −0.269 | 2.37 × 10⁻² | Transport |
| ENSG00000169446 | MMGT1 | membrane magnesium transporter 1 | −0.306 | 4.40 × 10⁻⁴ | Transport |
| ENSG00000228253 | MT-ATP8 | mitochondrially encoded ATP synthase membrane subunit 8 | −0.567 | 6.75 × 10⁻⁴ | Transport |
| ENSG00000198899 | MT-ATP6 | mitochondrially encoded ATP synthase membrane subunit 6 | −0.457 | 2.44 × 10⁻³ | Transport |
| ENSG00000165714 | BORCS5 | BLOC-1 related complex subunit 5 | −0.285 | 4.97 × 10⁻³ | Transport |
| ENSG00000181333 | HEPHL1 | hephaestin like 1 | −0.285 | 3.27 × 10⁻³ | Transport |
| ENSG00000107771 | CCSER2 | coiled-coil serine rich protein 2 | −0.272 | 1.36 × 10⁻⁶ | Transport |
| ENSG00000115657 | ABCB6 | ATP binding cassette subfamily B member 6 (Langereis blood group) | 0.303 | 7.37 × 10⁻⁴ | Cellular and extracellular matrix |
| ENSG00000117425 | PTCH2 | patched 2 | 0.285 | 1.16 × 10⁻² | Cellular and extracellular matrix |
| ENSG00000125551 | PLGLB2 | plasminogen like B2 | 0.383 | 1.82 × 10⁻² | Cellular and extracellular matrix |
| ENSG00000164877 | MICALL2 | MICAL like 2 | 0.285 | 9.72 × 10⁻³ | Cellular and extracellular matrix |
| ENSG00000156535 | CD109 | CD109 molecule | −0.399 | 1.50 × 10⁻²⁵ | Cellular and extracellular matrix |
| ENSG00000185022 | MAFF | MAF bZIP transcription factor F | −0.968 | 5.78 × 10−80 | Cellular and extracellular matrix |
| ENSG00000166147 | FBN1 | fibrillin 1 | −0.421 | 4.89 × 10⁻³⁰ | Cellular and extracellular matrix |
| ENSG00000165240 | ATP7A | ATPase copper transporting alpha | −0.277 | 2.43 × 10⁻⁴ | Cellular and extracellular matrix |
| ENSG00000142871 | CCN1 | cellular communication network factor 1 | −0.410 | 4.51 × 10⁻²⁵ | Cellular and extracellular matrix |
| ENSG00000038427 | VCAN | versican | −0.492 | 2.64 × 10⁻¹³ | Cellular and extracellular matrix |
| ENSG00000116962 | NID1 | nidogen 1 | −0.356 | 1.04 × 10⁻²¹ | Cellular and extracellular matrix |
| ENSG00000187955 | COL14A1 | collagen type XIV alpha 1 chain | −0.303 | 1.32 × 10⁻³ | Cellular and extracellular matrix |
| ENSG00000196569 | LAMA2 | laminin subunit alpha 2 | −0.407 | 5.66 × 10⁻²⁸ | Cellular and extracellular matrix |
| ENSG00000142798 | HSPG2 | heparan sulfate proteoglycan 2 | −0.440 | 8.61 × 10⁻¹⁴ | Cellular and extracellular matrix |
| ENSG00000123500 | COL10A1 | collagen type X alpha 1 chain | −0.282 | 2.54 × 10⁻² | Cellular and extracellular matrix |
| ENSG00000187498 | COL4A1 | collagen type IV alpha 1 chain | −0.265 | 7.12 × 10⁻¹² | Cellular and extracellular matrix |
| ENSG00000115414 | FN1 | fibronectin 1 | −0.446 | 1.23 × 10⁻³⁴ | Cellular and extracellular matrix |
| ENSG00000163359 | COL6A3 | collagen type VI alpha 3 chain | −0.412 | 3.41 × 10−38 | Cellular and extracellular matrix |
| ENSG00000103196 | CRISPLD2 | cysteine rich secretory protein LCCL domain containing 2 | −0.321 | 6.09 × 10⁻⁴ | Cellular and extracellular matrix |
| ENSG00000111799 | COL12A1 | collagen type XII alpha 1 chain | −0.388 | 7.55 × 10⁻²⁸ | Cellular and extracellular matrix |
| ENSG00000080561 | MID2 | midline 2 | −0.275 | 8.28 × 10⁻⁴ | Cellular and extracellular matrix |
| ENSG00000171223 | JUNB | JunB proto-oncogene, AP-1 transcription factor subunit | −1.704 | 9.13 × 10−173 | Cellular and extracellular matrix |
| ENSG00000101825 | MXRA5 | matrix remodeling associated 5 | −0.387 | 8.91 × 10⁻³² | Cellular and extracellular matrix |
| ENSG00000113369 | ARRDC3 | arrestin domain containing 3 | −0.289 | 6.30 × 10⁻⁴ | Cellular and extracellular matrix |
| ENSG00000138759 | FRAS1 | Fraser extracellular matrix complex subunit 1 | −0.447 | 4.82 × 10⁻¹⁴ | Cellular and extracellular matrix |
| ENSG00000106780 | MEGF9 | multiple EGF like domains 9 | −0.284 | 3.72 × 10⁻³ | Cellular and extracellular matrix |
| ENSG00000119681 | LTBP2 | latent transforming growth factor beta binding protein 2 | −0.270 | 3.80 × 10⁻¹⁰ | Cellular and extracellular matrix |
| ENSG00000182179 | UBA7 | ubiquitin like modifier activating enzyme 7 | 0.278 | 6.06 × 10⁻⁴ | Metabolism/Cell Proliferation/Regulation |
| ENSG00000148399 | DPH7 | diphthamide biosynthesis 7 | 0.345 | 5.72 × 10⁻³ | Metabolism/Cell Proliferation/Regulation |
| ENSG00000167733 | HSD11B1L | hydroxysteroid 11-beta dehydrogenase 1 like | 0.284 | 4.11 × 10⁻² | Metabolism/Cell Proliferation/Regulation |
| ENSG00000104852 | SNRNP70 | small nuclear ribonucleoprotein U1 subunit 70 | 0.340 | 6.65 × 10⁻¹⁷ | Metabolism/Cell Proliferation/Regulation |
| ENSG00000125901 | MRPS26 | mitochondrial ribosomal protein S26 | 0.289 | 3.13 × 10⁻² | Metabolism/Cell Proliferation/Regulation |
| ENSG00000183513 | COA5 | cytochrome c oxidase assembly factor 5 | 0.273 | 4.15 × 10⁻³ | Metabolism/Cell Proliferation/Regulation |
| ENSG00000165792 | METTL17 | methyltransferase like 17 | 0.401 | 5.91 × 10⁻⁵ | Metabolism/Cell Proliferation/Regulation |
| ENSG00000100429 | HDAC10 | histone deacetylase 10 | 0.274 | 1.11 × 10⁻² | Metabolism/Cell Proliferation/Regulation |
| ENSG00000141519 | CCDC40 | coiled-coil domain containing 40 | 0.383 | 3.27 × 10⁻² | Metabolism/Cell Proliferation/Regulation |
| ENSG00000172828 | CES3 | carboxylesterase 3 | 0.506 | 2.88 × 10⁻² | Metabolism/Cell Proliferation/Regulation |
| ENSG00000139631 | CSAD | cysteine sulfinic acid decarboxylase | 0.311 | 8.25 × 10⁻⁶ | Metabolism/Cell Proliferation/Regulation |
| ENSG00000112578 | BYSL | bystin like | 0.331 | 1.17 × 10⁻² | Metabolism/Cell Proliferation/Regulation |
| ENSG00000213398 | LCAT | lecithin-cholesterol acyltransferase | 0.488 | 3.70 × 10⁻³ | Metabolism/Cell Proliferation/Regulation |
| ENSG00000232653 | GOLGA8N | golgin A8 family member N | 0.348 | 2.84 × 10⁻² | Metabolism/Cell Proliferation/Regulation |
| ENSG00000145020 | AMT | aminomethyltransferase | 0.388 | 4.57 × 10⁻² | Metabolism/Cell Proliferation/Regulation |
| ENSG00000178038 | ALS2CL | ALS2 C-terminal like | 0.409 | 1.90 × 10⁻² | Metabolism/Cell Proliferation/Regulation |
| ENSG00000179886 | TIGD5 | tigger transposable element derived 5 | 0.313 | 4.31 × 10⁻² | Metabolism/Cell Proliferation/Regulation |
| ENSG00000128710 | HOXD10 | homeobox D10 | 0.319 | 3.71 × 10⁻³ | Metabolism/Cell Proliferation/Regulation |
| ENSG00000108641 | B9D1 | B9 domain containing 1 | 0.286 | 3.29 × 10⁻² | Metabolism/Cell Proliferation/Regulation |
| ENSG00000197774 | EME2 | essential meiotic structure-specific endonuclease subunit 2 | 0.385 | 8.64 × 10⁻⁵ | Metabolism/Cell Proliferation/Regulation |
| ENSG00000172732 | MUS81 | MUS81 structure-specific endonuclease subunit | 0.276 | 7.00 × 10⁻³ | Metabolism/Cell Proliferation/Regulation |
| ENSG00000039650 | PNKP | polynucleotide kinase 3′-phosphatase | 0.284 | 1.49 × 10⁻³ | Metabolism/Cell Proliferation/Regulation |
| ENSG00000129250 | KIF1C | kinesin family member 1C | 0.366 | 1.72 × 10⁻¹⁷ | Metabolism/Cell Proliferation/Regulation |
| ENSG00000010292 | NCAPD2 | non-SMC condensin I complex subunit D2 | 0.328 | 2.36 × 10⁻⁶ | Metabolism/Cell Proliferation/Regulation |
| ENSG00000146063 | TRIM41 | tripartite motif containing 41 | 0.332 | 1.10 × 10⁻⁶ | Metabolism/Cell Proliferation/Regulation |
| ENSG00000140983 | RHOT2 | ras homolog family member T2 | 0.328 | 5.44 × 10⁻⁶ | Metabolism/Cell Proliferation/Regulation |
| ENSG00000163482 | STK36 | serine/threonine kinase 36 | 0.273 | 4.31 × 10⁻⁵ | Metabolism/Cell Proliferation/Regulation |
| ENSG00000138834 | MAPK8IP3 | mitogen-activated protein kinase 8 interacting protein 3 | 0.309 | 1.58 × 10⁻⁶ | Metabolism/Cell Proliferation/Regulation |
| ENSG00000148120 | AOPEP | aminopeptidase O (putative) | 0.469 | 1.77 × 10⁻⁹ | Metabolism/Cell Proliferation/Regulation |
| ENSG00000167100 | SAMD14 | sterile alpha motif domain containing 14 | 0.270 | 4.18 × 10⁻² | Metabolism/Cell Proliferation/Regulation |
| ENSG00000110455 | ACCS | 1-aminocyclopropane-1-carboxylate synthase homolog (inactive) | 0.357 | 3.47 × 10⁻⁴ | Metabolism/Cell Proliferation/Regulation |
| ENSG00000158062 | UBXN11 | UBX domain protein 11 | 0.303 | 1.60 × 10⁻² | Metabolism/Cell Proliferation/Regulation |
| ENSG00000107829 | FBXW4 | F-box and WD repeat domain containing 4 | 0.347 | 1.00 × 10⁻⁴ | Metabolism/Cell Proliferation/Regulation |
| ENSG00000138835 | RGS3 | regulator of G protein signaling 3 | 0.343 | 9.63 × 10⁻⁷ | Metabolism/Cell Proliferation/Regulation |
| ENSG00000232119 | MCTS1 | MCTS1 re-initiation and release factor | 0.278 | 1.81 × 10⁻³ | Metabolism/Cell Proliferation/Regulation |
| ENSG00000167280 | ENGASE | endo-beta-N-acetylglucosaminidase | 0.409 | 1.64 × 10⁻⁵ | Metabolism/Cell Proliferation/Regulation |
| ENSG00000149716 | LTO1 | LTO1 maturation factor of ABCE1 | 0.307 | 4.33 × 10⁻³ | Metabolism/Cell Proliferation/Regulation |
| ENSG00000250151 | ARPC4-TTLL3 | ARPC4-TTLL3 readthrough | 0.354 | 1.51 × 10⁻⁴ | Metabolism/Cell Proliferation/Regulation |
| ENSG00000073605 | GSDMB | gasdermin B | 0.448 | 1.17 × 10⁻⁸ | Metabolism/Cell Proliferation/Regulation |
| ENSG00000148824 | MTG1 | mitochondrial ribosome associated GTPase 1 | 0.303 | 1.28 × 10⁻² | Metabolism/Cell Proliferation/Regulation |
| ENSG00000137504 | CREBZF | CREB/ATF bZIP transcription factor | 0.287 | 3.31 × 10⁻⁴ | Metabolism/Cell Proliferation/Regulation |
| ENSG00000180902 | D2HGDH | D-2-hydroxyglutarate dehydrogenase | 0.274 | 3.10 × 10⁻² | Metabolism/Cell Proliferation/Regulation |
| ENSG00000042429 | MED17 | mediator complex subunit 17 | 0.408 | 1.86 × 10⁻³ | Metabolism/Cell Proliferation/Regulation |
| ENSG00000149930 | TAOK2 | TAO kinase 2 | 0.456 | 8.73 × 10⁻¹⁷ | Metabolism/Cell Proliferation/Regulation |
| ENSG00000139546 | TARBP2 | TARBP2 subunit of RISC loading complex | 0.310 | 9.44 × 10⁻³ | Metabolism/Cell Proliferation/Regulation |
| ENSG00000116001 | TIA1 | TIA1 cytotoxic granule associated RNA binding protein | 0.332 | 8.51 × 10⁻⁶ | Metabolism/Cell Proliferation/Regulation |
| ENSG00000115053 | NCL | nucleolin | 0.275 | 1.29 × 10⁻¹² | Metabolism/Cell Proliferation/Regulation |
| ENSG00000173559 | NABP1 | nucleic acid binding protein 1 | 0.285 | 4.36 × 10⁻¹⁰ | Metabolism/Cell Proliferation/Regulation |
| ENSG00000198585 | NUDT16 | nudix hydrolase 16 | 0.317 | 4.87 × 10⁻⁷ | Metabolism/Cell Proliferation/Regulation |
| ENSG00000167393 | PPP2R3B | protein phosphatase 2 regulatory subunit B’’beta | 0.331 | 2.50 × 10⁻² | Metabolism/Cell Proliferation/Regulation |
| ENSG00000141456 | PELP1 | proline, glutamate and leucine rich protein 1 | 0.337 | 3.84 × 10⁻⁶ | Metabolism/Cell Proliferation/Regulation |
| ENSG00000128159 | TUBGCP6 | tubulin gamma complex associated protein 6 | 0.283 | 1.47 × 10⁻⁵ | Metabolism/Cell Proliferation/Regulation |
| ENSG00000078399 | HOXA9 | homeobox A9 | 0.355 | 4.10 × 10⁻⁴ | Metabolism/Cell Proliferation/Regulation |
| ENSG00000213339 | QTRT1 | queuine tRNA-ribosyltransferase catalytic subunit 1 | 0.292 | 4.27 × 10⁻³ | Metabolism/Cell Proliferation/Regulation |
| ENSG00000177192 | PUS1 | pseudouridine synthase 1 | 0.275 | 4.58 × 10⁻² | Metabolism/Cell Proliferation/Regulation |
| ENSG00000144785 | AC073896.1 | novel protein | 0.382 | 4.61 × 10⁻³ | Metabolism/Cell Proliferation/Regulation |
| ENSG00000185024 | BRF1 | BRF1 RNA polymerase III transcription initiation factor subunit | 0.301 | 7.22 × 10⁻⁴ | Metabolism/Cell Proliferation/Regulation |
| ENSG00000228049 | POLR2J2 | RNA polymerase II subunit J2 | 0.339 | 3.50 × 10⁻² | Metabolism/Cell Proliferation/Regulation |
| ENSG00000197782 | ZNF780A | zinc finger protein 780A | 0.281 | 1.47 × 10⁻² | Metabolism/Cell Proliferation/Regulation |
| ENSG00000147789 | ZNF7 | zinc finger protein 7 | 0.282 | 1.60 × 10⁻³ | Metabolism/Cell Proliferation/Regulation |
| ENSG00000171163 | ZNF692 | zinc finger protein 692 | 0.390 | 1.49 × 10⁻⁵ | Metabolism/Cell Proliferation/Regulation |
| ENSG00000176024 | ZNF613 | zinc finger protein 613 | 0.405 | 3.87 × 10⁻² | Metabolism/Cell Proliferation/Regulation |
| ENSG00000180626 | ZNF594 | zinc finger protein 594 | 0.552 | 8.53 × 10⁻⁶ | Metabolism/Cell Proliferation/Regulation |
| ENSG00000161551 | ZNF577 | zinc finger protein 577 | 0.309 | 9.79 × 10⁻³ | Metabolism/Cell Proliferation/Regulation |
| ENSG00000167785 | ZNF558 | zinc finger protein 558 | 0.330 | 6.43 × 10⁻³ | Metabolism/Cell Proliferation/Regulation |
| ENSG00000152433 | ZNF547 | zinc finger protein 547 | 0.503 | 2.07 × 10⁻² | Metabolism/Cell Proliferation/Regulation |
| ENSG00000144026 | ZNF514 | zinc finger protein 514 | 0.270 | 4.19 × 10⁻³ | Metabolism/Cell Proliferation/Regulation |
| ENSG00000196653 | ZNF502 | zinc finger protein 502 | 0.320 | 4.78 × 10⁻² | Metabolism/Cell Proliferation/Regulation |
| ENSG00000083817 | ZNF416 | zinc finger protein 416 | 0.337 | 4.62 × 10⁻² | Metabolism/Cell Proliferation/Regulation |
| ENSG00000175213 | ZNF408 | zinc finger protein 408 | 0.394 | 1.40 × 10⁻² | Metabolism/Cell Proliferation/Regulation |
| ENSG00000130684 | ZNF337 | zinc finger protein 337 | 0.340 | 6.05 × 10⁻⁷ | Metabolism/Cell Proliferation/Regulation |
| ENSG00000083812 | ZNF324 | zinc finger protein 324 | 0.378 | 1.21 × 10⁻⁴ | Metabolism/Cell Proliferation/Regulation |
| ENSG00000182986 | ZNF320 | zinc finger protein 320 | 0.406 | 6.47 × 10⁻⁵ | Metabolism/Cell Proliferation/Regulation |
| ENSG00000205903 | ZNF316 | zinc finger protein 316 | 0.313 | 1.86 × 10⁻⁵ | Metabolism/Cell Proliferation/Regulation |
| ENSG00000174652 | ZNF266 | zinc finger protein 266 | 0.433 | 1.55 × 10⁻¹⁰ | Metabolism/Cell Proliferation/Regulation |
| ENSG00000167380 | ZNF226 | zinc finger protein 226 | 0.337 | 1.45 × 10⁻⁴ | Metabolism/Cell Proliferation/Regulation |
| ENSG00000197841 | ZNF181 | zinc finger protein 181 | 0.298 | 3.56 × 10⁻² | Metabolism/Cell Proliferation/Regulation |
| ENSG00000154957 | ZNF18 | zinc finger protein 18 | 0.339 | 2.32 × 10⁻² | Metabolism/Cell Proliferation/Regulation |
| ENSG00000179909 | ZNF154 | zinc finger protein 154 | 0.341 | 3.55 × 10⁻³ | Metabolism/Cell Proliferation/Regulation |
| ENSG00000213762 | ZNF134 | zinc finger protein 134 | 0.280 | 2.08 × 10⁻³ | Metabolism/Cell Proliferation/Regulation |
| ENSG00000125846 | ZNF133 | zinc finger protein 133 | 0.325 | 1.48 × 10⁻³ | Metabolism/Cell Proliferation/Regulation |
| ENSG00000204946 | ZNF783 | zinc finger family member 783 | 0.265 | 1.58 × 10⁻³ | Metabolism/Cell Proliferation/Regulation |
| ENSG00000197114 | ZGPAT | zinc finger CCCH-type and G-patch domain containing | 0.270 | 1.89 × 10⁻² | Metabolism/Cell Proliferation/Regulation |
| ENSG00000140987 | ZSCAN32 | zinc finger and SCAN domain containing 32 | 0.486 | 6.71 × 10⁻⁵ | Metabolism/Cell Proliferation/Regulation |
| ENSG00000114853 | ZBTB47 | zinc finger and BTB domain containing 47 | 0.372 | 4.54 × 10⁻⁹ | Metabolism/Cell Proliferation/Regulation |
| ENSG00000099899 | TRMT2A | tRNA methyltransferase 2 homolog A | 0.293 | 7.14 × 10⁻⁴ | Metabolism/Cell Proliferation/Regulation |
| ENSG00000100038 | TOP3B | DNA topoisomerase III beta | 0.295 | 1.09 × 10⁻² | Metabolism/Cell Proliferation/Regulation |
| ENSG00000198056 | PRIM1 | DNA primase subunit 1 | 0.461 | 1.32 × 10⁻³ | Metabolism/Cell Proliferation/Regulation |
| ENSG00000178028 | DMAP1 | DNA methyltransferase 1 associated protein 1 | 0.311 | 4.49 × 10⁻⁴ | Metabolism/Cell Proliferation/Regulation |
| ENSG00000168209 | DDIT4 | DNA damage inducible transcript 4 | 0.278 | 7.35 × 10⁻⁵ | Metabolism/Cell Proliferation/Regulation |
| ENSG00000221978 | CCNL2 | cyclin L2 | 0.429 | 2.31 × 10⁻²³ | Metabolism/Cell Proliferation/Regulation |
| ENSG00000250506 | CDK3 | cyclin dependent kinase 3 | 0.535 | 6.59 × 10⁻⁴ | Metabolism/Cell Proliferation/Regulation |
| ENSG00000156345 | CDK20 | cyclin dependent kinase 20 | 0.287 | 3.81 × 10⁻² | Metabolism/Cell Proliferation/Regulation |
| ENSG00000248333 | CDK11B | cyclin dependent kinase 11B | 0.299 | 8.71 × 10⁻⁴ | Metabolism/Cell Proliferation/Regulation |
| ENSG00000185324 | CDK10 | cyclin dependent kinase 10 | 0.344 | 1.84 × 10⁻³ | Metabolism/Cell Proliferation/Regulation |
| ENSG00000130305 | NSUN5 | NOP2/Sun RNA methyltransferase 5 | 0.264 | 4.48 × 10⁻² | Metabolism/Cell Proliferation/Regulation |
| ENSG00000134186 | PRPF38B | pre-mRNA processing factor 38B | 0.269 | 6.68 × 10⁻⁴ | Metabolism/Cell Proliferation/Regulation |
| ENSG00000103168 | TAF1C | TATA-box binding protein associated factor, RNA polymerase I subunit C | 0.324 | 7.71 × 10⁻⁵ | Metabolism/Cell Proliferation/Regulation |
| ENSG00000178718 | RPP25 | ribonuclease P and MRP subunit p25 | 0.280 | 3.45 × 10⁻² | Metabolism/Cell Proliferation/Regulation |
| ENSG00000264668 | AC138696.1 | novel protein | 0.384 | 3.75 × 10⁻⁷ | Metabolism/Cell Proliferation/Regulation |
| ENSG00000041988 | THAP3 | THAP domain containing 3 | 0.347 | 3.09 × 10⁻² | Metabolism/Cell Proliferation/Regulation |
| ENSG00000104129 | DNAJC17 | DnaJ heat shock protein family (Hsp40) member C17 | 0.364 | 3.96 × 10⁻² | Metabolism/Cell Proliferation/Regulation |
| ENSG00000187531 | SIRT7 | sirtuin 7 | 0.386 | 1.73 × 10⁻² | Metabolism/Cell Proliferation/Regulation |
| ENSG00000108479 | GALK1 | galactokinase 1 | 0.311 | 9.61 × 10⁻³ | Metabolism/Cell Proliferation/Regulation |
| ENSG00000140400 | MAN2C1 | mannosidase alpha class 2C member 1 | 0.384 | 3.49 × 10⁻¹² | Metabolism/Cell Proliferation/Regulation |
| ENSG00000142102 | PGGHG | protein-glucosylgalactosylhydroxylysine glucosidase | 0.388 | 6.40 × 10⁻⁷ | Metabolism/Cell Proliferation/Regulation |
| ENSG00000181274 | FRAT2 | FRAT regulator of WNT signaling pathway 2 | 0.331 | 4.77 × 10⁻² | Metabolism/Cell Proliferation/Regulation |
| ENSG00000215788 | TNFRSF25 | TNF receptor superfamily member 25 | 0.558 | 1.63 × 10⁻² | Metabolism/Cell Proliferation/Regulation |
| ENSG00000153179 | RASSF3 | Ras association domain family member 3 | 0.326 | 5.71 × 10⁻⁸ | Metabolism/Cell Proliferation/Regulation |
| ENSG00000115875 | SRSF7 | serine and arginine rich splicing factor 7 | 0.293 | 1.90 × 10⁻⁴ | Metabolism/Cell Proliferation/Regulation |
| ENSG00000162910 | MRPL55 | mitochondrial ribosomal protein L55 | 0.295 | 4.41 × 10⁻² | Metabolism/Cell Proliferation/Regulation |
| ENSG00000172586 | CHCHD1 | coiled-coil-helix-coiled-coil-helix domain containing 1 | 0.415 | 2.99 × 10⁻² | Metabolism/Cell Proliferation/Regulation |
| ENSG00000136938 | ANP32B | acidic nuclear phosphoprotein 32 family member B | 0.309 | 1.46 × 10⁻⁷ | Metabolism/Cell Proliferation/Regulation |
| ENSG00000177595 | PIDD1 | p53-induced death domain protein 1 | 0.300 | 2.42 × 10⁻⁴ | Metabolism/Cell Proliferation/Regulation |
| ENSG00000129473 | BCL2L2 | BCL2 like 2 | 0.273 | 1.67 × 10⁻⁴ | Metabolism/Cell Proliferation/Regulation |
| ENSG00000184207 | PGP | phosphoglycolate phosphatase | 0.409 | 5.30 × 10⁻⁴ | Metabolism/Cell Proliferation/Regulation |
| ENSG00000136271 | DDX56 | DEAD-box helicase 56 | 0.292 | 5.37 × 10⁻⁷ | Metabolism/Cell Proliferation/Regulation |
| ENSG00000106404 | CLDN15 | claudin 15 | 0.436 | 2.44 × 10⁻³ | Metabolism/Cell Proliferation/Regulation |
| ENSG00000130734 | ATG4D | autophagy related 4D cysteine peptidase | 0.360 | 4.83 × 10⁻² | Metabolism/Cell Proliferation/Regulation |
| ENSG00000256825 | AC026786.1 | novel protein | 0.466 | 1.84 × 10⁻² | Metabolism/Cell Proliferation/Regulation |
| ENSG00000113240 | CLK4 | CDC like kinase 4 | 0.348 | 8.35 × 10⁻⁴ | Metabolism/Cell Proliferation/Regulation |
| ENSG00000176444 | CLK2 | CDC like kinase 2 | 0.319 | 4.36 × 10⁻⁵ | Metabolism/Cell Proliferation/Regulation |
| ENSG00000114735 | HEMK1 | HemK methyltransferase family member 1 | 0.313 | 9.02 × 10⁻⁵ | Metabolism/Cell Proliferation/Regulation |
| ENSG00000135414 | GDF11 | growth differentiation factor 11 | 0.306 | 2.35 × 10⁻⁶ | Metabolism/Cell Proliferation/Regulation |
| ENSG00000141013 | GAS8 | growth arrest specific 8 | 0.395 | 1.02 × 10⁻² | Metabolism/Cell Proliferation/Regulation |
| ENSG00000065268 | WDR18 | WD repeat domain 18 | 0.321 | 9.31 × 10⁻³ | Metabolism/Cell Proliferation/Regulation |
| ENSG00000071246 | VASH1 | vasohibin 1 | 0.374 | 2.50 × 10⁻⁴ | Metabolism/Cell Proliferation/Regulation |
| ENSG00000005007 | UPF1 | UPF1 RNA helicase and ATPase | 0.275 | 4.60 × 10⁻⁶ | Metabolism/Cell Proliferation/Regulation |
| ENSG00000126790 | L3HYPDH | trans-L-3-hydroxyproline dehydratase | 0.376 | 9.63 × 10⁻³ | Metabolism/Cell Proliferation/Regulation |
| ENSG00000102871 | TRADD | TNFRSF1A associated via death domain | 0.399 | 2.50 × 10⁻⁵ | Metabolism/Cell Proliferation/Regulation |
| ENSG00000146109 | ABT1 | activator of basal transcription 1 | 0.263 | 1.99 × 10⁻² | Metabolism/Cell Proliferation/Regulation |
| ENSG00000264343 | NOTCH2NLA | notch 2 N-terminal like A | 0.540 | 1.22 × 10⁻² | Metabolism/Cell Proliferation/Regulation |
| ENSG00000258674 | AC011448.1 | novel protein | 0.432 | 3.06 × 10⁻⁵ | Metabolism/Cell Proliferation/Regulation |
| ENSG00000149451 | ADAM33 | ADAM metallopeptidase domain 33 | 0.382 | 5.58 × 10⁻²⁰ | Metabolism/Cell Proliferation/Regulation |
| ENSG00000215041 | NEURL4 | neuralized E3 ubiquitin protein ligase 4 | 0.308 | 1.02 × 10⁻⁴ | Metabolism/Cell Proliferation/Regulation |
| ENSG00000150401 | DCUN1D2 | defective in cullin neddylation 1 domain containing 2 | 0.282 | 1.23 × 10⁻³ | Metabolism/Cell Proliferation/Regulation |
| ENSG00000251287 | ALG1L2 | ALG1 chitobiosyldiphosphodolichol beta-mannosyltransferase like 2 | 0.356 | 6.01 × 10⁻⁷ | Metabolism/Cell Proliferation/Regulation |
| ENSG00000073169 | SELENOO | selenoprotein O | 0.364 | 1.01 × 10⁻⁶ | Metabolism/Cell Proliferation/Regulation |
| ENSG00000234616 | JRK | Jrk helix-turn-helix protein | 0.374 | 3.11 × 10⁻⁵ | Metabolism/Cell Proliferation/Regulation |
| ENSG00000105559 | PLEKHA4 | pleckstrin homology domain containing A4 | 0.442 | 5.49 × 10⁻⁶ | Metabolism/Cell Proliferation/Regulation |
| ENSG00000007392 | LUC7L | LUC7 like | 0.322 | 8.83 × 10⁻⁵ | Metabolism/Cell Proliferation/Regulation |
| ENSG00000131584 | ACAP3 | ArfGAP with coiled-coil, ankyrin repeat and PH domains 3 | 0.334 | 3.35 × 10⁻⁷ | Metabolism/Cell Proliferation/Regulation |
| ENSG00000175137 | SH3BP5L | SH3 binding domain protein 5 like | 0.422 | 5.89 × 10⁻⁶ | Metabolism/Cell Proliferation/Regulation |
| ENSG00000159692 | CTBP1 | C-terminal binding protein 1 | 0.342 | 2.13 × 10⁻¹³ | Metabolism/Cell Proliferation/Regulation |
| ENSG00000173706 | HEG1 | heart development protein with EGF like domains 1 | −0.277 | 5.78 × 10⁻¹⁴ | Metablism/proliferation/regulation |
| ENSG00000155008 | APOOL | apolipoprotein O like | −0.267 | 3.99 × 10⁻³ | Metablism/proliferation/regulation |
| ENSG00000178385 | PLEKHM3 | pleckstrin homology domain containing M3 | −0.264 | 1.23 × 10⁻³ | Metablism/proliferation/regulation |
| ENSG0000017207 | EIF2AK3 | eukaryotic translation initiation factor 2 alpha kinase 3 | −0.307 | 2.27 × 10⁻⁵ | Metablism/proliferation/regulation |
| ENSG00000106392 | C1GALT1 | core 1 synthase, glycoprotein-N-acetylgalactosamine 3-beta-galactosyltransferase 1 | −0.268 | 1.02 × 10⁻² | Metablism/proliferation/regulation |
| ENSG00000165195 | PIGA | phosphatidylinositol glycan anchor biosynthesis class A | −0.726 | 1.08 × 10⁻⁵ | Metablism/proliferation/regulation |
| ENSG00000155090 | KLF10 | Kruppel like factor 10 | −1.136 | 1.11 × 10−43 | Metablism/proliferation/regulation |
| ENSG00000144655 | CSRNP1 | cysteine and serine rich nuclear protein 1 | −1.225 | 4.13 × 10⁻³⁵ | Metablism/proliferation/regulation |
| ENSG00000255112 | CHMP1B | charged multivesicular body protein 1B | −0.526 | 1.54 × 10⁻¹⁶ | Metablism/proliferation/regulation |
| ENSG00000179241 | LDLRAD3 | low density lipoprotein receptor class A domain containing 3 | −0.272 | 1.15 × 10⁻² | Metablism/proliferation/regulation |
| ENSG00000108582 | CPD | carboxypeptidase D | −0.308 | 1.62 × 10⁻¹⁵ | Metablism/proliferation/regulation |
| ENSG00000176641 | RNF152 | ring finger protein 152 | −0.326 | 7.13 × 10⁻⁵ | Metablism/proliferation/regulation |
| ENSG00000136542 | GALNT5 | polypeptide N-acetylgalactosaminyltransferase 5 | −0.264 | 7.28 × 10⁻¹⁰ | Metablism/proliferation/regulation |
| ENSG00000203814 | HIST2H2BF | histone cluster 2 H2B family member f | −0.332 | 3.21 × 10⁻⁴ | Metablism/proliferation/regulation |
| ENSG00000162924 | REL | REL proto-oncogene, NF-kB subunit | −0.591 | 5.43 × 10⁻¹¹ | Metablism/proliferation/regulation |
| ENSG00000160888 | IER2 | immediate early response 2 | −1.137 | 6.07 × 10−73 | Metablism/proliferation/regulation |
| ENSG00000087074 | PPP1R15A | protein phosphatase 1 regulatory subunit 15A | −0.598 | 1.91 × 10−38 | Metablism/proliferation/regulation |
| ENSG00000136158 | SPRY2 | sprouty RTK signaling antagonist 2 | −0.356 | 8.30 × 10⁻⁵ | Metablism/proliferation/regulation |
| ENSG00000137075 | RNF38 | ring finger protein 38 | −0.266 | 3.06 × 10⁻³ | Metablism/proliferation/regulation |
| ENSG00000166340 | TPP1 | tripeptidyl peptidase 1 | −0.341 | 1.59 × 10⁻⁹ | Metablism/proliferation/regulation |
| ENSG00000130164 | LDLR | low density lipoprotein receptor | −0.282 | 9.25 × 10⁻⁶ | Metablism/proliferation/regulation |
| ENSG00000112245 | PTP4A1 | protein tyrosine phosphatase 4A1 | −0.303 | 1.01 × 10⁻⁶ | Metablism/proliferation/regulation |
| ENSG00000119138 | KLF9 | Kruppel like factor 9 | −0.409 | 7.12 × 10⁻¹² | Metablism/proliferation/regulation |
| ENSG00000134107 | BHLHE40 | basic helix-loop-helix family member e40 | −0.597 | 7.53 × 10⁻¹¹ | Metablism/proliferation/regulation |
| ENSG00000115520 | COQ10B | coenzyme Q10B | −0.414 | 2.48 × 10⁻⁷ | Metablism/proliferation/regulation |
| ENSG00000049323 | LTBP1 | latent transforming growth factor beta binding protein 1 | −0.308 | 1.58 × 10⁻¹⁵ | Metablism/proliferation/regulation |
| ENSG00000138166 | DUSP5 | dual specificity phosphatase 5 | −0.738 | 6.55 × 10⁻²³ | Metablism/proliferation/regulation |
| ENSG00000130513 | GDF15 | growth differentiation factor 15 | −0.915 | 1.32 × 10⁻³⁵ | Metablism/proliferation/regulation |
| ENSG00000119986 | AVPI1 | arginine vasopressin induced 1 | −0.734 | 1.12 × 10⁻²¹ | Metablism/proliferation/regulation |
| ENSG00000157168 | NRG1 | neuregulin 1 | −0.295 | 2.04 × 10⁻⁷ | Metablism/proliferation/regulation |
| ENSG00000166225 | FRS2 | fibroblast growth factor receptor substrate 2 | −0.292 | 7.11 × 10⁻⁵ | Metablism/proliferation/regulation |
| ENSG00000197081 | IGF2R | insulin like growth factor 2 receptor | −0.264 | 3.17 × 10⁻¹¹ | Metablism/proliferation/regulation |
| ENSG00000136527 | TRA2B | transformer 2 beta homolog | −0.421 | 2.33 × 10⁻¹⁴ | Metablism/proliferation/regulation |
| ENSG00000283782 | AC116366.3 | novel protein | −0.435 | 5.49 × 10⁻³ | Metablism/proliferation/regulation |
| ENSG00000164220 | F2RL2 | coagulation factor II thrombin receptor like 2 | −0.303 | 1.82 × 10⁻¹⁰ | Metablism/proliferation/regulation |
| ENSG00000185483 | ROR1 | receptor tyrosine kinase like orphan receptor 1 | −0.272 | 2.88 × 10⁻⁵ | Metablism/proliferation/regulation |
| ENSG00000080200 | CRYBG3 | crystallin beta-gamma domain containing 3 | −0.468 | 3.60 × 10⁻¹⁶ | Metablism/proliferation/regulation |
| ENSG00000162433 | AK4 | adenylate kinase 4 | −0.266 | 1.58 × 10⁻² | Metablism/proliferation/regulation |
| ENSG00000178607 | ERN1 | endoplasmic reticulum to nucleus signaling 1 | −0.334 | 4.90 × 10⁻⁶ | Metablism/proliferation/regulation |
| ENSG00000004799 | PDK4 | pyruvate dehydrogenase kinase 4 | −1.212 | 9.25 × 10⁻¹⁰ | Metablism/proliferation/regulation |
| ENSG00000155816 | FMN2 | formin 2 | −0.275 | 3.38 × 10⁻⁶ | Metablism/proliferation/regulation |
| ENSG00000132475 | H3F3B | H3 histone family member 3B | −0.400 | 6.12 × 10⁻¹¹ | Metablism/proliferation/regulation |
| ENSG00000184260 | HIST2H2AC | histone cluster 2 H2A family member c | −0.362 | 6.93 × 10⁻³ | Metablism/proliferation/regulation |
| ENSG00000272196 | HIST2H2AA4 | histone cluster 2 H2A family member a4 | −0.754 | 4.41 × 10⁻² | Metablism/proliferation/regulation |
| ENSG00000105835 | NAMPT | nicotinamide phosphoribosyltransferase | −0.700 | 1.23 × 10⁻³⁴ | Metablism/proliferation/regulation |
| ENSG00000143384 | MCL1 | MCL1 apoptosis regulator, BCL2 family member | −0.436 | 1.54 × 10⁻²² | Metablism/proliferation/regulation |
| ENSG00000067082 | KLF6 | Kruppel like factor 6 | −0.645 | 2.26 × 10−44 | Metablism/proliferation/regulation |
| ENSG00000177606 | JUN | Jun proto-oncogene, AP-1 transcription factor subunit | −1.114 | 2.64 × 10−153 | Metablism/proliferation/regulation |
| ENSG00000153936 | HS2ST1 | heparan sulfate 2-O-sulfotransferase 1 | −0.264 | 4.02 × 10⁻⁴ | Metablism/proliferation/regulation |
| ENSG00000168621 | GDNF | glial cell derived neurotrophic factor | −0.518 | 3.74 × 10⁻⁷ | Metablism/proliferation/regulation |
| ENSG00000175592 | FOSL1 | FOS like 1, AP-1 transcription factor subunit | −0.568 | 2.02 × 10⁻¹⁹ | Metablism/proliferation/regulation |
| ENSG00000108306 | FBXL20 | F-box and leucine rich repeat protein 20 | −0.264 | 6.71 × 10⁻⁵ | Metablism/proliferation/regulation |
| ENSG00000174010 | KLHL15 | kelch like family member 15 | −0.339 | 8.75 × 10⁻³ | Metablism/proliferation/regulation |
| ENSG00000118263 | KLF7 | Kruppel like factor 7 | −0.415 | 2.68 × 10⁻¹¹ | Metablism/proliferation/regulation |
| ENSG00000144959 | NCEH1 | neutral cholesterol ester hydrolase 1 | −0.401 | 1.07 × 10⁻⁵ | Metablism/proliferation/regulation |
| ENSG00000167470 | MIDN | midnolin | −0.473 | 1.19 × 10⁻¹⁵ | Metablism/proliferation/regulation |
| ENSG00000069667 | RORA | RAR related orphan receptor A | −0.292 | 1.71 × 10⁻³ | Metablism/proliferation/regulation |
| ENSG00000075213 | SEMA3A | semaphorin 3A | −0.321 | 2.38 × 10⁻⁵ | Metablism/proliferation/regulation |
| ENSG00000176542 | USF3 | upstream transcription factor family member 3 | −0.359 | 2.91 × 10⁻⁷ | Metablism/proliferation/regulation |
| ENSG00000100354 | TNRC6B | trinucleotide repeat containing adaptor 6B | −0.265 | 3.40 × 10⁻¹⁰ | Metablism/proliferation/regulation |
| ENSG00000185650 | ZFP36L1 | ZFP36 ring finger protein like 1 | −0.377 | 3.07 × 10⁻²⁰ | Metablism/proliferation/regulation |
| ENSG00000122641 | INHBA | inhibin subunit beta A | −0.301 | 9.16 × 10⁻⁵ | Metablism/proliferation/regulation |
| ENSG00000092969 | TGFB2 | transforming growth factor beta 2 | −0.309 | 7.30 × 10⁻³ | Metablism/proliferation/regulation |
| ENSG00000165997 | ARL5B | ADP ribosylation factor like GTPase 5B | −0.828 | 2.28 × 10⁻²⁵ | Metablism/proliferation/regulation |
| ENSG00000221869 | CEBPD | CCAAT enhancer binding protein delta | −0.326 | 1.21 × 10⁻⁴ | Metablism/proliferation/regulation |
| ENSG00000136731 | UGGT1 | UDP-glucose glycoprotein glucosyltransferase 1 | −0.366 | 1.03 × 10⁻¹⁷ | Metablism/proliferation/regulation |
| ENSG00000148737 | TCF7L2 | transcription factor 7 like 2 | −0.339 | 2.90 × 10⁻⁶ | Metablism/proliferation/regulation |
| ENSG00000152377 | SPOCK1 | SPARC (osteonectin), cwcv and kazal like domains proteoglycan 1 | −0.323 | 7.57 × 10⁻¹⁴ | Metablism/proliferation/regulation |
| ENSG00000124813 | RUNX2 | RUNX family transcription factor 2 | −0.313 | 1.99 × 10⁻⁸ | Metablism/proliferation/regulation |
| ENSG00000143190 | POU2F1 | POU class 2 homeobox 1 | −0.331 | 1.05 × 10⁻⁴ | Metablism/proliferation/regulation |
| ENSG00000184384 | MAML2 | mastermind like transcriptional coactivator 2 | −0.314 | 3.02 × 10⁻¹² | Metablism/proliferation/regulation |
| ENSG00000128342 | LIF | LIF interleukin 6 family cytokine | −0.763 | 2.73 × 10⁻¹⁰ | Metablism/proliferation/regulation |
| ENSG00000120616 | EPC1 | enhancer of polycomb homolog 1 | −0.321 | 9.31 × 10⁻⁶ | Metablism/proliferation/regulation |
| ENSG00000175197 | DDIT3 | DNA damage inducible transcript 3 | −0.427 | 6.45 × 10⁻⁶ | Metablism/proliferation/regulation |
| ENSG00000171681 | ATF7IP | activating transcription factor 7 interacting protein | −0.277 | 9.25 × 10⁻¹⁰ | Metablism/proliferation/regulation |
| ENSG00000162772 | ATF3 | activating transcription factor 3 | −2.877 | 3.76 × 10−175 | Metablism/proliferation/regulation |
| ENSG00000003989 | SLC7A2 | solute carrier family 7 member2 | −0.359 | 4.70 × 10⁻² | Metablism/proliferation/regulation |
| ENSG00000131389 | SLC6A6 | solute carrier family 6 member6 | −0.269 | 2.71 × 10⁻⁷ | Metablism/proliferation/regulation |
| ENSG00000059804 | SLC2A3 | solute carrier family 2 member3 | −1.000 | 6.82 × 10−60 | Metablism/proliferation/regulation |
| ENSG00000155850 | SLC26A2 | solute carrier family 26 member2 | −0.266 | 1.54 × 10⁻⁴ | Metablism/proliferation/regulation |
| ENSG00000118596 | SLC16A7 | solute carrier family 16 member7 | −0.389 | 1.14 × 10⁻⁸ | Metablism/proliferation/regulation |
| ENSG00000163660 | CCNL1 | cyclin L1 | −1.027 | 4.70 × 10−78 | Metablism/proliferation/regulation |
| ENSG00000182263 | FIGN | fidgetin, microtubule severing factor | −0.360 | 2.43 × 10⁻³ | Metablism/proliferation/regulation |
| ENSG00000137331 | IER3 | immediate early response 3 | −0.884 | 1.62 × 10⁻¹⁰ | Metablism/proliferation/regulation |
| ENSG00000143878 | RHOB | ras homolog family member B | −1.048 | 2.20 × 10−87 | Metablism/proliferation/regulation |
| ENSG00000123975 | CKS2 | CDC28 protein kinase regulatory subunit 2 | −0.448 | 1.76 × 10⁻⁷ | Metablism/proliferation/regulation |
| ENSG00000102781 | KATNAL1 | katanin catalytic subunit A1 like 1 | −0.274 | 3.80 × 10⁻⁵ | Metablism/proliferation/regulation |
| ENSG00000185621 | LMLN | leishmanolysin like peptidase | −0.293 | 4.91 × 10⁻³ | Metablism/proliferation/regulation |
| ENSG00000204131 | NHSL2 | NHS like 2 | −0.292 | 1.07 × 10⁻⁶ | Metablism/proliferation/regulation |
| ENSG00000134954 | ETS1 | ETS proto-oncogene 1, transcription factor | −0.298 | 8.39 × 10⁻⁷ | Metablism/proliferation/regulation |
| ENSG00000105810 | CDK6 | cyclin dependent kinase 6 | −0.306 | 2.07 × 10⁻⁸ | Metablism/proliferation/regulation |
| ENSG00000204524 | ZNF805 | zinc finger protein 805 | −0.310 | 4.10 × 10⁻⁴ | Metablism/proliferation/regulation |
| ENSG00000197483 | ZNF628 | zinc finger protein 628 | −0.439 | 1.94 × 10⁻² | Metablism/proliferation/regulation |
| ENSG00000197714 | ZNF460 | zinc finger protein 460 | −0.305 | 3.43 × 10⁻⁷ | Metablism/proliferation/regulation |
| ENSG00000130844 | ZNF331 | zinc finger protein 331 | −0.277 | 5.71 × 10⁻⁴ | Metablism/proliferation/regulation |
| ENSG00000285253 | AC090517.4 | zinc finger protein 280D | −0.444 | 2.01 × 10⁻⁵ | Metablism/proliferation/regulation |
| ENSG00000185947 | ZNF267 | zinc finger protein 267 | −0.284 | 3.90 × 10⁻² | Metablism/proliferation/regulation |
| ENSG00000091656 | ZFHX4 | zinc finger homeobox 4 | −0.313 | 1.06 × 10⁻⁹ | Metablism/proliferation/regulation |
| ENSG00000180776 | ZDHHC20 | zinc finger DHHC-type containing 20 | −0.287 | 5.38 × 10⁻⁷ | Metablism/proliferation/regulation |
| ENSG00000163874 | ZC3H12A | zinc finger CCCH-type containing 12A | −0.274 | 3.54 × 10⁻³ | Metablism/proliferation/regulation |
| ENSG00000173276 | ZBTB21 | zinc finger and BTB domain containing 21 | −0.288 | 1.05 × 10⁻⁵ | Metablism/proliferation/regulation |
| ENSG00000030419 | IKZF2 | IKAROS family zinc finger 2 | −0.412 | 4.37 × 10⁻⁴ | Metablism/proliferation/regulation |
| ENSG00000164122 | ASB5 | ankyrin repeat and SOCS box containing 5 | −0.269 | 6.59 × 10⁻³ | Metablism/proliferation/regulation |
| ENSG00000113448 | PDE4D | phosphodiesterase 4D | −0.374 | 1.92 × 10⁻³ | Metablism/proliferation/regulation |
| ENSG00000184588 | PDE4B | phosphodiesterase 4B | −0.474 | 2.45 × 10⁻⁷ | Metablism/proliferation/regulation |
| ENSG00000142892 | PIGK | phosphatidylinositol glycan anchor biosynthesis class K | −0.264 | 9.96 × 10⁻⁴ | Metablism/proliferation/regulation |
| ENSG00000118523 | CCN2 | cellular communication network factor 2 | −0.313 | 3.41 × 10⁻¹¹ | Metablism/proliferation/regulation |
| ENSG00000112419 | PHACTR2 | phosphatase and actin regulator 2 | −0.281 | 1.95 × 10⁻⁶ | Metablism/proliferation/regulation |
| ENSG00000179094 | PER1 | period circadian regulator 1 | −0.443 | 1.38 × 10⁻¹¹ | Metablism/proliferation/regulation |
| ENSG00000106460 | TMEM106B | transmembrane protein 106B | −0.311 | 8.77 × 10⁻⁸ | Metablism/proliferation/regulation |
| ENSG00000182752 | PAPPA | pappalysin 1 | −0.354 | 1.08 × 10⁻²⁶ | Metablism/proliferation/regulation |
| ENSG00000139496 | NUP58 | nucleoporin 58 | −0.328 | 2.66 × 10⁻⁷ | Metablism/proliferation/regulation |
| ENSG00000119508 | NR4A3 | nuclear receptor subfamily 4 group A member 3 | −3.256 | 9.06 × 10−169 | Metablism/proliferation/regulation |
| ENSG00000153234 | NR4A2 | nuclear receptor subfamily 4 group A member 2 | −3.941 | 1.48 × 10−78 | Metablism/proliferation/regulation |
| ENSG00000123358 | NR4A1 | nuclear receptor subfamily 4 group A member 1 | −3.834 | 4.26 × 10−130 | Metablism/proliferation/regulation |
| ENSG00000165030 | NFIL3 | nuclear factor, interleukin 3 regulated | −0.605 | 9.27 × 10⁻¹⁸ | Metablism/proliferation/regulation |
| ENSG00000102908 | NFAT5 | nuclear factor of activated T cells 5 | −0.312 | 1.58 × 10⁻¹⁵ | Metablism/proliferation/regulation |
| ENSG00000162599 | NFIA | nuclear factor I A | −0.312 | 1.38 × 10⁻⁴ | Metablism/proliferation/regulation |
| ENSG00000141458 | NPC1 | NPC intracellular cholesterol transporter 1 | −0.649 | 6.52 × 10−53 | Metablism/proliferation/regulation |
| ENSG00000284057 | AP001273.2 | novel protein, C11orf54-MED17 readthrough | −0.356 | 2.99 × 10⁻² | Metablism/proliferation/regulation |
| ENSG00000138336 | TET1 | tet methylcytosine dioxygenase 1 | −0.348 | 3.53 × 10⁻⁵ | Metablism/proliferation/regulation |
| ENSG00000163960 | UBXN7 | UBX domain protein 7 | −0.265 | 1.61 × 10⁻⁸ | Metablism/proliferation/regulation |
| ENSG00000172059 | KLF11 | Kruppel like factor 11 | −0.437 | 8.40 × 10⁻⁸ | Metablism/proliferation/regulation |
| ENSG00000196233 | LCOR | ligand dependent nuclear receptor corepressor | −0.382 | 2.07 × 10⁻¹¹ | Metablism/proliferation/regulation |
| ENSG00000004776 | HSPB6 | heat shock protein family B (small) member 6 | −0.286 | 1.62 × 10⁻³ | Metablism/proliferation/regulation |
| ENSG00000177570 | SAMD12 | sterile alpha motif domain containing 12 | −0.334 | 7.44 × 10⁻⁶ | Metablism/proliferation/regulation |
| ENSG00000197620 | CXorf40A | chromosome X open reading frame 40A | −0.320 | 8.98 × 10⁻³ | Metablism/proliferation/regulation |
| ENSG00000198142 | SOWAHC | sosondowah ankyrin repeat domain family member C | −0.427 | 6.40 × 10⁻⁷ | Metablism/proliferation/regulation |
| ENSG00000154175 | ABI3BP | ABI family member 3 binding protein | −0.352 | 8.25 × 10⁻⁶ | Metablism/proliferation/regulation |
| ENSG00000280987 | MATR3 | matrin 3 | −0.323 | 4.21 × 10⁻⁵ | Metablism/proliferation/regulation |
| ENSG00000164296 | TIGD6 | tigger transposable element derived 6 | −0.272 | 2.37 × 10⁻² | Metablism/proliferation/regulation |
| ENSG00000205189 | ZBTB10 | zinc finger and BTB domain containing 10 | −0.266 | 6.94 × 10⁻³ | Metablism/proliferation/regulation |
| ENSG00000151967 | SCHIP1 | schwannomin interacting protein 1 | −0.628 | 3.95 × 10⁻³ | Metablism/proliferation/regulation |
| ENSG00000130962 | PRRG1 | proline rich and Gla domain 1 | −0.307 | 1.52 × 10⁻⁵ | Metablism/proliferation/regulation |
| ENSG00000169908 | TM4SF1 | transmembrane 4 L six family member 1 | −0.945 | 7.67 × 10⁻⁵ | Metablism/proliferation/regulation |
| ENSG00000236383 | CCDC200 | coiled-coil domain containing 200 | −0.411 | 1.06 × 10⁻¹⁶ | Metablism/proliferation/regulation |
| ENSG00000219481 | NBPF1 | NBPF member 1 | −0.850 | 4.05 × 10⁻⁸ | Metablism/proliferation/regulation |
| ENSG00000041982 | TNC | tenascin C | −0.466 | 1.86 × 10⁻²⁶ | Metablism/proliferation/regulation |
| ENSG00000130702 | LAMA5 | laminin subunit alpha 5 | −0.285 | 6.65 × 10⁻⁵ | Metablism/proliferation/regulation |
| ENSG00000150907 | FOXO1 | forkhead box O1 | −0.283 | 2.58 × 10⁻³ | Metablism/proliferation/regulation |
| ENSG00000135842 | NIBAN1 | niban apoptosis regulator 1 | −0.310 | 2.05 × 10⁻⁷ | Metablism/proliferation/regulation |
| ENSG00000181827 | RFX7 | regulatory factor X7 | −0.264 | 2.26 × 10⁻⁷ | Metablism/proliferation/regulation |
| ENSG00000156030 | ELMSAN1 | ELM2 and Myb/SANT domain containing 1 | −0.295 | 6.51 × 10⁻⁸ | Metablism/proliferation/regulation |
| ENSG00000167244 | IGF2 | insulin like growth factor 2 | −0.409 | 6.22 × 10⁻³ | Metablism/proliferation/regulation |
| ENSG00000152409 | JMY | junction mediating and regulatory protein, p53 cofactor | −0.265 | 4.94 × 10⁻⁶ | Metablism/proliferation/regulation |
| ENSG00000059728 | MXD1 | MAX dimerization protein 1 | −0.392 | 1.74 × 10⁻³ | Metablism/proliferation/regulation |
| ENSG00000170653 | ATF7 | activating transcription factor 7 | −0.340 | 1.15 × 10⁻⁸ | Metablism/proliferation/regulation |
| ENSG00000118922 | KLF12 | Kruppel like factor 12 | −0.272 | 3.37 × 10⁻⁴ | Metablism/proliferation/regulation |
| ENSG00000158711 | ELK4 | ETS transcription factor ELK4 | −0.266 | 1.36 × 10⁻⁴ | Metablism/proliferation/regulation |
| ENSG00000095951 | HIVEP1 | human immunodeficiency virus type I enhancer binding protein 1 | −0.305 | 1.59 × 10⁻⁶ | Metablism/proliferation/regulation |
| ENSG00000119314 | PTBP3 | polypyrimidine tract binding protein 3 | −0.309 | 1.49 × 10⁻⁷ | Metablism/proliferation/regulation |
| ENSG00000173889 | PHC3 | polyhomeotic homolog 3 | −0.265 | 3.70 × 10⁻¹⁰ | Metablism/proliferation/regulation |
| ENSG00000099250 | NRP1 | neuropilin 1 | −0.302 | 1.84 × 10⁻¹² | Metablism/proliferation/regulation |
| ENSG00000091409 | ITGA6 | integrin subunit alpha 6 | −0.277 | 4.73 × 10⁻⁴ | Metablism/proliferation/regulation |
| ENSG00000148841 | ITPRIP | inositol 1,4,5-trisphosphate receptor interacting protein | −0.961 | 1.51 × 10−44 | Metablism/proliferation/regulation |
| ENSG00000118503 | TNFAIP3 | TNF alpha induced protein 3 | −0.658 | 3.99 × 10⁻²⁵ | Metablism/proliferation/regulation |
| ENSG00000277075 | HIST1H2AE | histone cluster 1 H2A family member e | −0.403 | 2.84 × 10⁻⁴ | Metablism/proliferation/regulation |
| ENSG00000173611 | SCAI | suppressor of cancer cell invasion | −0.281 | 3.22 × 10⁻³ | Metablism/proliferation/regulation |
| ENSG00000197594 | ENPP1 | ectonucleotide pyrophosphatase/phosphodiesterase 1 | −0.293 | 1.62 × 10⁻⁴ | Metablism/proliferation/regulation |
| ENSG00000213064 | SFT2D2 | SFT2 domain containing 2 | −0.363 | 3.39 × 10⁻¹¹ | Metablism/proliferation/regulation |
| ENSG00000184897 | H1FX | H1 histone family member X | −0.307 | 1.90 × 10⁻⁴ | Metablism/proliferation/regulation |
| ENSG00000168298 | HIST1H1E | histone cluster 1 H1 family member e | −0.314 | 2.88 × 10⁻³ | Metablism/proliferation/regulation |
| ENSG00000163125 | RPRD2 | regulation of nuclear pre-mRNA domain containing 2 | −0.265 | 1.20 × 10⁻⁶ | Metablism/proliferation/regulation |
| ENSG00000148773 | MKI67 | marker of proliferation Ki-67 | −0.339 | 6.61 × 10⁻³ | Metablism/proliferation/regulation |
| ENSG00000164307 | ERAP1 | endoplasmic reticulum aminopeptidase 1 | −0.280 | 9.38 × 10⁻⁷ | Metablism/proliferation/regulation |
| ENSG00000076770 | MBNL3 | muscleblind like splicing regulator 3 | −0.269 | 1.35 × 10⁻² | Metablism/proliferation/regulation |
| ENSG00000139636 | LMBR1L | limb development membrane protein 1 like | 0.349 | 3.97 × 10⁻⁵ | Immune response |
| ENSG00000107281 | NPDC1 | neural proliferation, differentiation and control 1 | 0.279 | 3.67 × 10⁻⁴ | Immune response |
| ENSG00000121716 | PILRB | paired immunoglobin like type 2 receptor beta | 0.512 | 3.18 × 10⁻³ | Immune response |
| ENSG00000160360 | GPSM1 | G protein signaling modulator 1 | 0.316 | 1.77 × 10⁻⁹ | Immune response |
| ENSG00000104522 | TSTA3 | tissue specific transplantation antigen P35B | 0.289 | 1.26 × 10⁻² | Immune response |
| ENSG00000214279 | SCART1 | scavenger receptor family member expressed on T cells 1 | 0.588 | 1.35 × 10⁻⁷ | Immune response |
| ENSG00000169228 | RAB24 | RAB24, member RAS oncogene family | 0.286 | 3.64 × 10⁻³ | Immune response |
| ENSG0000010877 | DHX58 | DExH-box helicase 58 | 0.361 | 1.47 × 10⁻³ | Immune response |
| ENSG00000160072 | ATAD3B | ATPase family AAA domain containing 3B | 0.276 | 4.14 × 10⁻³ | Immune response |
| ENSG00000112715 | VEGFA | vascular endothelial growth factor A | 0.263 | 3.33 × 10⁻⁴ | Immune response |
| ENSG00000110719 | TCIRG1 | T cell immune regulator 1, ATPase H+ transporting V0 subunit a3 | 0.278 | 2.19 × 10⁻⁶ | Immune response |
| ENSG00000204104 | TRAF3IP1 | TRAF3 interacting protein 1 | 0.313 | 2.78 × 10⁻⁴ | Immune response |
| ENSG00000173531 | MST1 | macrophage stimulating 1 | 0.575 | 2.35 × 10⁻⁷ | Immune response |
| ENSG00000273802 | HIST1H2BG | histone cluster 1 H2B family member g | −0.339 | 5.97 × 10⁻⁴ | Immune response |
| ENSG00000277224 | HIST1H2BF | histone cluster 1 H2B family member f | −0.332 | 2.65 × 10⁻² | Immune response |
| ENSG00000135870 | RC3H1 | ring finger and CCCH-type domains 1 | −0.270 | 4.05 × 10⁻⁷ | Immune response |
| ENSG00000144802 | NFKBIZ | NFKB inhibitor zeta | −1.500 | 1.51 × 10⁻³² | Immune response |
| ENSG00000125730 | C3 | complement C3 | −0.321 | 2.55 × 10⁻¹⁷ | Immune response |
| ENSG00000184678 | HIST2H2BE | histone cluster 2 H2B family member e | −0.615 | 1.72 × 10⁻²⁰ | Immune response |
| ENSG00000164949 | GEM | GTP binding protein overexpressed in skeletal muscle | −1.068 | 2.18 × 10−56 | Immune response |
| ENSG00000113494 | PRLR | prolactin receptor | −0.372 | 3.94 × 10⁻³ | Immune response |
| ENSG00000069702 | TGFBR3 | transforming growth factor beta receptor 3 | −0.279 | 2.29 × 10⁻¹¹ | Immune response |
| ENSG00000121210 | TMEM131L | transmembrane 131 like | −0.281 | 1.44 × 10⁻² | Immune response |
| ENSG00000120738 | EGR1 | early growth response 1 | −2.195 | 0.00 | Immune response |
| ENSG00000181722 | ZBTB20 | zinc finger and BTB domain containing 20 | −0.511 | 4.80 × 10⁻²² | Immune response |
| ENSG00000067992 | PDK3 | pyruvate dehydrogenase kinase 3 | −0.294 | 2.41 × 10⁻³ | Immune response |
| ENSG00000157764 | BRAF | B-Raf proto-oncogene, serine/threonine kinase | −0.277 | 1.91 × 10⁻⁵ | Immune response |
| ENSG00000249437 | NAIP | NLR family apoptosis inhibitory protein | −0.318 | 7.20 × 10⁻³ | Immune response |
| ENSG00000131016 | AKAP12 | A-kinase anchoring protein 12 | −0.494 | 1.87 × 10⁻²⁰ | Immune response |
| ENSG00000106089 | STX1A | syntaxin 1A | 0.438 | 2.44 × 10⁻² | inflammatory response |
| ENSG00000185338 | SOCS1 | suppressor of cytokine signaling 1 | 0.351 | 6.41 × 10⁻⁴ | inflammatory response |
| ENSG00000136244 | IL6 | interleukin 6 | −2.301 | 4.19 × 10−65 | inflammatory response |
| ENSG00000172292 | CERS6 | ceramide synthase 6 | −0.286 | 5.45 × 10⁻⁵ | inflammatory response |
| ENSG00000170345 | FOS | Fos proto-oncogene, AP-1 transcription factor subunit | −2.530 | 1.24 × 10−62 | inflammatory response |
| ENSG00000101966 | XIAP | X-linked inhibitor of apoptosis | −0.276 | 3.96 × 10⁻⁶ | inflammatory response |
| ENSG00000169429 | CXCL8 | C-X-C motif chemokine ligand 8 | −0.572 | 3.49 × 10⁻⁴ | inflammatory response |
| ENSG00000081041 | CXCL2 | C-X-C motif chemokine ligand 2 | −1.212 | 3.32 × 10⁻²⁹ | inflammatory response |
| ENSG00000128016 | ZFP36 | ZFP36 ring finger protein | −1.515 | 1.97 × 10−82 | inflammatory response |
| ENSG00000179954 | SSC5D | scavenger receptor cysteine rich family member with 5 domains | −0.307 | 3.19 × 10⁻⁷ | inflammatory response |
| ENSG00000100906 | NFKBIA | NFKB inhibitor alpha | −0.406 | 3.02 × 10⁻¹⁴ | inflammatory response |
| ENSG00000034152 | MAP2K3 | mitogen-activated protein kinase kinase 3 | −0.402 | 3.85 × 10⁻¹² | inflammatory response |
| ENSG00000172817 | CYP7B1 | cytochrome P450 family 7 subfamily B member 1 | −0.377 | 7.82 × 10⁻³ | inflammatory response |
| ENSG00000173992 | CCS | copper chaperone for superoxide dismutase | 0.283 | 5.84 × 10⁻³ | Response to oxidative stress |
| ENSG00000002016 | RAD52 | RAD52 homolog, DNA repair protein | 0.297 | 1.52 × 10⁻² | Response to oxidative stress |
| ENSG00000172780 | RAB43 | RAB43, member RAS oncogene family | 0.311 | 5.51 × 10⁻³ | Response to oxidative stress |
| ENSG00000103245 | CIAO3 | cytosolic iron-sulfur assembly component 3 | 0.324 | 2.22 × 10⁻² | Response to oxidative stress |
| ENSG00000163516 | ANKZF1 | ankyrin repeat and zinc finger peptidyl tRNA hydrolase 1 | 0.292 | 1.87 × 10⁻⁴ | Response to oxidative stress |
| ENSG00000140398 | NEIL1 | nei like DNA glycosylase 1 | 0.459 | 4.10 × 10⁻⁵ | Response to oxidative stress |
| ENSG00000159363 | ATP13A2 | ATPase cation transporting 13A2 | 0.284 | 3.52 × 10⁻² | Response to oxidative stress |
| ENSG00000151012 | SLC7A11 | solute carrier family 7 member11 | −0.327 | 2.98 × 10⁻⁴ | Response to oxidative stress |
| ENSG00000172115 | CYCS | cytochrome c, somatic | −0.323 | 3.86 × 10⁻⁴ | Response to oxidative stress |
| ENSG00000146648 | EGFR | epidermal growth factor receptor | −0.303 | 3.91 × 10⁻¹⁹ | Response to oxidative stress |
| ENSG00000198840 | MT-ND3 | mitochondrially encoded NADH: ubiquinone oxidoreductase core subunit 3 | −0.477 | 6.34 × 10⁻¹⁴ | Response to oxidative stress |
| ENSG00000158615 | PPP1R15B | protein phosphatase 1 regulatory subunit 15B | −0.631 | 1.15 × 10−36 | Response to oxidative stress |
| ENSG00000109819 | PPARGC1A | PPARG coactivator 1 alpha | −0.285 | 1.53 × 10⁻² | Response to oxidative stress |
| ENSG00000137449 | CPEB2 | cytoplasmic polyadenylation element binding protein 2 | −0.313 | 9.29 × 10⁻⁶ | Response to oxidative stress |
| ENSG00000198763 | MT-ND2 | mitochondrially encoded NADH: ubiquinone oxidoreductase core subunit 2 | −0.463 | 3.74 × 10⁻¹⁸ | Response to oxidative stress |
| ENSG00000198786 | MT-ND5 | mitochondrially encoded NADH: ubiquinone oxidoreductase core subunit 5 | −0.493 | 3.60 × 10⁻⁴ | Response to oxidative stress |
| ENSG00000198886 | MT-ND4 | mitochondrially encoded NADH: ubiquinone oxidoreductase core subunit 4 | −0.556 | 4.78 × 10⁻⁴ | Response to oxidative stress |
| ENSG00000198888 | MT-ND1 | mitochondrially encoded NADH: ubiquinone oxidoreductase core subunit 1 | −0.511 | 1.15 × 10⁻⁵ | Response to oxidative stress |
| ENSG00000212907 | MT-ND4L | mitochondrially encoded NADH: ubiquinone oxidoreductase core subunit 4L | −0.467 | 2.65 × 10⁻³ | Response to oxidative stress |
| ENSG00000132510 | KDM6B | lysine demethylase 6B | −0.543 | 1.21 × 10⁻¹⁸ | Response to oxidative stress |
| ENSG00000198712 | MT-CO2 | mitochondrially encoded cytochrome c oxidase II | −0.397 | 2.79 × 10⁻³ | Response to oxidative stress |
| ENSG00000143322 | ABL2 | ABL proto-oncogene 2, non-receptor tyrosine kinase | −0.359 | 9.88 × 10⁻¹⁴ | Response to oxidative stress |
| ENSG00000127528 | KLF2 | Kruppel like factor 2 | −1.221 | 4.51 × 10⁻¹⁴ | Response to oxidative stress |
| ENSG00000286268 | AF196969.1 | novel protein | 0.712 | 9.99 × 10⁻³ | Lipids |
| ENSG00000100288 | CHKB | choline kinase beta | 0.359 | 6.43 × 10⁻⁵ | Lipids |
| ENSG00000132793 | LPIN3 | lipin 3 | 0.342 | 2.57 × 10⁻⁸ | Lipids |
| ENSG00000243708 | PLA2G4B | phospholipase A2 group IVB | 0.565 | 1.56 × 10⁻² | Lipids |
| ENSG00000240303 | ACAD11 | acyl-CoA dehydrogenase family member 11 | 0.284 | 9.86 × 10⁻³ | Lipids |
| ENSG00000072778 | ACADVL | acyl-CoA dehydrogenase very long chain | 0.268 | 7.46 × 10⁻¹⁰ | Lipids |
| ENSG00000197943 | PLCG2 | phospholipase C gamma 2 | 0.310 | 5.49 × 10⁻³ | Lipids |
| ENSG00000102125 | TAZ | tafazzin | 0.408 | 5.69 × 10⁻⁴ | Lipids |
| ENSG00000111664 | GNB3 | G protein subunit beta 3 | 0.506 | 3.20 × 10⁻² | Lipids |
| ENSG00000123689 | G0S2 | G0/G1 switch 2 | −0.470 | 4.89 × 10⁻² | Lipids |
| ENSG00000073756 | PTGS2 | prostaglandin-endoperoxide synthase 2 | −2.220 | 1.77 × 10⁻¹³ | Lipids |
| ENSG00000151176 | PLBD2 | phospholipase B domain containing 2 | −0.446 | 2.90 × 10⁻¹⁸ | Lipids |
| ENSG00000137642 | SORL1 | sortilin related receptor 1 | −0.407 | 3.23 × 10⁻² | Lipids |
| ENSG00000172954 | LCLAT1 | lysocardiolipin acyltransferase 1 | −0.319 | 9.16 × 10⁻⁵ | Lipids |
| ENSG00000171132 | PRKCE | protein kinase C epsilon | −0.267 | 4.13 × 10⁻⁴ | Lipids |
| ENSG00000165029 | ABCA1 | ATP binding cassette subfamily A member 1 | −0.299 | 1.82 × 10⁻¹³ | Lipids |
| ENSG00000117600 | PLPPR4 | phospholipid phosphatase related 4 | −0.311 | 1.43 × 10⁻³ | Lipids |
| ENSG00000147872 | PLIN2 | perilipin 2 | −0.340 | 8.19 × 10⁻¹⁵ | Lipids |
| ENSG00000140474 | ULK3 | unc-51 like kinase 3 | 0.302 | 4.43 × 10⁻³ | Communication |
| ENSG00000204084 | INPP5B | inositol polyphosphate-5-phosphatase B | 0.295 | 3.88 × 10⁻⁵ | Communication |
| ENSG00000170153 | RNF150 | ring finger protein 150 | −0.340 | 4.94 × 10⁻⁹ | Communication |
| ENSG00000198753 | PLXNB3 | plexin B3 | −0.372 | 1.56 × 10⁻³ | Communication |
| ENSG00000184226 | PCDH9 | protocadherin 9 | −0.439 | 2.47 × 10⁻⁴ | Communication |
| ENSG00000253537 | PCDHGA7 | protocadherin gamma subfamily A, 7 | −0.264 | 4.29 × 10⁻³ | Communication |
| ENSG00000253873 | PCDHGA11 | protocadherin gamma subfamily A, 11 | −0.302 | 9.94 × 10⁻⁴ | Communication |
| ENSG00000189152 | GRAPL | GRB2 related adaptor protein like | −0.270 | 1.68 × 10⁻⁵ | Communication |
| ENSG00000187678 | SPRY4 | sprouty RTK signaling antagonist 4 | −0.310 | 1.38 × 10⁻⁴ | Communication |
| ENSG00000075568 | TMEM131 | transmembrane protein 131 | −0.268 | 1.03 × 10⁻⁸ | Communication |
| ENSG00000013588 | GPRC5A | G protein-coupled receptor class C group 5 member A | −0.422 | 1.06 × 10⁻¹⁰ | Communication |
| ENSG00000113441 | LNPEP | leucyl and cystinyl aminopeptidase | −0.336 | 1.61 × 10⁻⁹ | Communication |
| ENSG00000158258 | CLSTN2 | calsyntenin 2 | −0.388 | 9.23 × 10⁻¹⁰ | Communication |
| ENSG00000091129 | NRCAM | neuronal cell adhesion molecule | −0.346 | 1.21 × 10⁻³ | Communication |
| ENSG00000083857 | FAT1 | FAT atypical cadherin 1 | −0.387 | 4.48 × 10⁻³³ | Communication |
| ENSG00000070018 | LRP6 | LDL receptor related protein 6 | −0.284 | 1.70 × 10⁻⁸ | Communication |
| ENSG00000253953 | PCDHGB4 | protocadherin gamma subfamily B, 4 | −0.269 | 5.57 × 10⁻⁴ | Communication |
| ENSG00000134982 | APC | APC regulator of WNT signaling pathway | −0.282 | 2.50 × 10⁻⁷ | Communication |
| ENSG00000112902 | SEMA5A | semaphorin 5A | −0.341 | 1.31 × 10⁻²⁵ | Communication |
| ENSG00000218336 | TENM3 | teneurin transmembrane protein 3 | −0.304 | 9.06 × 10⁻⁴ | Communication |
| ENSG00000165124 | SVEP1 | sushi, von Willebrand factor type A, EGF and pentraxin domain containing 1 | −0.481 | 7.92 × 10−36 | Communication |
| ENSG00000123096 | SSPN | sarcospan | −0.315 | 1.10 × 10⁻⁴ | Communication |
| ENSG00000145012 | LPP | LIM domain containing preferred translocation partner in lipoma | −0.319 | 2.31 × 10⁻¹⁵ | Communication |
| ENSG00000067141 | NEO1 | neogenin 1 | −0.272 | 2.21 × 10⁻⁷ | Communication |
| ENSG00000196159 | FAT4 | FAT atypical cadherin 4 | −0.318 | 2.88 × 10⁻¹² | Communication |
| ENSG00000143341 | HMCN1 | hemicentin 1 | −0.421 | 2.95 × 10⁻⁴ | Communication |
| ENSG00000078401 | EDN1 | endothelin 1 | −0.429 | 3.86 × 10⁻³ | Response to stimulus |
| ENSG00000135999 | EPC2 | enhancer of polycomb homolog 2 | −0.284 | 7.13 × 10⁻⁴ | Response to stimulus |
| ENSG00000283321 | AC019117.3 | novel protein | −0.337 | 5.32 × 10⁻³ | Response to stimulus |
| ENSG00000110395 | CBL | Cbl proto-oncogene | −0.303 | 2.57 × 10⁻⁸ | Response to stimulus |
| ENSG00000114933 | INO80D | INO80 complex subunit D | −0.303 | 6.43 × 10⁻⁷ | Response to stimulus |
| ENSG00000130522 | JUND | JunD proto-oncogene, AP-1 transcription factor subunit | −0.681 | 5.90 × 10⁻³⁰ | Response to stimulus |
| ENSG00000120129 | DUSP1 | dual specificity phosphatase 1 | −2.123 | 1.05 × 10−267 | Response to stimulus |
| ENSG00000148339 | SLC25A25 | solute carrier family 25 member25 | −0.303 | 6.18 × 10⁻⁴ | Response to stimulus |
| ENSG00000125740 | FOSB | FosB proto-oncogene, AP-1 transcription factor subunit | −4.090 | 0.00 | Response to stimulus |
| ENSG00000198727 | MT-CYB | mitochondrially encoded cytochrome b | −0.320 | 3.34 × 10⁻⁸ | Response to stimulus |
| ENSG00000177694 | NAALADL2 | N-acetylated alpha-linked acidic dipeptidase like 2 | −0.320 | 1.80 × 10⁻⁴ | Response to stimulus |
| ENSG00000184557 | SOCS3 | suppressor of cytokine signaling 3 | −0.506 | 6.46 × 10⁻⁷ | Response to stimulus |
| ENSG00000159167 | STC1 | stanniocalcin 1 | −0.534 | 1.49 × 10⁻⁴ | Response to stimulus |
| ENSG00000164603 | BMT2 | base methyltransferase of 25S rRNA 2 homolog | −0.323 | 1.14 × 10⁻² | Response to stimulus |
| ENSG00000181072 | CHRM2 | cholinergic receptor muscarinic 2 | −0.273 | 2.59 × 10⁻³ | Response to stimulus |
| ENSG00000132635 | PCED1A | PC-esterase domain containing 1A | 0.280 | 1.88 × 10⁻³ | Unknown |
| ENSG00000186166 | CCDC84 | coiled-coil domain containing 84 | 0.282 | 7.88 × 10⁻⁷ | Unknown |
| ENSG00000117616 | RSRP1 | arginine and serine rich protein 1 | 0.347 | 1.04 × 10⁻⁹ | Unknown |
| ENSG00000214193 | SH3D21 | SH3 domain containing 21 | 0.284 | 1.03 × 10⁻² | Unknown |
| ENSG00000134884 | ARGLU1 | arginine and glutamate rich 1 | 0.289 | 9.33 × 10⁻⁶ | Unknown |
| ENSG00000268350 | FAM156A | family with sequence similarity 156 member A | 0.449 | 9.92 × 10⁻⁵ | Unknown |
| ENSG00000182700 | IGIP | IgA inducing protein | 0.400 | 3.33 × 10⁻⁴ | Unknown |
| ENSG00000140365 | COMMD4 | COMM domain containing 4 | 0.319 | 1.83 × 10⁻⁴ | Unknown |
| ENSG00000146067 | FAM193B | family with sequence similarity 193 member B | 0.285 | 7.51 × 10⁻³ | Unknown |
| ENSG00000014914 | MTMR11 | myotubularin related protein 11 | 0.286 | 1.90 × 10⁻² | Unknown |
| ENSG00000148341 | SH3GLB2 | SH3 domain containing GRB2 like, endophilin B2 | 0.278 | 1.62 × 10⁻⁴ | Unknown |
| ENSG00000188483 | IER5L | immediate early response 5 like | 0.325 | 1.54 × 10⁻² | Unknown |
| ENSG00000135637 | CCDC142 | coiled-coil domain containing 142 | 0.407 | 1.10 × 10⁻⁴ | Unknown |
| ENSG00000213563 | C8orf82 | chromosome 8 open reading frame 82 | 0.275 | 5.43 × 10⁻³ | Unknown |
| ENSG00000143469 | SYT14 | synaptotagmin 14 | −0.272 | 8.77 × 10⁻⁴ | Unknown |
| ENSG00000215472 | RPL17-C18orf32 | RPL17-C18orf32 readthrough | −0.298 | 6.96 × 10⁻³ | Unknown |
| Gene_Id | Gene Name | Gene Description | Log2FC | P-Adjust | Function |
|---|---|---|---|---|---|
| ENSG00000113494 | PRLR | prolactin receptor | 1.509 | 2.51 × 10⁻⁴ | immune response |
| ENSG00000124882 | EREG | epiregulin | 1.029 | 1.75 × 10⁻¹⁰ | immune response |
| ENSG00000128271 | ADORA2A | adenosine A2a receptor | 1.938 | 1.64 × 10⁻¹⁰ | immune response |
| ENSG00000160224 | AIRE | autoimmune regulator | 1.490 | 1.30 × 10⁻² | immune response |
| ENSG00000169508 | GPR183 | G protein-coupled receptor 183 | 2.593 | 2.80 × 10⁻³ | immune response |
| ENSG00000198805 | PNP | purine nucleoside phosphorylase | 1.397 | 1.63 × 10⁻⁴ | immune response |
| ENSG00000105088 | OLFM2 | olfactomedin 2 | 1.794 | 6.44 × 10⁻⁹ | immune response |
| ENSG00000243509 | TNFRSF6B | TNF receptor superfamily member 6b | 1.875 | 3.16 × 10⁻⁵ | immune response |
| ENSG00000113070 | HBEGF | heparin binding EGF like growth factor | 1.237 | 4.11 × 10⁻² | immune response |
| ENSG00000122861 | PLAU | plasminogen activator, urokinase | 1.872 | 5.61 × 10⁻³⁵ | immune response |
| ENSG00000284337 | AC013271.1 | LIM and senescent cell antigen-like-containing domain protein 3 | 1.835 | 6.10 × 10⁻⁴ | immune response |
| ENSG00000198535 | C2CD4A | C2 calcium dependent domain containing 4A | 2.260 | 2.90 × 10⁻⁷ | immune response |
| ENSG00000237264 | FTH1P11 | ferritin heavy chain 1 pseudogene 11 | 4.468 | 4.70 × 10⁻² | immune response |
| ENSG00000219507 | FTH1P8 | ferritin heavy chain 1 pseudogene 8 | 6.317 | 1.68 × 10⁻² | immune response |
| ENSG00000160223 | ICOSLG | inducible T-cell costimulator ligand | 1.226 | 1.85 × 10⁻² | immune response |
| ENSG00000211772 | TRBC2 | T-cell receptor beta constant 2 | 1.185 | 1.65 × 10⁻² | immune response |
| ENSG00000110031 | LPXN | leupaxin | 2.068 | 9.53 × 10⁻¹² | immune response |
| ENSG00000028277 | POU2F2 | POU class 2 homeobox 2 | 1.447 | 7.46 × 10⁻²¹ | immune response |
| ENSG00000076641 | PAG1 | phosphoprotein membrane anchor with glycosphingolipid microdomains 1 | 1.396 | 8.91 × 10⁻⁷ | immune response |
| ENSG00000173457 | PPP1R14B | protein phosphatase 1 regulatory inhibitor subunit 14B | 1.476 | 2.28 × 10⁻² | immune response |
| ENSG00000131187 | F12 | coagulation factor XII | 1.808 | 4.49 × 10⁻² | immune response |
| ENSG00000131015 | ULBP2 | UL16 binding protein 2 | 1.169 | 3.47 × 10⁻² | immune response |
| ENSG00000069702 | TGFBR3 | transforming growth factor beta receptor 3 | −1.074 | 4.18 × 10⁻³ | Immune response |
| ENSG00000138735 | PDE5A | phosphodiesterase 5A | −1.754 | 3.76 × 10⁻¹³ | Immune response |
| ENSG00000164764 | SBSPON | somatomedin B and thrombospondin type 1 domain containing | −1.973 | 3.06 × 10⁻³ | Immune response |
| ENSG00000089127 | OAS1 | 2′-5′-oligoadenylate synthetase 1 | −1.399 | 4.55 × 10⁻⁴ | Immune response |
| ENSG00000066735 | KIF26A | kinesin family member 26A | −1.743 | 1.91 × 10⁻⁴ | Immune response |
| ENSG00000120885 | CLU | clusterin | −1.346 | 1.07 × 10⁻¹¹ | Immune response |
| ENSG00000136869 | TLR4 | toll like receptor 4 | −1.989 | 7.89 × 10⁻⁶ | Immune response |
| ENSG00000164342 | TLR3 | toll like receptor 3 | −2.064 | 2.85 × 10⁻⁴ | Immune response |
| ENSG00000159403 | C1R | complement C1r | −1.476 | 6.54 × 10⁻¹⁰ | Immune response |
| ENSG00000182326 | C1S | complement C1s | −1.331 | 6.39 × 10⁻¹⁴ | Immune response |
| ENSG00000120899 | PTK2B | protein tyrosine kinase 2 beta | −2.970 | 6.43 × 10⁻³¹ | Immune response |
| ENSG00000130303 | BST2 | bone marrow stromal cell antigen 2 | −1.112 | 7.88 × 10⁻³ | Immune response |
| ENSG00000158270 | COLEC12 | collectin subfamily member 12 | −1.382 | 2.11 × 10⁻⁷ | Immune response |
| ENSG00000244731 | C4A | complement C4A (Rodgers blood group) | −2.248 | 3.26 × 10⁻⁶ | Immune response |
| ENSG00000224389 | C4B | complement C4B (Chido blood group) | −1.643 | 2.40 × 10⁻³ | Immune response |
| ENSG00000205403 | CFI | complement factor I | −1.319 | 7.62 × 10⁻⁵ | Immune response |
| ENSG00000243649 | CFB | complement factor B | −2.221 | 1.40 × 10⁻²⁶ | Immune response |
| ENSG00000197766 | CFD | complement factor D | −1.657 | 2.00 × 10⁻² | Immune response |
| ENSG00000000971 | CFH | complement factor H | −1.106 | 1.44 × 10⁻¹² | Immune response |
| ENSG00000125730 | C3 | complement C3 | −1.190 | 3.38 × 10⁻⁴ | Immune response |
| ENSG00000185745 | IFIT1 | interferon induced protein with tetratricopeptide repeats 1 | −1.393 | 2.81 × 10⁻⁷ | Immune response |
| ENSG00000091972 | CD200 | CD200 molecule | −1.694 | 2.28 × 10⁻³ | Immune response |
| ENSG00000111331 | OAS3 | 2′-5′-oligoadenylate synthetase 3 | −1.246 | 3.53 × 10⁻² | Immune response |
| ENSG00000101347 | SAMHD1 | SAM and HD domain containing deoxynucleoside triphosphate triphosphohydrolase 1 | −1.048 | 1.57 × 10⁻² | Immune response |
| ENSG00000154188 | ANGPT1 | angiopoietin 1 | −1.648 | 7.33 × 10⁻⁹ | Immune response |
| ENSG00000107562 | CXCL12 | C-X-C motif chemokine ligand 12 | −2.798 | 5.70 × 10−42 | Immune response |
| ENSG00000142910 | TINAGL1 | tubulointerstitial nephritis antigen like 1 | −3.217 | 7.01 × 10⁻²⁵ | Immune response |
| ENSG00000106537 | TSPAN13 | tetraspanin 13 | 1.228 | 3.73 × 10⁻² | Transport |
| ENSG00000108932 | SLC16A6 | solute carrier family 16 member 6 | 1.447 | 1.76 × 10⁻⁸ | Transport |
| ENSG00000134955 | SLC37A2 | solute carrier family 37 member 2 | 1.488 | 6.86 × 10⁻⁵ | Transport |
| ENSG00000139508 | SLC46A3 | solute carrier family 46 member3 | 1.007 | 3.41 × 10⁻⁵ | Transport |
| ENSG00000101187 | SLCO4A1 | solute carrier organic anion transporter family member 4A1 | 1.354 | 1.02 × 10⁻⁷ | Transport |
| ENSG00000188643 | S100A16 | S100 calcium binding protein A16 | 1.023 | 6.96 × 10⁻³ | Transport |
| ENSG00000157445 | CACNA2D3 | calcium voltage-gated channel auxiliary subunit alpha2delta 3 | 1.659 | 1.37 × 10⁻² | Transport |
| ENSG00000069849 | ATP1B3 | ATPase Na+/K+ transporting subunit beta 3 | 1.100 | 3.43 × 10⁻² | Transport |
| ENSG00000166592 | RRAD | RRAD, Ras related glycolysis inhibitor and calcium channel regulator | 1.262 | 2.60 × 10⁻³ | Transport |
| ENSG00000159199 | ATP5G1 | ATP synthase, H+ transporting, mitochondrial Fo complex subunit C1 (subunit 9) | 1.329 | 4.87 × 10⁻² | Transport |
| ENSG00000166510 | CCDC68 | coiled-coil domain containing 68 | 1.072 | 1.66 × 10⁻⁴ | Transport |
| ENSG00000157551 | KCNJ15 | potassium voltage-gated channel subfamily J member 15 | 1.993 | 1.26 × 10⁻³ | Transport |
| ENSG00000157542 | KCNJ6 | potassium voltage-gated channel subfamily J member 6 | 2.391 | 3.83 × 10⁻⁵ | Transport |
| ENSG00000173114 | LRRN3 | leucine rich repeat neuronal 3 | 1.515 | 7.22 × 10⁻⁸ | Transport |
| ENSG00000171246 | NPTX1 | neuronal pentraxin 1 | 2.029 | 1.12 × 10⁻⁷ | Transport |
| ENSG00000259863 | SH3RF3-AS1 | SH3RF3 antisense RNA 1 | 2.013 | 6.87 × 10⁻⁷ | Transport |
| ENSG00000102287 | GABRE | gamma-aminobutyric acid type A receptor epsilon subunit | −1.296 | 2.76 × 10⁻⁶ | Transport |
| ENSG00000198691 | ABCA4 | ATP binding cassette subfamily A member 4 | −1.740 | 1.07 × 10⁻¹¹ | Transport |
| ENSG00000221955 | SLC12A8 | solute carrier family 12 member 8 | −1.424 | 5.81 × 10⁻⁷ | Transport |
| ENSG00000162383 | SLC1A7 | solute carrier family 1 member 7 | −1.588 | 1.17 × 10⁻³ | Transport |
| ENSG00000146411 | SLC2A12 | solute carrier family 2 member 12 | −1.807 | 1.49 × 10⁻⁶ | Transport |
| ENSG00000169507 | SLC38A11 | solute carrier family 38 member 11 | −2.235 | 7.62 × 10⁻¹⁰ | Transport |
| ENSG00000139209 | SLC38A4 | solute carrier family 38 member 4 | −1.638 | 1.79 × 10⁻⁴ | Transport |
| ENSG00000138821 | SLC39A8 | solute carrier family 39 member 8 | −1.053 | 6.51 × 10⁻⁷ | Transport |
| ENSG00000138449 | SLC40A1 | solute carrier family 40 member 1 | −1.479 | 7.54 × 10⁻⁸ | Transport |
| ENSG00000013293 | SLC7A14 | solute carrier family 7 member 14 | −1.849 | 2.46 × 10⁻⁶ | Transport |
| ENSG00000181804 | SLC9A9 | solute carrier family 9 member A9 | −1.018 | 4.45 × 10⁻³ | Transport |
| ENSG00000168356 | SCN11A | sodium voltage-gated channel alpha subunit 11 | −1.637 | 4.59 × 10⁻² | Transport |
| ENSG00000144285 | SCN1A | sodium voltage-gated channel alpha subunit 1 | −4.979 | 1.95 × 10⁻³ | Transport |
| ENSG00000151572 | ANO4 | anoctamin 4 | −1.308 | 5.69 × 10⁻¹¹ | Transport |
| ENSG00000145362 | ANK2 | ankyrin 2 | −2.002 | 3.71 × 10⁻⁶ | Transport |
| ENSG00000111859 | NEDD9 | neural precursor cell expressed, developmentally down-regulated 9 | −1.118 | 5.58 × 10⁻⁶ | Transport |
| ENSG00000144645 | OSBPL10 | oxysterol binding protein like 10 | −1.097 | 1.63 × 10⁻⁴ | Transport |
| ENSG00000162687 | KCNT2 | potassium sodium-activated channel subfamily T member 2 | −2.348 | 1.96 × 10⁻³ | Transport |
| ENSG00000135643 | KCNMB4 | potassium calcium-activated channel subfamily M regulatory beta subunit 4 | −1.242 | 1.75 × 10⁻⁴ | Transport |
| ENSG00000143028 | SYPL2 | synaptophysin like 2 | −1.197 | 2.42 × 10⁻⁵ | Transport |
| ENSG00000089472 | HEPH | hephaestin | −1.250 | 2.79 × 10⁻⁶ | Transport |
| ENSG00000166473 | PKD1L2 | polycystin 1 like 2 (gene/pseudogene) | −1.796 | 1.07 × 10⁻¹¹ | Transport |
| ENSG00000143416 | SELENBP1 | selenium binding protein 1 | −1.411 | 1.75 × 10⁻¹⁹ | Transport |
| ENSG00000175538 | KCNE3 | potassium voltage-gated channel subfamily E regulatory subunit 3 | −2.405 | 1.46 × 10⁻⁵ | Transport |
| ENSG00000055732 | MCOLN3 | mucolipin 3 | −1.027 | 1.32 × 10⁻³ | Transport |
| ENSG00000172548 | NIPAL4 | NIPA like domain containing 4 | −1.999 | 4.27 × 10⁻² | Transport |
| ENSG00000003137 | CYP26B1 | cytochrome P450 family 26 subfamily B member 1 | 1.217 | 9.43 × 10⁻⁵ | Intracellular and extracellular matrix |
| ENSG00000058085 | LAMC2 | laminin subunit gamma 2 | 1.484 | 1.02 × 10⁻⁴ | Intracellular and extracellular matrix |
| ENSG00000138316 | ADAMTS14 | ADAM metallopeptidase with thrombospondin type 1 motif 14 | 1.501 | 3.47 × 10⁻⁵ | Intracellular and extracellular matrix |
| ENSG00000135346 | CGA | glycoprotein hormones, alpha polypeptide | 3.014 | 2.16 × 10⁻⁵ | Intracellular and extracellular matrix |
| ENSG00000163347 | CLDN1 | claudin 1 | 1.065 | 1.97 × 10⁻⁶ | Intracellular and extracellular matrix |
| ENSG00000123500 | COL10A1 | collagen type X alpha 1 chain | 1.206 | 4.22 × 10⁻² | Intracellular and extracellular matrix |
| ENSG00000197467 | COL13A1 | collagen type XIII alpha 1 chain | 1.299 | 2.71 × 10⁻⁷ | Intracellular and extracellular matrix |
| ENSG00000080573 | COL5A3 | collagen type V alpha 3 chain | 1.535 | 3.48 × 10⁻⁷ | Intracellular and extracellular matrix |
| ENSG00000143127 | ITGA10 | integrin subunit alpha 10 | 1.596 | 9.82 × 10⁻⁵ | Intracellular and extracellular matrix |
| ENSG00000137809 | ITGA11 | integrin subunit alpha 11 | 1.284 | 2.46 × 10⁻³ | Intracellular and extracellular matrix |
| ENSG00000164171 | ITGA2 | integrin subunit alpha 2 | 1.034 | 9.75 × 10⁻³ | Intracellular and extracellular matrix |
| ENSG00000005884 | ITGA3 | integrin subunit alpha 3 | 1.065 | 3.37 × 10⁻⁶ | Intracellular and extracellular matrix |
| ENSG00000196611 | MMP1 | matrix metallopeptidase 1 | 2.713 | 3.61 × 10−68 | Intracellular and extracellular matrix |
| ENSG00000166670 | MMP10 | matrix metallopeptidase 10 | 3.191 | 2.09 × 10⁻⁴ | Intracellular and extracellular matrix |
| ENSG00000156103 | MMP16 | matrix metallopeptidase 16 | 1.229 | 8.60 × 10⁻⁶ | Intracellular and extracellular matrix |
| ENSG00000149968 | MMP3 | matrix metallopeptidase 3 | 3.076 | 9.37 × 10−44 | Intracellular and extracellular matrix |
| ENSG00000104368 | PLAT | plasminogen activator, tissue type | 1.692 | 1.03 × 10⁻³² | Intracellular and extracellular matrix |
| ENSG00000196581 | AJAP1 | adherens junctions associated protein 1 | 1.032 | 8.97 × 10⁻⁵ | Intracellular and extracellular matrix |
| ENSG00000182667 | NTM | neurotrimin | 2.160 | 2.03 × 10⁻²⁵ | Intracellular and extracellular matrix |
| ENSG00000261371 | PECAM1 | platelet and endothelial cell adhesion molecule 1 | 2.965 | 1.05 × 10⁻⁷ | Intracellular and extracellular matrix |
| ENSG00000235649 | MXRA5Y | matrix remodeling associated 5, Y-linked (pseudogene) | −1.849 | 3.32 × 10⁻² | Cellular and extracellular matrix |
| ENSG00000124749 | COL21A1 | collagen type XXI alpha 1 chain | −3.204 | 7.20 × 10⁻²² | Cellular and extracellular matrix |
| ENSG00000049089 | COL9A2 | collagen type IX alpha 2 chain | −1.606 | 1.01 × 10⁻³ | Cellular and extracellular matrix |
| ENSG00000060718 | COL11A1 | collagen type XI alpha 1 chain | −1.577 | 1.44 × 10⁻⁴ | Cellular and extracellular matrix |
| ENSG00000187955 | COL14A1 | collagen type XIV alpha 1 chain | −2.288 | 8.17 × 10⁻¹⁶ | Cellular and extracellular matrix |
| ENSG00000168077 | SCARA3 | scavenger receptor class A member 3 | −1.422 | 1.51 × 10⁻¹⁸ | Cellular and extracellular matrix |
| ENSG00000106823 | ECM2 | extracellular matrix protein 2 | −2.612 | 3.11 × 10⁻³ | Cellular and extracellular matrix |
| ENSG00000242600 | MBL1P | mannose binding lectin 1, pseudogene | −1.941 | 1.06 × 10⁻² | Cellular and extracellular matrix |
| ENSG00000166482 | MFAP4 | microfibrillar associated protein 4 | −1.966 | 1.51 × 10⁻²⁶ | Cellular and extracellular matrix |
| ENSG00000165272 | AQP3 | aquaporin 3 (Gill blood group) | −1.789 | 4.63 × 10⁻¹¹ | Cellular and extracellular matrix |
| ENSG00000138829 | FBN2 | fibrillin 2 | −1.036 | 1.55 × 10⁻² | Cellular and extracellular matrix |
| ENSG00000123243 | ITIH5 | inter-alpha-trypsin inhibitor heavy chain family member 5 | −1.312 | 7.45 × 10⁻⁴ | Cellular and extracellular matrix |
| ENSG00000049540 | ELN | elastin | −1.271 | 2.11 × 10⁻⁴ | Cellular and extracellular matrix |
| ENSG00000183798 | EMILIN3 | elastin microfibril interfacer 3 | −1.626 | 8.81 × 10⁻⁴ | Cellular and extracellular matrix |
| ENSG00000091986 | CCDC80 | coiled-coil domain containing 80 | −1.606 | 9.31 × 10⁻⁷ | Cellular and extracellular matrix |
| ENSG00000135424 | ITGA7 | integrin subunit alpha 7 | −1.024 | 1.29 × 10⁻⁴ | Cellular and extracellular matrix |
| ENSG00000196569 | LAMA2 | laminin subunit alpha 2 | −1.840 | 1.50 × 10⁻⁵ | Cellular and extracellular matrix |
| ENSG00000132470 | ITGB4 | integrin subunit beta 4 | −1.792 | 1.98 × 10⁻¹¹ | Cellular and extracellular matrix |
| ENSG00000105855 | ITGB8 | integrin subunit beta 8 | −1.390 | 1.53 × 10⁻⁶ | Cellular and extracellular matrix |
| ENSG00000205221 | VIT | vitrin | −2.675 | 4.97 × 10⁻³ | Cellular and extracellular matrix |
| ENSG00000122707 | RECK | reversion inducing cysteine rich protein with kazal motifs | −1.066 | 7.99 × 10⁻⁶ | Cellular and extracellular matrix |
| ENSG00000169908 | TM4SF1 | transmembrane 4 L six family member 1 | 1.509 | 4.14 × 10⁻⁶ | Metabolism/Cell Proliferation/Regulation |
| ENSG00000157064 | NMNAT2 | nicotinamide nucleotide adenylyltransferase 2 | 1.159 | 5.85 × 10⁻³ | Metabolism/Cell Proliferation/Regulation |
| ENSG00000165891 | E2F7 | E2F transcription factor 7 | 1.276 | 4.50 × 10⁻⁵ | Metabolism/Cell Proliferation/Regulation |
| ENSG00000128965 | CHAC1 | ChaC glutathione specific gamma-glutamylcyclotransferase 1 | 1.667 | 1.34 × 10⁻⁷ | Metabolism/Cell Proliferation/Regulation |
| ENSG00000185697 | MYBL1 | MYB proto-oncogene like 1 | 1.393 | 9.20 × 10⁻¹² | Metabolism/Cell Proliferation/Regulation |
| ENSG00000168405 | CMAHP | cytidine monophospho-N-acetylneuraminic acid hydroxylase, pseudogene | 1.120 | 1.46 × 10⁻³ | Metabolism/Cell Proliferation/Regulation |
| ENSG00000137331 | IER3 | immediate early response 3 | 1.390 | 4.21 × 10⁻⁷ | Metabolism/Cell Proliferation/Regulation |
| ENSG00000124802 | EEF1E1 | eukaryotic translation elongation factor 1 epsilon 1 | 1.325 | 2.52 × 10⁻² | Metabolism/Cell Proliferation/Regulation |
| ENSG00000170498 | KISS1 | KiSS-1 metastasis-suppressor | 2.954 | 1.23 × 10⁻² | Metabolism/Cell Proliferation/Regulation |
| ENSG00000118523 | CTGF | connective tissue growth factor | 1.010 | 6.38 × 10⁻⁴ | Metabolism/Cell Proliferation/Regulation |
| ENSG00000140379 | BCL2A1 | BCL2 related protein A1 | 1.898 | 2.86 × 10⁻² | Metabolism/Cell Proliferation/Regulation |
| ENSG00000169372 | CRADD | CASP2 and RIPK1 domain containing adaptor with death domain | 1.186 | 1.22 × 10⁻² | Metabolism/Cell Proliferation/Regulation |
| ENSG00000160013 | PTGIR | prostaglandin I2 (prostacyclin) receptor (IP) | 1.162 | 3.31 × 10⁻¹⁸ | Metabolism/Cell Proliferation/Regulation |
| ENSG00000183691 | NOG | noggin | 2.225 | 9.39 × 10⁻⁴ | Metabolism/Cell Proliferation/Regulation |
| ENSG00000124762 | CDKN1A | cyclin dependent kinase inhibitor 1A | 1.073 | 8.29 × 10⁻¹¹ | Metabolism/Cell Proliferation/Regulation |
| ENSG00000232977 | LINC00327 | long intergenic non-protein coding RNA 327 | 1.356 | 6.49 × 10⁻⁷ | Metabolism/Cell Proliferation/Regulation |
| ENSG00000255073 | ZFP91-CNTF | ZFP91-CNTF readthrough (NMD candidate) | 1.284 | 3.17 × 10⁻² | Metabolism/Cell Proliferation/Regulation |
| ENSG00000179862 | CITED4 | Cbp/p300 interacting transactivator with Glu/Asp rich carboxy-terminal domain 4 | 2.519 | 6.13 × 10⁻³ | Metabolism/Cell Proliferation/Regulation |
| ENSG00000128917 | DLL4 | delta like canonical Notch ligand 4 | 1.356 | 3.41 × 10⁻⁹ | Metabolism/Cell Proliferation/Regulation |
| ENSG00000205683 | DPF3 | double PHD fingers 3 | 1.292 | 1.03 × 10⁻⁷ | Metabolism/Cell Proliferation/Regulation |
| ENSG00000006468 | ETV1 | ETS variant 1 | 1.229 | 8.84 × 10⁻¹⁴ | Metabolism/Cell Proliferation/Regulation |
| ENSG00000175592 | FOSL1 | FOS like 1, AP-1 transcription factor subunit | 1.145 | 5.17 × 10⁻⁶ | Metabolism/Cell Proliferation/Regulation |
| ENSG00000164379 | FOXQ1 | forkhead box Q1 | 1.395 | 1.63 × 10⁻² | Metabolism/Cell Proliferation/Regulation |
| ENSG00000134363 | FST | follistatin | 1.174 | 3.03 × 10⁻² | Metabolism/Cell Proliferation/Regulation |
| ENSG00000177283 | FZD8 | frizzled class receptor 8 | 1.495 | 7.35 × 10⁻⁷ | Metabolism/Cell Proliferation/Regulation |
| ENSG00000114315 | HES1 | hes family bHLH transcription factor 1 | 2.075 | 1.27 × 10⁻⁶ | Metabolism/Cell Proliferation/Regulation |
| ENSG00000188290 | HES4 | hes family bHLH transcription factor 4 | 1.563 | 1.16 × 10⁻² | Metabolism/Cell Proliferation/Regulation |
| ENSG00000164683 | HEY1 | hes related family bHLH transcription factor with YRPW motif 1 | 1.461 | 5.80 × 10⁻⁴ | Metabolism/Cell Proliferation/Regulation |
| ENSG00000163909 | HEYL | hes related family bHLH transcription factor with YRPW motif-like | 1.649 | 5.79 × 10⁻⁵ | Metabolism/Cell Proliferation/Regulation |
| ENSG00000187837 | HIST1H1C | histone cluster 1 H1 family member c | 1.075 | 2.17 × 10⁻² | Metabolism/Cell Proliferation/Regulation |
| ENSG00000137309 | HMGA1 | high mobility group AT-hook 1 | 1.299 | 2.87 × 10⁻⁶ | Metabolism/Cell Proliferation/Regulation |
| ENSG00000115274 | INO80B | INO80 complex subunit B | 1.318 | 3.48 × 10⁻² | Metabolism/Cell Proliferation/Regulation |
| ENSG00000108551 | RASD1 | ras related dexamethasone induced 1 | 1.168 | 4.82 × 10⁻⁴ | Metabolism/Cell Proliferation/Regulation |
| ENSG00000196460 | RFX8 | RFX family member 8, lacking RFX DNA binding domain | 1.059 | 3.06 × 10⁻⁴ | Metabolism/Cell Proliferation/Regulation |
| ENSG00000147509 | RGS20 | regulator of G protein signaling 20 | 1.409 | 2.83 × 10⁻² | Metabolism/Cell Proliferation/Regulation |
| ENSG00000095752 | IL11 | interleukin 11 | 1.511 | 1.46 × 10⁻¹² | Metabolism/Cell Proliferation/Regulation |
| ENSG00000133169 | BEX1 | brain expressed X-linked 1 | 1.579 | 1.14 × 10⁻² | Metabolism/Cell Proliferation/Regulation |
| ENSG00000168621 | GDNF | glial cell derived neurotrophic factor | 1.029 | 1.69 × 10⁻⁶ | Metabolism/Cell Proliferation/Regulation |
| ENSG00000122641 | INHBA | inhibin beta A subunit | 1.188 | 6.30 × 10⁻⁵ | Metabolism/Cell Proliferation/Regulation |
| ENSG00000254858 | MPV17L2 | MPV17 mitochondrial inner membrane protein like 2 | 1.060 | 4.39 × 10⁻² | Metabolism/Cell Proliferation/Regulation |
| ENSG00000169994 | MYO7B | myosin VIIB | 2.121 | 2.99 × 10⁻² | Metabolism/Cell Proliferation/Regulation |
| ENSG00000239672 | NME1 | NME/NM23 nucleoside diphosphate kinase 1 | 1.300 | 2.18 × 10⁻² | Metabolism/Cell Proliferation/Regulation |
| ENSG00000139289 | PHLDA1 | pleckstrin homology like domain family A member 1 | 1.113 | 4.84 × 10⁻¹¹ | Metabolism/Cell Proliferation/Regulation |
| ENSG00000181649 | PHLDA2 | pleckstrin homology like domain family A member 2 | 1.679 | 1.79 × 10⁻⁴ | Metabolism/Cell Proliferation/Regulation |
| ENSG00000176641 | RNF152 | ring finger protein 152 | 1.800 | 7.61 × 10⁻¹⁶ | Metabolism/Cell Proliferation/Regulation |
| ENSG00000154133 | ROBO4 | roundabout guidance receptor 4 | 2.382 | 2.98 × 10⁻⁵ | Metabolism/Cell Proliferation/Regulation |
| ENSG00000197632 | SERPINB2 | serpin family B member 2 | 1.263 | 3.41 × 10⁻⁵ | Metabolism/Cell Proliferation/Regulation |
| ENSG00000006327 | TNFRSF12A | TNF receptor superfamily member 12A | 1.168 | 5.04 × 10⁻³ | Metabolism/Cell Proliferation/Regulation |
| ENSG00000130513 | GDF15 | growth differentiation factor 15 | 1.930 | 5.16 × 10⁻¹⁰ | Metabolism/Cell Proliferation/Regulation |
| ENSG00000092345 | DAZL | deleted in azoospermia like | 1.516 | 2.85 × 10⁻² | Metabolism/Cell Proliferation/Regulation |
| ENSG00000268439 | EMG1 | EMG1, N1-specific pseudouridine methyltransferase | 1.048 | 2.25 × 10⁻² | Metabolism/Cell Proliferation/Regulation |
| ENSG00000003249 | DBNDD1 | dysbindin domain containing 1 | 1.267 | 1.40 × 10⁻³ | Metabolism/Cell Proliferation/Regulation |
| ENSG00000077348 | EXOSC5 | exosome component 5 | 1.275 | 2.99 × 10⁻² | Metabolism/Cell Proliferation/Regulation |
| ENSG00000162669 | HFM1 | HFM1, ATP dependent DNA helicase homolog | 2.020 | 9.62 × 10⁻³ | Metabolism/Cell Proliferation/Regulation |
| ENSG00000156265 | MAP3K7CL | MAP3K7 C-terminal like | 1.040 | 3.11 × 10⁻³ | Metabolism/Cell Proliferation/Regulation |
| ENSG00000158747 | NBL1 | neuroblastoma 1, DAN family BMP antagonist | 1.065 | 1.69 × 10⁻⁵ | Metabolism/Cell Proliferation/Regulation |
| ENSG00000135919 | SERPINE2 | serpin family E member 2 | 1.245 | 7.42 × 10⁻⁶ | Metabolism/Cell Proliferation/Regulation |
| ENSG00000128805 | ARHGAP22 | Rho GTPase activating protein 22 | 1.187 | 3.55 × 10⁻¹¹ | Metabolism/Cell Proliferation/Regulation |
| ENSG00000130702 | LAMA5 | laminin subunit alpha 5 | −1.325 | 6.48 × 10⁻³ | Metabolism/Cell Proliferation/Regulation |
| ENSG00000110455 | ACCS | 1-aminocyclopropane-1-carboxylate synthase homolog (inactive) | −1.435 | 2.85 × 10⁻⁵ | Metabolism/Cell Proliferation/Regulation |
| ENSG00000138772 | ANXA3 | annexin A3 | −1.922 | 8.29 × 10⁻⁵ | Metabolism/Cell Proliferation/Regulation |
| ENSG00000151632 | AKR1C2 | aldo-keto reductase family 1 member C2 | −1.608 | 1.64 × 10⁻¹⁰ | Metabolism/Cell Proliferation/Regulation |
| ENSG00000170962 | PDGFD | platelet derived growth factor D | −1.790 | 1.64 × 10−43 | Metabolism/Cell Proliferation/Regulation |
| ENSG00000128606 | LRRC17 | leucine rich repeat containing 17 | −1.332 | 5.81 × 10⁻³ | Metabolism/Cell Proliferation/Regulation |
| ENSG00000102466 | FGF14 | fibroblast growth factor 14 | −1.333 | 3.65 × 10⁻⁴ | Metabolism/Cell Proliferation/Regulation |
| ENSG00000109339 | MAPK10 | mitogen-activated protein kinase 10 | −1.329 | 1.44 × 10⁻² | Metabolism/Cell Proliferation/Regulation |
| ENSG00000108984 | MAP2K6 | mitogen-activated protein kinase kinase 6 | −1.954 | 1.33 × 10⁻⁹ | Metabolism/Cell Proliferation/Regulation |
| ENSG00000064687 | ABCA7 | ATP binding cassette subfamily A member 7 | −1.603 | 1.39 × 10⁻³ | Metabolism/Cell Proliferation/Regulation |
| ENSG00000173706 | HEG1 | heart development protein with EGF like domains 1 | −1.524 | 1.95 × 10⁻⁵ | Metabolism/Cell Proliferation/Regulation |
| ENSG00000174348 | PODN | podocan | −1.891 | 4.35 × 10⁻¹⁰ | Metabolism/Cell Proliferation/Regulation |
| ENSG00000003096 | KLHL13 | kelch like family member 13 | −2.855 | 4.79 × 10⁻⁷ | Metabolism/Cell Proliferation/Regulation |
| ENSG00000146021 | KLHL3 | kelch like family member 3 | −1.014 | 2.99 × 10⁻³ | Metabolism/Cell Proliferation/Regulation |
| ENSG00000145819 | ARHGAP26 | Rho GTPase activating protein 26 | −2.155 | 2.00 × 10⁻¹³ | Metabolism/Cell Proliferation/Regulation |
| ENSG00000139354 | GAS2L3 | growth arrest specific 2 like 3 | −1.578 | 5.53 × 10⁻³ | Metabolism/Cell Proliferation/Regulation |
| ENSG00000198796 | ALPK2 | alpha kinase 2 | −1.018 | 2.28 × 10⁻³ | Metabolism/Cell Proliferation/Regulation |
| ENSG00000082438 | COBLL1 | cordon-bleu WH2 repeat protein like 1 | −1.576 | 1.97 × 10⁻⁸ | Metabolism/Cell Proliferation/Regulation |
| ENSG00000176971 | FIBIN | fin bud initiation factor homolog (zebrafish) | −1.382 | 9.25 × 10⁻¹⁰ | Metabolism/Cell Proliferation/Regulation |
| ENSG00000183098 | GPC6 | glypican 6 | −1.037 | 3.16 × 10⁻⁶ | Metabolism/Cell Proliferation/Regulation |
| ENSG00000139263 | LRIG3 | leucine rich repeats and immunoglobulin like domains 3 | −1.084 | 2.12 × 10⁻⁷ | Metabolism/Cell Proliferation/Regulation |
| ENSG00000170500 | LONRF2 | LON peptidase N-terminal domain and ring finger 2 | −2.063 | 3.13 × 10⁻⁴ | Metabolism/Cell Proliferation/Regulation |
| ENSG00000163017 | ACTG2 | actin, gamma 2, smooth muscle, enteric | −1.699 | 5.71 × 10⁻⁵ | Metabolism/Cell Proliferation/Regulation |
| ENSG00000111684 | LPCAT3 | lysophosphatidylcholine acyltransferase 3 | −1.021 | 1.61 × 10⁻⁶ | Metabolism/Cell Proliferation/Regulation |
| ENSG00000182575 | NXPH3 | neurexophilin 3 | −1.451 | 7.04 × 10⁻⁴ | Metabolism/Cell Proliferation/Regulation |
| ENSG00000243970 | PPIEL | peptidylprolyl isomerase E like pseudogene | −1.019 | 1.09 × 10⁻² | Metabolism/Cell Proliferation/Regulation |
| ENSG00000113231 | PDE8B | phosphodiesterase 8B | −1.113 | 6.47 × 10⁻⁶ | Metabolism/Cell Proliferation/Regulation |
| ENSG00000185483 | ROR1 | receptor tyrosine kinase like orphan receptor 1 | −1.344 | 6.02 × 10⁻⁴ | Metabolism/Cell Proliferation/Regulation |
| ENSG00000187164 | SHTN1 | shootin 1 | −1.080 | 2.96 × 10⁻⁷ | Metabolism/Cell Proliferation/Regulation |
| ENSG00000177409 | SAMD9L | sterile alpha motif domain containing 9 like | −1.003 | 1.80 × 10⁻² | Metabolism/Cell Proliferation/Regulation |
| ENSG00000196562 | SULF2 | sulfatase 2 | −1.218 | 2.03 × 10⁻⁵ | Metabolism/Cell Proliferation/Regulation |
| ENSG00000186854 | TRABD2A | TraB domain containing 2A | −1.386 | 9.04 × 10⁻⁹ | Metabolism/Cell Proliferation/Regulation |
| ENSG00000182179 | UBA7 | ubiquitin like modifier activating enzyme 7 | −1.234 | 7.71 × 10⁻⁶ | Metabolism/Cell Proliferation/Regulation |
| ENSG00000112303 | VNN2 | vanin 2 | −3.082 | 2.31 × 10⁻² | Metabolism/Cell Proliferation/Regulation |
| ENSG00000115339 | GALNT3 | polypeptide N-acetylgalactosaminyltransferase 3 | −1.284 | 2.38 × 10⁻³ | Metabolism/Cell Proliferation/Regulation |
| ENSG00000167311 | ART5 | ADP-ribosyltransferase 5 | −1.826 | 3.84 × 10⁻² | Metabolism/Cell Proliferation/Regulation |
| ENSG00000088882 | CPXM1 | carboxypeptidase X, M14 family member 1 | −1.278 | 1.34 × 10⁻⁶ | Metabolism/Cell Proliferation/Regulation |
| ENSG00000138180 | CEP55 | centrosomal protein 55 | −1.272 | 1.45 × 10⁻² | Metabolism/Cell Proliferation/Regulation |
| ENSG00000064886 | CHI3L2 | chitinase 3 like 2 | −1.354 | 2.34 × 10⁻¹¹ | Metabolism/Cell Proliferation/Regulation |
| ENSG00000115468 | EFHD1 | EF-hand domain family member D1 | −1.752 | 5.70 × 10⁻⁵ | Metabolism/Cell Proliferation/Regulation |
| ENSG00000106565 | TMEM176B | transmembrane protein 176B | −1.559 | 4.58 × 10⁻³ | Metabolism/Cell Proliferation/Regulation |
| ENSG00000143869 | GDF7 | growth differentiation factor 7 | −2.047 | 2.63 × 10⁻³ | Metabolism/Cell Proliferation/Regulation |
| ENSG00000139269 | INHBE | inhibin beta E subunit | −2.466 | 7.03 × 10⁻³ | Metabolism/Cell Proliferation/Regulation |
| ENSG00000105989 | WNT2 | Wnt family member 2 | −3.133 | 2.67 × 10⁻³² | Metabolism/Cell Proliferation/Regulation |
| ENSG00000139304 | PTPRQ | protein tyrosine phosphatase, receptor type Q | −2.790 | 5.05 × 10⁻⁷ | Metabolism/Cell Proliferation/Regulation |
| ENSG00000128045 | RASL11B | RAS like family 11 member B | −2.577 | 1.04 × 10⁻⁴ | Metabolism/Cell Proliferation/Regulation |
| ENSG00000138615 | CILP | cartilage intermediate layer protein | −1.854 | 3.03 × 10⁻² | Metabolism/Cell Proliferation/Regulation |
| ENSG00000002933 | TMEM176A | transmembrane protein 176A | −1.660 | 4.32 × 10⁻⁴ | Metabolism/Cell Proliferation/Regulation |
| ENSG00000121858 | TNFSF10 | TNF superfamily member 10 | −1.790 | 9.42 × 10⁻⁴ | Metabolism/Cell Proliferation/Regulation |
| ENSG00000171462 | DLK2 | delta like non-canonical Notch ligand 2 | −1.329 | 1.62 × 10⁻² | Metabolism/Cell Proliferation/Regulation |
| ENSG00000178662 | CSRNP3 | cysteine and serine rich nuclear protein 3 | −2.392 | 8.91 × 10⁻³ | Metabolism/Cell Proliferation/Regulation |
| ENSG00000090006 | LTBP4 | latent transforming growth factor beta binding protein 4 | −1.122 | 1.82 × 10⁻⁴ | Metabolism/Cell Proliferation/Regulation |
| ENSG00000100626 | GALNT16 | polypeptide N-acetylgalactosaminyltransferase 16 | −1.780 | 2.60 × 10⁻⁴ | Metabolism/Cell Proliferation/Regulation |
| ENSG00000168453 | HR | HR, lysine demethylase and nuclear receptor corepressor | −2.686 | 1.55 × 10⁻¹⁸ | Metabolism/Cell Proliferation/Regulation |
| ENSG00000054654 | SYNE2 | spectrin repeat containing nuclear envelope protein 2 | −1.497 | 9.55 × 10⁻⁵ | Metabolism/Cell Proliferation/Regulation |
| ENSG00000064692 | SNCAIP | synuclein alpha interacting protein | −1.993 | 3.08 × 10⁻²⁰ | Metabolism/Cell Proliferation/Regulation |
| ENSG00000101938 | CHRDL1 | chordin like 1 | −1.622 | 1.48 × 10⁻⁴ | Metabolism/Cell Proliferation/Regulation |
| ENSG00000132846 | ZBED3 | zinc finger BED-type containing 3 | −1.501 | 2.00 × 10⁻¹³ | Metabolism/Cell Proliferation/Regulation |
| ENSG00000187764 | SEMA4D | semaphorin 4D | −1.142 | 1.53 × 10⁻⁴ | Metabolism/Cell Proliferation/Regulation |
| ENSG00000104081 | BMF | Bcl2 modifying factor | −1.067 | 7.29 × 10⁻⁷ | Metabolism/Cell Proliferation/Regulation |
| ENSG00000170214 | ADRA1B | adrenoceptor alpha 1B | −3.324 | 4.07 × 10⁻³ | Metabolism/Cell Proliferation/Regulation |
| ENSG00000151692 | RNF144A | ring finger protein 144A | −1.343 | 1.09 × 10⁻⁶ | Metabolism/Cell Proliferation/Regulation |
| ENSG00000111885 | MAN1A1 | mannosidase alpha class 1A member 1 | −1.117 | 1.09 × 10⁻¹⁰ | Metabolism/Cell Proliferation/Regulation |
| ENSG00000048740 | CELF2 | CUGBP Elav-like family member 2 | −1.545 | 2.49 × 10⁻² | Metabolism/Cell Proliferation/Regulation |
| ENSG00000134245 | WNT2B | Wnt family member 2B | −1.467 | 5.53 × 10⁻⁶ | Metabolism/Cell Proliferation/Regulation |
| ENSG00000136859 | ANGPTL2 | angiopoietin like 2 | −1.707 | 9.06 × 10⁻²² | Metabolism/Cell Proliferation/Regulation |
| ENSG00000170624 | SGCD | sarcoglycan delta | −1.300 | 8.69 × 10⁻⁷ | Metabolism/Cell Proliferation/Regulation |
| ENSG00000135472 | FAIM2 | Fas apoptotic inhibitory molecule 2 | −1.531 | 2.10 × 10⁻⁶ | Metabolism/Cell Proliferation/Regulation |
| ENSG00000065717 | TLE2 | transducin like enhancer of split 2 | −1.275 | 2.37 × 10⁻⁵ | Metabolism/Cell Proliferation/Regulation |
| ENSG00000064205 | WISP2 | WNT1 inducible signaling pathway protein 2 | −2.029 | 5.00 × 10⁻³ | Metabolism/Cell Proliferation/Regulation |
| ENSG00000184347 | SLIT3 | slit guidance ligand 3 | −1.835 | 7.13 × 10⁻⁵ | Metabolism/Cell Proliferation/Regulation |
| ENSG00000137834 | SMAD6 | SMAD family member 6 | −1.545 | 9.50 × 10⁻⁵ | Metabolism/Cell Proliferation/Regulation |
| ENSG00000178573 | MAF | MAF bZIP transcription factor | −1.077 | 2.32 × 10⁻⁴ | Metabolism/Cell Proliferation/Regulation |
| ENSG00000248746 | ACTN3 | actinin alpha 3 (gene/pseudogene) | −1.987 | 1.15 × 10⁻² | Metabolism/Cell Proliferation/Regulation |
| ENSG00000154734 | ADAMTS1 | ADAM metallopeptidase with thrombospondin type 1 motif 1 | −1.667 | 4.48 × 10⁻⁶ | Metabolism/Cell Proliferation/Regulation |
| ENSG00000166106 | ADAMTS15 | ADAM metallopeptidase with thrombospondin type 1 motif 15 | −1.395 | 2.83 × 10⁻² | Metabolism/Cell Proliferation/Regulation |
| ENSG00000158555 | GDPD5 | glycerophosphodiester phosphodiesterase domain containing 5 | −2.275 | 1.82 × 10⁻⁸ | Metabolism/Cell Proliferation/Regulation |
| ENSG00000173599 | PC | pyruvate carboxylase | −1.123 | 4.07 × 10⁻³ | Metabolism/Cell Proliferation/Regulation |
| ENSG00000122877 | EGR2 | early growth response 2 | −2.430 | 3.34 × 10⁻⁶ | Metabolism/Cell Proliferation/Regulation |
| ENSG00000179388 | EGR3 | early growth response 3 | −1.946 | 1.08 × 10⁻¹⁰ | Metabolism/Cell Proliferation/Regulation |
| ENSG00000052850 | ALX4 | ALX homeobox 4 | −1.188 | 4.54 × 10⁻⁶ | Metabolism/Cell Proliferation/Regulation |
| ENSG00000168502 | MTCL1 | microtubule crosslinking factor 1 | −1.144 | 3.19 × 10⁻⁴ | Metabolism/Cell Proliferation/Regulation |
| ENSG00000276600 | RAB7B | RAB7B, member RAS oncogene family | −1.749 | 1.91 × 10⁻⁶ | Metabolism/Cell Proliferation/Regulation |
| ENSG00000118849 | RARRES1 | retinoic acid receptor responder 1 | −1.041 | 7.15 × 10⁻³ | Metabolism/Cell Proliferation/Regulation |
| ENSG00000213626 | LBH | limb bud and heart development | −1.890 | 1.54 × 10⁻²⁵ | Metabolism/Cell Proliferation/Regulation |
| ENSG00000169744 | LDB2 | LIM domain binding 2 | −1.115 | 1.09 × 10⁻⁹ | Metabolism/Cell Proliferation/Regulation |
| ENSG00000071282 | LMCD1 | LIM and cysteine rich domains 1 | −1.747 | 1.80 × 10⁻²² | Metabolism/Cell Proliferation/Regulation |
| ENSG00000163431 | LMOD1 | leiomodin 1 | −1.048 | 1.94 × 10⁻² | Metabolism/Cell Proliferation/Regulation |
| ENSG00000170312 | CDK1 | cyclin dependent kinase 1 | −1.104 | 4.72 × 10⁻² | Metabolism/Cell Proliferation/Regulation |
| ENSG00000123080 | CDKN2C | cyclin dependent kinase inhibitor 2C | −1.247 | 1.27 × 10⁻³ | Metabolism/Cell Proliferation/Regulation |
| ENSG00000066279 | ASPM | abnormal spindle microtubule assembly | −1.597 | 7.20 × 10⁻⁴ | Metabolism/Cell Proliferation/Regulation |
| ENSG00000116741 | RGS2 | regulator of G protein signaling 2 | −1.023 | 7.35 × 10⁻⁴ | Metabolism/Cell Proliferation/Regulation |
| ENSG00000128482 | RNF112 | ring finger protein 112 | −1.258 | 5.99 × 10⁻³ | Metabolism/Cell Proliferation/Regulation |
| ENSG00000137193 | PIM1 | Pim-1 proto-oncogene, serine/threonine kinase | −1.080 | 6.87 × 10⁻¹¹ | Metabolism/Cell Proliferation/Regulation |
| ENSG00000116133 | DHCR24 | 24-dehydrocholesterol reductase | −1.042 | 2.13 × 10⁻³ | Metabolism/Cell Proliferation/Regulation |
| ENSG00000148773 | MKI67 | marker of proliferation Ki-67 | −1.255 | 4.78 × 10⁻³ | Metabolism/Cell Proliferation/Regulation |
| ENSG00000092621 | PHGDH | phosphoglycerate dehydrogenase | −1.408 | 5.84 × 10⁻¹¹ | Metabolism/Cell Proliferation/Regulation |
| ENSG00000108387 | SEPT4 | septin 4 | −1.274 | 3.41 × 10⁻² | Metabolism/Cell Proliferation/Regulation |
| ENSG00000125354 | SEPT6 | septin 6 | −1.003 | 4.95 × 10⁻⁴ | Metabolism/Cell Proliferation/Regulation |
| ENSG00000136531 | SCN2A | sodium voltage-gated channel alpha subunit 2 | −1.828 | 1.68 × 10⁻⁴ | Metabolism/Cell Proliferation/Regulation |
| ENSG00000139211 | AMIGO2 | adhesion molecule with Ig like domain 2 | −1.127 | 1.26 × 10⁻¹¹ | Metabolism/Cell Proliferation/Regulation |
| ENSG00000120738 | EGR1 | early growth response 1 | −1.344 | 4.50 × 10⁻¹⁶ | Metabolism/Cell Proliferation/Regulation |
| ENSG00000165959 | CLMN | calmin | −2.182 | 1.51 × 10⁻² | Metabolism/Cell Proliferation/Regulation |
| ENSG00000090539 | CHRD | chordin | −1.001 | 4.24 × 10⁻² | Metabolism/Cell Proliferation/Regulation |
| ENSG00000106003 | LFNG | LFNG O-fucosylpeptide 3-beta-N-acetylglucosaminyltransferase | −1.029 | 3.52 × 10⁻² | Metabolism/Cell Proliferation/Regulation |
| ENSG00000164920 | OSR2 | odd-skipped related transciption factor 2 | −1.249 | 3.36 × 10⁻⁸ | Metabolism/Cell Proliferation/Regulation |
| ENSG00000115252 | PDE1A | phosphodiesterase 1A | −2.989 | 1.15 × 10⁻⁵ | Metabolism/Cell Proliferation/Regulation |
| ENSG00000111341 | MGP | matrix Gla protein | −1.673 | 2.70 × 10⁻² | Metabolism/Cell Proliferation/Regulation |
| ENSG00000187098 | MITF | melanogenesis associated transcription factor | −1.741 | 1.10 × 10⁻¹⁶ | Metabolism/Cell Proliferation/Regulation |
| ENSG00000169184 | MN1 | MN1 proto-oncogene, transcriptional regulator | −1.857 | 3.34 × 10⁻⁵ | Metabolism/Cell Proliferation/Regulation |
| ENSG00000120278 | PLEKHG1 | pleckstrin homology and RhoGEF domain containing G1 | −1.308 | 2.49 × 10⁻⁴ | Metabolism/Cell Proliferation/Regulation |
| ENSG00000240694 | PNMA2 | paraneoplastic Ma antigen 2 | −1.284 | 1.77 × 10⁻³ | Metabolism/Cell Proliferation/Regulation |
| ENSG00000143125 | PROK1 | prokineticin 1 | −1.352 | 1.04 × 10⁻² | Metabolism/Cell Proliferation/Regulation |
| ENSG00000106772 | PRUNE2 | prune homolog 2 | −1.792 | 1.75 × 10⁻¹⁰ | Metabolism/Cell Proliferation/Regulation |
| ENSG00000160801 | PTH1R | parathyroid hormone 1 receptor | −1.442 | 3.49 × 10⁻⁷ | Metabolism/Cell Proliferation/Regulation |
| ENSG00000107551 | RASSF4 | Ras association domain family member 4 | −1.457 | 6.36 × 10⁻⁶ | Metabolism/Cell Proliferation/Regulation |
| ENSG00000141068 | KSR1 | kinase suppressor of ras 1 | −1.157 | 2.05 × 10⁻³ | Metabolism/Cell Proliferation/Regulation |
| ENSG00000117155 | SSX2IP | SSX family member 2 interacting protein | −1.190 | 2.62 × 10⁻¹⁶ | Metabolism/Cell Proliferation/Regulation |
| ENSG00000162595 | DIRAS3 | DIRAS family GTPase 3 | −1.371 | 6.86 × 10⁻⁵ | Metabolism/Cell Proliferation/Regulation |
| ENSG00000179981 | TSHZ1 | teashirt zinc finger homeobox 1 | −1.094 | 3.79 × 10⁻⁵ | Metabolism/Cell Proliferation/Regulation |
| ENSG00000088756 | ARHGAP28 | Rho GTPase activating protein 28 | −1.425 | 3.47 × 10⁻²³ | Metabolism/Cell Proliferation/Regulation |
| ENSG00000137727 | ARHGAP20 | Rho GTPase activating protein 20 | −2.101 | 1.84 × 10⁻⁵ | Metabolism/Cell Proliferation/Regulation |
| ENSG00000172346 | CSDC2 | cold shock domain containing C2 | −2.139 | 2.20 × 10⁻¹⁴ | Metabolism/Cell Proliferation/Regulation |
| ENSG00000181444 | ZNF467 | zinc finger protein 467 | −1.210 | 2.94 × 10⁻³ | Metabolism/Cell Proliferation/Regulation |
| ENSG00000206538 | VGLL3 | vestigial like family member 3 | −1.052 | 9.47 × 10⁻³ | Metabolism/Cell Proliferation/Regulation |
| ENSG00000112246 | SIM1 | single-minded family bHLH transcription factor 1 | −1.095 | 1.58 × 10⁻² | Metabolism/Cell Proliferation/Regulation |
| ENSG00000173227 | SYT12 | synaptotagmin 12 | −2.160 | 1.04 × 10⁻² | Metabolism/Cell Proliferation/Regulation |
| ENSG00000258818 | RNASE4 | ribonuclease A family member 4 | −1.050 | 4.07 × 10⁻³ | Metabolism/Cell Proliferation/Regulation |
| ENSG00000153993 | SEMA3D | semaphorin 3D | −1.488 | 9.82 × 10⁻⁵ | Metabolism/Cell Proliferation/Regulation |
| ENSG00000012171 | SEMA3B | semaphorin 3B | −1.515 | 5.39 × 10⁻¹¹ | Metabolism/Cell Proliferation/Regulation |
| ENSG00000182175 | RGMA | repulsive guidance molecule family member a | −1.225 | 8.69 × 10⁻⁶ | Metabolism/Cell Proliferation/Regulation |
| ENSG00000120693 | SMAD9 | SMAD family member 9 | −1.359 | 8.99 × 10⁻⁵ | Metabolism/Cell Proliferation/Regulation |
| ENSG00000112984 | KIF20A | kinesin family member 20A | −1.607 | 1.70 × 10⁻⁴ | Metabolism/Cell Proliferation/Regulation |
| ENSG00000211448 | DIO2 | iodothyronine deiodinase 2 | −1.249 | 7.48 × 10⁻⁶ | Metabolism/Cell Proliferation/Regulation |
| ENSG00000197406 | DIO3 | iodothyronine deiodinase 3 | −1.593 | 3.51 × 10⁻² | Metabolism/Cell Proliferation/Regulation |
| ENSG00000010932 | FMO1 | flavin containing monooxygenase 1 | −3.430 | 1.99 × 10⁻⁴ | Metabolism/Cell Proliferation/Regulation |
| ENSG00000076258 | FMO4 | flavin containing monooxygenase 4 | −1.825 | 1.53 × 10⁻⁹ | Metabolism/Cell Proliferation/Regulation |
| ENSG00000131781 | FMO5 | flavin containing monooxygenase 5 | −1.218 | 4.49 × 10⁻² | Metabolism/Cell Proliferation/Regulation |
| ENSG00000162496 | DHRS3 | dehydrogenase/reductase 3 | −1.489 | 1.03 × 10⁻⁴ | Metabolism/Cell Proliferation/Regulation |
| ENSG00000159167 | STC1 | stanniocalcin 1 | 1.249 | 7.50 × 10⁻¹³ | Response to stimulus |
| ENSG00000133805 | AMPD3 | adenosine monophosphate deaminase 3 | 1.087 | 8.42 × 10⁻⁹ | Response to stimulus |
| ENSG00000143786 | CNIH3 | cornichon family AMPA receptor auxiliary protein 3 | 1.380 | 4.64 × 10⁻⁷ | Response to stimulus |
| ENSG00000170373 | CST1 | cystatin SN | 2.721 | 3.26 × 10⁻⁶ | Response to stimulus |
| ENSG00000134769 | DTNA | dystrobrevin alpha | 1.118 | 4.90 × 10⁻⁷ | Response to stimulus |
| ENSG00000120875 | DUSP4 | dual specificity phosphatase 4 | 1.040 | 3.70 × 10⁻¹¹ | Response to stimulus |
| ENSG00000060558 | GNA15 | G protein subunit alpha 15 | 1.725 | 2.90 × 10⁻² | Response to stimulus |
| ENSG00000181773 | GPR3 | G protein-coupled receptor 3 | 1.345 | 4.88 × 10⁻⁴ | Response to stimulus |
| ENSG00000180875 | GREM2 | gremlin 2, DAN family BMP antagonist | 1.351 | 8.05 × 10⁻⁷ | Response to stimulus |
| ENSG00000148834 | GSTO1 | glutathione S-transferase omega 1 | 1.653 | 1.22 × 10⁻³ | Response to stimulus |
| ENSG00000128285 | MCHR1 | melanin concentrating hormone receptor 1 | 2.294 | 3.65 × 10⁻² | Response to stimulus |
| ENSG00000169715 | MT1E | metallothionein 1E | 1.731 | 6.29 × 10⁻³ | Response to stimulus |
| ENSG00000104490 | NCALD | neurocalcin delta | 1.428 | 1.58 × 10⁻² | Response to stimulus |
| ENSG00000171208 | NETO2 | neuropilin and tolloid like 2 | 1.272 | 2.96 × 10⁻⁸ | Response to stimulus |
| ENSG00000154217 | PITPNC1 | phosphatidylinositol transfer protein, cytoplasmic 1 | 1.257 | 2.90 × 10⁻⁵ | Response to stimulus |
| ENSG00000087494 | PTHLH | parathyroid hormone like hormone | 1.458 | 9.51 × 10⁻⁵ | Response to stimulus |
| ENSG00000041353 | RAB27B | RAB27B, member RAS oncogene family | 1.385 | 2.72 × 10⁻⁶ | Response to stimulus |
| ENSG00000136237 | RAPGEF5 | Rap guanine nucleotide exchange factor 5 | 1.659 | 2.41 × 10⁻² | Response to stimulus |
| ENSG00000181625 | SLX1B | SLX1 homolog B, structure-specific endonuclease subunit | 1.410 | 3.68 × 10⁻³ | Response to stimulus |
| ENSG00000101463 | SYNDIG1 | synapse differentiation inducing 1 | 1.162 | 7.33 × 10⁻⁴ | Response to stimulus |
| ENSG00000011347 | SYT7 | synaptotagmin 7 | 1.678 | 1.56 × 10⁻² | Response to stimulus |
| ENSG00000184292 | TACSTD2 | tumor associated calcium signal transducer 2 | 1.229 | 1.93 × 10⁻² | Response to stimulus |
| ENSG00000105825 | TFPI2 | tissue factor pathway inhibitor 2 | 1.940 | 2.13 × 10⁻⁷ | Response to stimulus |
| ENSG00000178726 | THBD | thrombomodulin | 2.311 | 2.52 × 10⁻⁴ | Response to stimulus |
| ENSG00000147573 | TRIM55 | tripartite motif containing 55 | 2.227 | 2.68 × 10⁻⁶ | Response to stimulus |
| ENSG00000081181 | ARG2 | arginase 2 | 1.398 | 3.08 × 10⁻² | Response to stimulus |
| ENSG00000169627 | BOLA2B | bolA family member 2B | 1.289 | 3.05 × 10⁻² | Response to stimulus |
| ENSG00000144476 | ACKR3 | atypical chemokine receptor 3 | −2.220 | 3.17 × 10⁻¹⁴ | Response to stimulus |
| ENSG00000114698 | PLSCR4 | phospholipid scramblase 4 | −1.101 | 6.91 × 10⁻¹⁵ | Response to stimulus |
| ENSG00000137959 | IFI44L | interferon induced protein 44 like | −1.666 | 1.47 × 10⁻⁸ | Response to stimulus |
| ENSG00000069431 | ABCC9 | ATP binding cassette subfamily C member 9 | −1.279 | 7.83 × 10⁻⁶ | Response to stimulus |
| ENSG00000132561 | MATN2 | matrilin 2 | −1.966 | 5.43 × 10⁻²¹ | Response to stimulus |
| ENSG00000162551 | ALPL | alkaline phosphatase, liver/bone/kidney | −2.494 | 8.25 × 10⁻²⁵ | Response to stimulus |
| ENSG00000184979 | USP18 | ubiquitin specific peptidase 18 | −1.057 | 3.81 × 10⁻² | Response to stimulus |
| ENSG00000172264 | MACROD2 | MACRO domain containing 2 | −2.645 | 6.64 × 10⁻³ | Response to stimulus |
| ENSG00000250722 | SELENOP | selenoprotein P | −2.805 | 1.50 × 10−36 | Response to stimulus |
| ENSG00000069482 | GAL | galanin and GMAP prepropeptide | 2.335 | 3.68 × 10⁻³ | Inflammatory process |
| ENSG00000151651 | ADAM8 | ADAM metallopeptidase domain 8 | 1.251 | 5.04 × 10⁻⁷ | Inflammatory process |
| ENSG00000011201 | ANOS1 | anosmin 1 | 1.877 | 9.50 × 10⁻¹⁶ | Inflammatory process |
| ENSG00000108691 | CCL2 | C-C motif chemokine ligand 2 | 1.339 | 5.92 × 10⁻³ | Inflammatory process |
| ENSG00000164400 | CSF2 | colony stimulating factor 2 | 2.520 | 3.09 × 10⁻⁵ | Inflammatory process |
| ENSG00000108342 | CSF3 | colony stimulating factor 3 | 2.372 | 3.36 × 10⁻¹⁷ | Inflammatory process |
| ENSG00000163739 | CXCL1 | C-X-C motif chemokine ligand 1 | 1.612 | 1.83 × 10⁻⁵ | Inflammatory process |
| ENSG00000081041 | CXCL2 | C-X-C motif chemokine ligand 2 | 1.713 | 8.35 × 10⁻⁵ | Inflammatory process |
| ENSG00000163734 | CXCL3 | C-X-C motif chemokine ligand 3 | 1.149 | 7.49 × 10⁻⁶ | Inflammatory process |
| ENSG00000163735 | CXCL5 | C-X-C motif chemokine ligand 5 | 2.107 | 3.74 × 10−36 | Inflammatory process |
| ENSG00000169429 | CXCL8 | C-X-C motif chemokine ligand 8 | 2.340 | 3.78 × 10⁻¹⁷ | Inflammatory process |
| ENSG00000123496 | IL13RA2 | interleukin 13 receptor subunit alpha 2 | 1.324 | 9.69 × 10⁻⁶ | Inflammatory process |
| ENSG00000125538 | IL1B | interleukin 1 beta | 1.940 | 2.34 × 10⁻¹⁴ | Inflammatory process |
| ENSG00000162892 | IL24 | interleukin 24 | 3.105 | 2.62 × 10⁻¹⁶ | Inflammatory process |
| ENSG00000136244 | IL6 | interleukin 6 | 1.654 | 2.51 × 10⁻⁶ | Inflammatory process |
| ENSG00000134070 | IRAK2 | interleukin 1 receptor associated kinase 2 | 1.446 | 1.34 × 10⁻²⁴ | Inflammatory process |
| ENSG00000119714 | GPR68 | G protein-coupled receptor 68 | 1.839 | 5.85 × 10⁻⁶ | Inflammatory process |
| ENSG00000175040 | CHST2 | carbohydrate sulfotransferase 2 | 1.046 | 1.22 × 10⁻⁹ | Inflammatory process |
| ENSG00000271605 | MILR1 | mast cell immunoglobulin like receptor 1 | 1.339 | 8.66 × 10⁻⁴ | Inflammatory process |
| ENSG00000130203 | APOE | apolipoprotein E | −1.092 | 4.88 × 10⁻⁹ | Inflammatory process |
| ENSG00000196639 | HRH1 | histamine receptor H1 | −1.494 | 6.54 × 10⁻¹⁰ | Inflammatory process |
| ENSG00000172156 | CCL11 | C-C motif chemokine ligand 11 | −1.416 | 4.72 × 10⁻² | Inflammatory process |
| ENSG00000168952 | STXBP6 | syntaxin binding protein 6 | −1.283 | 3.40 × 10⁻³ | Inflammatory process |
| ENSG00000129009 | ISLR | immunoglobulin superfamily containing leucine rich repeat | −1.501 | 9.35 × 10⁻²⁰ | Inflammatory process |
| ENSG00000170989 | S1PR1 | sphingosine-1-phosphate receptor 1 | −1.683 | 3.54 × 10⁻⁸ | Inflammatory process |
| ENSG00000235568 | NFAM1 | NFAT activating protein with ITAM motif 1 | −2.546 | 3.56 × 10⁻⁴ | Inflammatory process |
| ENSG00000124212 | PTGIS | prostaglandin I2 synthase | −2.422 | 1.80 × 10⁻²² | Inflammatory process |
| ENSG00000185432 | METTL7A | methyltransferase like 7A | −1.523 | 7.00 × 10⁻¹⁰ | Inflammatory process |
| ENSG00000169432 | SCN9A | sodium voltage-gated channel alpha subunit 9 | −1.245 | 1.42 × 10⁻⁴ | Inflammatory process |
| ENSG00000163701 | IL17RE | interleukin 17 receptor E | −1.421 | 2.73 × 10⁻² | Inflammatory process |
| ENSG00000167191 | GPRC5B | G protein-coupled receptor class C group 5 member B | −1.650 | 1.14 × 10⁻⁹ | Inflammatory process |
| ENSG00000162645 | GBP2 | guanylate binding protein 2 | −2.361 | 2.44 × 10⁻³⁴ | Inflammatory process |
| ENSG00000170323 | FABP4 | fatty acid binding protein 4 | −4.620 | 4.47 × 10⁻⁶ | Inflammatory process |
| ENSG00000162692 | VCAM1 | vascular cell adhesion molecule 1 | −2.990 | 7.32 × 10⁻⁹ | Inflammatory process |
| ENSG00000144730 | IL17RD | interleukin 17 receptor D | −1.157 | 4.32 × 10⁻² | Inflammatory process |
| ENSG00000116106 | EPHA4 | EPH receptor A4 | −1.815 | 2.62 × 10⁻⁷ | Inflammatory process |
| ENSG00000182580 | EPHB3 | EPH receptor B3 | −1.264 | 6.89 × 10⁻⁵ | Inflammatory process |
| ENSG00000106123 | EPHB6 | EPH receptor B6 | −1.367 | 1.33 × 10⁻¹⁰ | Inflammatory process |
| ENSG00000238271 | IFNWP19 | interferon omega 1 pseudogene 19 | −1.612 | 4.34 × 10⁻² | Inflammatory process |
| ENSG00000133056 | PIK3C2B | phosphatidylinositol-4-phosphate 3-kinase catalytic subunit type 2 beta | −1.449 | 2.38 × 10⁻² | Inflammatory process |
| ENSG00000145675 | PIK3R1 | phosphoinositide-3-kinase regulatory subunit 1 | −1.017 | 1.15 × 10⁻² | Inflammatory process |
| ENSG00000164099 | PRSS12 | protease, serine 12 | −1.081 | 1.70 × 10⁻⁴ | Inflammatory process |
| ENSG00000090889 | KIF4A | kinesin family member 4A | −1.560 | 3.32 × 10⁻² | Inflammatory process |
| ENSG00000099998 | GGT5 | gamma-glutamyltransferase 5 | 1.009 | 9.64 × 10⁻¹⁴ | Response to oxidative stress |
| ENSG00000148834 | GSTO1 | glutathione S-transferase omega 1 | 1.653 | 1.22 × 10⁻³ | Response to oxidative stress |
| ENSG00000198763 | MT-ND2 | mitochondrially encoded NADH:ubiquinone oxidoreductase core subunit 2 | 1.118 | 3.23 × 10⁻² | Response to oxidative stress |
| ENSG00000086991 | NOX4 | NADPH oxidase 4 | 1.604 | 2.24 × 10⁻⁵ | Response to oxidative stress |
| ENSG00000158125 | XDH | xanthine dehydrogenase | 1.317 | 2.20 × 10⁻⁴ | Response to oxidative stress |
| ENSG00000122378 | FAM213A | family with sequence similarity 213 member A | 1.054 | 9.19 × 10⁻⁷ | Response to oxidative stress |
| ENSG00000117592 | PRDX6 | peroxiredoxin 6 | 1.014 | 1.90 × 10⁻² | Response to oxidative stress |
| ENSG00000188906 | LRRK2 | leucine rich repeat kinase 2 | −1.082 | 2.49 × 10⁻² | Response to oxidative stress |
| ENSG00000196139 | AKR1C3 | aldo-keto reductase family 1 member C3 | −1.442 | 3.29 × 10⁻⁷ | Response to oxidative stress |
| ENSG00000123453 | SARDH | sarcosine dehydrogenase | −1.445 | 1.03 × 10⁻² | Response to oxidative stress |
| ENSG00000196616 | ADH1B | alcohol dehydrogenase 1B (class I), beta polypeptide | −3.297 | 1.15 × 10−47 | Response to oxidative stress |
| ENSG00000165092 | ALDH1A1 | aldehyde dehydrogenase 1 family member A1 | −1.811 | 7.67 × 10−56 | Response to oxidative stress |
| ENSG00000109819 | PPARGC1A | PPARG coactivator 1 alpha | −1.062 | 2.51 × 10⁻⁶ | Response to oxidative stress |
| ENSG00000155962 | CLIC2 | chloride intracellular channel 2 | −1.595 | 2.65 × 10⁻² | Response to oxidative stress |
| ENSG00000240069 | GPAA1P1 | glycosylphosphatidylinositol anchor attachment 1 pseudogene 1 | 2.788 | 5.44 × 10⁻⁴ | Communication |
| ENSG00000230596 | GPAA1P2 | glycosylphosphatidylinositol anchor attachment 1 pseudogene 2 | 2.360 | 2.70 × 10⁻³ | Communication |
| ENSG00000115756 | HPCAL1 | hippocalcin like 1 | 1.011 | 3.56 × 10⁻³ | Communication |
| ENSG00000180332 | KCTD4 | potassium channel tetramerization domain containing 4 | 2.199 | 5.29 × 10⁻⁴ | Communication |
| ENSG00000166562 | SEC11C | SEC11 homolog C, signal peptidase complex subunit | 1.536 | 1.19 × 10⁻³ | Communication |
| ENSG00000139364 | TMEM132B | transmembrane protein 132B | 1.465 | 1.59 × 10⁻⁷ | Communication |
| ENSG00000249992 | TMEM158 | transmembrane protein 158 (gene/pseudogene) | 3.051 | 2.25 × 10⁻⁶ | Communication |
| ENSG00000157111 | TMEM171 | transmembrane protein 171 | 1.540 | 4.72 × 10⁻² | Communication |
| ENSG00000095209 | TMEM38B | transmembrane protein 38B | 1.152 | 1.87 × 10⁻⁵ | Communication |
| ENSG00000179431 | FJX1 | four jointed box 1 | 1.432 | 2.05 × 10⁻⁴ | Communication |
| ENSG00000143341 | HMCN1 | hemicentin 1 | −2.093 | 1.63 × 10⁻⁶ | Communication |
| ENSG00000144681 | STAC | SH3 and cysteine rich domain | −3.241 | 3.30 × 10⁻¹² | Communication |
| ENSG00000171992 | SYNPO | synaptopodin | −1.400 | 2.83 × 10⁻³ | Communication |
| ENSG00000172403 | SYNPO2 | synaptopodin 2 | −3.016 | 9.64 × 10⁻¹⁴ | Communication |
| ENSG00000111452 | ADGRD1 | adhesion G protein-coupled receptor D1 | −1.390 | 1.36 × 10⁻³ | Communication |
| ENSG00000126016 | AMOT | angiomotin | −2.152 | 4.31 × 10⁻¹² | Communication |
| ENSG00000113209 | PCDHB5 | protocadherin beta 5 | −1.191 | 4.99 × 10⁻² | Communication |
| ENSG00000113212 | PCDHB7 | protocadherin beta 7 | −1.428 | 1.70 × 10⁻² | Communication |
| ENSG00000163531 | NFASC | neurofascin | −1.183 | 1.11 × 10⁻² | Communication |
| ENSG00000007944 | MYLIP | myosin regulatory light chain interacting protein | −1.078 | 1.18 × 10⁻⁶ | Communication |
| ENSG00000169760 | NLGN1 | neuroligin 1 | −1.523 | 3.37 × 10⁻⁵ | Communication |
| ENSG00000144857 | BOC | BOC cell adhesion associated, oncogene regulated | −1.222 | 6.43 × 10⁻⁵ | Communication |
| ENSG00000162849 | KIF26B | kinesin family member 26B | −1.849 | 5.18 × 10⁻⁶ | Communication |
| ENSG00000226237 | GAS1RR | GAS1 adjacent regulatory RNA | −1.923 | 4.31 × 10⁻³ | Communication |
| ENSG00000185565 | LSAMP | limbic system-associated membrane protein | −1.733 | 2.28 × 10⁻³ | Communication |
| ENSG00000158258 | CLSTN2 | calsyntenin 2 | −2.251 | 3.02 × 10⁻⁸ | Communication |
| ENSG00000163520 | FBLN2 | fibulin 2 | −1.135 | 8.04 × 10⁻⁵ | Communication |
| ENSG00000153707 | PTPRD | protein tyrosine phosphatase, receptor type D | −1.549 | 1.33 × 10⁻⁴ | Communication |
| ENSG00000175356 | SCUBE2 | signal peptide, CUB domain and EGF like domain containing 2 | −1.335 | 8.72 × 10⁻⁴ | Communication |
| ENSG00000182010 | RTKN2 | rhotekin 2 | −2.248 | 3.82 × 10⁻³ | Communication |
| ENSG00000068831 | RASGRP2 | RAS guanyl releasing protein 2 | −1.188 | 1.22 × 10⁻² | Communication |
| ENSG00000171408 | PDE7B | phosphodiesterase 7B | −1.071 | 1.94 × 10⁻³ | Communication |
| ENSG00000103710 | RASL12 | RAS like family 12 | −1.189 | 2.06 × 10⁻⁶ | Communication |
| ENSG00000145934 | TENM2 | teneurin transmembrane protein 2 | −1.527 | 6.39 × 10⁻³ | Communication |
| ENSG00000166448 | TMEM130 | transmembrane protein 130 | −2.267 | 5.15 × 10⁻⁶ | Communication |
| ENSG00000178401 | DNAJC22 | DnaJ heat shock protein family (Hsp40) member C22 | −1.357 | 1.14 × 10⁻⁴ | Communication |
| ENSG00000185442 | FAM174B | family with sequence similarity 174 member B | −1.141 | 2.79 × 10⁻⁷ | Communication |
| ENSG00000177363 | LRRN4CL | LRRN4 C-terminal like | −1.072 | 2.24 × 10⁻⁵ | Communication |
| ENSG00000170153 | RNF150 | ring finger protein 150 | −2.208 | 3.10 × 10⁻¹³ | Communication |
| ENSG00000185561 | TLCD2 | TLC domain containing 2 | −1.134 | 2.38 × 10⁻⁵ | Communication |
| ENSG00000151690 | MFSD6 | major facilitator superfamily domain containing 6 | −1.024 | 2.12 × 10⁻⁷ | Communication |
| ENSG00000226887 | ERVMER34-1 | endogenous retrovirus group MER34 member 1, envelope | −2.372 | 5.16 × 10⁻³ | Communication |
| ENSG00000005379 | TSPOAP1 | TSPO associated protein 1 | −2.017 | 1.32 × 10⁻⁵ | Communication |
| ENSG00000013297 | CLDN11 | claudin 11 | −1.263 | 1.23 × 10⁻⁵ | Communication |
| ENSG00000172348 | RCAN2 | regulator of calcineurin 2 | −2.240 | 9.99 × 10⁻⁸ | Communication |
| ENSG00000198542 | ITGBL1 | integrin subunit beta like 1 | −1.045 | 1.55 × 10⁻⁸ | Communication |
| ENSG00000113805 | CNTN3 | contactin 3 | −1.285 | 1.94 × 10⁻⁴ | Communication |
| ENSG00000165124 | SVEP1 | sushi, von Willebrand factor type A, EGF and pentraxin domain containing 1 | −1.546 | 1.36 × 10⁻⁴ | Communication |
| ENSG00000162804 | SNED1 | sushi, nidogen and EGF like domains 1 | −1.163 | 8.26 × 10⁻⁴ | Communication |
| ENSG00000187244 | BCAM | basal cell adhesion molecule (Lutheran blood group) | −1.088 | 3.79 × 10⁻⁵ | Communication |
| ENSG00000064309 | CDON | cell adhesion associated, oncogene regulated | −2.033 | 2.00 × 10⁻¹³ | Communication |
| ENSG00000095203 | EPB41L4B | erythrocyte membrane protein band 4.1 like 4B | −1.389 | 6.09 × 10⁻³ | Communication |
| ENSG00000157193 | LRP8 | LDL receptor related protein 8 | 1.448 | 9.21 × 10⁻⁴ | Lipids(barrier function) |
| ENSG00000073756 | PTGS2 | prostaglandin-endoperoxide synthase 2 | 1.274 | 1.20 × 10⁻⁸ | Lipids(barrier function) |
| ENSG00000123689 | G0S2 | G0/G1 switch 2 | 1.382 | 7.06 × 10⁻⁵ | Lipids(barrier function) |
| ENSG00000176170 | SPHK1 | sphingosine kinase 1 | 1.014 | 2.42 × 10⁻⁴ | Lipids(barrier function) |
| ENSG00000105499 | PLA2G4C | phospholipase A2 group IVC | 1.145 | 7.84 × 10⁻¹¹ | Lipids(barrier function) |
| ENSG00000101188 | NTSR1 | neurotensin receptor 1 | 1.895 | 2.44 × 10⁻² | Lipids(barrier function) |
| ENSG00000076555 | ACACB | acetyl-CoA carboxylase beta | −1.405 | 3.86 × 10⁻³ | Lipids(barrier function) |
| ENSG00000100342 | APOL1 | apolipoprotein L1 | −1.841 | 2.88 × 10⁻⁴ | Lipids(barrier function) |
| ENSG00000157399 | ARSE | arylsulfatase E (chondrodysplasia punctata 1) | −1.230 | 1.09 × 10⁻³ | Lipids(barrier function) |
| ENSG00000106484 | MEST | mesoderm specific transcript | −1.829 | 6.91 × 10⁻¹⁵ | Lipids(barrier function) |
| ENSG00000169255 | B3GALNT1 | beta-1,3-N-acetylgalactosaminyltransferase 1 (globoside blood group) | −1.071 | 9.26 × 10⁻⁴ | Lipids(barrier function) |
| ENSG00000120915 | EPHX2 | epoxide hydrolase 2 | −1.744 | 1.48 × 10⁻³ | Lipids(barrier function) |
| ENSG00000169174 | PCSK9 | proprotein convertase subtilisin/kexin type 9 | −2.368 | 3.78 × 10⁻² | Lipids(barrier function) |
| ENSG00000162407 | PLPP3 | phospholipid phosphatase 3 | −1.408 | 1.06 × 10⁻¹⁵ | Lipids(barrier function) |
| ENSG00000133321 | RARRES3 | retinoic acid receptor responder 3 | −1.892 | 1.00 × 10⁻² | Lipids(barrier function) |
| ENSG00000137642 | SORL1 | sortilin related receptor 1 | −1.848 | 2.32 × 10⁻² | Lipids(barrier function) |
| ENSG00000172296 | SPTLC3 | serine palmitoyltransferase long chain base subunit 3 | −2.612 | 3.34 × 10⁻⁵ | Lipids(barrier function) |
| ENSG00000129951 | PLPPR3 | phospholipid phosphatase related 3 | −1.639 | 2.62 × 10⁻² | Lipids(barrier function) |
| ENSG00000134343 | ANO3 | anoctamin 3 | −3.413 | 5.11 × 10⁻⁵ | Lipids(barrier function) |
| ENSG00000172594 | SMPDL3A | sphingomyelin phosphodiesterase acid like 3A | −1.331 | 9.50 × 10⁻⁵ | Lipids(barrier function) |
| ENSG00000147465 | STAR | steroidogenic acute regulatory protein | −1.107 | 4.63 × 10⁻² | Lipids(barrier function) |
| ENSG00000099204 | ABLIM1 | actin binding LIM protein 1 | −1.299 | 2.25 × 10⁻⁶ | Cytoskeleton organization |
| ENSG00000167549 | CORO6 | coronin 6 | −1.256 | 4.91 × 10⁻⁴ | Cytoskeleton organization |
| ENSG00000146122 | DAAM2 | dishevelled associated activator of morphogenesis 2 | −1.158 | 3.78 × 10⁻² | Cytoskeleton organization |
| ENSG00000139734 | DIAPH3 | diaphanous related formin 3 | −1.223 | 2.20 × 10⁻² | Cytoskeleton organization |
| ENSG00000082397 | EPB41L3 | erythrocyte membrane protein band 4.1 like 3 | −1.296 | 2.38 × 10⁻⁸ | Cytoskeleton organization |
| ENSG00000078018 | MAP2 | microtubule associated protein 2 | −3.102 | 1.25 × 10⁻¹¹ | Cytoskeleton organization |
| ENSG00000116141 | MARK1 | microtubule affinity regulating kinase 1 | −1.291 | 9.50 × 10⁻⁵ | Cytoskeleton organization |
| ENSG00000133026 | MYH10 | myosin heavy chain 10 | −1.297 | 2.58 × 10⁻³ | Cytoskeleton organization |
| ENSG00000099864 | PALM | paralemmin | −1.255 | 3.72 × 10⁻⁹ | Cytoskeleton organization |
| ENSG00000118898 | PPL | periplakin | −2.858 | 4.50 × 10⁻¹⁶ | Cytoskeleton organization |
| ENSG00000126785 | RHOJ | ras homolog family member J | −1.184 | 1.02 × 10⁻² | Cytoskeleton organization |
| ENSG00000168477 | TNXB | tenascin XB | −1.431 | 1.19 × 10⁻³ | Cytoskeleton organization |
| ENSG00000137285 | TUBB2B | tubulin beta 2B class IIb | −1.460 | 4.75 × 10⁻⁹ | Cytoskeleton organization |
| ENSG00000148700 | ADD3 | adducin 3 | −1.009 | 2.68 × 10⁻⁶ | Cytoskeleton organization |
| ENSG00000231789 | PIK3CD-AS2 | PIK3CD antisense RNA 2 | −1.395 | 1.54 × 10⁻² | Cytoskeleton organization |
| ENSG00000152527 | PLEKHH2 | pleckstrin homology, MyTH4 and FERM domain containing H2 | −1.017 | 4.84 × 10⁻³ | Cytoskeleton organization |
| ENSG00000188783 | PRELP | proline and arginine rich end leucine rich repeat protein | −1.594 | 2.61 × 10⁻²⁹ | Cytoskeleton organization |
| ENSG00000222047 | C10orf55 | chromosome 10 open reading frame 55 | 1.712 | 4.81 × 10⁻³ | Unknown |
| ENSG00000163814 | CDCP1 | CUB domain containing protein 1 | 1.621 | 2.86 × 10⁻¹⁷ | Unknown |
| ENSG00000154319 | FAM167A | family with sequence similarity 167 member A | 1.082 | 5.30 × 10⁻¹⁰ | Unknown |
| ENSG00000166578 | IQCD | IQ motif containing D | 1.637 | 1.34 × 10⁻⁶ | Unknown |
| ENSG00000253522 | MIR3142HG | MIR3142 host gene | 1.555 | 1.41 × 10⁻² | Unknown |
| ENSG00000164929 | BAALC | brain and acute leukemia, cytoplasmic | 1.215 | 1.50 × 10⁻² | Unknown |
| ENSG00000239704 | CDRT4 | CMT1A duplicated region transcript 4 | 3.443 | 2.85 × 10⁻² | Unknown |
| ENSG00000260549 | MT1L | metallothionein 1L, pseudogene | 2.582 | 6.86 × 10⁻⁵ | Unknown |
| ENSG00000187193 | MT1X | metallothionein 1X | 1.349 | 4.34 × 10⁻² | Unknown |
| ENSG00000125148 | MT2A | metallothionein 2A | 2.408 | 4.51 × 10⁻⁵ | Unknown |
| ENSG00000217930 | PAM16 | presequence translocase associated motor 16 homolog | 1.400 | 3.06 × 10⁻² | Unknown |
| ENSG00000241749 | RPSAP52 | ribosomal protein SA pseudogene 52 | 1.471 | 8.60 × 10⁻⁶ | Unknown |
| ENSG00000186577 | SMIM29 | small integral membrane protein 29 | 1.077 | 3.37 × 10⁻² | Unknown |
| ENSG00000157111 | TMEM171 | transmembrane protein 171 | 1.540 | 4.72 × 10⁻² | Unknown |
| ENSG00000185262 | UBALD2 | UBA like domain containing 2 | 1.329 | 2.38 × 10⁻³ | Unknown |
| ENSG00000240476 | LINC00973 | long intergenic non-protein coding RNA 973 | 2.326 | 5.72 × 10⁻³ | Unknown |
| ENSG00000257219 | LINC02407 | long intergenic non-protein coding RNA 2407 | 2.301 | 7.04 × 10⁻³ | Unknown |
| ENSG00000235385 | LINC02154 | long intergenic non-protein coding RNA 2154 | 2.177 | 2.30 × 10⁻³ | Unknown |
| ENSG00000164236 | ANKRD33B | ankyrin repeat domain 33B | −1.240 | 3.89 × 10⁻³ | Unknown |
| ENSG00000264230 | ANXA8L1 | annexin A8 like 1 | −2.813 | 4.43 × 10⁻⁴ | Unknown |
| ENSG00000198624 | CCDC69 | coiled-coil domain containing 69 | −1.320 | 6.43 × 10⁻¹³ | Unknown |
| ENSG00000055813 | CCDC85A | coiled-coil domain containing 85A | −2.721 | 1.19 × 10⁻² | Unknown |
| ENSG00000105516 | DBP | D-box binding PAR bZIP transcription factor | −1.355 | 3.37 × 10⁻² | Unknown |
| ENSG00000258498 | DIO3OS | DIO3 opposite strand/antisense RNA (head to head) | −1.035 | 2.02 × 10⁻³ | Unknown |
| ENSG00000229847 | EMX2OS | EMX2 opposite strand/antisense RNA | −1.016 | 1.90 × 10⁻⁴ | Unknown |
| ENSG00000133106 | EPSTI1 | epithelial stromal interaction 1 | −1.184 | 3.04 × 10⁻¹³ | Unknown |
| ENSG00000162636 | FAM102B | family with sequence similarity 102 member B | −1.024 | 3.21 × 10⁻⁴ | Unknown |
| ENSG00000255052 | FAM66D | family with sequence similarity 66 member D | −1.599 | 4.85 × 10⁻³ | Unknown |
| ENSG00000265962 | GACAT2 | gastric cancer associated transcript 2 (non-protein coding) | −1.788 | 7.03 × 10⁻³ | Unknown |
| ENSG00000072163 | LIMS2 | LIM zinc finger domain containing 2 | −1.501 | 3.09 × 10⁻¹⁷ | Unknown |
| ENSG00000225783 | MIAT | myocardial infarction associated transcript (non-protein coding) | −2.924 | 4.61 × 10⁻¹¹ | Unknown |
| ENSG00000220785 | MTMR9LP | myotubularin related protein 9-like, pseudogene | −1.153 | 3.36 × 10⁻³ | Unknown |
| ENSG00000183486 | MX2 | MX dynamin like GTPase 2 | −1.475 | 1.38 × 10⁻⁴ | Unknown |
| ENSG00000143850 | PLEKHA6 | pleckstrin homology domain containing A6 | −1.190 | 4.27 × 10⁻³ | Unknown |
| ENSG00000230487 | PSMG3-AS1 | PSMG3 antisense RNA 1 (head to head) | −1.008 | 2.36 × 10⁻³ | Unknown |
| ENSG00000203727 | SAMD5 | sterile alpha motif domain containing 5 | −2.663 | 2.06 × 10⁻¹⁴ | Unknown |
| ENSG00000111907 | TPD52L1 | tumor protein D52 like 1 | −1.743 | 1.79 × 10⁻² | Unknown |
| ENSG00000183801 | OLFML1 | olfactomedin like 1 | −2.388 | 6.30 × 10⁻¹⁸ | Unknown |
| ENSG00000116774 | OLFML3 | olfactomedin like 3 | −1.813 | 3.10 × 10⁻²⁷ | Unknown |
| ENSG00000103145 | HCFC1R1 | host cell factor C1 regulator 1 | −1.254 | 9.23 × 10⁻⁴ | Unknown |
| ENSG00000156042 | CFAP70 | cilia and flagella associated protein 70 | −1.335 | 4.93 × 10⁻² | Unknown |
| ENSG00000147642 | SYBU | syntabulin | −1.633 | 2.50 × 10⁻² | Unknown |
| ENSG00000165507 | C10orf10 | chromosome 10 open reading frame 10 | −1.072 | 1.75 × 10⁻⁶ | Unknown |
| ENSG00000110002 | VWA5A | von Willebrand factor A domain containing 5A | −1.182 | 3.26 × 10⁻⁷ | Unknown |
| ENSG00000082497 | SERTAD4 | SERTA domain containing 4 | −1.686 | 8.66 × 10⁻⁹ | Unknown |
| ENSG00000130518 | KIAA1683 | KIAA1683 | −1.007 | 1.23 × 10⁻² | Unknown |
| ENSG00000152217 | SETBP1 | SET binding protein 1 | −1.253 | 7.10 × 10⁻⁴ | Unknown |
| ENSG00000198846 | TOX | thymocyte selection associated high mobility group box | −1.792 | 1.29 × 10⁻⁴ | Unknown |
| ENSG00000139714 | MORN3 | MORN repeat containing 3 | −1.540 | 4.27 × 10⁻² | Unknown |
| ENSG00000164309 | CMYA5 | cardiomyopathy associated 5 | −1.344 | 3.12 × 10⁻² | Unknown |
| ENSG00000072952 | MRVI1 | murine retrovirus integration site 1 homolog | −1.251 | 7.52 × 10⁻⁵ | Unknown |
| ENSG00000204789 | ZNF204P | zinc finger protein 204, pseudogene | −2.032 | 4.81 × 10⁻³ | Unknown |
| ENSG00000116667 | C1orf21 | chromosome 1 open reading frame 21 | −1.219 | 3.04 × 10⁻¹² | Unknown |
| ENSG00000120262 | CCDC170 | coiled-coil domain containing 170 | −1.921 | 8.42 × 10⁻⁹ | Unknown |
| ENSG00000204396 | VWA7 | von Willebrand factor A domain containing 7 | −2.105 | 1.73 × 10⁻² | Unknown |
| Samples | RFB | HBFB | OFB | |
|---|---|---|---|---|
| Matter Content (%) | ||||
| Total sugar | 43.36 ± 0.14 | 12.16 ± 0.11 | 9.69 ± 0.17 | |
| Reducing sugar | 3.18 ± 0.01 | 0.91 ± 0.03 | 0.12 ± 0.02 | |
| β-glucan | 0.78 ± 0.05 | 0.84 ± 0.08 | 2.74 ± 0.04 | |
| Flavonoids | 1.11 ± 0.01 | 1.31 ± 0.06 | 1.17 ± 0.01 | |
| Total phenol | 1.46 ± 0.09 | 1.84 ± 0.05 | 1.75 ± 0.03 | |
| Samples | RFB | HBFB | OFB | |
|---|---|---|---|---|
| Matter Content (%) | ||||
| Fat | 0.6 | 1.1 | 0.9 | |
| Protein proportion | 7.83 | 14.9 | 27.3 | |
| Ash | 0.35 | 4.0 | 4.6 | |
| Moisture | 7.3 | 6.71 | 7.95 | |
| Carbohydrate | 83.9 | 73.3 | 59.2 | |
Disclaimer/Publisher’s Note: The statements, opinions and data contained in all publications are solely those of the individual author(s) and contributor(s) and not of MDPI and/or the editor(s). MDPI and/or the editor(s) disclaim responsibility for any injury to people or property resulting from any ideas, methods, instructions or products referred to in the content. |
© 2023 by the authors. Licensee MDPI, Basel, Switzerland. This article is an open access article distributed under the terms and conditions of the Creative Commons Attribution (CC BY) license (https://creativecommons.org/licenses/by/4.0/).
Share and Cite
Cheng, W.; Shi, X.; Zhang, J.; Li, L.; Di, F.; Li, M.; Wang, C.; An, Q.; Zhao, D. Role of PI3K-AKT Pathway in Ultraviolet Ray and Hydrogen Peroxide-Induced Oxidative Damage and Its Repair by Grain Ferments. Foods 2023, 12, 806. https://doi.org/10.3390/foods12040806
Cheng W, Shi X, Zhang J, Li L, Di F, Li M, Wang C, An Q, Zhao D. Role of PI3K-AKT Pathway in Ultraviolet Ray and Hydrogen Peroxide-Induced Oxidative Damage and Its Repair by Grain Ferments. Foods. 2023; 12(4):806. https://doi.org/10.3390/foods12040806
Chicago/Turabian StyleCheng, Wenjing, Xiuqin Shi, Jiachan Zhang, Luyao Li, Feiqian Di, Meng Li, Changtao Wang, Quan An, and Dan Zhao. 2023. "Role of PI3K-AKT Pathway in Ultraviolet Ray and Hydrogen Peroxide-Induced Oxidative Damage and Its Repair by Grain Ferments" Foods 12, no. 4: 806. https://doi.org/10.3390/foods12040806