
Evaluation of Bioactive Compounds and Antioxidant Activity in 51 Minor Tropical Fruits of Ecuador
 , , and
Abstract
:
1. Introduction
2. Materials and Methods
2.1. Reagents and Standards
2.2. Physico-Chemical Analyses
2.3. Analysis of Bioactive Compounds
2.3.1. Vitamin C
2.3.2. Organic Acid
2.3.3. Carotenoids
2.3.4. Phenolics
2.4. Antioxidant Activity Analyses
2.5. Statistical Analysis
3. Results
3.1. Physico-Chemical Analyses
3.1.1. Weight
3.1.2. Size
3.1.3. pH
3.1.4. Soluble Solid
3.1.5. Total Titratable Acid
3.1.6. Humidity
3.1.7. Ash
3.2. Analysis of Bioactive Compounds
3.2.1. Vitamin C
3.2.2. Organic Acid
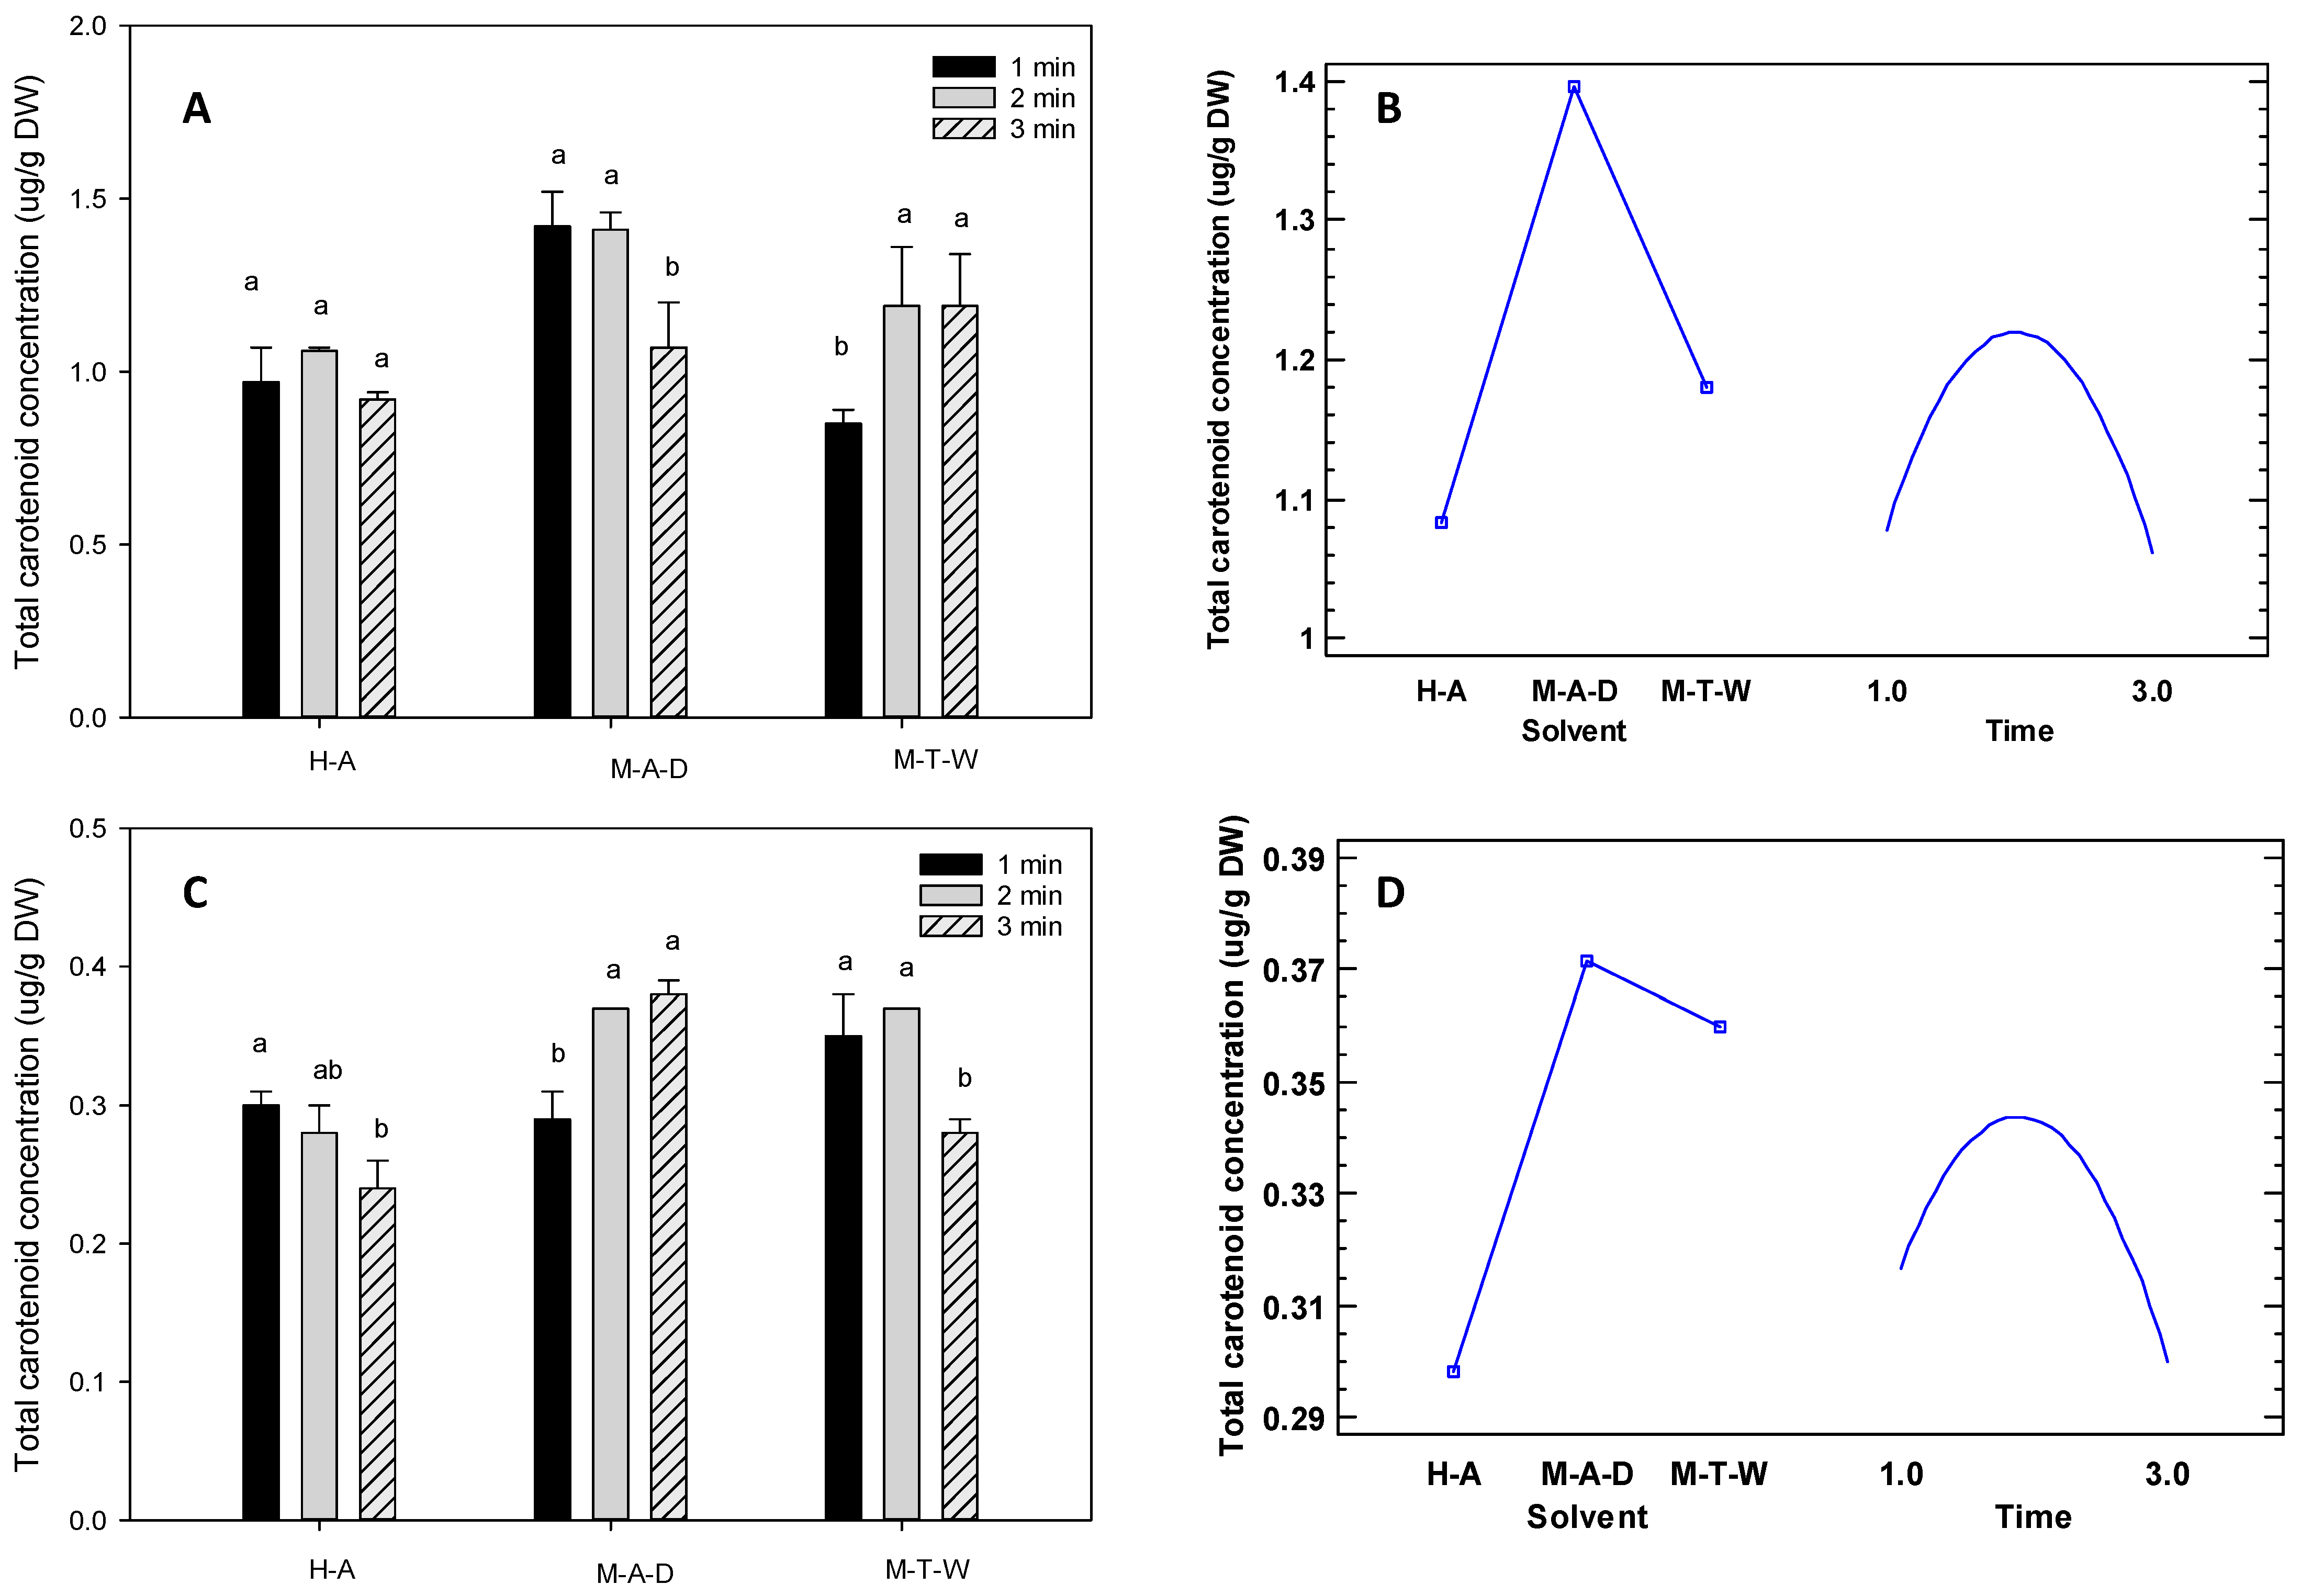
3.2.3. Carotenoids
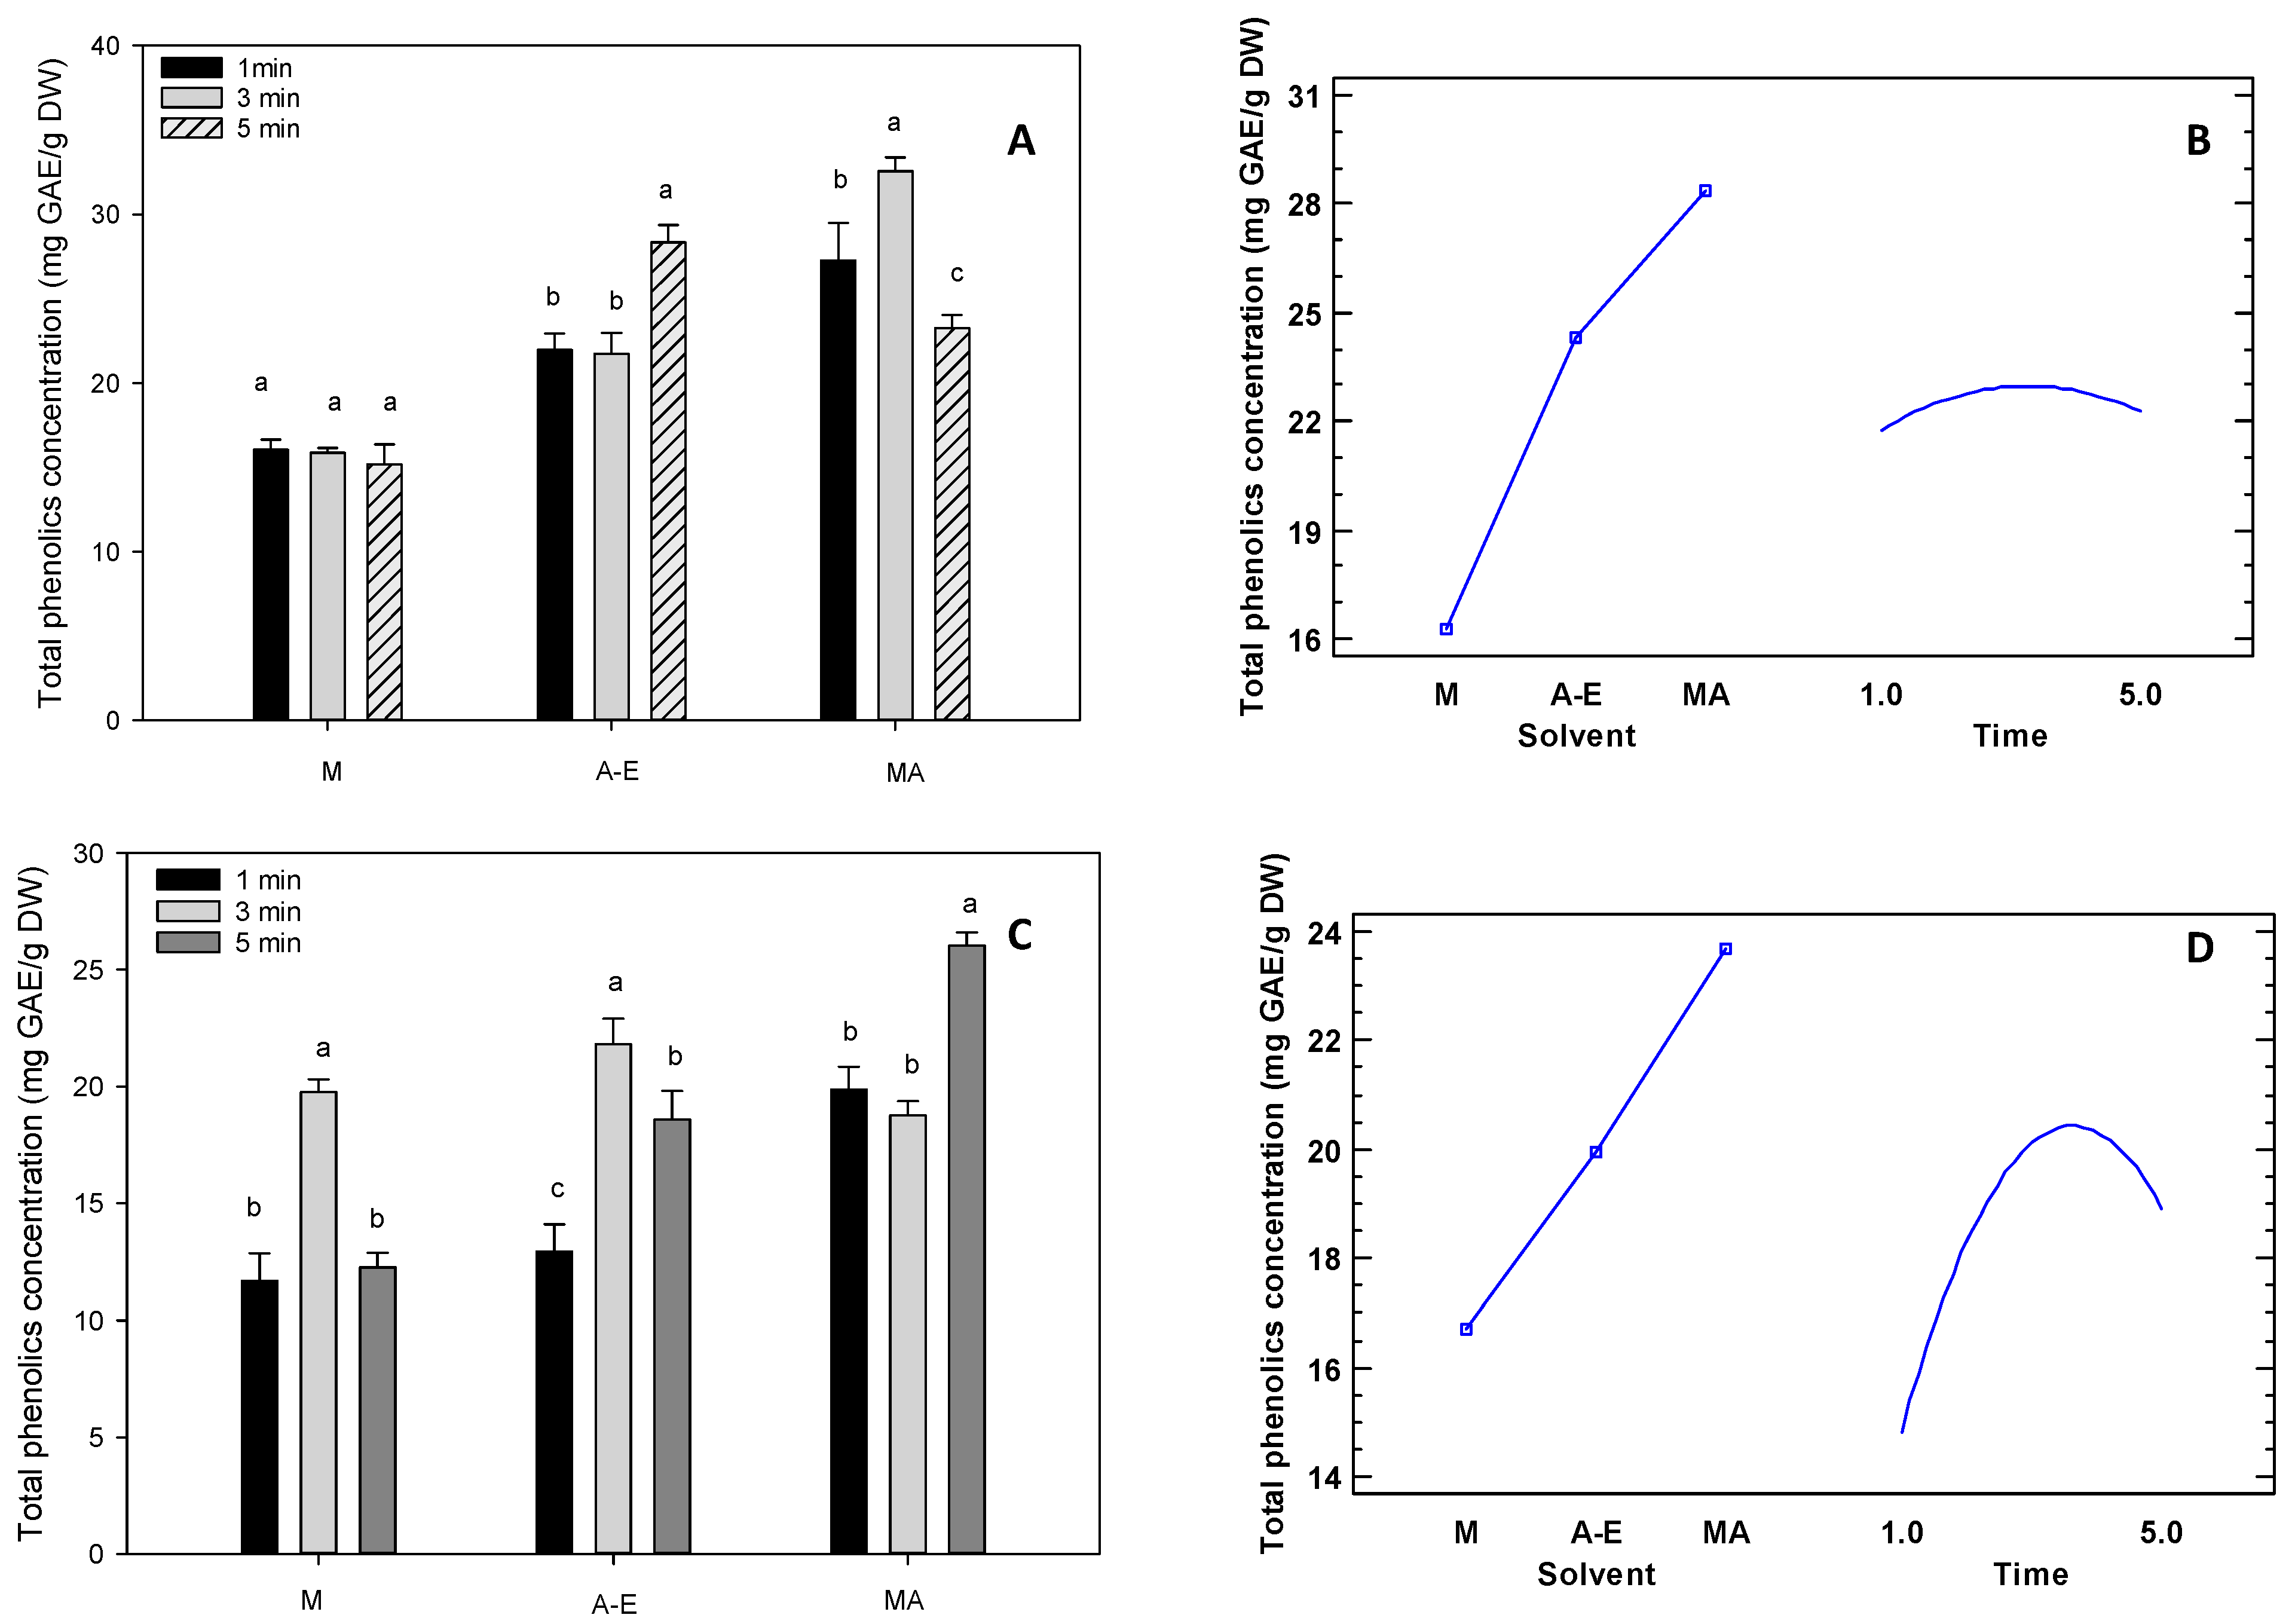
3.2.4. Phenolics
3.3. Antioxidant Activity Analyses
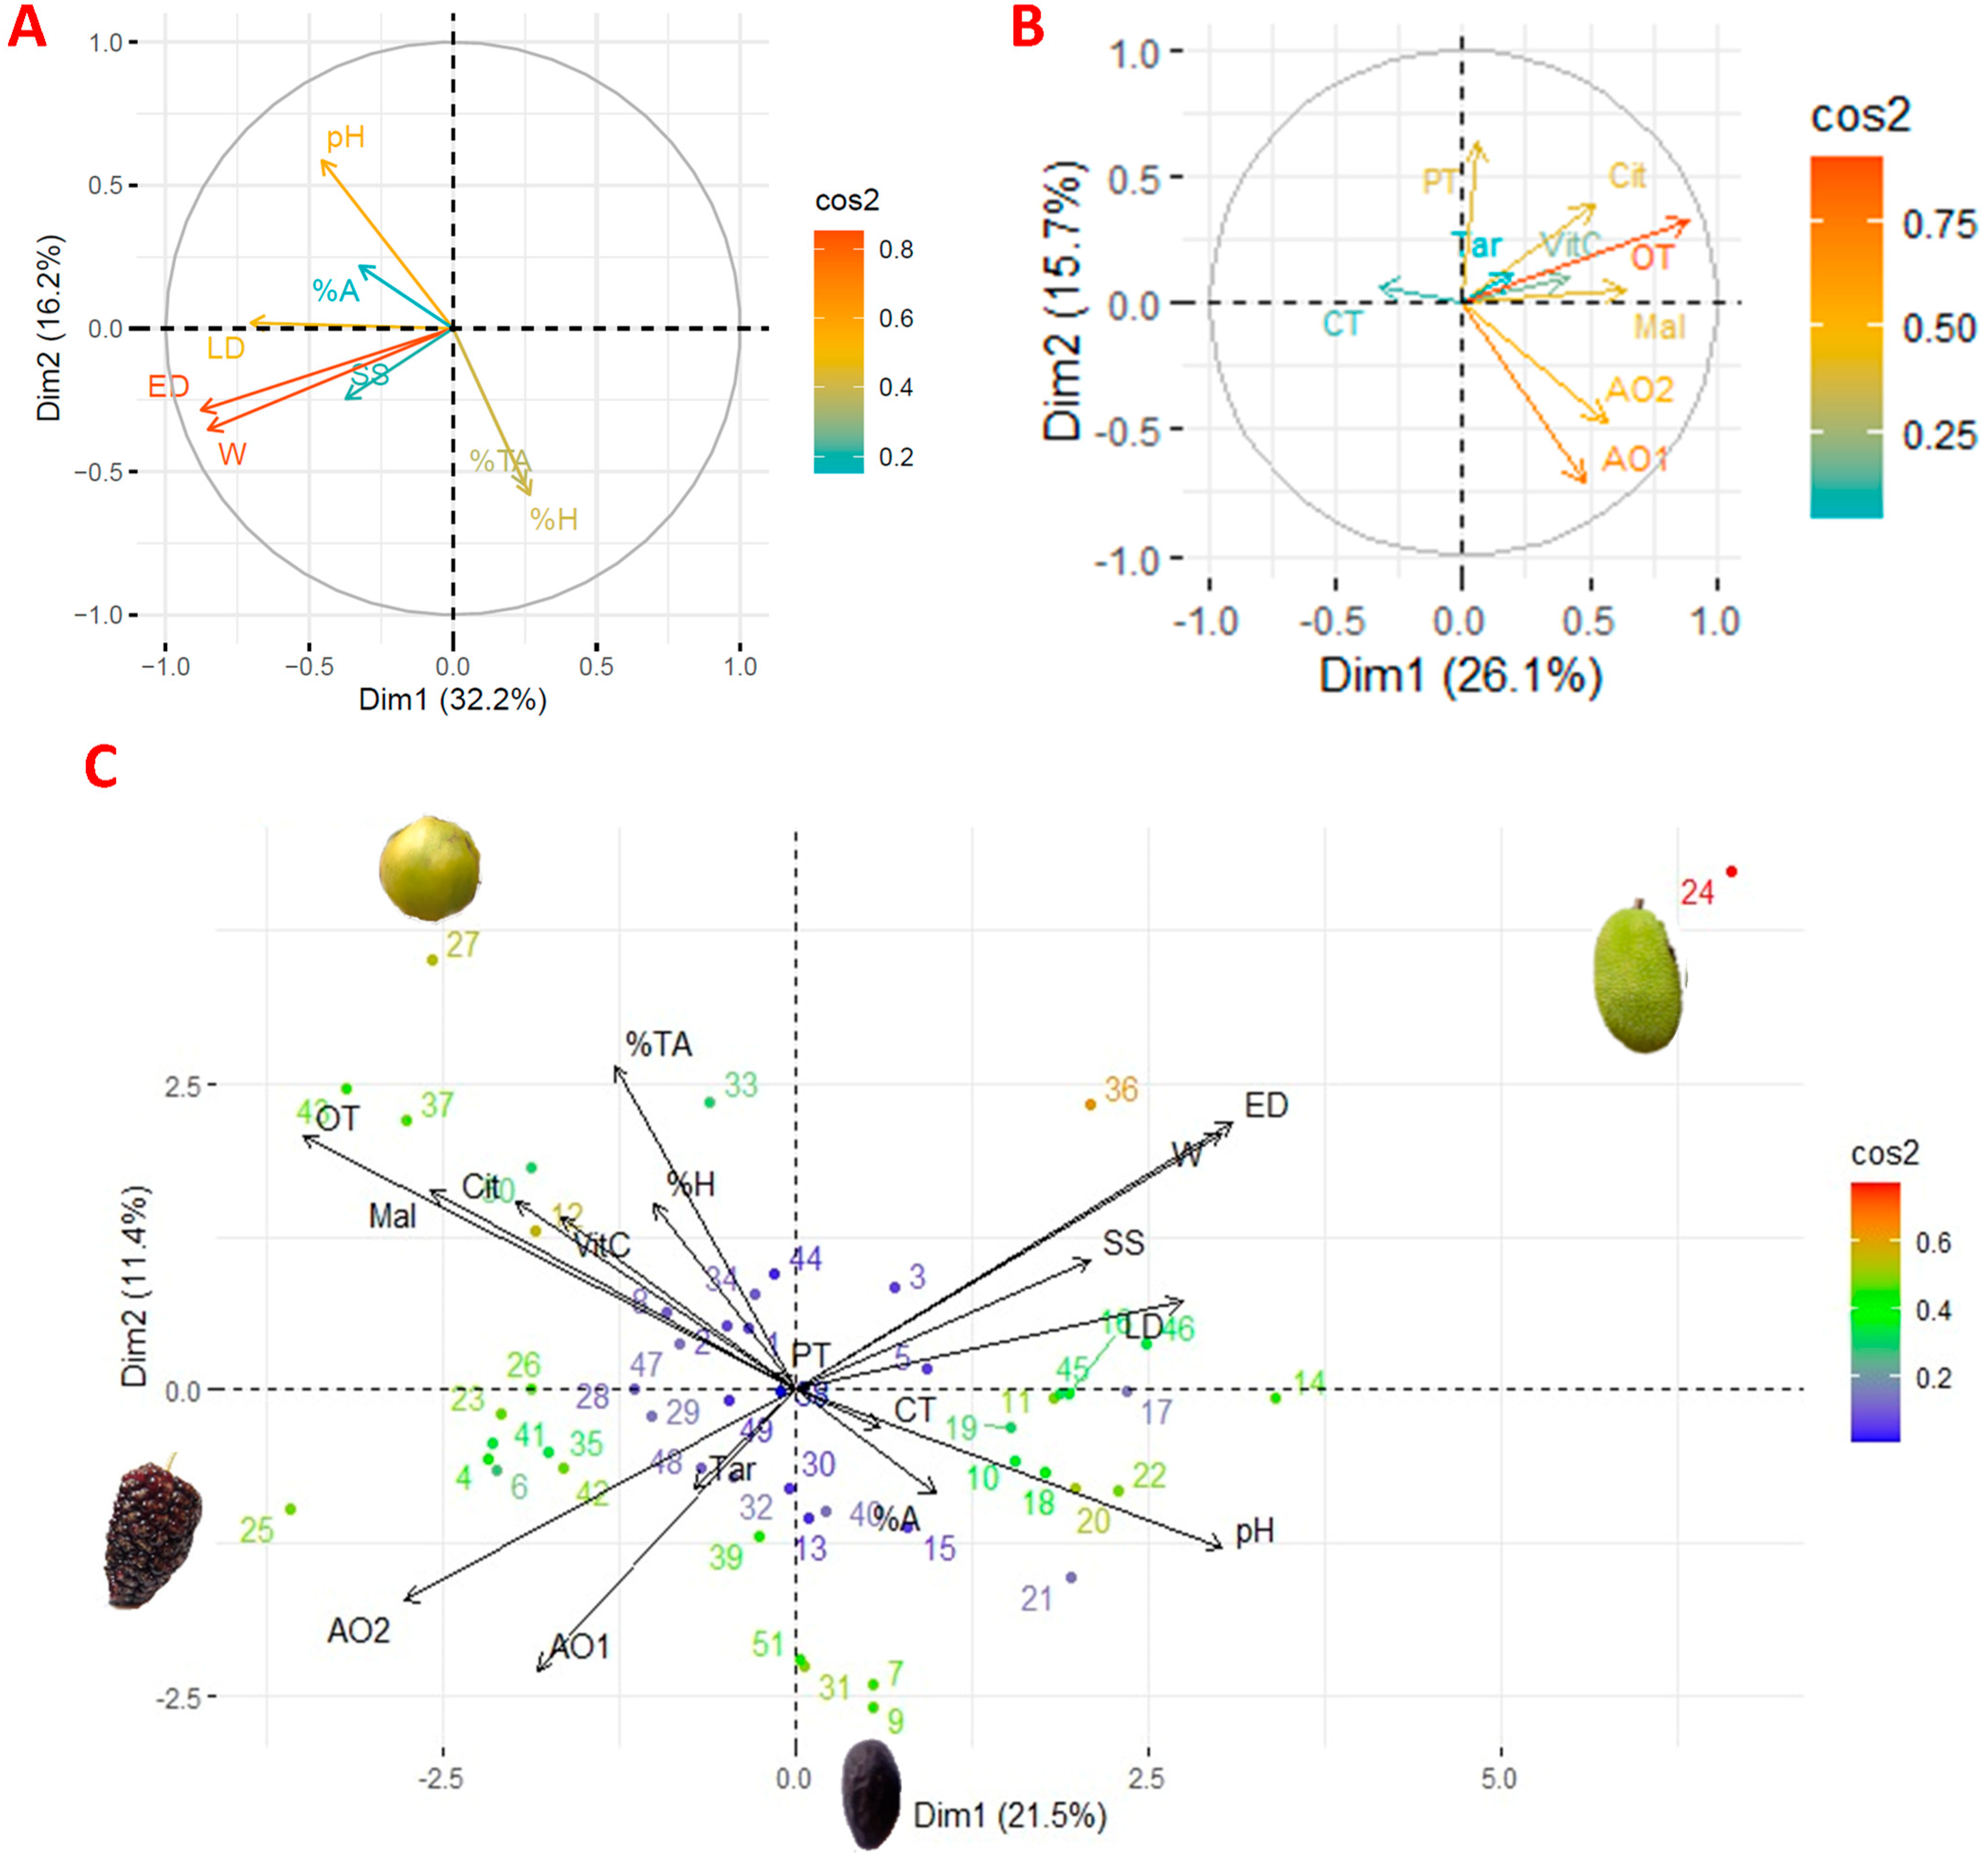
3.4. Statistical Analyses
4. Conclusions
Author Contributions
Funding
Data Availability Statement
Conflicts of Interest
Abbreviations
References
- Belmonte-Herrera, B.; Domínguez-Avila, J.; Wall-Medrano, A.; Ayala-Zavala, J.; Preciado-Saldaña, A.; Salazar-López, N.; López-Martínez, L.; Yahia, E.; Robles-Sánchez, R.; Gonzáles-Aguilar, G. Lesser-Cosumed Tropical Fruits and Their by-Products: Phytochemical Content and Their Antioxidant and Anti-Inflammatory Potential. Nutrients 2022, 14, 3663. [Google Scholar] [CrossRef]
- Coyago-Cruz, E.; Guachamin, A.; Méndez, G.; Moya, M.; Viera, W.; Heredia-Moya, J.; Beltrán, E.; Vera, E.; Villacís, M. Functional and Antioxidant Evaluation of Two Ecotypes of Control and Grafted Tree Tomato (Solanum betaceum) at Different Altitudes. Foods 2023, 12, 3494. [Google Scholar] [CrossRef]
- Cádiz-Gurrea, M.; Villegas-Aguilar, M.D.; Leyva-Jiménez, F.; Pimentel-Moral, S.; Fernández-Ochoa, Á.; Alañón, M.; Segura-Carretero, A. Revalorization of Bioactive Compounds from Tropical Fruit By-Products and Industrial Applications by Means of Sustainable Approaches. Food Res. Int. 2020, 138, 109786. [Google Scholar] [CrossRef]
- Ding, Z.; Ge, Y.; Sar, T.; Kumar, V.; Harirchi, S.; Binod, P.; Sirohi, R.; Sindhu, R.; Wu, P.; Lin, F.; et al. Valorization of Tropical Fruits Waste for Production of Commercial Biorefinery Products—A Review. Bioresour. Technol. 2023, 374, 128793. [Google Scholar] [CrossRef]
- Sarkar, T.; Salauddin, M.; Roy, A.; Sharma, N.; Sharma, A.; Yadav, S.; Jha, V.; Rebezov, M.; Khayrullin, M.; Thiruvengadam, M.; et al. Minor Tropical Fruits as a Potential Source of Bioactive and Functional Foods. Crit. Rev. Food Sci. Nutr. 2023, 63, 6491–6535. [Google Scholar] [CrossRef]
- Popkova, E.; Sergi, B.; Bogoviz, A.; Semenova, E. Digital Agriculture for Food Security and Sustainable Development of the Agro-Industrial Complex; Springer Nature: Cham, Switzerland, 2023; ISBN 9783031279102. [Google Scholar]
- Sayago-Ayerdi, S.; García-Martínez, D.; Ramírez-Castillo, A.; Ramírez-Concepción, H.; Viuda-Martos, M. Tropical Fruits and Their Co-Products as Bioactive Compounds and Their Health Effects: A Review. Foods 2021, 10, 1952. [Google Scholar] [CrossRef] [PubMed]
- Guevara, M.; Tejera, E.; Granda-Albuja, M.G.; Iturralde, G.; Chisaguano-Tonato, M.; Granda-Albuja, S.; Jaramillo-Vivanco, T.; Giampieri, F.; Battino, M.; Alvarez-Suarez, J.M. Chemical Composition and Antioxidant Activity of the Main Fruits Consumed in the Western Coastal Region of Ecuador as a Source of Health-Promoting Compounds. Antioxidants 2019, 8, 387. [Google Scholar] [CrossRef] [PubMed]
- De-la-Torre, L.; Navarrete, H.; Muriel, P.; Macá, M.; Balslev, H. Enciclopedia de Las Plantas Útiles Del Ecuador. 2008. ISBN 9789978771358. Available online: https://bibdigital.rjb.csic.es/records/item/16016-enciclopedia-de-las-plantas-utiles-del-ecuador (accessed on 3 December 2023).
- Vasco, C.; Ruales, J.; Kamal-Eldin, A. Total Phenolic Compounds and Antioxidant Capacities of Major Fruits from Ecuador. Food Chem. 2008, 111, 816–823. [Google Scholar] [CrossRef]
- Llerena, W.; Ang, I.; Brito, B.; Ortiz, B. Biocompounds Content Prediction in Ecuadorian Fruits Using a Mathematicalmodel. Foods 2019, 8, 284. [Google Scholar] [CrossRef] [PubMed]
- Appleton, K.; Boxall, L.; Adenuga-Ajayi, O.; Seyar, D. Does Fruit and Vegetable Consumption Impact Mental Health? Systematic Review and Meta-Analyses of Published Controlled Intervention Studies. Br. J. Nutr. 2023, 1, 1–11. [Google Scholar] [CrossRef] [PubMed]
- Wang, Y.; Haskell-Ramsay, C.; Lara, J.; Lodge, J. Effects of Chronic Consumption of Specific Fruit (Berries, Cherries and Citrus) on Cognitive Health: A Systematic Review and Meta-Analysis of Randomised Controlled Trials. Eur. J. Clin. Nutr. 2023, 77, 7–22. [Google Scholar] [CrossRef]
- Rahaman, M.; Hossain, R.; Herrera-Bravo, J.; Islam, M.; Atolani, O.; Adeyemi, O.; Owolodun, O.; Kambizi, L.; Daştan, S.; Calina, D.; et al. Natural Antioxidants from Some Fruits, Seeds, Foods, Natural Products, and Associated Health Benefits: An Update. Food Sci. Nutr. 2023, 11, 1657–1670. [Google Scholar] [CrossRef]
- Jiang, Q.; Charoensiddhi, S.; Xue, X.; Sun, B.; Liu, Y.; El-Seedi, H.; Wang, K. A Review on the Gastrointestinal Protective Effects of Tropical Fruit Polyphenols. Crit. Rev. Food Sci. Nutr. 2023, 63, 7197–7223. [Google Scholar] [CrossRef]
- Fenech, M.; Amaya, I.; Valpuesta, V.; Botella, M. Vitamin C Content in Fruits: Biosynthesis and Regulation. Front. Plant Sci. 2019, 9, 2006. [Google Scholar] [CrossRef]
- Bromberger, M.; De-Marsillac, L.; Peixoto, B. Green Technologies for the Extraction of Bioactive Compounds in Fruits and Vegetables. CYTA-J. Food 2018, 16, 400–412. [Google Scholar] [CrossRef]
- Coyago-Cruz, E.; Corell, M.; Moriana, A.; Hernanz, D.; Stinco, C.M.; Mapelli-Brahm, P.; Meléndez-Martínez, A.J. Effect of Regulated Deficit Irrigation on Commercial Quality Parameters, Carotenoids, Phenolics and Sugars of the Black Cherry Tomato (Solanum lycopersicum L.) ‘Sunchocola’. J. Food Compos. Anal. 2022, 105, 104220. [Google Scholar] [CrossRef]
- Coyago-Cruz, E.; Corell, M.; Stinco, C.; Hernanz, D.; Moriana, A.; Meléndez-Martínez, A. Effect of Regulated Deficit Irrigation on Quality Parameters, Carotenoids and Phenolics of Diverse Tomato Varieties (Solanum lycopersicum L.). Food Res. Int. 2017, 96, 72–83. [Google Scholar] [CrossRef] [PubMed]
- Zhang, W.; Jiang, Y.; Zhang, Z. The Role of Different Natural Organic Acids in Postharvest Fruit Quality Management and Its Mechanism. Food Front. 2023, 4, 1127–1143. [Google Scholar] [CrossRef]
- Johnson, J.; Walsh, K.; Naiker, M. The Use of Infrared Spectroscopy for the Quantification of Bioactive Compounds Infood: A Review. Molecules 2023, 28, 3215. [Google Scholar] [CrossRef] [PubMed]
- Wen, C.; Zhang, J.; Zhang, H.; Dzah, C.; Zandile, M.; Duan, Y.; Ma, H.; Luo, X. Advances in Ultrasound Assisted Extraction of Bioactive Compounds from Cash Crops—A Review. Ultrason. Sonochem. 2018, 48, 538–549. [Google Scholar] [CrossRef]
- Perera, C.; Alzahrani, M. Ultrasound as a Pre-Treatment for Extraction of Bioactive Compounds and Food Safety: A Review. Lebensm.-Wiss. Technol. 2021, 142, 6. [Google Scholar] [CrossRef]
- Sánchez-Capa, M.; Corell González, M.; Mestanza-Ramón, C. Edible Fruits from the Ecuadorian Amazon: Ethnobotany, Physicochemical Characteristics, and Bioactive Components. Plants 2023, 12, 3635. [Google Scholar] [CrossRef]
- INEN. NTE-INEN-1750:1994; Hortalizas y Frutas Frescas. Muestreo: Quito, Ecuador, 2012.
- AGROCALIDAD. AGROCALIDAD-INT/CPA/01 Instructivo de Muestreo de Productos Agricolas Para Analisis de Residuos de Plaguicidas. Agencia Regul. Control. Fito y Zoosanit 2018, 11. Available online: https://www.agrocalidad.gob.ec/wp-content/uploads/2020/05/conta3.pdf (accessed on 3 December 2023).
- Coyago-Cruz, E.; Corell, M.; Meléndez-Martínez, A. Estudio Sobre El Contenido En Carotenoides y Compuestos Fenólicos de Tomates y Flores En El Contexto de La Alimentación Funcional; Punto Rojo Libros, S.L.: Sevilla, España, 2017; ISBN 9788417148096. [Google Scholar]
- INEN. NTE-INEN-ISO-1842:2013; Productos Vegetales y de Frutas—Determinación de PH (IDT)). Instituto Ecuatoriano de Normalización: Quito, Ecuador, 2020; Volume 1.
- NTE-INEN-ISO 750:2013; Productos Vegetales y de Frutas—Determinación de La Acidez Titulable (IDT). Instituto Ecuatoriano de Normalización: Quito, Ecuador, 2013; Volume 1998, pp. 1–5.
- DIN-EN-14130; NSAI Foodstuffs—Determination of Vitamin C by HPLC. National Standards Authority of Ireland: Dublin, Ireland, 2003; pp. 2–7.
- Macrae, R.; Schweigert, B. HPLC in Food Analysis (Food Science and Technology), 2nd ed.; Academic Press: Cambridge, MA, USA, 1988; Volume 1. [Google Scholar]
- Kuskoski, E.; Asuero, A.; Troncoso, A.; Mancini-Filho, J.; Fett, R. Aplicación de Diversos Métodos Químicos Para Determinar Actividad Antioxidante En Pulpa de Frutos. Ciênc. Tecnol. Aliment. 2005, 25, 726–732. [Google Scholar] [CrossRef]
- Rivero-Pérez, M.D.; Muñiz, P.; González-Sanjosé, M.L. Antioxidant Profile of Red Wines Evaluated by Total Antioxidant Capacity, Scavenger Activity, and Biomarkers of Oxidative Stress Methodologies. J. Agric. Food Chem. 2007, 55, 5476–5483. [Google Scholar] [CrossRef] [PubMed]
- Chan, Y.; Cheng, N.; Nigam, P.; Owusu-Apenten, R. Effect of PH on the Radical Quenching Capacity of Tea Infusions Using the ABTS•+ Assay. J. Appl. Life Sci. Int. 2016, 6, 1–8. [Google Scholar] [CrossRef] [PubMed]
- Pires, J.; Torres, P.; Dos-Santos, D.; Chow, F. Ensaio Em Microplaca Do Potencial Antioxidante Através Do Sistema Quelante de Metais Para Extratos de Algas. Inst. Biociências da Univ. São Paulo 2017, 1, 2–6. [Google Scholar] [CrossRef]
- Silva, V.; Clarissa, C.; Ramirez, E. Evaluation of Physical and Chemical Parameters of the Sapota (Quararibea Cordata Vischer): A Fruit of the Amazon Brazilian. Rev. Verde Agroecol. Desenvolvimiento Sustentable 2014, 9, 66–70. [Google Scholar]
- Ranasinghe, R.; Maduwanthi, S.; Marapana, R. Nutritional and Health Benefits of Jackfruit (Artocarpus heterophyllus Lam.): A Review. Int. J. Food Sci. 2019, 2019, 4327183. [Google Scholar] [CrossRef]
- Bochi, V.; Barcia, M.; Rodrigues, D.; Godoy, H. Biochemical Characterization of Dovyalis hebecarpa Fruits: A Source of Anthocyanins with High Antioxidant Capacity. J. Food Sci. 2015, 80, C2127–C2133. [Google Scholar] [CrossRef]
- Lugo-Morales, Y.; Díaz-Solares, M.; Altunaga-Pérez, N.; Castro-Cabrera, I.; Fonte-Carballo, L.; Cepero-Casas, L.; González-Sierra, L. Composición Proximal y Propiedades Físicas de Frutos de Siete Variedades de Morus alba L. Pastos Forrajes 2019, 42, 213–217. [Google Scholar]
- Verona-Ruiz, A.; Urcia-Cerna, J.; Paucar-Menacho, L. Pitahaya (Hylocereus spp.): Culture, Physicochemical Characteristics, Nutritional Composition, and Bioactive Compounds. Sci. Agropecu. 2020, 11, 439–453. [Google Scholar] [CrossRef]
- Coyago-Cruz, E.; Corell, M.; Moriana, A.; Mapelli-Brahm, P.; Hernanz, D.; Stinco, C.; Beltrán-Sinchiguano, E.; Meléndez-Martínez, A. Study of Commercial Quality Parameters, Sugars, Phenolics, Carotenoids and Plastids in Different Tomato Varieties. Food Chem. 2019, 277, 480–489. [Google Scholar] [CrossRef]
- Coyago-Cruz, E.; Corell, M.; Moriana, A.; Hernanz, D.; Stinco, C.; Meléndez-Martínez, A. Effect of the Fruit Position on the Cluster on Fruit Quality, Carotenoids, Phenolics and Sugars in Cherry Tomatoes (Solanum lycopersicum L.). Food Res. Int. 2017, 100, 804–813. [Google Scholar] [CrossRef] [PubMed]
- Monteiro, S. Sapota-do-Solimões (Quararibea Cordata)—Caracterização FíSico-Química, Estabilidade e Compostos Bioativos Voláteis; Universidade Federal De Santa Maria: Santa Maria, CA, USA, 2017. [Google Scholar]
- Coyago-Cruz, E.; Corell, M.; Moriana, A.; Hernanz, D.; Benítez-González, A.M.; Stinco, C.M.; Meléndez-Martínez, A.J. Antioxidants (Carotenoids and Phenolics) Profile of Cherry Tomatoes as Influenced by Deficit Irrigation, Ripening and Cluster. Food Chem. 2018, 240, 870–884. [Google Scholar] [CrossRef] [PubMed]
- Tyl, C.; Sadler, G. PH and Titratable Acidity. In Food Analysis; Nielsen, S., Ed.; Springer: Indianapolis, IN, USA, 2023; pp. 683–704. ISBN 9780323999694. [Google Scholar]
- Granados, C.; Tinoco, K.; Granadoss, E.; Pájaro-Castro, N.; García, Y. Caracterización Química y Evaluación de La Actividad Antioxidante de La Pulpa de Passiflora edulis Sims (Gulupa). Rev. Cuba. Plantas Med. 2017, 22, 1–9. [Google Scholar]
- Uribe, E.; Delgadillo, A.; Giovagnoli, C.; Quispe, I.; Zura, L. Extraction Techniques for Bioactive Compounds and Antioxidant Capacity Determination of Chilean Papaya (Vasconcellea Pubescens) Fruit. J. Chem. 2015, 1, 347532. [Google Scholar] [CrossRef]
- Li, J.-L.; Sun, D.; Cheng, J.-H. Recent Advances in Nondestructive Analytical Techniques for Determining the Total Soluble Solids in Fruits: A Review. Compr. Rev. Food Sci. Food Saf. 2016, 15, 897–911. [Google Scholar] [CrossRef]
- Carrillo, G. Formulación de Una Bebida Elaborada a Base de Ciruela (Spondias purpurea L.) y Evaluación de Su Actividad Nutracéutica; Instituto Politécnico Nacional: Mexico City, México, 2017. [Google Scholar]
- Yousefi, H.; Su, H.-M.; Imani, S.; Alkhaldi, K.; Filipe, C.; Didar, T. Intelligent Food Packaging: A Review of Smart Sensing Technologies for Monitoring Food Quality. ACS Sens. 2019, 4, 808–821. [Google Scholar] [CrossRef]
- Chaparro-Rojas, D.; Maldonado, M.; Franco-Londoño, M.; Urango-Marchena, L. Características Nutricionales y Antioxidantes de La Fruta Curuba Larga (Passiflora mollissima Bailey). Perspect. en Nutr. Humana 2014, 16, 203–212. [Google Scholar] [CrossRef]
- Cortés, G.; Prieto, G.; Rozo, W. Bromatological and Physicochemical Characterization of Physalis peruviana L., and Its Potential as a Nutraceutic Food. Cienc. Desarro. 2015, 6, 87–97. [Google Scholar] [CrossRef]
- Subedi, T. An Assessment of Mineral Contents in Fruits. Prithvi Acad. J. 2023, 6, 21–31. [Google Scholar] [CrossRef]
- Zhang, X.; Wei, X.; Ali, M.; Rizwan, H.; Li, B.; Li, H.; Jia, K.; Yang, X.; Ma, S.; Li, S.; et al. Changes in the Content of Organic Acids and Expression Analysis of Citric Acid Accumulation-Related Genes during Fruit Development of Yellow (Passiflora edulis f. flavicarpa) and Purple (Passiflora edulis f. edulis) Passion Fruits. Int. J. Mol. Sci. 2021, 22, 5765. [Google Scholar] [CrossRef] [PubMed]
- Mphahlele, R.R.; Stander, M.A.; Fawole, O.A.; Opara, U.L. Effect of Fruit Maturity and Growing Location on the Postharvest Contents of Flavonoids, Phenolic Acids, Vitamin C and Antioxidant Activity of Pomegranate Juice (Cv. Wonderful). Sci. Hortic. 2014, 179, 36–45. [Google Scholar] [CrossRef]
- Rico, D.; Martín-Diana, A.; Barat, J.; Barry-Ryan, C. Extending and Measuring the Quality of Fresh-Cut Fruit and Vegetables: A Review. Trends Food Sci. Technol. 2007, 18, 373–386. [Google Scholar] [CrossRef]
- Burbidge, C.A.; Ford, C.M.; Melino, V.J.; Wong, D.C.J.; Jia, Y.; Jenkins, C.L.D.; Soole, K.L.; Castellarin, S.D.; Darriet, P.; Rienth, M.; et al. Biosynthesis and Cellular Functions of Tartaric Acid in Grapevines. Front. Plant Sci. 2021, 12, 643024. [Google Scholar] [CrossRef]
- Loewus, F.; Loewus, M.; Seib, P. Biosynthesis and Metabolism of Ascorbic Acid in Plants. CRC. Crit. Rev. Plant Sci. 1987, 5, 101–119. [Google Scholar] [CrossRef]
- Kadi, A.; Boudries, H.; Bachir-Bey, M.; Teffane, M.; Taibi, A.; Arroul, Y.; Boulekbache-Makhlouf, L. Optimisation of Ultrasound-Assisted Extraction of Carotenoids and Antioxidant Activity from Citrus Reticulata Blanco Peels (Wilking mandarin). Acta Aliment. 2023, 52, 378–389. [Google Scholar] [CrossRef]
- Rodriguez-Amaya, D.B.; Kimura, M.; Godoy, H.T.; Amaya-Farfan, J. Updated Brazilian Database on Food Carotenoids: Factors Affecting Carotenoid Composition. J. Food Compos. Anal. 2008, 21, 445–463. [Google Scholar] [CrossRef]
- Meléndez-Martínez, A. An Overview of Carotenoids, Apocarotenoids and Vitamin A in Agro-Food, Nutrition, Health and Disease. Mol. Nutr. Food Res. 2019, 63, 1801045. [Google Scholar] [CrossRef]
- Dias, M.; Olmedilla-Alonso, B.; Hornero-Méndez, D.; Mercadante, A.Z.; Osorio, C.; Vargas-Murga, L.; Meléndez-Martínez, A. Comprehensive Database of Carotenoid Contents in Ibero-American Foods. A Valuable Tool in the Context of Functional Foods and the Establishment of Recommended Intakes of Bioactives. J. Agric. Food Chem. 2018, 66, 5055–5107. [Google Scholar] [CrossRef]
- Pereira-Netto, A.B. Tropical Fruits as Natural, Exceptionally Rich, Sources of Bioactive Compounds. Int. J. Fruit Sci. 2018, 18, 231–242. [Google Scholar] [CrossRef]
- Ma, W.; Li, Y.; Nai, G.; Liang, G.; Ma, Z.; Chen, B.; Mao, J. Changes and Response Mechanism of Sugar and Organic Acids in Fruits under Water Deficit Stress. PeerJ 2022, 10, e13691. [Google Scholar] [CrossRef] [PubMed]


| N° | Family | Scientific Name | Common Name | Sampling Location | Provincia | Reference Image |
|---|---|---|---|---|---|---|
| 1 | Anacardiaceae | Spondias purpurea L. red | Red ovo | Sangolquí market | Pichincha |  |
| 2 | Spondias purpurea L. yellow | Yellow ovo | Ilumán market | Imbabura |  | |
| 3 | Apoxynaceae | Lacmellea lactescens (Kuhlm.) Markgr. | Chicle | Pedro Vicente Maldonado market | Pichincha |  |
| 4 | Arecaceae | Bactris concinna Mart. | Uva de chonta | Tena market | Napo |  |
| 5 | Bactris gasipaes Kunth | Chonta naranja | Plantation | Sucumbíos |  | |
| 6 | Mauritia flexuosa L.f. | Moriche negro | Bomboiza market | Morona Santiago |  | |
| 7 | Oenocarpus bataua Mart. | Ungurahua | Bomboiza market | Morona Santiago |  | |
| 8 | Salacca zalacca (Gaertn.) Voss | Salak | Nanegalito market | Pichincha |  | |
| 9 | Burseraceae | Dacryodes peruviana (Loes.) H.J.Lam | Copal | Bomboiza market | Morona Santiago |  |
| 10 | Cactaceae | Opuntia ficus-indica (L.) Mill. | Tuna | Guamaní market | Pichincha |  |
| 11 | Selenicereus megalanthus (K.Schum. ex Vaupel) Moran | Pitahaya | Baños market | Tungurahua |  | |
| 12 | Caricaceae | Vasconcellea pubescens A. DC. | Chamburo | Saraguro market | Loja |  |
| 13 | Curcubitaceae | Momordica charantia L. | Momórdica | Plantation | Santo Domingo de los Tsáchilas |  |
| 14 | Sicana odorifera Naudin | Calabaza | Puyo market | Pastaza |  | |
| 15 | Sicyos edulis Jacq. | Chayote blanco | Puyo market | Pastaza |  | |
| 16 | Ebenaceae | Diospyros kaki L.f. | Caqui | Mayorista market | Pichincha |  |
| 17 | Fabaceae | Inga edulis Mart. | Guaba de bejuco | Santa Clara market | Pichincha |  |
| 18 | Inga insignis Kunth | Guaba | Sangolquí market | Pichincha |  | |
| 19 | Malvaceae | Herrania nitida (Poepp.) R.E.Schult. | Rough skin cacao | Majua market | Esmeraldas |  |
| 20 | Matisia cordata Bonpl. | Zapote | Mayorista market | Pichincha |  | |
| 21 | Theobroma cacao L. red | Cacao rojo | Plantation | Santo Domingo de los Tsáchilas |  | |
| 22 | Theobroma cacao L. yellow | Smooth-skinned cacao | Bomboiza market | Morona Santiago |  | |
| 23 | Melastomataceae | Miconia crocea Naudin | Kulkas | Otavalo market | Ibarra |  |
| 24 | Moraceae | Artocarpus heterophyllus Lam. | Jackfruit | Santa Clara market | Pichincha |  |
| 25 | Morus alba L. | Tree blackberry | Plantation | Pichincha |  | |
| 26 | Myrtaceae | Acca sellowiana (O. Berg) Burret | Feijoa | Plantation | Tungurahua |  |
| 27 | Myrtaceae | Eugenia stipitata McVaugh | Arazá | Sucumbíos market | Sucumbíos |  |
| 28 | Psidium guajava L. | Guayaba roja | Plantation | Tungurahua |  | |
| 29 | Psidium guineense Sw. | Guayaba amarilla | Plantation | Tungurahua |  | |
| 30 | Syzygium jambos (L.) Alston red | Red pomarrosa | El Coca market | Orellana |  | |
| 31 | Syzygium jambos (L.) Alston yellow | Yellow pomarrosa | La Unión market | Sucumbíos |  | |
| 32 | Oxalidaceae | Averrhoa carambola L. | Fruta china | Cotocollao market | Pichincha |  |
| 33 | Passifloraceae | Passiflora edulis Sims | Granadilla de monte | Tumbaco market | Pichincha |  |
| 34 | Passiflora hybrid | Maracuyá-badea | Puyo market | Pastaza |  | |
| 35 | Passiflora mollissima L.H.Bailey | Purple taxo | Plantation | Tungurahua |  | |
| 36 | Passiflora quadrangularis L. | Badea | Plantation | Santo Domingo de los Tsáchilas |  | |
| 37 | Passiflora tripartita Breiter | Yellow taxo | Plantation | Pichincha |  | |
| 38 | Rosaceae | Cydonia oblonga Mill. | Membrillo | Santa Clara market | Pichincha |  |
| 39 | Rosaceae | Prunus persica (L.) Batsch | Abridores | Santa Clara market | Pichincha |  |
| 40 | Prunus salicifolia Kunth | Capulí | Sangolquí market | Pichincha |  | |
| 41 | Rubus niveus Thunb. | Wild blackberry | Plantation | Pichincha |  | |
| 42 | Rubus rosifolius Sm. | Raspberry | Plantation | Pichincha |  | |
| 43 | Salicaceae | Dovyalis hebecarpa (Gardner) Warb. | Cereza agria | Plantation | Pichincha |  |
| 44 | Sapindaceae | Nephelium lappaceum L. | Achotillo | Sangolquí market | Pichincha |  |
| 45 | Sapotaceae | Pouteria caimito Radlk. | Caimito amarillo | La Unión market | Sucumbíos |  |
| 46 | Pouteria sapota (Jacq.) H.E.Moore & Stearn | Mamey | La Unión market | Sucumbíos |  | |
| 47 | Solanaceae | Physalis peruviana L. | Uvilla | Tumbaco market | Pichincha |  |
| 48 | Solanum betaceum Cav. purple | Tomate de árbol morado | Plantation | Tungurahua |  | |
| 49 | Solanum betaceum Cav. yellow | Tomate de árbol amarillo | Plantation | Tungurahua |  | |
| 50 | Solanum sessiliflorum Dunal | Cocona | Macas market | Morona Santiago |  | |
| 51 | Urticaceae | Pourouma cecropiifolia Mart. | Uva de monte | El Coca market | Orellana |  |
| Family | Scientific Name | Weight (g) | LD (cm) | ED (cm) | pH | SS (°Brix) | TA (%) | Humidity (%) | Ash (%) | ||||||||||||||||
|---|---|---|---|---|---|---|---|---|---|---|---|---|---|---|---|---|---|---|---|---|---|---|---|---|---|
| Anacardiaceae | S. purpurea red | 19.7 | ± | 1.8 abc | 2.9 | ± | 0.2 abcde | 3.6 | ± | 0.2 efghijk | 3.3 | ± | 0.2 cde | 11.9 | ± | 1.2 ijklmno | 0.1 | ± | 0.0 mnopq | 96.5 | ± | 37.7 tuv | 0.6 | ± | 0.3 abcdef |
| S. purpurea yellow | 7.9 | ± | 1.5 a | 4.8 | ± | 0.6 efghij | 3.3 | ± | 0.6 defghij | 3.1 | ± | 0.5 bc | 17.1 | ± | 1.9 pqrst | 1.0 | ± | 0.3 mnopq | 76.0 | ± | 5.1 efghi | 0.4 | ± | 0.1 abc | |
| Apoxynaceae | L. lactescens | 13.3 | ± | 3.8 ab | 3.2 | ± | 0.4 bcdef | 2.9 | ± | 0.4 bcdefghi | 4.0 | ± | 0.4 ghijkl | 17.2 | ± | 1.3 pqrst | 3.0 | ± | 0.3 u | 71.7 | ± | 1.0 def | 0.7 | ± | 0.2 abcdefg |
| Arecaceae | B. concinna | 12.0 | ± | 1.0 ab | 3.8 | ± | 0.4 cdefgh | 2.6 | ± | 0.2 bcdefgh | 3.8 | ± | 0.2 fghi | 9.7 | ± | 0.7 cdefghijkl | 0.8 | ± | 0.2 hjklmno | 83.5 | ± | 2.0 opqr | 0.9 | ± | 0.2 fghij |
| B. gasipaes | 46.0 | ± | 6.8 abcd | 5.2 | ± | 0.2 fghijkl | 4.1 | ± | 0.2 ghijklmno | 6.7 | ± | 0.3 uv | 6.7 | ± | 0.1 abcdefghi | 2.9 | ± | 0.3 u | 44.9 | ± | 0.9 b | 0.9 | ± | 0.1 fghij | |
| M. flexuosa | 39.4 | ± | 2.7 abcd | 4.4 | ± | 1.5 fghijk | 3.7 | ± | 1.1 efghijkl | 4.6 | ± | 0.7 hijklm | 4.7 | ± | 0.2 abcd | 0.7 | ± | 0.1 hijklmno | 68.1 | ± | 0.7 cd | 0.9 | ± | 0.2 fghij | |
| O. bataua | 12.1 | ± | 1.2 ab | 3.3 | ± | 0.2 bcdef | 2.3 | ± | 0.1 bcdef | 7.3 | ± | 0.1 w | 2.2 | ± | 0.3 a | 0.3 | ± | 0.1 abcde | 42.7 | ± | 0.0 b | 1.3 | ± | 0.0 klmno | |
| S. zalacca | 56.0 | ± | 7.3 abcd | 6.0 | ± | 0.6 ijklmn | 5.1 | ± | 0.3 klmnop | 4.2 | ± | 0.2 hijklmn | 14.5 | ± | 1.1 lmnop | 0.6 | ± | 0.1 efghijkl | 97.1 | ± | 0.2 uv | 0.7 | ± | 0.2 abcdefg | |
| Burseraceae | D. peruviana | 12.6 | ± | 0.9 ab | 3.5 | ± | 0.1 cdef | 2.3 | ± | 0.1 abcde | 5.7 | ± | 0.3 t | 3.9 | ± | 1.0 ab | 0.5 | ± | 0.0 cdefghij | 33.6 | ± | 0.7 a | 7.6 | ± | 1.0 w |
| Cactaceae | O. ficus-indica | 132.8 | ± | 27.2 abcde | 8.2 | ± | 1.1 op | 5.4 | ± | 0.3 nopqr | 6.6 | ± | 1.2 uv | 11.1 | ± | 1.8 fghijklmn | 0.3 | ± | 0.1 abcde | 85.6 | ± | 2.9 mnopqr | 0.4 | ± | 0.0 ab |
| S. megalanthus | 292.0 | ± | 7.1 efg | 11.1 | ± | 0.6 qr | 7.3 | ± | 0.6 tuvw | 5.3 | ± | 0.3 rst | 15.5 | ± | 0.9 nopqr | 0.2 | ± | 0.0 abc | 75.1 | ± | 2.6 efghi | 0.4 | ± | 0.1 ab | |
| Caricaceae | V. pubescens | 144.7 | ± | 38.8 abcde | 7.6 | ± | 1.3 nop | 5.0 | ± | 1.2 klmnopq | 4.6 | ± | 1.0 nop | 6.6 | ± | 0.6 abcdefgh | 1.0 | ± | 0.2 nopq | 93.0 | ± | 0.1 stuv | 1.5 | ± | 0.2 mnop |
| Curcubitaceae | M. charantia | 4.2 | ± | 1.6 a | 4.3 | ± | 1.7 defghij | 3.8 | ± | 0.8 efghijklm | 4.0 | ± | 0.0 ghijk | 6.4 | ± | 0.2 abcdefg | 0.2 | ± | 0.0 abcd | 93.4 | ± | 0.3 stuv | 3.5 | ± | 0.3 u |
| S. odorifera | 2220.0 | ± | 34.2 j | 36.5 | ± | 0.0 u | 10.8 | ± | 0.0 y | 6.7 | ± | 0.0 v | 6.9 | ± | 0.1 abcdefghij | 0.2 | ± | 0.0 abcd | 88.3 | ± | 0.1 ghijklmnopq | 1.5 | ± | 0.3 nop | |
| S. edulis | 415.0 | ± | 15.9 fgh | 11.8 | ± | 0.9 r | 8.6 | ± | 0.9 wx | 8.2 | ± | 0.2 x | 4.6 | ± | 0.5 abc | 0.1 | ± | 0.0 a | 91.7 | ± | 0.4 qrstu | 0.6 | ± | 0.0 abcdefg | |
| Ebenaceae | D. kaki | 153.7 | ± | 3.9 abcde | 4.3 | ± | 1.0 defghij | 6.4 | ± | 1.0 qrstuv | 6.4 | ± | 1.0 uv | 15.7 | ± | 1.2 nopqr | 0.5 | ± | 0.1 bcdefghi | 79.2 | ± | 2.7 ghijklm | 0.8 | ± | 0.2 defghi |
| Fabaceae | I. edulis | 480.0 | ± | 92.9 ghi | 88.4 | ± | 7.2 w | 3.7 | ± | 1.1 efghijklm | 6.2 | ± | 0.6 u | 11.3 | ± | 1.2 ghijklmn | 0.1 | ± | 0.0 a | 84.9 | ± | 1.0 klmnop | 0.4 | ± | 0.1 abcd |
| I. insignis | 75.9 | ± | 9.0 abcde | 18.4 | ± | 2.4 s | 3.2 | ± | 0.3 cdefghij | 6.5 | ± | 0.3 uv | 12.1 | ± | 1.3 jklmno | 0.1 | ± | 0.0 a | 87.2 | ± | 5.5 opqrs | 0.4 | ± | 0.1 abycd | |
| Malvaceae | H. nitida | 871.0 | ± | 47.7 i | 19.7 | ± | 0.3 t | 9.3 | ± | 0.2 xy | 5.6 | ± | 0.2 st | 19.6 | ± | 2.0 abcdefghijk | 1.6 | ± | 0.3 lmnop | 96.0 | ± | 0.0 opqrstuv | 4.6 | ± | 0.1 v |
| M. cordata | 516.6 | ± | 10.7 hi | 8.2 | ± | 0.7 op | 7.7 | ± | 0.8 vw | 7.5 | ± | 0.8 w | 16.6 | ± | 2.1 opqr | 0.6 | ± | 0.3 efghijkl | 73.1 | ± | 10.9 defg | 0.7 | ± | 0.1 bcdefg | |
| T. cacao red | 694.0 | ± | 87.0 fghi | 21.5 | ± | 0.2 st | 8.8 | ± | 0.1 qrstuv | 4.5 | ± | 0.2 ijklmno | 15.4 | ± | 3.1 mnopq | 0.6 | ± | 0.2 defghijklm | 88.1 | ± | 0.1 defghijk | 20.1 | ± | 4.9 x | |
| T. cacao yellow | 1252.7 | ± | 41.6 hi | 22.3 | ± | 0.6 sst | 11.8 | ± | 0.4 pqrstuv | 4.3 | ± | 0.1 hijklmno | 18.4 | ± | 4.0 rst | 0.7 | ± | 0.0 cdefghijklm | 88.3 | ± | 1.1 cdefghijk | 0.9 | ± | 0.0 abcdefg | |
| Melastomataceae | M. crocea | 0.4 | ± | 0.1 a | 1.0 | ± | 0.2 a | 0.7 | ± | 0.2 a | 4.1 | ± | 0.0 hijklmn | 8.3 | ± | 1.3 bcdefghijk | 0.8 | ± | 0.2 ijklmno | 84.1 | ± | 0.2 klmnop | 0.6 | ± | 0.3 abcdef |
| Moraceae | A. heterophyllus | 9117.2 | ± | 143.0 l | 43.5 | ± | 3.6 v | 27.5 | ± | 7.6 z | 6.2 | ± | 0.7 u | 19.4 | ± | 1.2 rst | 1.1 | ± | 0.2 pqrs | 74.2 | ± | 3.0 defgh | 3.3 | ± | 0.3 u |
| M. alba | 3.5 | ± | 0.6 a | 3.6 | ± | 0.2 cdefg | 2.5 | ± | 0.2 bcdefgh | 1.0 | ± | 0.0 a | 6.0 | ± | 1.3 abcdef | 0.4 | ± | 0.2 abcdefg | 92.0 | ± | 1.2 rstu | 0.7 | ± | 0.2 bcdefg | |
| Myrtaceae | A. sellowiana | 45.3 | ± | 6.3 abcd | 6.2 | ± | 0.7 jklmn | 2.5 | ± | 0.2 bcdefgh | 3.9 | ± | 0.6 fghij | 9.9 | ± | 0.9 defghijklm | 0.7 | ± | 0.2 fghijklmn | 86.1 | ± | 0.3 nopqr | 1.2 | ± | 0.5 jklmn |
| E. stipitata | 98.7 | ± | 35.3 abcde | 5.0 | ± | 0.9 fghijk | 5.2 | ± | 1.0 lmnopqr | 4.0 | ± | 0.4 ghijkl | 5.3 | ± | 1.9 abcde | 4.6 | ± | 1.8 w | 94.1 | ± | 7.9 tuv | 0.3 | ± | 0.0 a | |
| P. guajava | 37.8 | ± | 10.0 abcd | 4.7 | ± | 0.6 efghij | 4.0 | ± | 0.5 ghijklmno | 4.5 | ± | 0.2 mnop | 10.1 | ± | 0.8 efghijklm | 0.8 | ± | 0.1 jklmno | 73.6 | ± | 2.5 defgh | 2.3 | ± | 0.3 rst | |
| P. guineense | 60.7 | ± | 17.1 abce | 5.7 | ± | 0.9 hijklmn | 5.1 | ± | 0.4 klmnopq | 5.5 | ± | 0.0 st | 7.5 | ± | 0.0 bcdefghijk | 0.5 | ± | 0.0 cdefghij | 73.6 | ± | 1.3 defgh | 2.3 | ± | 0.2 rst | |
| S. jambos red | 75.8 | ± | 14.0 abcde | 6.1 | ± | 0.8 ijklmn | 5.7 | ± | 0.9 opqrst | 4.4 | ± | 0.4 klmno | 9.1 | ± | 3.1 bcdefghijkl | 0.2 | ± | 0.1 abcde | 91.3 | ± | 0.pqrst | 0.4 | ± | 0.0 ab | |
| S. jambos yellow | 24.2 | ± | 2.1 abc | 4.6 | ± | 0.3 efghij | 4.0 | ± | 0.2 fghijklmn | 6.6 | ± | 0.2 uv | 9.4 | ± | 0.9 cdefghijkl | 0.4 | ± | 0.2 abcdefg | 90.1 | ± | 0.7 rstu | 0.6 | ± | 0.0 abcdef | |
| Oxalidaceae | A. carambola | 52.1 | ± | 9.5 abcd | 6.9 | ± | 0.7 klmno | 4.7 | ± | 0.7 jklmnop | 4.8 | ± | 0.1 pqr | 5.3 | ± | 0.2 abcde | 0.7 | ± | 0.1 fghijklmn | 92.0 | ± | 0.3 rstu | 0.7 | ± | 0.1 cdefgh |
| Passifloraceae | P. edulis | 30.0 | ± | 11.0 abcd | 4.4 | ± | 0.5 efghij | 4.1 | ± | 0.5 ghijklmno | 4.2 | ± | 1.3 hijklmn | 22.0 | ± | 3.4 t | 1.4 | ± | 0.1 rst | 94.1 | ± | 0.3 tuv | 2.3 | ± | 0.5 st |
| P. hybrid | 246.0 | ± | 18.8 def | 11.3 | ± | 0.3 r | 7.1 | ± | 0.1 stuvw | 4.2 | ± | 0.2 hijklmn | 12.7 | ± | 2.8 klmnop | 0.9 | ± | 0.0 klmnop | 94.1 | ± | 0.7 tuv | 1.1 | ± | 0.1 ijklm | |
| P. mollissima | 57.2 | ± | 6.7 abcd | 7.6 | ± | 0.3 nop | 3.8 | ± | 0.2 efghijklm | 4.5 | ± | 0.4 lmnof | 8.5 | ± | 1.0 bcdefghijk | 0.4 | ± | 0.1 abcdefgh | 76.4 | ± | 3.1 efghi | 2.4 | ± | 0.3 t | |
| P. quadrangularis | 2470.0 | ± | 27.0 k | 22.9 | ± | 6.9 t | 19.7 | ± | 5.2 z | 3.7 | ± | 0.8 efgh | 11.9 | ± | 1.9 jklmno | 1.2 | ± | 0.4 qrs | 78.8 | ± | 5.2 ghijkl | 2.2 | ± | 0.1 st | |
| P. tripartita | 73.0 | ± | 10.6 abcde | 3.6 | ± | 0.2 cdefg | 10.7 | ± | 0.7 y | 3.2 | ± | 0.2 bcd | 10.9 | ± | 0.0 fghijklmn | 0.4 | ± | 0.0 abcdefg | 81.1 | ± | 2.1 ijklmno | 1.8 | ± | 0.1 pq | |
| Rosaceae | C. oblonga | 102.9 | ± | 16.5 abcde | 5.5 | ± | 0.8 ghijklm | 6.0 | ± | 0.7 pqrstu | 3.2 | ± | 0.1 bcd | 14.5 | ± | 0.7 lmnop | 0.7 | ± | 0.3 fghijklmn | 71.0 | ± | 4.2 de | 0.5 | ± | 0.1 abcde |
| P. persica | 48.6 | ± | 4.3 abcd | 4.5 | ± | 0.3 efghij | 4.2 | ± | 0.2 hijklmno | 4.8 | ± | 0.2 opq | 12.5 | ± | 1.1 klmnop | 0.5 | ± | 0.2 defghijk | 85.2 | ± | 1.6 klmnop | 2.5 | ± | 0.8 t | |
| P. salicifolia | 2.3 | ± | 0.5 a | 1.4 | ± | 0.1 ab | 1.5 | ± | 0.1 abc | 5.1 | ± | 0.0 qrs | 19.2 | ± | 1.2 rst | 0.4 | ± | 0.1 abcdefgh | 77.6 | ± | 2.7 fghij | 0.7 | ± | 0.3 bcdefg | |
| R. niveus | 1.6 | ± | 0.4 a | 1.0 | ± | 0.1 a | 1.3 | ± | 0.2 ab | 1.0 | ± | 0.0 a | 11.4 | ± | 2.0 ghijklmn | 1.6 | ± | 0.7 t | 84.1 | ± | 1.9 klmnop | 0.7 | ± | 0.2 bcdefg | |
| R. rosifolius | 1.7 | ± | 0.3 a | 1.7 | ± | 0.2 abc | 1.6 | ± | 0.2 abc | 3.9 | ± | 0.2 fghij | 5.0 | ± | 0.7 abcde | 0.7 | ± | 0.3 ghijklmn | 83.9 | ± | 1.0 jklmnop | 0.6 | ± | 0.0 abcdef | |
| Salicaceae | D. hebecarpa | 7.6 | ± | 0.6 a | 1.9 | ± | 0.1 abc | 2.5 | ± | 0.1 bcdefg | 2.7 | ± | 0.1 b | 11.6 | ± | 0.7 hijklmno | 3.2 | ± | 0.6 u | 85.1 | ± | 1.1 lmnop | 1.9 | ± | 0.5 pqr |
| Sapindaceae | N. lappaceum | 20.5 | ± | 2.5 abc | 4.1 | ± | 0.2 defghi | 3.2 | ± | 0.2 cdefghij | 4.3 | ± | 0.5 jklmn | 15.0 | ± | 1.2 mnopq | 0.4 | ± | 0.2 abcdef | 78.5 | ± | 1.0 ghijk | 0.3 | ± | 0.2 ab |
| Sapotaceae | P. caimito | 238.7 | ± | 52.4 cdef | 7.2 | ± | 0.6 mnop | 7.6 | ± | 0.6 uvw | 5.3 | ± | 0.3 rst | 20.6 | ± | 0.8 st | 1.5 | ± | 0.2 st | 88.3 | ± | 0.4 jklmno | 1.9 | ± | 0.4 qrs |
| P. sapota | 232.2 | ± | 59.2 bcdef | 9.1 | ± | 1.0 pq | 6.8 | ± | 0.7 rstuv | 6.3 | ± | 0.2 uv | 28.6 | ± | 3.4 u | 0.6 | ± | 0.1 fghijklm | 62.9 | ± | 1.4 c | 1.0 | ± | 0.2 ghijk | |
| Solanaceae | P. peruviana | 5.3 | ± | 2.2 a | 1.9 | ± | 0.2 abc | 1.9 | ± | 0.2 abcd | 4.5 | ± | 0.0 mnop | 12.0 | ± | 0.0 jklmno | 1.1 | ± | 0.0 pqr | 81.0 | ± | 0.3 ijklmno | 1.4 | ± | 0.1 lmno |
| S. betaceum purple | 101.7 | ± | 21.9 abcde | 7.0 | ± | 1.1 lmno | 5.2 | ± | 0.7 mnopqr | 3.5 | ± | 0.5 defg | 11.5 | ± | 1.9 ghijklmn | 1.0 | ± | 0.6 lmnop | 79.8 | ± | 7.1 hijklmn | 3.5 | ± | 0.8 u | |
| S. betaceum yellow | 120.3 | ± | 27.4 abcde | 7.4 | ± | 0.3 mnop | 5.6 | ± | 0.5 nopqrs | 3.5 | ± | 0.1 cdef | 10.0 | ± | 0.8 efghijklm | 1.1 | ± | 0.4 pqr | 79.6 | ± | 0.3 hijklm | 1.7 | ± | 0.9 opq | |
| S. sessiliflorum | 40.2 | ± | 5.8 abcd | 3.7 | ± | 0.1 cdefg | 4.3 | ± | 0.4 ijklmno | 3.8 | ± | 0.0 efgh | 6.0 | ± | 0.0 abcdef | 3.8 | ± | 0.2 v | 94.1 | ± | 0.3 tuv | 1.0 | ± | 0.0 ghijk | |
| Urticaceae | P. cecropiifolia | 7.7 | ± | 1.0 a | 2.4 | ± | 0.1 abcd | 2.4 | ± | 0.1 bcdef | 5.7 | ± | 0.1 t | 15.5 | ± | 2.2 defghijk | 0.6 | ± | 0.0 defghijk | 98.6 | ± | 0.1 v | 0.8 | ± | 0.0 efghi |
| Family | Scientific Name | Vitamin C (mg/100 g DW) | Organic Acid (g/100 g DW) | Antioxidant Activity | ||||||||||||||||||
|---|---|---|---|---|---|---|---|---|---|---|---|---|---|---|---|---|---|---|---|---|---|---|
| Citric Acid | Malic Acid | Tartaric Acid | Total Organic Acid | µmol TE/g DW (ABTS) | µmol AAE/g DW (DPPH) | |||||||||||||||||
| Anacardiaceae | S. purpurea red | 103.8 | ± | 10.1 | 0.7 | ± | 0.1 ab | 8.9 | ± | 0.3 fghi | 2.5 | ± | 0.0 abcde | 12.0 | ± | 0.2 abcdefgh | 19.2 | ± | 1.0 abcdef | 9.1 | ± | 1.9 fghij |
| S. purpurea yellow | 8.8 | ± | 1.3 | 0.3 | ± | 0.0 ab | 10.5 | ± | 0.0 hij | 1.6 | ± | 0.1 abc | 12.4 | ± | 0.1 abcdefghi | 10.4 | ± | 0.7 abcd | 31.9 | ± | 0.4 rst | |
| Apoxynaceae | L. lactescens | 8.1 | ± | 0.4 | 6.1 | ± | 0.2 bcdef | 0.8 | ± | 0.0 a | 2.1 | ± | 0.0 abcde | 8.9 | ± | 0.2 abcdef | 10.2 | ± | 1.6 abcd | 2.0 | ± | 0.3 a |
| Arecaceae | B. concinna | nd | 2.9 | ± | 0.0 abc | 13.7 | ± | 0.0 jk | 7.8 | ± | 0.0 fg | 24.3 | ± | 0.0 jklm | 108.3 | ± | 0.9 mnop | 33.6 | ± | 0.0 st | ||
| B. gasipaes | 13.8 | ± | 1.7 | 0.2 | ± | 0.0 ab | 0.6 | ± | 0.0 a | 3.9 | ± | 0.0 abcdef | 4.7 | ± | 0.0 ab | 7.7 | ± | 1.3 abc | 10.5 | ± | 0.5 jk | |
| M. flexuosa | nd | 1.0 | ± | 0.2 ab | 21.6 | ± | 1.7 mn | 3.4 | ± | 0.7 abcdef | 26.0 | ± | 2.6 lm | 142.4 | ± | 2.2 q | 38.8 | ± | 4.3 u | |||
| O. bataua | 2.7 | ± | 0.1 | 0.7 | ± | 0.1 ab | 2.7 | ± | 0.6 abc | 1.1 | ± | 0.1 abc | 4.5 | ± | 0.7 ab | 72.7 | ± | 1.0 hijk | 10.5 | ± | 0.7 jk | |
| S. zalacca | nd | 1.4 | ± | 0.1 abc | 20.5 | ± | 1.5 lm | 2.7 | ± | 0.4 abcde | 24.6 | ± | 1.0 klm | 66.4 | ± | 1.2 hi | 38.8 | ± | 1.9 u | |||
| Burseraceae | D. peruviana | nd | 0.5 | ± | 0.1 ab | 1.2 | ± | 0.1 a | 0.6 | ± | 0.0 ab | 2.3 | ± | 0.6 a | 78.2 | ± | 2.0 hijkl | 35.6 | ± | 0.7 tu | ||
| Cactaceae | O. ficus-indica | 2.6 | ± | 0.0 | 1.0 | ± | 0.2 abc | 0.5 | ± | 0.0 a | 3.6 | ± | 0.2 abcdef | 5.0 | ± | 0.1 abc | 25.7 | ± | 4.7 bcdef | 4.8 | ± | 0.9 abcde |
| S. megalanthus | 1.3 | ± | 0.0 | 0.9 | ± | 0.0 abc | 0.8 | ± | 0.1 a | 3.9 | ± | 0.1 abcdef | 5.6 | ± | 0.0 abcd | 13.2 | ± | 2.4 abcd | 1.7 | ± | 0.5 abc | |
| Caricaceae | V. pubescens | 313.4 | ± | 7.2 | 10.1 | ± | 0.8 defg | 10.1 | ± | 0.1 ghij | 3.9 | ± | 0.0 abcdef | 24.1 | ± | 0.8 jklm | 59.8 | ± | 1.7 gh | 19.8 | ± | 1.3 mn |
| Curcubitaceae | M. charantia | nd | 3.1 | ± | 1.0 abc | 2.6 | ± | 0.2 abc | 5.8 | ± | 0.6 cdefg | 11.4 | ± | 1.7 abcdefgh | 70.6 | ± | 2.1 hij | 8.7 | ± | 0.7 efghij | ||
| S. odorifera | nd | 3.0 | ± | 0.3 abc | 1.2 | ± | 0.7 a | 1.1 | ± | 0.1 abc | 5.4 | ± | 0.2 abc | 12.4 | ± | 0.6 abcd | 9.5 | ± | 0.8 ghijk | |||
| S. edulis | 27.7 | ± | 1.8 | 0.7 | ± | 0.1 ab | 7.2 | ± | 0.1 defgh | 6.5 | ± | 1.0 defg | 14.3 | ± | 1.1 bcdefg | 22.6 | ± | 0.9 abcdef | 33.7 | ± | 0.2 st | |
| Ebenaceae | D. kaki | 11.8 | ± | 1.1 | 0.6 | ± | 0.1 ab | 2.6 | ± | 0.0 abc | 0.1 | ± | 0.0 a | 3.2 | ± | 0.1 a | 11.3 | ± | 1.4 abcd | 4.2 | ± | 1.3 abcdefg |
| Fabaceae | I. edulis | 6.6 | ± | 0.3 | 6.9 | ± | 0.4 cdef | 0.5 | ± | 0.0 a | 3.7 | ± | 0.1 abcdef | 11.1 | ± | 0.4 abcdef | 78.6 | ± | 2.5 hijkl | 7.3 | ± | 1.7 defghij |
| I. insignis | 16.9 | ± | 2.6 | 0.5 | ± | 0.1 ab | 0.7 | ± | 0.0 a | 2.6 | ± | 0.1 abcde | 3.9 | ± | 0.2 a | 30.9 | ± | 5.8 def | 1.5 | ± | 0.4 abc | |
| Malvaceae | H. nitida | nd | 3.6 | ± | 0.1 abc | 0.9 | ± | 0.2 a | 3.2 | ± | 0.3 abcdef | 7.6 | ± | 0.6 abcde | 92.0 | ± | 21.3 nop | 20.1 | ± | 3.8 lmn | ||
| M. cordata | 25.5 | ± | 3.2 | 0.9 | ± | 0.2 ab | 1.2 | ± | 0.1 ab | 2.9 | ± | 0.0 abcde | 5.0 | ± | 0.3 abc | 99.6 | ± | 3.0 lmnop | 3.3 | ± | 0.0 abcdef | |
| T. cacao red | nd | 4.6 | ± | 0.4 abcd | 0.6 | ± | 0.0 a | 2.7 | ± | 0.1 abcde | 7.9 | ± | 0.5 abcde | 111.2 | ± | 0.4 nop | 18.1 | ± | 2.6 lmn | |||
| T. cacao yellow | 1.1 | ± | 0.1 | 2.2 | ± | 0.1 abc | 2.0 | ± | 0.1 ab | 2.4 | ± | 0.2 abcde | 6.6 | ± | 1.5 abcd | 110.8 | ± | 2.2 nop | 18.8 | ± | 3.1 lmn | |
| Melastomataceae | M. crocea | 11.2 | ± | 1.3 | 1.4 | ± | 0.3 abc | 16.9 | ± | 0.5 kl | 1.8 | ± | 0.3 abcde | 20.0 | ± | 1.1 ghijklm | 94.7 | ± | 21.3 klmno | 33.2 | ± | 0.6 st |
| Moraceae | A. heterophyllus | nd | 0.7 | ± | 0.1 ab | 3.2 | ± | 0.1 abcd | 1.2 | ± | 0.0 abc | 5.2 | ± | 0.2 abc | 11.6 | ± | 0.7 abcd | 2.4 | ± | 0.1 abcd | ||
| M. alba | nd | 13.3 | ± | 0.5 gh | 2.5 | ± | 0.0 abc | 4.4 | ± | 0.4 abcdef | 20.1 | ± | 0.9 ghijklm | 115.8 | ± | 28.0 op | 80.5 | ± | 3.9 x | |||
| Myrtaceae | A. sellowiana | 2.1 | ± | 0.1 | 13.0 | ± | 1.1 gh | 6.3 | ± | 0.1 cdefg | 1.8 | ± | 0.2 abcde | 21.1 | ± | 1.0 ghijklm | 109.7 | ± | 1.7 nop | 32.9 | ± | 0.2 st |
| E. stipitata | 9.8 | ± | 0.0 | 3.6 | ± | 0.5 abc | 25.0 | ± | 2.9 n | 1.2 | ± | 0.1 abc | 29.8 | ± | 3.5 mn | 17.9 | ± | 1.2 abcdef | 14.2 | ± | 1.3 kl | |
| P. guajava | 577.1 | ± | 0.4 | 5.1 | ± | 0.1 abcde | 4.3 | ± | 0.1 abcde | 2.1 | ± | 0.3 abcd | 11.5 | ± | 0.4 abcdefgh | 111.6 | ± | 2.5 nop | 22.3 | ± | 2.0 no | |
| P. guineense | 409.4 | ± | 5.7 | 4.6 | ± | 0.2 abcd | 7.2 | ± | 0.0 defgh | 2.7 | ± | 0.1 abcde | 14.5 | ± | 0.1 cdefghijk | 94.4 | ± | 2.2 klmno | 27.3 | ± | 1.7 pqr | |
| S. jambos red | nd | 0.7 | ± | 0.1 ab | 6.1 | ± | 1.4 cdefg | 9.9 | ± | 2.4 g | 16.7 | ± | 4.6 efghijkl | 41.0 | ± | 10.7 fg | 9.7 | ± | 1.0 hijk | |||
| S. jambos yellow | 2.8 | ± | 0.2 | 0.7 | ± | 0.2 ab | 3.3 | ± | 0.2 abc | 7.0 | ± | 1.0 efg | 10.9 | ± | 1.9 abcdefg | 110.1 | ± | 1.4|nop | 31.1 | ± | 0.0 rst | |
| Oxalidaceae | A. carambola | 12.8 | ± | 0.4 | 4.8 | ± | 0.3 abcde | 3.0 | ± | 0.2 abc | 2.5 | ± | 0.0 abcde | 10.4 | ± | 0.7 abcdefg | 115.1 | ± | 1.0 op | 16.2 | ± | 1.2 lm |
| Passifloraceae | P. edulis | 84.9 | ± | 2.1 | 19.3 | ± | 0.0 ij | 1.6 | ± | 0.1 ab | 2.8 | ± | 0.7 abcde | 23.8 | ± | 0.7 jklm | 4.7 | ± | 0.4 ab | 4.8 | ± | 0.7 abcdefgh |
| P. hybrid | 23.7 | ± | 1.6 | 5.2 | ± | 1.8 abcde | 12.7 | ± | 4.2 ij | 4.6 | ± | 0.6 abcdef | 22.5 | ± | 8.3 ijklm | 63.8 | ± | 1.3 h | 0.8 | ± | 0.2 ab | |
| P. mollissima | 180.0 | ± | 0.2 | 10.5 | ± | 0.7 efg | 5.4 | ± | 0.1 bcdef | 2.5 | ± | 0.1 abcde | 18.4 | ± | 1.9 fghijkl | 75.6 | ± | 1.8 hijkl | 58.0 | ± | 3.2 w | |
| P. quadrangularis | 62.8 | ± | 2.7 | 5.3 | ± | 0.5 abcde | 2.9 | ± | 0.6 abc | 3.7 | ± | 0.2 abcdef | 12.0 | ± | 0.8 abcdefgh | 37.1 | ± | 1.5 ef | 5.3 | ± | 0.7 bcdefghi | |
| P. tripartita | 243.3 | ± | 4.3 | 23.0 | ± | 1.1 j | 8.8 | ± | 0.5 fghi | 5.4 | ± | 0.0 bcdef | 37.2 | ± | 1.6 n | 91.3 | ± | 0.5 jklmn | 19.5 | ± | 3.7 lmn | |
| Rosaceae | C. oblonga | 3.3 | ± | 0.1 | 0.1 | ± | 0.0 a | 8.5 | ± | 0.2 fghi | 3.0 | ± | 0.0 abcdef | 11.5 | ± | 0.2 abcdefgh | 86.4 | ± | 3.0 ijklm | 10.3 | ± | 0.9 ijk |
| P. persica | nd | 2.1 | ± | 0.4 abc | 3.8 | ± | 0.2 abcde | 3.6 | ± | 0.3 abcdef | 9.6 | ± | 0.0 abcdef | 110.6 | ± | 0.9 nop | 30.1 | ± | 0.2 qrs | |||
| P. salicifolia | 9.9 | ± | 1.3 | 4.9 | ± | 0.5 abcde | 0.9 | ± | 0.0 a | 0.6 | ± | 0.2 a | 6.4 | ± | 0.8 abcd | 73.9 | ± | 1.3 hijkl | 33.0 | ± | 0.3 st | |
| R. niveus | nd | 1.2 | ± | 0.5 abc | 7.5 | ± | 0.1 efgh | 2.3 | ± | 0.2 abcde | 11.1 | ± | 0.8 sbcdefgh | 110.6 | ± | 1.9 nop | 45.0 | ± | 1.4 v | |||
| R. rosifolius | 26.6 | ± | 1.3 | 10.1 | ± | 1.1 efg | 2.6 | ± | 0.1 abc | 2.3 | ± | 0.2 abcde | 15.0 | ± | 1.5 cdefghijk | 94.1 | ± | 2.2 klmno | 33.1 | ± | 1.4 st | |
| Salicaceae | D. hebecarpa | 768.2 | ± | 32.4 | 0.8 | ± | 0.1 a | 17.3 | ± | 1.6 kl | 2.3 | ± | 0.1 abcde | 20.5 | ± | 0.5 ghijklm | 92.4 | ± | 2.7 jklmn | 22.5 | ± | 1.6 nop |
| Sapindaceae | N. lappaceum | 73.4 | ± | 1.6 | 11.2 | ± | 1.5 defg | 2.4 | ± | 0.1 abc | 2.0 | ± | 0.2 abcde | 15.6 | ± | 1.8 defghijk | 16.4 | ± | 0.3 abcdef | 3.5 | ± | 0.8 abcdefg |
| Sapotaceae | P. caimito | 24.3 | ± | 1.3 | 0.3 | ± | 0.1 a | 0.8 | ± | 0.3 a | 4.9 | ± | 1.4 bcdef | 6.1 | ± | 1.7 abcd | 29.5 | ± | 1.1 cdef | 2.6 | ± | 0.4 abcde |
| P. sapota | 56.6 | ± | 1.0 | 0.8 | ± | 0.0 a | 0.5 | ± | 0.0 a | 1.8 | ± | 0.2 abcde | 3.2 | ± | 0.3 a | 18.3 | ± | 1.1 abcde | 6.5 | ± | 0.8 cdefghij | |
| Solanaceae | P. peruviana | 124.3 | ± | 2.4 | 9.7 | ± | 0.9 efg | 1.8 | ± | 0.1 ab | 2.8 | ± | 0.0 abcde | 14.3 | ± | 1.0 bcdefghij | 3.2 | ± | 0.3 ab | 33.3 | ± | 0.1 st |
| S. betaceum purple | 83.2 | ± | 4.2 | 5.3 | ± | 0.9 abcde | 0.5 | ± | 0.1 a | 7.6 | ± | 0.8 efg | 13.4 | ± | 1.7 bcdefghij | 117.3 | ± | 0.4 p | 17.8 | ± | 1.8 lmn | |
| S. betaceum yellow | 121.7 | ± | 0.3 | 4.9 | ± | 0.1 abcde | 0.5 | ± | 0.0 a | 7.4 | ± | 0.1 efg | 12.8 | ± | 0.3 bcdefghij | 75.9 | ± | 1.2 hijkl | 12.2 | ± | 0.3 ijk | |
| S. sessiliflorum | 23.8 | ± | 0.0 | 16.8 | ± | 0.0 ij | 4.4 | ± | 0.1 abcd | 1.7 | ± | 0.0 abc | 22.8 | ± | 0.1 jklm | 28.6 | ± | 1.2 cdef | 26.0 | ± | 0.7 opq | |
| Urticaceae | P. cecropiifolia | nd | 4.8 | ± | 0.1 abcde | 1.1 | ± | 0.0 ab | 2.0 | ± | 0.3 abcde | 7.9 | ± | 0.3 abcde | 161.4 | ± | 1.8 q | 30.2 | ± | 3.1 qrs | ||
| Family | Scientific Name | α-Carotene | β-Carotene | β-Cryptoxanthin | Leteoxanthin | Lutein | Lycopene | Phytoene | Violaxanthin | Zeaxanthin | Zeinoxanthin | Total (mg/100 g DW) | ||||||||||||||||||||||
|---|---|---|---|---|---|---|---|---|---|---|---|---|---|---|---|---|---|---|---|---|---|---|---|---|---|---|---|---|---|---|---|---|---|---|
| Anacardiaceae | S. purpurea red | 2.9 | ± | 0.1 | 0.6 | ± | 0.0 | 3.6 | ± | 0.1 | ||||||||||||||||||||||||
| S. purpurea yellow | 2.8 | ± | 0.4 | 3.3 | ± | 0.2 | 2.9 | ± | 0.2 | 2.8 | ± | 0.7 | 11.8 | ± | 0.7 | |||||||||||||||||||
| Apoxynaceae | L. lactescens | 284.1 | ± | 13.0 | 284.1 | ± | 13.0 | |||||||||||||||||||||||||||
| Arecaceae | B. concinna | 8.3 | ± | 0.1 | 8.3 | ± | 0.1 | |||||||||||||||||||||||||||
| B. gasipaes | 93.1 | ± | 14.6 | 50.2 | ± | 6.5 | 13.5 | ± | 1.7 | 2.0 | ± | 0.3 | 1.7 | ± | 0.3 | 15.4 | ± | 2.2 | 6.8 | ± | 1.1 | 182.6 | ± | 26.7 | ||||||||||
| M. flexuosa | 5.5 | ± | 0.1 | 19.9 | ± | 1.9 | 7.0 | ± | 0.8 | 1.3 | ± | 0.1 | 3.7 | ± | 0.3 | 37.4 | ± | 1.4 | ||||||||||||||||
| O. bataua | nd | |||||||||||||||||||||||||||||||||
| S. zalacca | 0.8 | ± | 0.0 | 0.8 | ± | 0.0 | ||||||||||||||||||||||||||||
| Burseraceae | D. peruviana | nd | ||||||||||||||||||||||||||||||||
| Cactaceae | O. ficus-indica | 0.7 | ± | 0.0 | 0.2 | ± | 0.0 | 0.3 | ± | 0.0 | 1.1 | ± | 0.0 | |||||||||||||||||||||
| S. megalanthus | 0.8 | ± | 0.1 | 0.8 | ± | 0.1 | ||||||||||||||||||||||||||||
| Caricaceae | V. pubescens | 13.6 | ± | 1.2 | 33.6 | ± | 0.1 | 12.9 | ± | 0.1 | 1.1 | ± | 0.1 | 61.4 | ± | 1.2 | ||||||||||||||||||
| Curcubitaceae | M. charantia | 16.4 | ± | 2.9 | 464.6 | ± | 36.5 | 0.6 | ± | 0.0 | 5.4 | ± | 0.5 | 487.0 | ± | 39.9 | ||||||||||||||||||
| S. odorifera | 10.2 | ± | 1.1 | 311.4 | ± | 75.2 | 321.6 | ± | 76.3 | |||||||||||||||||||||||||
| S. edulis | 0.9 | ± | 0.0 | 0.9 | ± | 0.0 | ||||||||||||||||||||||||||||
| Ebenaceae | D. kaki | 13.6 | ± | 0.2 | 0.9 | ± | 0.1 | 1.0 | ± | 0.0 | 15.5 | ± | 0.3 | |||||||||||||||||||||
| Fabaceae | I. edulis | 2.7 | ± | 0.2 | 0.8 | ± | 0.1 | 3.4 | ± | 0.3 | ||||||||||||||||||||||||
| I. insignis | 0.8 | ± | 0.0 | 0.8 | ± | 0.0 | ||||||||||||||||||||||||||||
| Malvaceae | H. nitida | 0.9 | ± | 0.1 | 0.9 | ± | 0.1 | |||||||||||||||||||||||||||
| M. cordata | 10.2 | ± | 2.3 | 11.6 | ± | 2.1 | 9.5 | ± | 1.2 | 8.5 | ± | 0.5 | 15.8 | ± | 3.4 | 0.7 | ± | 0.1 | 56.2 | ± | 9.5 | |||||||||||||
| T. cacao red | 2.2 | ± | 0.1 | 2.2 | ± | 0.1 | ||||||||||||||||||||||||||||
| T. cacao yellow | 0.8 | ± | 0.1 | 0.8 | ± | 0.2 | 1.5 | ± | 0.3 | |||||||||||||||||||||||||
| Melastomataceae | M. crocea | 11.1 | ± | 0.1 | 4.3 | ± | 0.2 | 15.4 | ± | 0.1 | ||||||||||||||||||||||||
| Moraceae | A. heterophyllus | 0.5 | ± | 0.0 | 0.5 | ± | 0.0 | |||||||||||||||||||||||||||
| M. alba | 19.8 | ± | 3.9 | 2.9 | ± | 0.6 | 22.6 | ± | 4.5 | |||||||||||||||||||||||||
| Myrtaceae | A. sellowiana | 1.9 | ± | 0.2 | 6.4 | ± | 0.4 | 8.2 | ± | 0.3 | ||||||||||||||||||||||||
| E. stipitata | 9.8 | ± | 2.0 | 3.8 | ± | 1.3 | 13.6 | ± | 3.2 | |||||||||||||||||||||||||
| P. guajava | 1.1 | ± | 0.0 | 59.5 | ± | 5.9 | 1.2 | ± | 0.0 | 61.8 | ± | 5.9 | ||||||||||||||||||||||
| P. guineense | 0.9 | ± | 0.0 | 0.7 | ± | 0.0 | 1.6 | ± | 0.0 | |||||||||||||||||||||||||
| S. jambos red | 0.7 | ± | 0.1 | 0.7 | ± | 0.1 | ||||||||||||||||||||||||||||
| S. jambos yellow | 6.3 | ± | 0.6 | 2.5 | ± | 0.1 | 8.8 | ± | 0.4 | |||||||||||||||||||||||||
| Oxalidaceae | A. carambola | 1.7 | ± | 0.0 | 3.6 | ± | 0.0 | 5.3 | ± | 0.0 | ||||||||||||||||||||||||
| Passifloraceae | P. edulis | 5.0 | ± | 0.7 | 5.0 | ± | 0.7 | |||||||||||||||||||||||||||
| P. hybrid | 20.1 | ± | 3.2 | 7.8 | ± | 0.1 | 0.1 | ± | 0.0 | 6.6 | ± | 0.2 | 34.5 | ± | 3.5 | |||||||||||||||||||
| P. mollissima | 86.2 | ± | 1.0 | 1.3 | ± | 0.1 | 1.4 | ± | 0.1 | 88.8 | ± | 0.9 | ||||||||||||||||||||||
| P. quadrangularis | 0.7 | ± | 0.0 | 0.7 | ± | 0.0 | 1.4 | ± | 0.1 | |||||||||||||||||||||||||
| P. tripartita | 0.8 | ± | 0.1 | 0.7 | ± | 0.1 | 1.4 | ± | 0.1 | 2.9 | ± | 0.2 | ||||||||||||||||||||||
| Rosaceae | C. oblonga | 0.5 | ± | 0.1 | 0.9 | ± | 0.1 | 1.4 | ± | 0.2 | ||||||||||||||||||||||||
| P. persica | 2.5 | ± | 0.0 | 2.5 | ± | 0.0 | ||||||||||||||||||||||||||||
| P. salicifolia | 13.8 | ± | 1.0 | 1.6 | ± | 0.0 | 15.4 | ± | 1.1 | |||||||||||||||||||||||||
| R. niveus | 7.6 | ± | 0.5 | 1.1 | ± | 0.0 | 8.6 | ± | 0.5 | |||||||||||||||||||||||||
| R. rosifolius | 4.8 | ± | 0.1 | 2.3 | ± | 0.5 | 1.3 | ± | 0.3 | 8.4 | ± | 0.2 | ||||||||||||||||||||||
| Salicaceae | D. hebecarpa | 9.8 | ± | 1.4 | 1.7 | ± | 0.4 | 11.5 | ± | 1.9 | ||||||||||||||||||||||||
| Sapindaceae | N. lappaceum | 1.6 | ± | 0.1 | 2.4 | ± | 0.3 | 4.1 | ± | 0.4 | ||||||||||||||||||||||||
| Sapotaceae | P. caimito | 4.7 | ± | 0.2 | 1.7 | ± | 0.0 | 0.5 | ± | 0.0 | 0.6 | ± | 0.0 | 7.6 | ± | 0.3 | ||||||||||||||||||
| P. sapota | 7.8 | ± | 0.0 | 43.4 | ± | 0.0 | 1.0 | ± | 0.0 | 1.4 | ± | 0.0 | 53.6 | ± | 0.0 | |||||||||||||||||||
| Solanaceae | P. peruviana | 1.9 | ± | 0.2 | 2.7 | ± | 0.6 | 1.2 | ± | 0.1 | 5.7 | ± | 0.9 | |||||||||||||||||||||
| S. betaceum purple | 4.4 | ± | 0.0 | 4.6 | ± | 0.0 | 1.1 | ± | 0.0 | 10.1 | ± | 0.0 | ||||||||||||||||||||||
| S. betaceum yellow | 0.8 | ± | 0.1 | 2.6 | ± | 0.4 | 0.3 | ± | 0.0 | 3.7 | ± | 0.5 | ||||||||||||||||||||||
| S. sessiliflorum | 3.7 | ± | 0.5 | 3.7 | ± | 0.5 | ||||||||||||||||||||||||||||
| Urticaceae | P. cecropiifolia | 90.9 | ± | 8.4 | 90.9 | ± | 8.4 | |||||||||||||||||||||||||||
| Family | Scientific Name | Chlorogenic Acid (mg/g) | Naringenin (mg/g) | Ferulic Acid (mg/g) | Quercetin (mg/g) | Siringic Acid (mg/g) | Routine (mg/g) | Cafeic Acid (mg/g) | m-Cumaric Acid (mg/g) | p-Coumaric Acid (mg/g) | p-Hydroxy Benzoic Acid (mg/g) | Gallic Acid (mg/g) | Total (mg/g) | ||||||||||||||||||||||||
|---|---|---|---|---|---|---|---|---|---|---|---|---|---|---|---|---|---|---|---|---|---|---|---|---|---|---|---|---|---|---|---|---|---|---|---|---|---|
| Anacardiaceae | S. purpurea red | 0.3 | ± | 0.1 | 0.2 | ± | 0.1 | 17.6 | ± | 4.4 | 1.8 | ± | 0.6 | 0.1 | ± | 0.0 | 0.2 | ± | 0.0 | 20.2 | ± | 5.2 | |||||||||||||||
| S. purpurea yellow | 0.1 | ± | 0.0 | 0.2 | ± | 0.0 | 0.2 | ± | 0.0 | 0.1 | ± | 0.0 | 0.1 | ± | 0.0 | 0.7 | ± | 0.0 | |||||||||||||||||||
| Apoxynaceae | L. lactescens | 3.8 | ± | 0.2 | 30.8 | ± | 2.0 | 0.2 | ± | 0.0 | 1.9 | ± | 0.0 | 3.3 | ± | 0.1 | 1.1 | ± | 0.0 | 41.0 | ± | 2.0 | |||||||||||||||
| Arecaceae | B. concinna | 0.8 | ± | 0.0 | 0.7 | ± | 0.2 | 3.4 | ± | 0.0 | 7.9 | ± | 0.2 | 12.7 | ± | 0.3 | |||||||||||||||||||||
| B. gasipaes | 0.4 | ± | 0.0 | 0.3 | ± | 0.0 | 0.1 | ± | 0.0 | 0.5 | ± | 0.0 | 2.5 | ± | 0.1 | 0.2 | ± | 0.0 | 3.8 | ± | 0.1 | ||||||||||||||||
| M. flexuosa | 0.1 | ± | 0.0 | 0.2 | ± | 0.0 | 0.5 | ± | 0.0 | 2.6 | ± | 0.1 | 0.1 | ± | 0.0 | 3.5 | ± | 0.1 | |||||||||||||||||||
| O. bataua | 0.2 | ± | 0.0 | 0.3 | ± | 0.0 | 0.1 | ± | 0.0 | 0.1 | ± | 0.0 | 1.9 | ± | 0.0 | 2.5 | ± | 0.0 | |||||||||||||||||||
| S. zalacca | 0.4 | ± | 0.0 | 3.5 | ± | 0.0 | 0.1 | ± | 0.0 | 5.6 | ± | 0.2 | 4.0 | ± | 0.1 | 0.3 | ± | 0.0 | 13.9 | ± | 0.2 | ||||||||||||||||
| Burseraceae | D. peruviana | 0.1 | ± | 0.0 | 1.2 | ± | 0.0 | 0.1 | ± | 0.0 | 2.5 | ± | 0.2 | 3.8 | ± | 0.2 | |||||||||||||||||||||
| Cactaceae | O. ficus-indica | 0.1 | ± | 0.0 | 0.7 | ± | 0.0 | 0.3 | ± | 0.0 | 0.3 | ± | 0.0 | 0.8 | ± | 0.1 | 0.2 | ± | 0.0 | 0.1 | ± | 0.0 | 0.2 | ± | 0.0 | 2.7 | ± | 0.1 | |||||||||
| S. megalanthus | 1.6 | ± | 0.4 | 50.5 | ± | 8.5 | 0.7 | ± | 0.2 | 0.6 | ± | 0.1 | 0.1 | ± | 0.0 | 53.4 | ± | 9.3 | |||||||||||||||||||
| Caricaceae | V. pubescens a | 0.1 | ± | 0.0 | 15.9 | ± | 0.3 | 0.4 | ± | 0.0 | 0.1 | ± | 0.0 | 0.6 | ± | 0.0 | 78.9 | ± | 7.3 | ||||||||||||||||||
| Curcubitaceae | M. charantia | 0.1 | ± | 0.0 | 0.2 | ± | 0.1 | 0.4 | ± | 0.0 | 2.3 | ± | 0.3 | 0.2 | ± | 0.0 | 0.1 | ± | 0.0 | 0.2 | ± | 0.0 | 1.4 | ± | 0.2 | 6.0 | ± | 0.6 | |||||||||
| S. odorifera | 0.1 | ± | 0.0 | 0.3 | ± | 0.0 | 0.6 | ± | 0.0 | 0.2 | ± | 0.0 | 3.3 | ± | 0.1 | 2.3 | ± | 0.1 | 6.8 | ± | 0.3 | ||||||||||||||||
| S. edulis b | 91.1 | ± | 8.5 | 0.1 | ± | 0.0 | 237.3 | ± | 5.2 | 0.9 | ± | 0.1 | 0.3 | ± | 0.0 | 2.5 | ± | 0.1 | 0.5 | ± | 0.1 | 487.1 | ± | 13.5 | |||||||||||||
| Ebenaceae | D. kaki | 18.3 | ± | 0.0 | 0.6 | ± | 0.0 | 0.2 | ± | 0.0 | 19.1 | ± | 0.1 | ||||||||||||||||||||||||
| Fabaceae | I. edulis | 1.1 | ± | 0.0 | 0.3 | ± | 0.0 | 0.2 | ± | 0.0 | 0.1 | ± | 0.0 | 0.1 | ± | 0.0 | 1.9 | ± | 0.0 | ||||||||||||||||||
| I. insignis | 1.4 | ± | 0.1 | 0.2 | ± | 0.0 | 0.2 | ± | 0.0 | 1.0 | ± | 0.1 | 0.1 | ± | 0.0 | 0.3 | ± | 0.0 | 3.1 | ± | 0.2 | ||||||||||||||||
| Malvaceae | H. nitida | 0.5 | ± | 0.0 | 0.2 | ± | 0.0 | 10.3 | ± | 3.0 | 4.8 | ± | 1.7 | 0.1 | ± | 0.0 | 2.8 | ± | 0.7 | 0.3 | ± | 0.1 | 19.0 | ± | 5.6 | ||||||||||||
| M. cordata | 1.4 | ± | 0.1 | 0.1 | ± | 0.0 | 0.1 | ± | 0.0 | 1.7 | ± | 0.0 | |||||||||||||||||||||||||
| T. cacao red | 0.6 | ± | 0.0 | 3.9 | ± | 0.1 | 2.6 | ± | 0.2 | 3.9 | ± | 0.0 | 0.3 | ± | 0.0 | 3.4 | ± | 0.3 | 0.5 | ± | 0.0 | 15.3 | ± | 0.3 | |||||||||||||
| T. cacao yellow | 0.2 | ± | 0.0 | 0.3 | ± | 0.0 | 0.3 | ± | 0.0 | 1.6 | ± | 0.0 | 0.8 | ± | 0.1 | 1.5 | ± | 0.1 | 0.2 | ± | 0.0 | 3.1 | ± | 0.0 | 0.1 | ± | 0.0 | 8.2 | ± | 0.2 | |||||||
| Melastomataceae | M. crocea | 0.2 | ± | 0.0 | 2.0 | ± | 0.0 | 24.5 | ± | 9.7 | 3.0 | ± | 0.1 | 0.2 | ± | 0.0 | 4.9 | ± | 0.4 | 0.7 | ± | 0.0 | 35.5 | ± | 10.1 | ||||||||||||
| Moraceae | A. heterophyllus | 0.1 | ± | 0.0 | 0.1 | ± | 0.0 | 0.2 | ± | 0.0 | 0.3 | ± | 0.0 | ||||||||||||||||||||||||
| M. alba | 40.0 | ± | 0.3 | 0.4 | ± | 0.0 | 0.1 | ± | 0.0 | 0.1 | ± | 0.0 | 46.0 | ± | 0.3 | ||||||||||||||||||||||
| Myrtaceae | A. sellowiana | 1.2 | ± | 0.0 | 0.2 | ± | 0.0 | 4.7 | ± | 0.1 | 1.2 | ± | 0.0 | 0.1 | ± | 0.0 | 0.1 | ± | 0.0 | 7.3 | ± | 0.1 | |||||||||||||||
| E. stipitata | 0.9 | ± | 0.0 | 2.4 | ± | 0.0 | 0.3 | ± | 0.0 | 0.4 | ± | 0.0 | 17.9 | ± | 0.0 | 0.7 | ± | 0.1 | 26.1 | ± | 0.4 | ||||||||||||||||
| P. guajava | 16.3 | ± | 0.3 | 0.1 | ± | 0.0 | 16.4 | ± | 0.3 | ||||||||||||||||||||||||||||
| P. guineense | 13.7 | ± | 0.0 | 0.9 | ± | 0.0 | 14.6 | ± | 0.0 | ||||||||||||||||||||||||||||
| S. jambos red | 19.3 | ± | 4.3 | 3.4 | ± | 1.2 | 9.0 | ± | 2.4 | 31.7 | ± | 7.9 | |||||||||||||||||||||||||
| S. jambos yellow | 3.1 | ± | 0.0 | 0.4 | ± | 0.1 | 18.6 | ± | 0.7 | 0.7 | ± | 0.0 | 3.4 | ± | 0.0 | 2.0 | ± | 0.4 | 0.2 | ± | 0.0 | 3.8 | ± | 1.0 | 0.2 | ± | 0.2 | 33.0 | ± | 2.0 | |||||||
| Oxalidaceae | A. carambola | 0.5 | ± | 0.0 | 2.8 | ± | 0.2 | 0.3 | ± | 0.0 | 0.1 | ± | 0.0 | 1.3 | ± | 0.0 | 2.2 | ± | 0.0 | 0.1 | ± | 0.0 | 7.3 | ± | 0.1 | ||||||||||||
| Passifloraceae | P. edulis | 0.6 | ± | 0.2 | 87.0 | ± | 2.5 | 7.7 | ± | 2.3 | 0.6 | ± | 0.2 | 17.4 | ± | 4.9 | 0.4 | ± | 0.1 | 113.7 | ± | 33.1 | |||||||||||||||
| P. hybrid | 0.7 | ± | 0.1 | 0.3 | ± | 0.0 | 0.5 | ± | 0.0 | 2.2 | ± | 0.0 | 0.6 | ± | 0.0 | 3.0 | ± | 0.3 | 1.0 | ± | 0.0 | 8.3 | ± | 0.2 | |||||||||||||
| P. mollissima | 0.1 | ± | 0.0 | 1.9 | ± | 0.1 | 1.5 | ± | 0.0 | 2.6 | ± | 0.1 | 0.1 | ± | 0.0 | 11.6 | ± | 0.2 | 0.2 | ± | 0.0 | 18.1 | ± | 0.4 | |||||||||||||
| P. quadrangularis | 0.8 | ± | 0.2 | 0.3 | ± | 0.0 | 0.6 | ± | 0.1 | 1.2 | ± | 0.3 | 0.2 | ± | 0.0 | 0.2 | ± | 0.0 | 0.2 | ± | 0.0 | 0.3 | ± | 0.1 | 8.3 | ± | 2.2 | ||||||||||
| P. tripartita | 0.7 | ± | 0.1 | 1.0 | ± | 0.0 | 0.2 | ± | 0.0 | 1.6 | ± | 0.0 | 1.2 | ± | 0.0 | 0.4 | ± | 0.0 | 0.3 | ± | 0.0 | 5.3 | ± | 0.1 | |||||||||||||
| Rosaceae | C. oblonga | 1.3 | ± | 0.0 | 2.6 | ± | 0.0 | 0.6 | ± | 0.0 | 2.3 | ± | 0.1 | 0.1 | ± | 0.0 | 7.2 | ± | 0.2 | ||||||||||||||||||
| P. persica | 4.4 | ± | 1.2 | 0.3 | ± | 0.1 | 0.1 | ± | 0.0 | 30.7 | ± | 8.6 | 0.1 | ± | 0.0 | 0.2 | ± | 0.0 | 35.9 | ± | 1.0 | ||||||||||||||||
| P. salicifolia | 7.8 | ± | 1.9 | 1.6 | ± | 0.4 | 0.1 | ± | 0.0 | 15.4 | ± | 3.6 | 4.9 | ± | 0.7 | 0.1 | ± | 0.0 | 0.1 | ± | 0.0 | 29.8 | ± | 6.6 | |||||||||||||
| R. niveus | 13.4 | ± | 1.3 | 0.2 | ± | 0.0 | 26.2 | ± | 0.1 | 0.1 | ± | 0.0 | 39.8 | ± | 1.4 | ||||||||||||||||||||||
| R. rosifolius | 1.4 | ± | 0.0 | 10.3 | ± | 0.1 | 0.3 | ± | 0.0 | 12.0 | ± | 0.0 | |||||||||||||||||||||||||
| Salicaceae | D. hebecarpa | 0.1 | ± | 0.0 | 0.1 | ± | 0.0 | 1.5 | ± | 0.0 | 1.7 | ± | 0.0 | 0.3 | ± | 0.0 | 27.3 | ± | 0.3 | 0.2 | ± | 0.0 | 31.1 | ± | 0.3 | ||||||||||||
| Sapindaceae | N. lappaceum | 168.8 | ± | 3.5 | 366.5 | ± | 10.3 | 0.1 | ± | 0.0 | 535.4 | ± | 13.9 | ||||||||||||||||||||||||
| Sapotaceae | P. caimito | 0.1 | ± | 0.0 | 0.6 | ± | 0.0 | 3.2 | ± | 0.5 | 1.7 | ± | 0.1 | 5.6 | ± | 0.6 | |||||||||||||||||||||
| P. sapota c | 0.1 | ± | 0.0 | 2.7 | ± | 0.5 | 0.8 | ± | 0.3 | 14.4 | ± | 3.8 | |||||||||||||||||||||||||
| Solanaceae | P. peruviana | 0.1 | ± | 0.0 | 0.7 | ± | 0.3 | 0.1 | ± | 0.0 | 17.9 | ± | 7.3 | 0.5 | ± | 0.1 | 0.4 | ± | 0.2 | 0.1 | ± | 0.0 | 0.2 | ± | 0.0 | 19.9 | ± | 0.8 | |||||||||
| S. betaceum purple | 16.2 | ± | 1.3 | 3.5 | ± | 0.5 | 19.7 | ± | 1.7 | ||||||||||||||||||||||||||||
| S. betaceum yellow | 14.9 | ± | 1.4 | 5.6 | ± | 0.1 | 20.5 | ± | 1.2 | ||||||||||||||||||||||||||||
| S. sessiliflorum | 0.1 | ± | 0.0 | 0.6 | ± | 0.2 | 0.2 | ± | 0.0 | 0.3 | ± | 0.1 | 1.2 | ± | 0.4 | 0.1 | ± | 0.0 | 2.7 | ± | 0.9 | 0.1 | ± | 0.0 | 5.2 | ± | 1.7 | ||||||||||
| Urticaceae | P. cecropiifolia | 5.9 | ± | 0.6 | 0.8 | ± | 0.0 | 8.7 | ± | 0.3 | 4.4 | ± | 0.3 | 2.5 | ± | 0.1 | 0.3 | ± | 0.0 | 22.7 | ± | 0.4 | |||||||||||||||
Disclaimer/Publisher’s Note: The statements, opinions and data contained in all publications are solely those of the individual author(s) and contributor(s) and not of MDPI and/or the editor(s). MDPI and/or the editor(s) disclaim responsibility for any injury to people or property resulting from any ideas, methods, instructions or products referred to in the content. |
© 2023 by the authors. Licensee MDPI, Basel, Switzerland. This article is an open access article distributed under the terms and conditions of the Creative Commons Attribution (CC BY) license (https://creativecommons.org/licenses/by/4.0/).
Share and Cite
Coyago-Cruz, E.; Guachamin, A.; Villacís, M.; Rivera, J.; Neto, M.; Méndez, G.; Heredia-Moya, J.; Vera, E. Evaluation of Bioactive Compounds and Antioxidant Activity in 51 Minor Tropical Fruits of Ecuador. Foods 2023, 12, 4439. https://doi.org/10.3390/foods12244439
Coyago-Cruz E, Guachamin A, Villacís M, Rivera J, Neto M, Méndez G, Heredia-Moya J, Vera E. Evaluation of Bioactive Compounds and Antioxidant Activity in 51 Minor Tropical Fruits of Ecuador. Foods. 2023; 12(24):4439. https://doi.org/10.3390/foods12244439
Chicago/Turabian StyleCoyago-Cruz, Elena, Aida Guachamin, Michael Villacís, Jason Rivera, María Neto, Gabriela Méndez, Jorge Heredia-Moya, and Edwin Vera. 2023. "Evaluation of Bioactive Compounds and Antioxidant Activity in 51 Minor Tropical Fruits of Ecuador" Foods 12, no. 24: 4439. https://doi.org/10.3390/foods12244439