
Green Processing of Black Raspberry Pomace: Application of Sonotrode-Based Extraction Technique and Particles from Gas-Saturated Solutions (PGSS) Technology
 , , , , ,
Abstract
: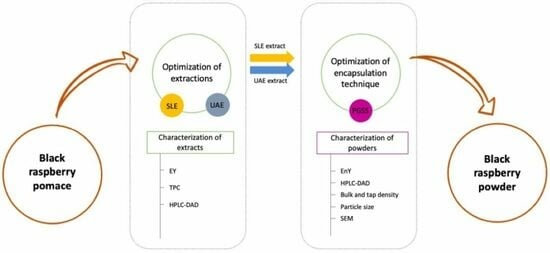
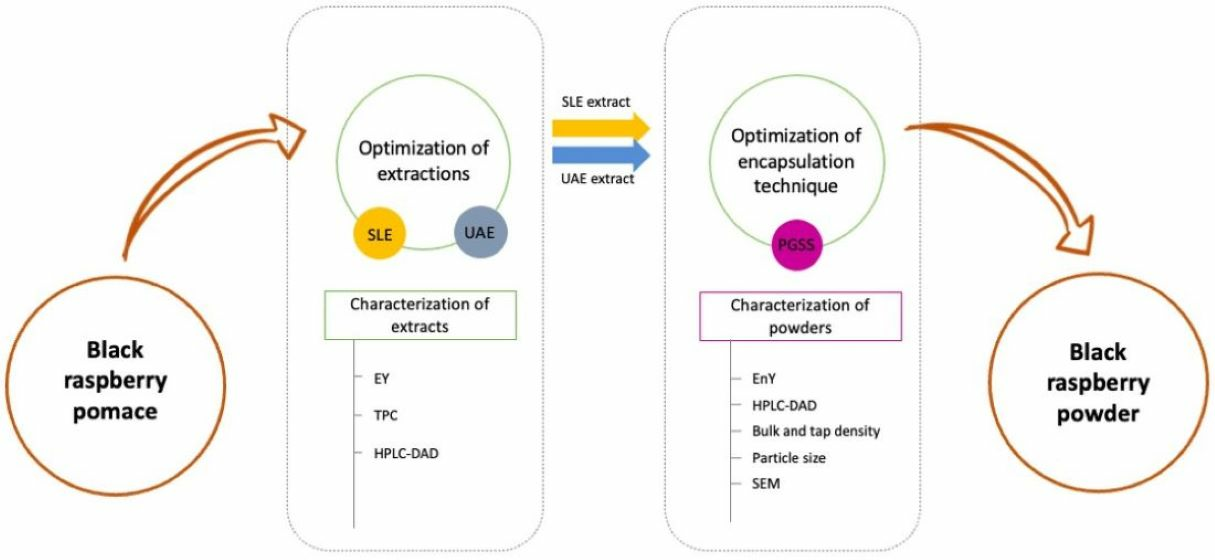
1. Introduction
2. Materials and Methods
2.1. Plant Material and Chemicals
2.2. Conventional Solid–Liquid Extraction
2.3. Ultrasound-Assisted Extraction via Sonotrode
2.4. Particles from Gas-Saturated Solutions Process
2.5. Total Phenolic Content
2.6. HPLC Analysis
2.7. Powder Characterization
2.7.1. Particle Size
2.7.2. Scanning Electron Microscope (SEM)
2.8. Statistical Analysis
3. Results and Discussion
3.1. Characterization of BRP Extracts
3.1.1. Extraction Yield and Total Phenolic Content of BRP Extracts
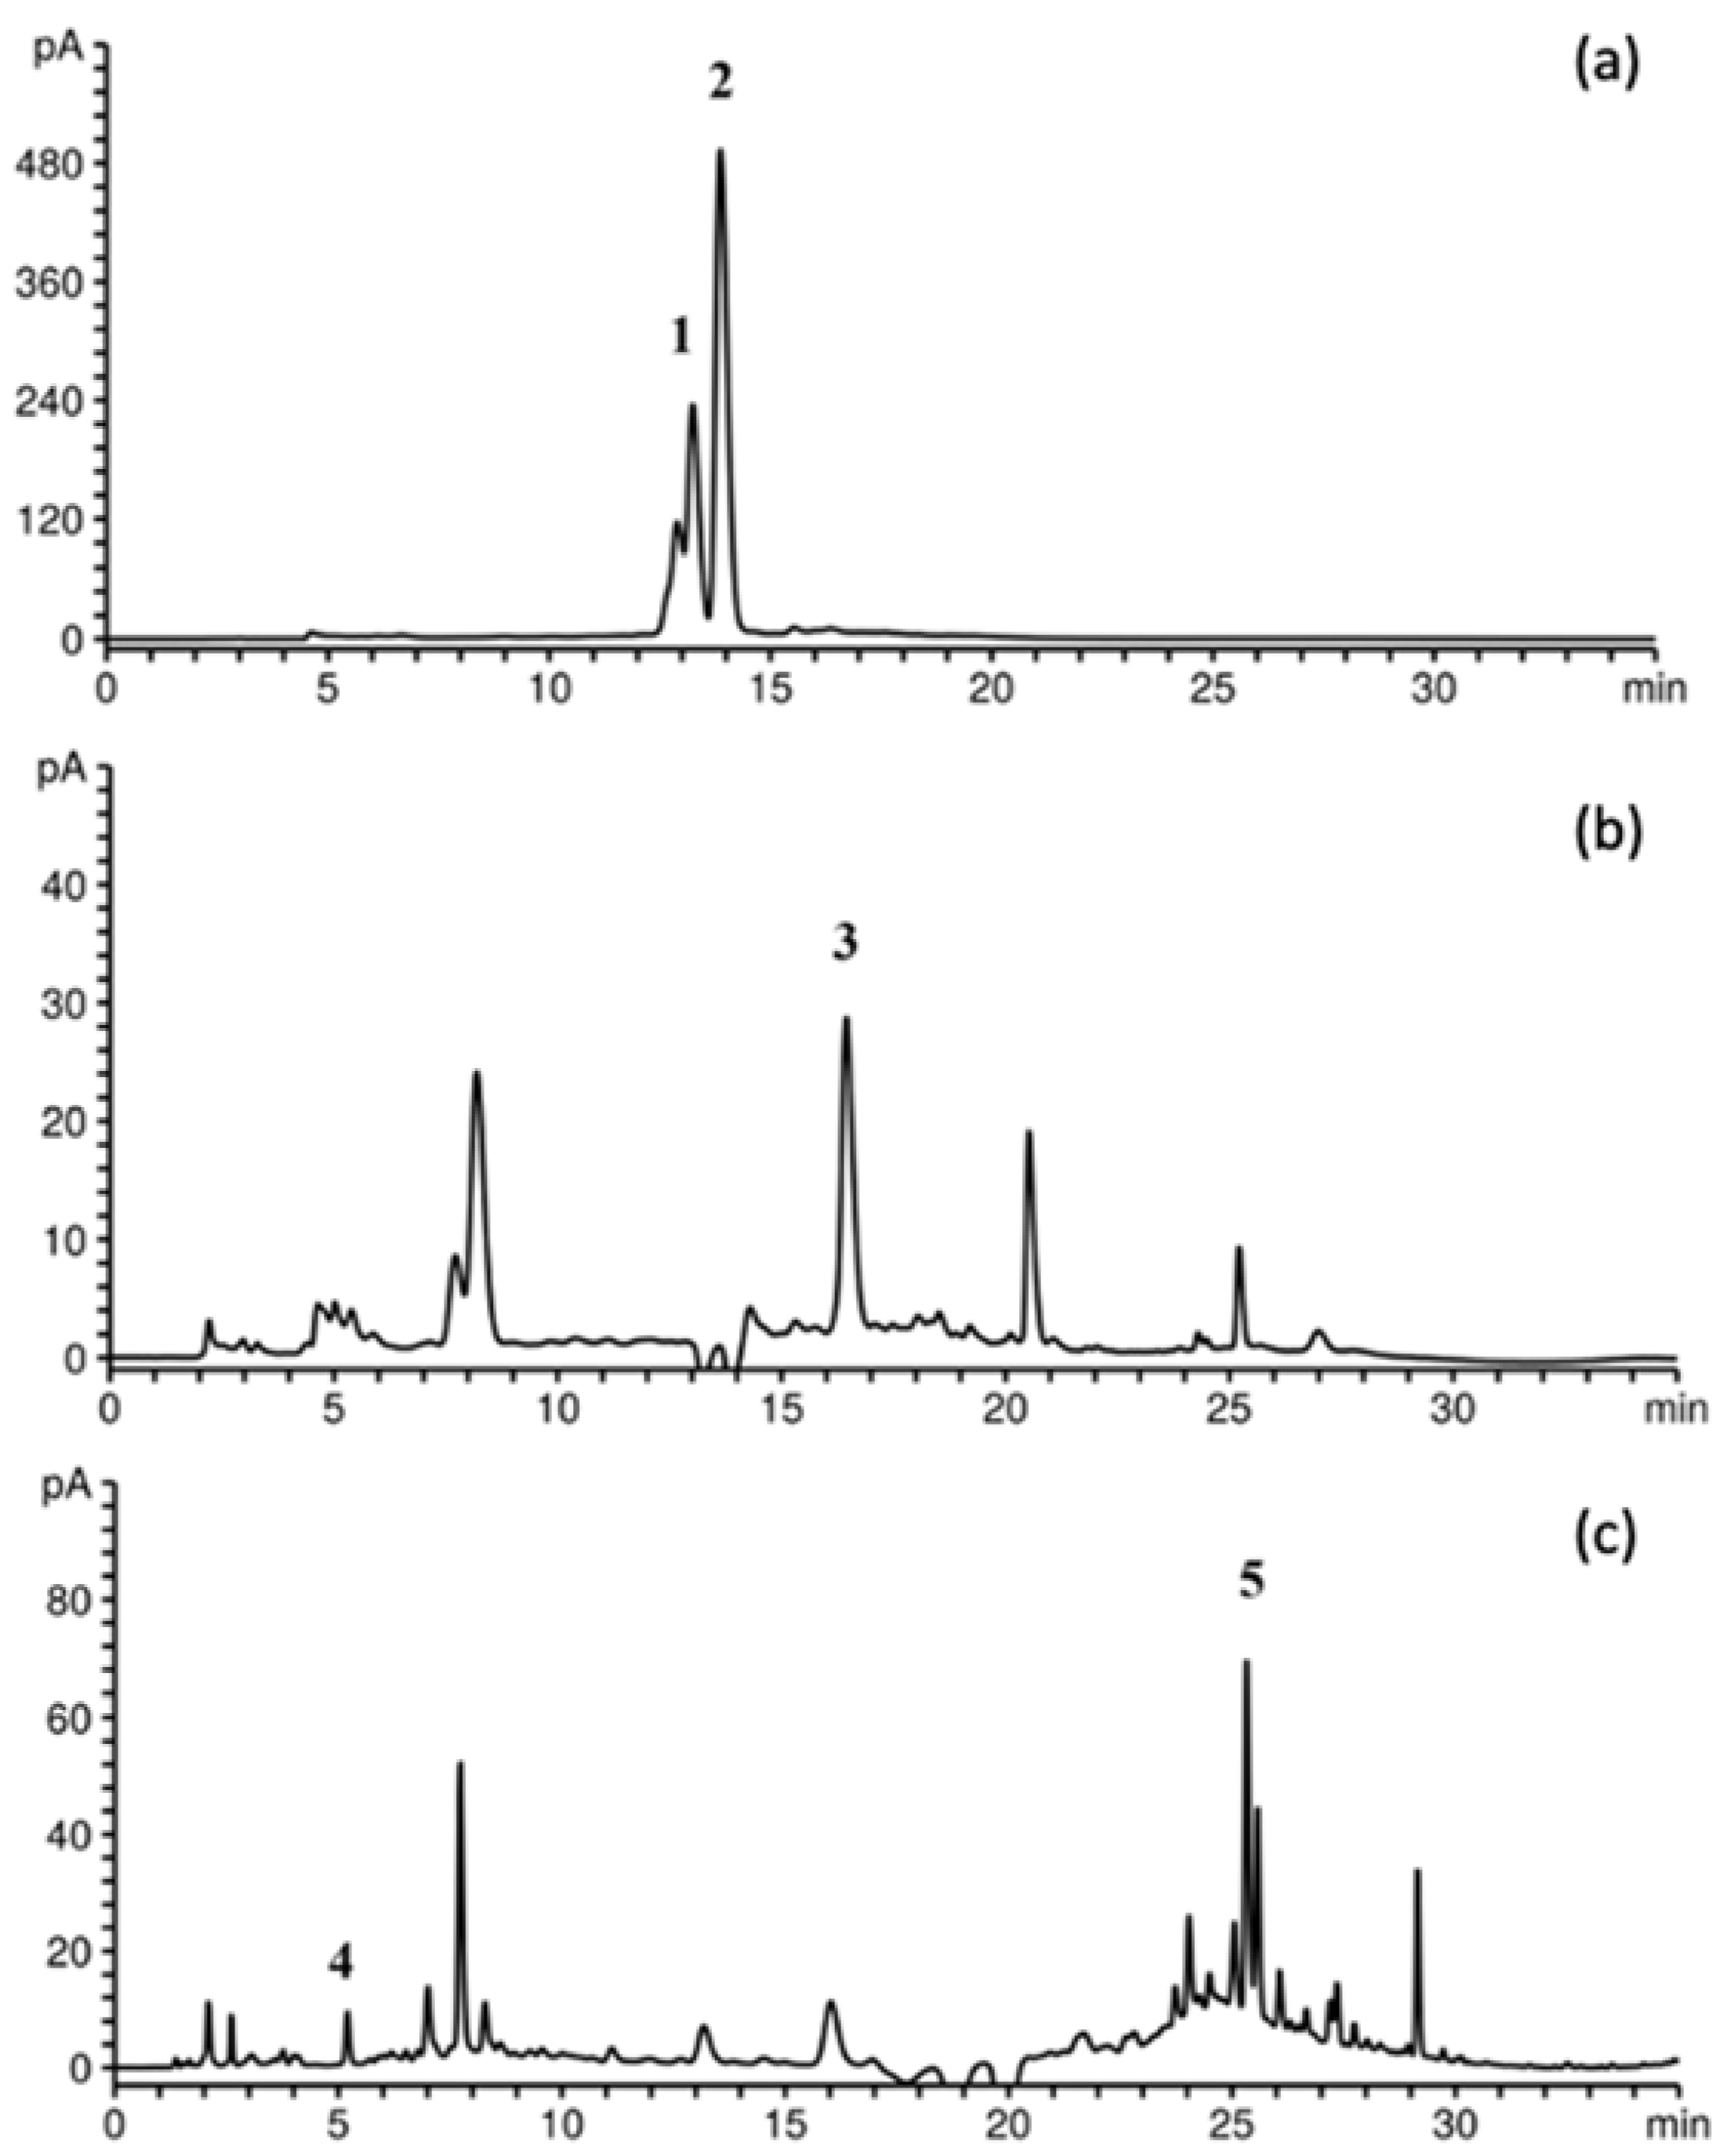
3.1.2. HPLC Analysis of BRP Extracts
3.2. Characterization of BRP Powder
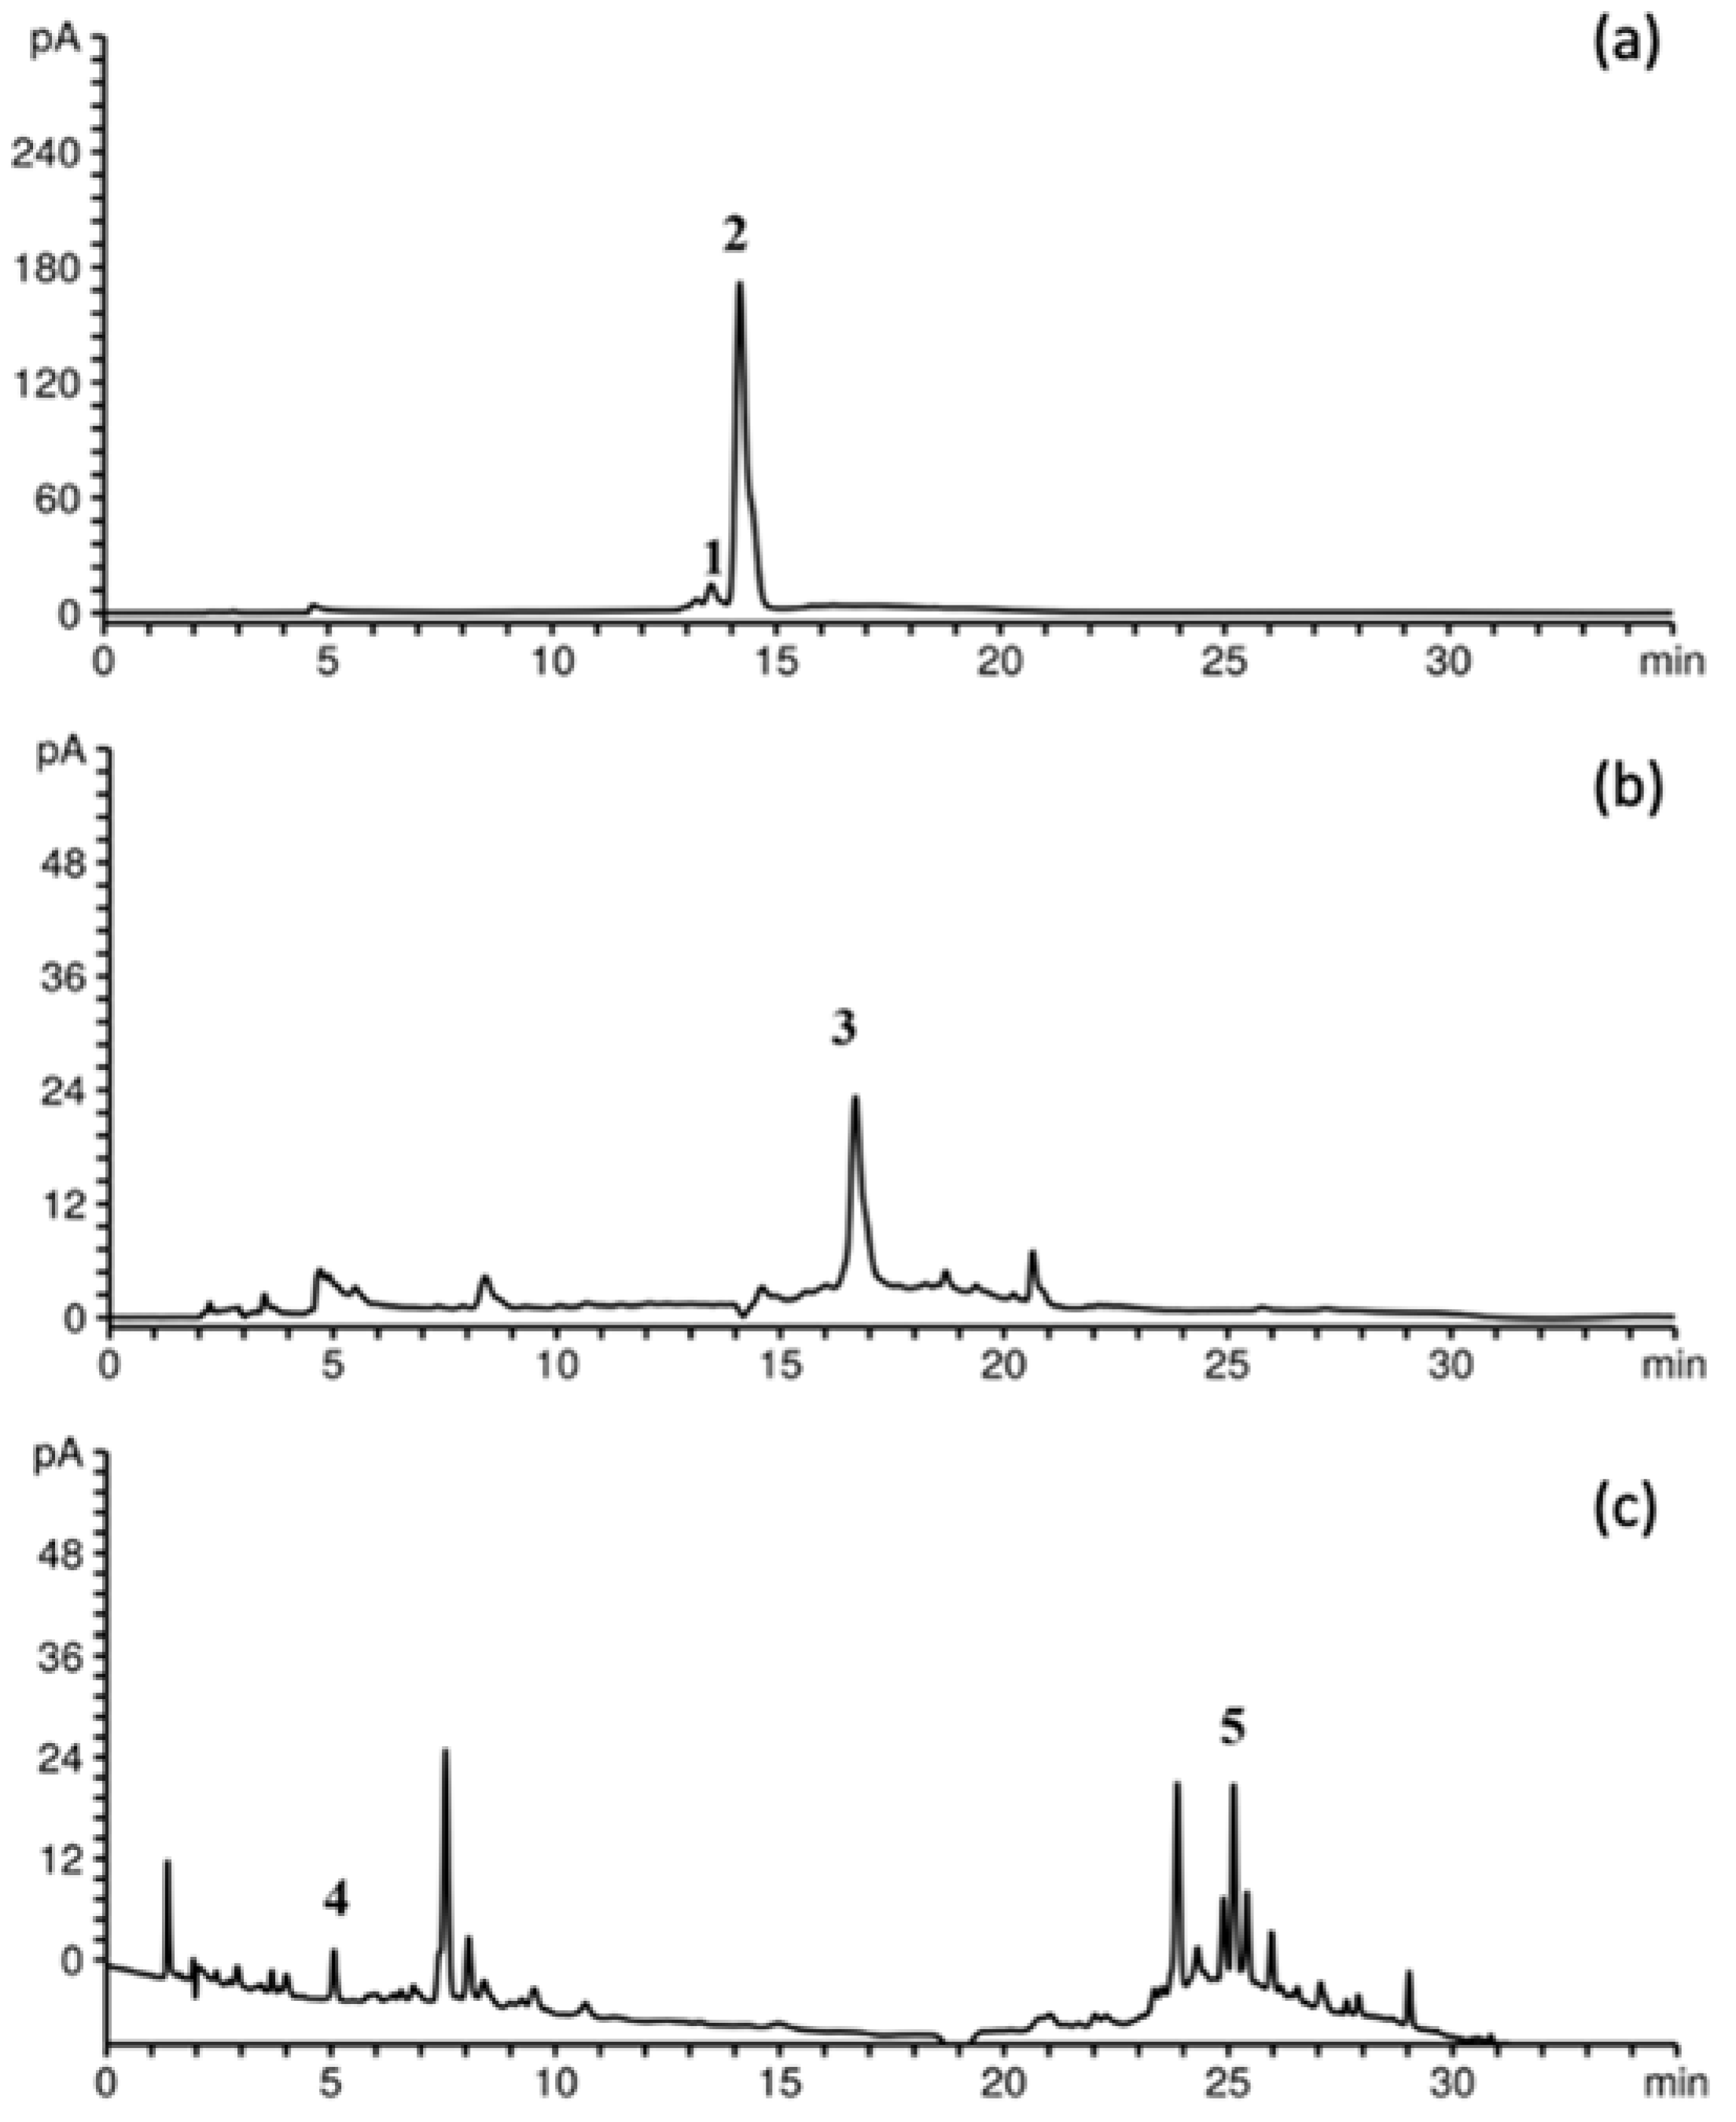
3.2.1. Encapsulation Yield and HPLC Analysis of BRP Powder
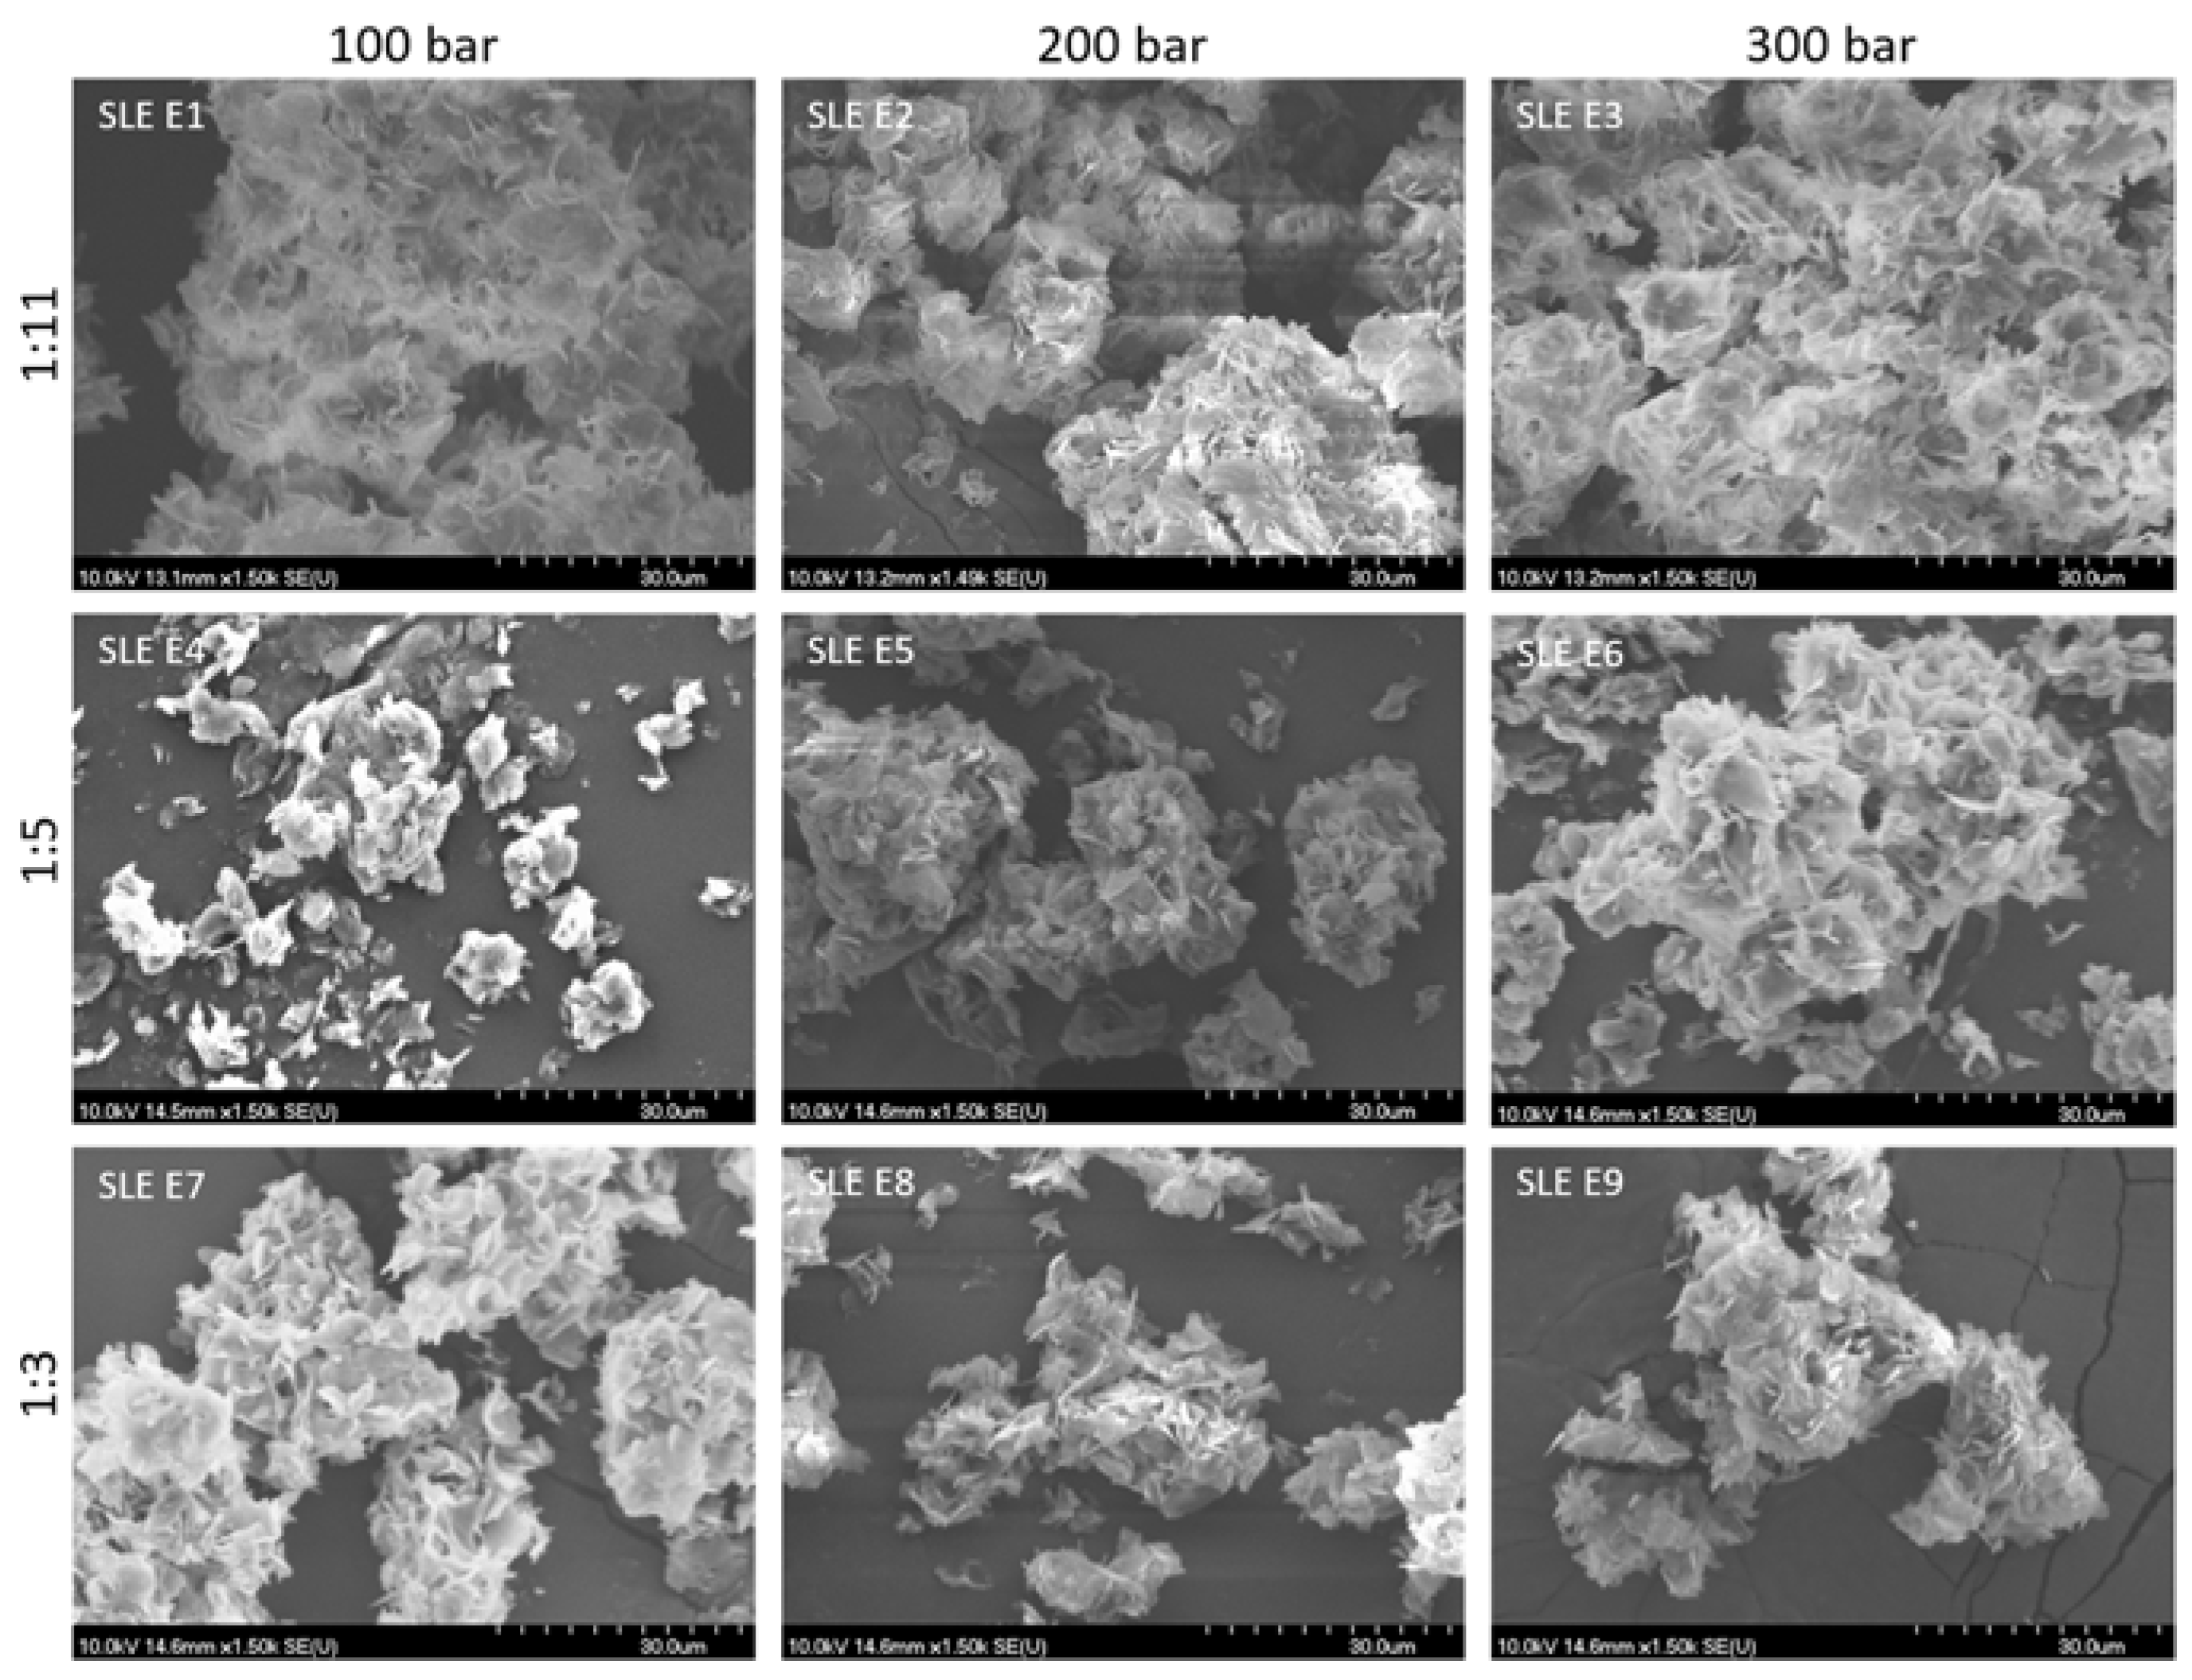
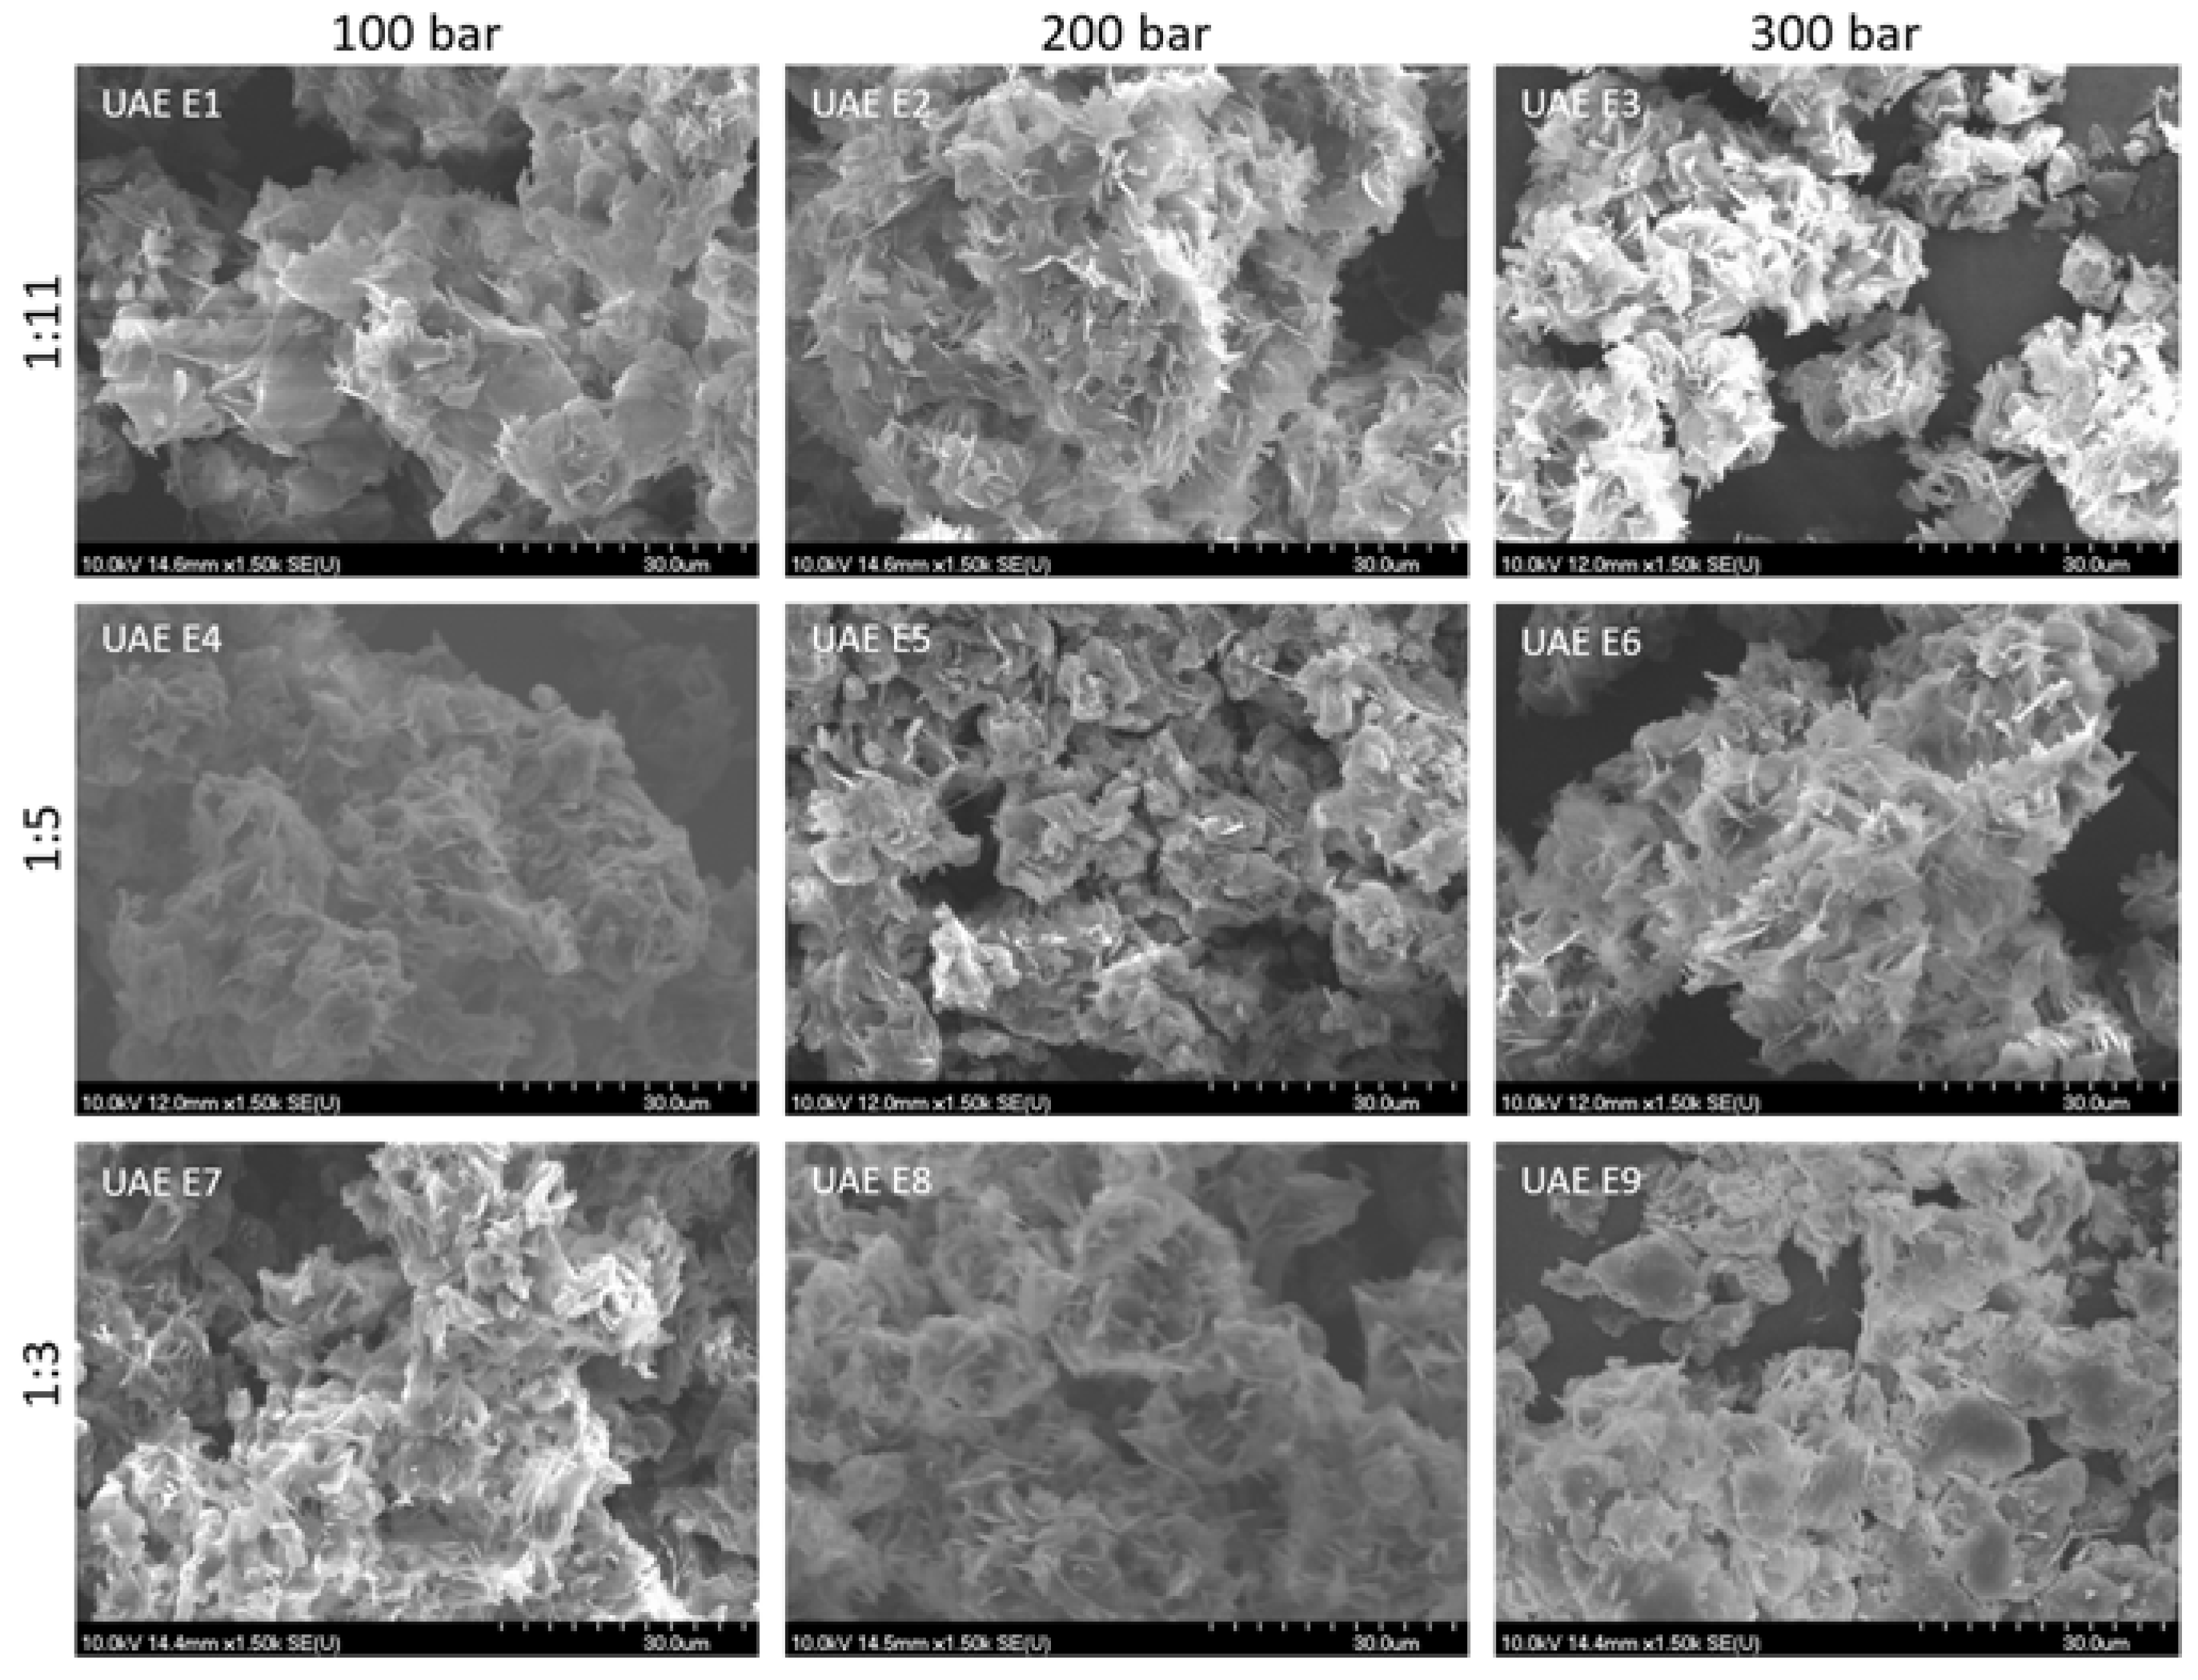
3.2.2. Particles Size, Bulk and Tapped Density, and Morphology of BRP Powder
4. Conclusions
Supplementary Materials
Author Contributions
Funding
Data Availability Statement
Acknowledgments
Conflicts of Interest
References
- Jokić, S.; Nastić, N.; Vidović, S.; Flanjak, I.; Aladić, K.; Vladić, J. An Approach to Value Cocoa Bean By-Product Based on Subcritical Water Extraction and Spray Drying Using Different Carriers. Sustainability 2020, 12, 2174. [Google Scholar] [CrossRef]
- Rashid, R.; Masoodi, F.A.; Wani, S.M.; Manzoor, S.; Gull, A. Ultrasound assisted extraction of bioactive compounds from pomegranate peel, their nanoencapsulation and application for improvement in shelf life extension of edible oils. Food Chem. 2020, 385, 132608. [Google Scholar] [CrossRef] [PubMed]
- Tubiello, F.N.; Rosenzweig, C.; Conchedda, G.; Karl, K.; Gütschow, J.; Xueyao, P.; Obli-Laryea, G.; Wanner, N.; Qiu, S.Y.; Barros, J.D.; et al. Greenhouse gas emissions from food systems: Building the evidence base. Enviro. Res. Lett. 2021, 16, 065007. [Google Scholar] [CrossRef]
- Yao, J.; Chen, J.; Yang, J.; Hao, Y.; Fan, Y.; Wang, C.; Li, N. Free, soluble-bound and insoluble-bound phenolics and their bioactivity in raspberry pomace. LWT 2021, 135, 109995. [Google Scholar] [CrossRef]
- Li, M.; Liu, Y.; Yang, G.; Sun, L.; Song, X.; Chen, Q.; Bao, Y.; Luo, T.; Wang, J. Microstructure, physicochemical properties, and adsorption capacity of deoiled red raspberry pomace and its total dietary fiber. LWT 2022, 153, 112478. [Google Scholar] [CrossRef]
- Četojević-Simin, D.D.; Velićanski, A.S.; Cvetković, D.D.; Markov, S.L.; Ćetković, G.S.; Tumbas Šaponjac, V.T.; Vulić, J.J.; Čanadanović-Brunet, J.M.; Djilas, S.M. Bioactivity of Meeker and Willamette raspberry (Rubus idaeus L.) pomace extracts. Food Chem. 2015, 166, 407–413. [Google Scholar] [CrossRef] [PubMed]
- Mutavski, Z.; Nastić, N.; Živković, J.; Šavikin, K.; Veberič, R.; Medič, A.; Pastor, K.; Jokić, S.; Vidović, S. Black Elderberry Press Cake as a Source of Bioactive Ingredients Using Green-Based Extraction Approaches. Biology 2022, 11, 1465. [Google Scholar] [CrossRef]
- FAOSTAT. 2022. Available online: https://www.fao.org/faostat/en/#data/QCL/visualize (accessed on 8 August 2023).
- Melgosa, R.; Sanz, M.T.; Beltrán, S. Supercritical CO2 processing of omega-3 polyunsaturated fatty acids–Towards a biorefinery for fish waste valorization. J. Supercrit. Fluids 2021, 169, 105121. [Google Scholar] [CrossRef]
- Li, J.; Pettinato, M.; Casazza, A.A.; Perego, P. A comprehensive optimization of ultrasound-assisted extraction for lycopene recovery from tomato waste and encapsulation by spray drying. Processes 2022, 10, 308. [Google Scholar] [CrossRef]
- Klettenhammer, S.; Ferrentino, G.; Zendehbad, H.S.; Morozova, K.; Scampicchio, M. Microencapsulation of linseed oil enriched with carrot pomace extracts using Particles from Gas Saturated Solutions (PGSS) process. J. Food Eng. 2022, 312, 110746. [Google Scholar] [CrossRef]
- Bamba, B.S.B.; Shi, J.; Tranchant, C.C.; Xue, S.J.; Forney, C.F.; Lim, L.T. Influence of extraction conditions on ultrasound-assisted recovery of bioactive phenolics from blueberry pomace and their antioxidant activity. Molecules 2018, 23, 1685. [Google Scholar] [CrossRef] [PubMed]
- Kobus, Z.; Krzywicka, M.; Pecyna, A.; Buczaj, A. Process efficiency and energy consumption during the ultrasound-assisted extraction of bioactive substances from hawthorn berries. Energies 2021, 14, 7638. [Google Scholar] [CrossRef]
- Krivošija, S.; Jerković, I.; Nastić, N.; Zloh, M.; Jokić, S.; Banožić, M.; Aladić, K.; Vidović, S. Green pathway for utilisation of orange peel dust and in silico evaluation of pharmacological potential. Microchem. J. 2023, 193, 109132. [Google Scholar] [CrossRef]
- Singleton, V.L.; Rossi, J.A. Colorimetry of total phenolics with phosphomolybdic-phosphotungstic acid reagents. Am. J. Enol. Vitic. 1965, 16, 144–158. [Google Scholar] [CrossRef]
- Carr, R.L. Evaluating flow properties of solids. Chem. Eng. 1965, 72, 163–168. [Google Scholar]
- Živković, J.; Vladić, J.; Naffati, A.; Nastić, N.; Šavikin, K.; Tomić, M.; Vidović, S. Comparative Chemical Profiling of Underexploited Arctostaphylos uva-ursi L. Herbal Dust Extracts Obtained by Conventional, Ultrasound-Assisted and Subcritical Water Extractions. Waste Biomass Valori. 2022, 13, 4147–4155. [Google Scholar] [CrossRef]
- Kumar, K.; Srivastav, S.; Sharanagat, V.S. Ultrasound assisted extraction (UAE) of bioactive compounds from fruit and vegetable processing by-products: A review. Ultrason. Sonochem. 2021, 70, 105325. [Google Scholar] [CrossRef]
- Oliveira, A.M.B.; Viganó, J.; Sanches, V.L.; Rostagno, M.A.; Martínez, J. Extraction of potential bioactive compounds from industrial Tahiti lime (Citrus latifólia Tan.) by-product using pressurized liquids and ultrasound-assisted extraction. Food Res. Int. 2022, 157, 111381. [Google Scholar] [CrossRef]
- Rocha, R.; Pinela, J.; Abreu, R.M.V.; Añibarro-Ortega, M.; Pires, T.C.S.P.; Saldanha, A.L.; Alves, M.J.; Nogueira, A.; Ferreira, I.C.F.R.; Barros, L. Extraction of Anthocyanins from Red Raspberry for Natural Food Colorants Development: Processes Optimization and In Vitro Bioactivity. Processes 2020, 8, 1447. [Google Scholar] [CrossRef]
- Boateng, I.D.; Kumar, R.; Daubert, C.R.; Flint-Garcia, S.; Mustapha, A.; Kuehnel, L.; Agliata, J.; Li, Q.; Wan, C.; Somavat, P. Sonoprocessing improves phenolics profile, antioxidant capacity, structure, and product qualities of purple corn pericarp extract. Ultrason. Sonochem. 2023, 95, 106418. [Google Scholar] [CrossRef]
- Kryževičiūtė, N.; Kraujalis, P.; Venskutonis, P.R. Optimization of high pressure extraction processes for the separation of raspberry pomace into lipophilic and hydrophilic fractions. J. Supercrit. Fluids 2016, 108, 61–68. [Google Scholar] [CrossRef]
- Krivokapić, S.; Vlaović, M.; Damjanović Vratnica, B.; Perović, A.; Perović, S. Biowaste as a Potential Source of Bioactive Compounds—A Case Study of Raspberry Fruit Pomace. Foods 2021, 10, 706. [Google Scholar] [CrossRef]
- Saad, N.; Louvet, F.; Tarrade, S.; Meudec, E.; Grenier, K.; Landolt, C.; Ouk, T.S.; Bressollier, P. Enzyme-Assisted Extraction of Bioactive Compounds from Raspberry (Rubus idaeus L.) Pomace. J. Food Sci. 2019, 84, 1371–1381. [Google Scholar] [CrossRef] [PubMed]
- Park, S.J.; Hyun, S.-H.; Suh, H.W.; Lee, S.-Y.; Min, T.-S.; Auh, J.-H.; Lee, H.-J.; Kim, J.-H.; Cho, S.-M.; Choi, H.-K. Differentiation of black raspberry fruits according to species and geographic origins by genomic analysis and 1H-NMR-based metabolic profiling. J. Korean Soc. Appl. Biol. Chem. 2012, 55, 633–642. [Google Scholar] [CrossRef]
- Mazur, S.P.; Sønsteby, A.; Nes, A.; Wold, A.B.; Foito, A.; Freitag, S.; Verrall, S.; Stewart, D.; Heide, O.M. Effects of post-flowering environmental variation along an altitudinal gradient on chemical composition of ‘Glen Ample’red raspberry (Rubus idaeus L.). Eur. J. Hortic. Sci. 2014, 79, 267–277. [Google Scholar]
- Gil, A.S.R. Potential influence of blueberry and black raspberry pomace phenolics on inflammatory cytokines in coronary cells. Doctoral Thesis, Louisiana State University and Agricultural & Mechanical College, Baton Rouge, LA, USA, 2013. [Google Scholar]
- Shin, D.; Chae, K.S.; Choi, H.R.; Lee, S.J.; Gim, S.W.; Kwon, G.T.; Lee, H.T.; Song, Y.C.; Kim, K.J.; Kong, H.S.; et al. Bioactive and pharmacokinetic characteristics of pre-matured black raspberry Rubus occidentalis. Ital. J. Food Sci. 2018, 30, 428–439. [Google Scholar] [CrossRef]
- Su, J.; Jin, L.; Yang, R.; Liang, Y.; Nile, S.H.; Kai, G. Comparative studies on selection of high polyphenolic containing Chinese raspberry for evaluation of antioxidant and cytotoxic potentials. J. Agric Food Res. 2023, 12, 100603. [Google Scholar] [CrossRef]
- Szymanowska, U.; Baraniak, B. Antioxidant and Potentially Anti-Inflammatory Activity of Anthocyanin Fractions from Pomace Obtained from Enzymatically Treated Raspberries. Antioxidants 2019, 8, 299. [Google Scholar] [CrossRef]
- Oroian, M.; Ursachi, F.; Dranca, F. Influence of ultrasonic amplitude, temperature, time and solvent concentration on bioactive compounds extraction from propolis. Ultrason. Sonochem. 2020, 64, 105021. [Google Scholar] [CrossRef]
- Xue, H.; Tan, J.; Li, Q.; Tang, J.; Cai, X. Ultrasound-Assisted Enzymatic Extraction of Anthocyanins from Raspberry Wine Residues: Process Optimization, Isolation, Purification, and Bioactivity Determination. Food Anal. Methods 2021, 14, 1369–1386. [Google Scholar] [CrossRef]
- Yousefi, S.; Emam-Djomeh, Z.; Mousavi, M.; Kobarfard, F.; Zbicinski, I. Developing spray-dried powders containing anthocyanins of black raspberry juice encapsulated based on fenugreek gum. Adv. Powder Technol. 2015, 26, 462–469. [Google Scholar] [CrossRef]
- Farías-Cervantes, V.S.; Salinas-Moreno, Y.; Chávez-Rodríguez, A.; Luna-Solano, G.; Medrano-Roldan, H.; Andrade-González, I. Stickiness and agglomeration of blackberry and raspberry spray dried juices using agave fructans and maltodextrin as carrier agents. Czech J. Food Sci. 2020, 38, 229–236. [Google Scholar] [CrossRef]
- Syamaladevi, R.M.; Insan, S.K.; Dhawan, S.; Andrews, P.; Sablani, S.S. Physicochemical Properties of Encapsulated Red Raspberry (Rubus idaeus) Powder: Influence of High-Pressure Homogenization. Dry. Technol. 2012, 30, 484–493. [Google Scholar] [CrossRef]
- Banožić, M.; Čolnik, M.; Škerget, M.; Cikoš, A.-M.; Aladić, K.; Jokić, S. Formation and Characterization of Fucus virsoides J. Agardh Pigment–Polyethylene Glycol Microparticles Produced Using PGSS Process. Appl. Sci. 2022, 12, 11496. [Google Scholar] [CrossRef]
- Procopio, F.R.; Klettenhammer, S.; Ferrentino, G.; Scampicchio, M.; Do Amaral Sobral, P.J.; Hubinger, M.D. Comparative Study of Cinnamon and Paprika Oleoresins Encapsulated by Spray Chilling and Particles from Gas Saturated Solutions Techniques: Evaluation of Physical Characteristics and Oleoresins Release in Food Simulated Media. Food Bioprocess Technol. 2023, 16, 2147–2158. [Google Scholar] [CrossRef]
- Ndayishimiye, J.; Ferrentino, G.; Nabil, H.; Scampicchio, M. Encapsulation of Oils Recovered from brewer’s Spent Grain by Particles from Gas Saturated Solutions Technique. Food Bioprocess Technol. 2020, 13, 256–264. [Google Scholar] [CrossRef]
- Chen, P.-N.; Chu, S.-C.; Chiou, H.-L.; Kuo, W.-H.; Chiang, C.-L.; Hsieh, Y.-S. Mulberry anthocyanins, cyanidin 3-rutinoside and cyanidin 3-glucoside, exhibited an inhibitory effect on the migration and invasion of a human lung cancer cell line. Cancer Lett. 2006, 235, 248–259. [Google Scholar] [CrossRef]
- Mulabagal, V.; Lang, G.A.; DeWitt, D.L.; Dalavoy, S.S.; Nair, M.G. Anthocyanin Content, Lipid Peroxidation and Cyclooxygenase Enzyme Inhibitory Activities of Sweet and Sour Cherries. J. Agric. Food Chem. 2009, 57, 1239–1246. [Google Scholar] [CrossRef] [PubMed]


| Sample Code | Extraction Conditions | EY (%) * | TPC (mg GAE/g DW) * |
|---|---|---|---|
| SLE1 | 30% EtOH | 16.46 ± 0.97 a | 37.97 ± 3.28 a |
| SLE2 | 50% EtOH | 15.66 ± 0.68 a | 34.35 ± 0.78 b |
| SLE3 | 70% EtOH | 15.37 ± 0.81 a | 31.51 ± 0.90 b |
| UAE1 | A 20%, 2 min, 34.5 °C | 10.77 ± 0.53d | 24.22 ± 1.01 h |
| UAE2 | A 20%, 4 min, 37.5 °C | 14.68 ± 0.22 abc | 27.44 ± 0.34 g |
| UAE3 | A 20%, 6 min, 39 °C | 13.58 ± 0.62 c | 23.29 ± 0.56 h |
| UAE4 | A 20%, 8 min, 42.5 °C | 13.85 ± 0.33 bc | 31.04 ± 1.36 ef |
| UAE5 | A 20%, 10 min, 45.5 °C | 15.42 ± 0.81 ab | 39.54 ± 1.20 c |
| UAE6 | A 60%, 2 min, 43.5 °C | 14.64 ± 1.08 abc | 29.51 ± 0.53 fg |
| UAE7 | A 60%, 4 min, 51.5 °C | 13.48 ± 0.76 c | 32.65 ± 0.75 de |
| UAE8 | A 60%, 6 min, 62.5 °C | 15.25 ± 0.03 abc | 34.34 ± 0.28 d |
| UAE9 | A 60%, 8 min, 65 °C | 15.22 ± 0.68 abc | 40.25 ± 0.51 c |
| UAE10 | A 60%, 10 min, 70 °C | 16.03 ± 0.49 a | 42.42 ± 0.55 b |
| UAE11 | A 100%, 2 min, 52 °C | 13.96 ± 0.20 bc | 32.31 ± 0.62 de |
| UAE12 | A 100%, 4 min, 67.5 °C | 15.77 ± 0.73 a | 44.74 ± 0.11 a |
| UAE13 | A 100%, 6 min, 80 °C | 16.09 ± 0.57 a | 41.64 ± 0.52 bc |
| Samples | Mean ± SD (mg/g DW; n = 3) * | ||||
|---|---|---|---|---|---|
| C3Rut | C3Glu | RUT | GA | EA | |
| SLE1 | 4.4443 ± 0.1686 i | 1.0768 ± 0.0226 i | 0.9497 ± 0.0045 c | 0.1835 ± 0.0042 a | 0.7653 ± 0.0180 a |
| UAE1 | 12.3115 ± 0.0635 gh | 3.6032 ± 0.1148 fgh | 0.6711 ± 0.0260 e | 0.1257 ± 0.0039 b | 0.3083 ± 0.0051 h |
| UAE2 | 11.9834 ± 0.4970 h | 3.3658 ± 0.0681 h | 0.6886 ± 0.0091 e | 0.0406 ± 0.0010 c | 0.3276 ± 0.0022 h |
| UAE3 | 12.4663 ± 0.3485 gh | 3.4983 ± 0.0771 gh | 0.7018 ± 0.0113 e | 0.0365 ± 0.0010 d | 0.4046 ± 0.0072 g |
| UAE4 | 13.1566 ± 0.2001 gh | 3.7791 ± 0.0661 efg | 0.8572 ± 0.0286 d | 0.0236 ± 0.0005 f | 0.4917 ± 0.0187 de |
| UAE5 | 16.2183 ± 0.1689 bc | 4.6325 ± 0.1299 ab | 0.9707 ± 0.0203 c | 0.0298 ± 0.0005 e | 0.4559 ± 0.0039 ef |
| UAE6 | 14.5262 ± 0.0143 ef | 3.7119 ± 0.0373 efg | 0.9345 ± 0.0334 cd | 0.0271 ± 0.0011 ef | 0.4244 ± 0.0195 fg |
| UAE7 | 16.9502 ± 0.1629 ab | 4.6577 ± 0.1247 ab | 1.1320 ± 0.0273 b | 0.0122 ± 0.0003 h | 0.4914 ± 0.0174 de |
| UAE8 | 14.7056 ± 0.3143 de | 4.0405 ± 0.1633 de | 1.0933 ± 0.0523 b | 0.0168 ± 0.0001 g | 0.5131 ± 0.0060 d |
| UAE9 | 13.4015 ± 0.2345 fg | 3.2963 ± 0.0273 h | 1.4945 ± 0.0322 a | 0.0237 ± 0.0003 f | 0.5589 ± 0.0272 c |
| UAE10 | 17.5031 ± 0.5750 a | 4.8878 ± 0.1772 a | 1.5102 ± 0.0582 a | 0.0309 ± 0.0012 e | 0.5931 ± 0.0050 bc |
| UAE11 | 15.8023 ± 0.7863 bcd | 4.3972 ± 0.0034 bc | 0.6711 ± 0.0085 e | 0.0182 ± 0.0005 g | 0.4706 ± 0.0001 de |
| UAE12 | 16.7786 ± 0.5246 ab | 4.1594 ± 0.1770 cd | 0.6886 ± 0.0285 e | 0.0185 ± 0.0008 g | 0.5854 ± 0.0195 bc |
| UAE13 | 15.0331 ± 0.7402 cde | 3.8538 ± 0.1177 def | 0.7018 ± 0.0168 e | 0.0369 ± 0.0007 cd | 0.6206 ± 0.0270 b |
| Sample | Encapsulation Conditions (Pressure, Mass Ratio of BRP Extract to Carrier) | EnY (%) | Mean ± SD (mg/g Powder; n = 3) * | ||||
|---|---|---|---|---|---|---|---|
| C3Rut | C3Glu | RUT | GA | EA | |||
| SLE E1 | 100 bar, 1:11 | 39.49 ± 2.89 ef | 3.7115 ± 0.1361 hi | 0.1474 ± 0.0073 ijk | 0.4784 ± 0.0175 f | n.d. | 0.0783 ± 0.0037 ef |
| SLE E2 | 150 bar, 1:11 | 73.49 ± 5.81 a | 2.7786 ± 0.1027 j | 0.1128 ± 0.0006 m | 0.3559 ± 0.0036 h | n.d. | 0.0326 ± 0.0006 i |
| SLE E3 | 200 bar, 1:11 | 60.07 ± 4.60 abc | 3.5096 ± 0.0886 i | 0.1352 ± 0.0006 jkl | 0.3876 ± 0.0188 gh | n.d. | 0.0526 ± 0.0025 gh |
| SLE E4 | 100 bar, 1:5 | 51.03 ± 3.84 b–e | 6.1310 ± 0.3031 e | 0.2403 ± 0.0000 f | 0.4811 ± 0.0205 f | n.d. | 0.0708 ± 0.0016 f |
| SLE E5 | 150 bar, 1:5 | 58.19 ± 8.55 a–d | 10.5370 ± 0.1600 b | 0.5203 ± 0.0070 d | 0.6629 ± 0.0158 d | n.d. | 0.0663 ± 0.0012 fg |
| SLE E6 | 200 bar, 1:5 | 66.72 ± 7.56 ab | 9.1159 ± 0.2094 d | 0.8530 ± 0.0044 a | 0.5827 ± 0.0130 e | n.d. | 0.0624 ± 0.0007 fg |
| SLE E7 | 100 bar, 1:3 | 27.11 ± 4.00 f | 11.7135 ± 0.5560 a | 0.6612 ± 0.0133 b | 0.8397 ± 0.0277 bc | n.d. | 0.1577 ± 0.0058 d |
| SLE E8 | 150 bar, 1:3 | 41.35 ± 4.17 def | 10.7481 ± 0.2510 b | 0.5447 ± 0.0122 c | 0.8847 ± 0.0015 ab | n.d. | 0.3226 ± 0.0134 a |
| SLE E9 | 200 bar, 1:3 | 49.23 ± 7.06 cde | 9.9409 ± 0.0502 c | 0.4257 ± 0.0033 e | 0.8068 ± 0.0354 c | n.d. | 0.1794 ± 0.0084 c |
| UAE E1 | 100 bar, 1:11 | 49.16 ± 2.57 cde | 1.2185 ± 0.0185 k | 0.1318 ± 0.0064 klm | 0.2931 ± 0.0085 i | n.d. | / |
| UAE E2 | 150 bar, 1:11 | 66.49 ± 8.17 ab | 2.2137 ± 0.0100 j | 0.1217 ± 0.0040l m | 0.2949 ± 0.0003 i | n.d. | 0.0420 ± 0.0013 hi |
| UAE E3 | 200 bar, 1:11 | 66.76 ± 3.56 ab | 0.6274 ± 0.0022 l | 0.0379 ± 0.0002 n | 0.0815 ± 0.0001 j | n.d. | 0.0391 ± 0.0005 hi |
| UAE E4 | 100 bar, 1:5 | 64.47 ± 7.70 abc | 4.2728 ± 0.1986 gh | 0.1566 ± 0.0045 hi | 0.5820 ± 0.0220 e | 0.0120 ± 0.0005d | 0.0403 ± 0.0013 hi |
| UAE E5 | 150 bar, 1:5 | 63.16 ± 4.49 abc | 4.2487 ± 0.0955 gh | 0.1717 ± 0.0081 h | 0.4200 ± 0.0057 g | 0.0300 ± 0.0014c | 0.1430 ± 0.0040 d |
| UAE E6 | 200 bar, 1:5 | 56.03 ± 4.28 b–e | 4.3270 ± 0.1812 g | 0.1677 ± 0.0046 h | 0.8801 ± 0.0287 ab | 0.0620 ± 0.0028b | 0.0935 ± 0.0030 e |
| UAE E7 | 100 bar, 1:3 | 29.57 ± 4.39 f | 4.3873 ± 0.0201 g | 0.1536 ± 0.0032 hij | 0.6539 ± 0.0147 d | 0.0580 ± 0.0020b | 0.2949 ± 0.0120 b |
| UAE E8 | 150 bar, 1:3 | 52.98 ± 3.43 b–e | 5.0181 ± 0.0779 f | 0.1940 ± 0.0023 g | 0.9116 ± 0.0132 a | 0.0950 ± 0.0038a | 0.2980 ± 0.0118 b |
| UAE E9 | 200 bar, 1:3 | 52.19 ± 7.35 b–e | 4.4735 ± 0.0256 fg | 0.5119 ± 0.0111 d | 0.5871 ± 0.0235 e | n.d. | 0.0747 ± 0.0032 f |
| Sample | Particle Size (µm) | Bulk Density (g/mL) | Tapped Density (g/mL) | Carr Index (%) | Hausner Ratio | Flow Character |
|---|---|---|---|---|---|---|
| SLE E1 | 5.83 ± 0.99 | 0.180 | 0.240 | 25 | 1.33 | Acceptable |
| SLE E2 | 5.82 ± 3.04 | 0.063 | 0.090 | 30 | 1.43 | Poor |
| SLE E3 | 6.02 ± 1.09 | 0.058 | 0.074 | 22 | 1.28 | Acceptable |
| SLE E4 | 6.23 ± 1.12 | 0.102 | 0.130 | 22 | 1.27 | Acceptable |
| SLE E5 | 6.2 ± 1.05 | 0.068 | 0.091 | 25 | 1.34 | Acceptable |
| SLE E6 | 6.26 ± 2.84 | 0.068 | 0.100 | 32 | 1.47 | Poor |
| SLE E7 | 6.06 ± 1.23 | 0.066 | 0.086 | 23 | 1.30 | Acceptable |
| SLE E8 | 4.87 ± 0.62 | 0.206 | 0.302 | 32 | 1.47 | Poor |
| SLE E9 | 5.06 ± 0.69 | 0.200 | 0.277 | 28 | 1.39 | Poor |
| UAE E1 | 5.46 ± 0.84 | 0.188 | 0.284 | 34 | 1.51 | Poor |
| UAE E2 | 5.54 ± 0.95 | 0.200 | 0.270 | 26 | 1.35 | Poor |
| UAE E3 | 5.51 ± 0.85 | 0.208 | 0.288 | 28 | 1.38 | Poor |
| UAE E4 | 4.97 ± 0.68 | 0.052 | 0.078 | 33 | 1.50 | Poor |
| UAE E5 | 4.85 ± 0.59 | 0.072 | 0.090 | 20 | 1.25 | Acceptable |
| UAE E6 | 5.33 ± 0.86 | 0.054 | 0.079 | 32 | 1.46 | Poor |
| UAE E7 | 5.44 ± 0.94 | 0.222 | 0.300 | 26 | 1.35 | Poor |
| UAE E8 | 5.35 ± 0.86 | 0.048 | 0.075 | 36 | 1.56 | Poor |
| UAE E9 | 5.29 ± 0.79 | 0.052 | 0.081 | 36 | 1.56 | Poor |
Disclaimer/Publisher’s Note: The statements, opinions and data contained in all publications are solely those of the individual author(s) and contributor(s) and not of MDPI and/or the editor(s). MDPI and/or the editor(s) disclaim responsibility for any injury to people or property resulting from any ideas, methods, instructions or products referred to in the content. |
© 2023 by the authors. Licensee MDPI, Basel, Switzerland. This article is an open access article distributed under the terms and conditions of the Creative Commons Attribution (CC BY) license (https://creativecommons.org/licenses/by/4.0/).
Share and Cite
Nastić, N.; Mutavski, Z.; Živković, J.; Ambrus, R.; Fernández, N.; Menković, N.; Vidović, S. Green Processing of Black Raspberry Pomace: Application of Sonotrode-Based Extraction Technique and Particles from Gas-Saturated Solutions (PGSS) Technology. Foods 2023, 12, 3867. https://doi.org/10.3390/foods12203867
Nastić N, Mutavski Z, Živković J, Ambrus R, Fernández N, Menković N, Vidović S. Green Processing of Black Raspberry Pomace: Application of Sonotrode-Based Extraction Technique and Particles from Gas-Saturated Solutions (PGSS) Technology. Foods. 2023; 12(20):3867. https://doi.org/10.3390/foods12203867
Chicago/Turabian StyleNastić, Nataša, Zorana Mutavski, Jelena Živković, Rita Ambrus, Naiara Fernández, Nebojša Menković, and Senka Vidović. 2023. "Green Processing of Black Raspberry Pomace: Application of Sonotrode-Based Extraction Technique and Particles from Gas-Saturated Solutions (PGSS) Technology" Foods 12, no. 20: 3867. https://doi.org/10.3390/foods12203867