
Metabolomic Approach to Study the ‘Purple Queen’ Pomegranate Cultivar Response to Alternative Culture Media and Phenological Stages
 ,
,  , , , and
Abstract
:1. Introduction
2. Materials and Methods
2.1. Plant Material and Experimental Design
2.2. Plant Samples and Physicochemical Determinations
2.3. Metabolomic Analysis
2.4. Statistical Analysis and Metabolic Pathway Analyses
3. Results
3.1. Agronomical and Vegetative Characterization
3.2. Leaves Metabolomic Analysis
3.3. Multivariate Statistical Analysis
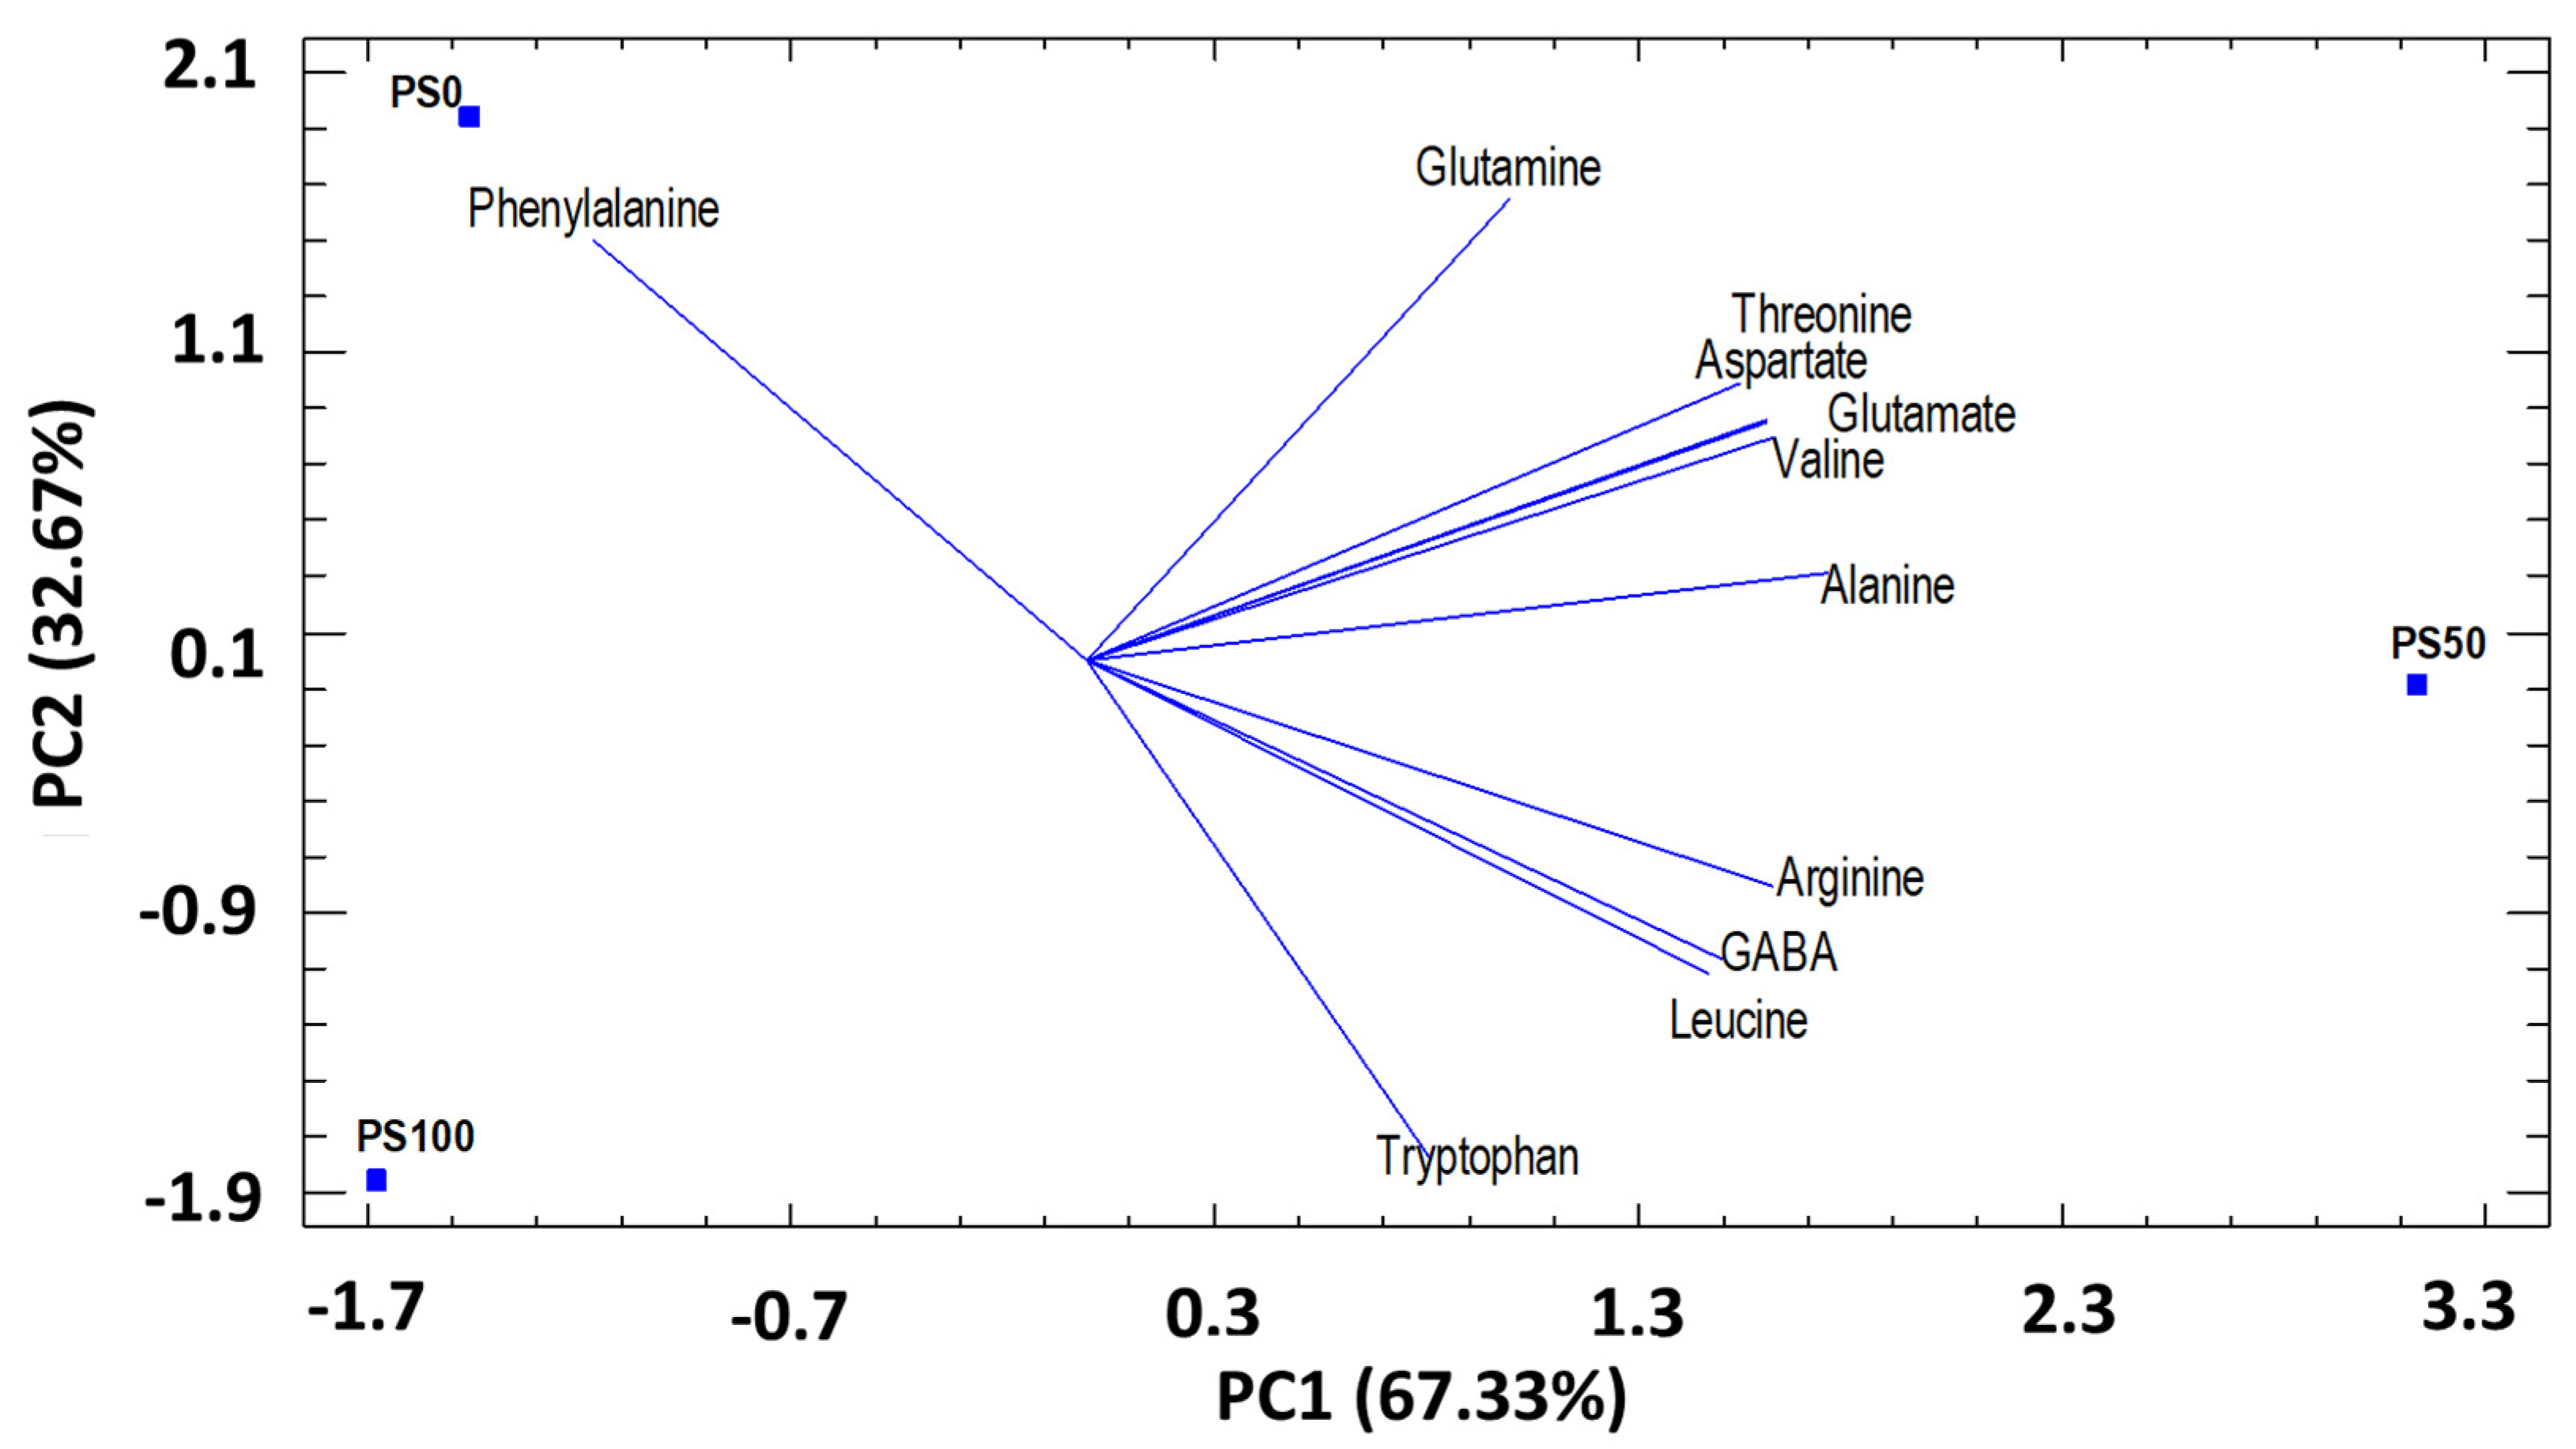
3.3.1. Principal component analysis (PCA) by substrates
Amino Acids (AA)
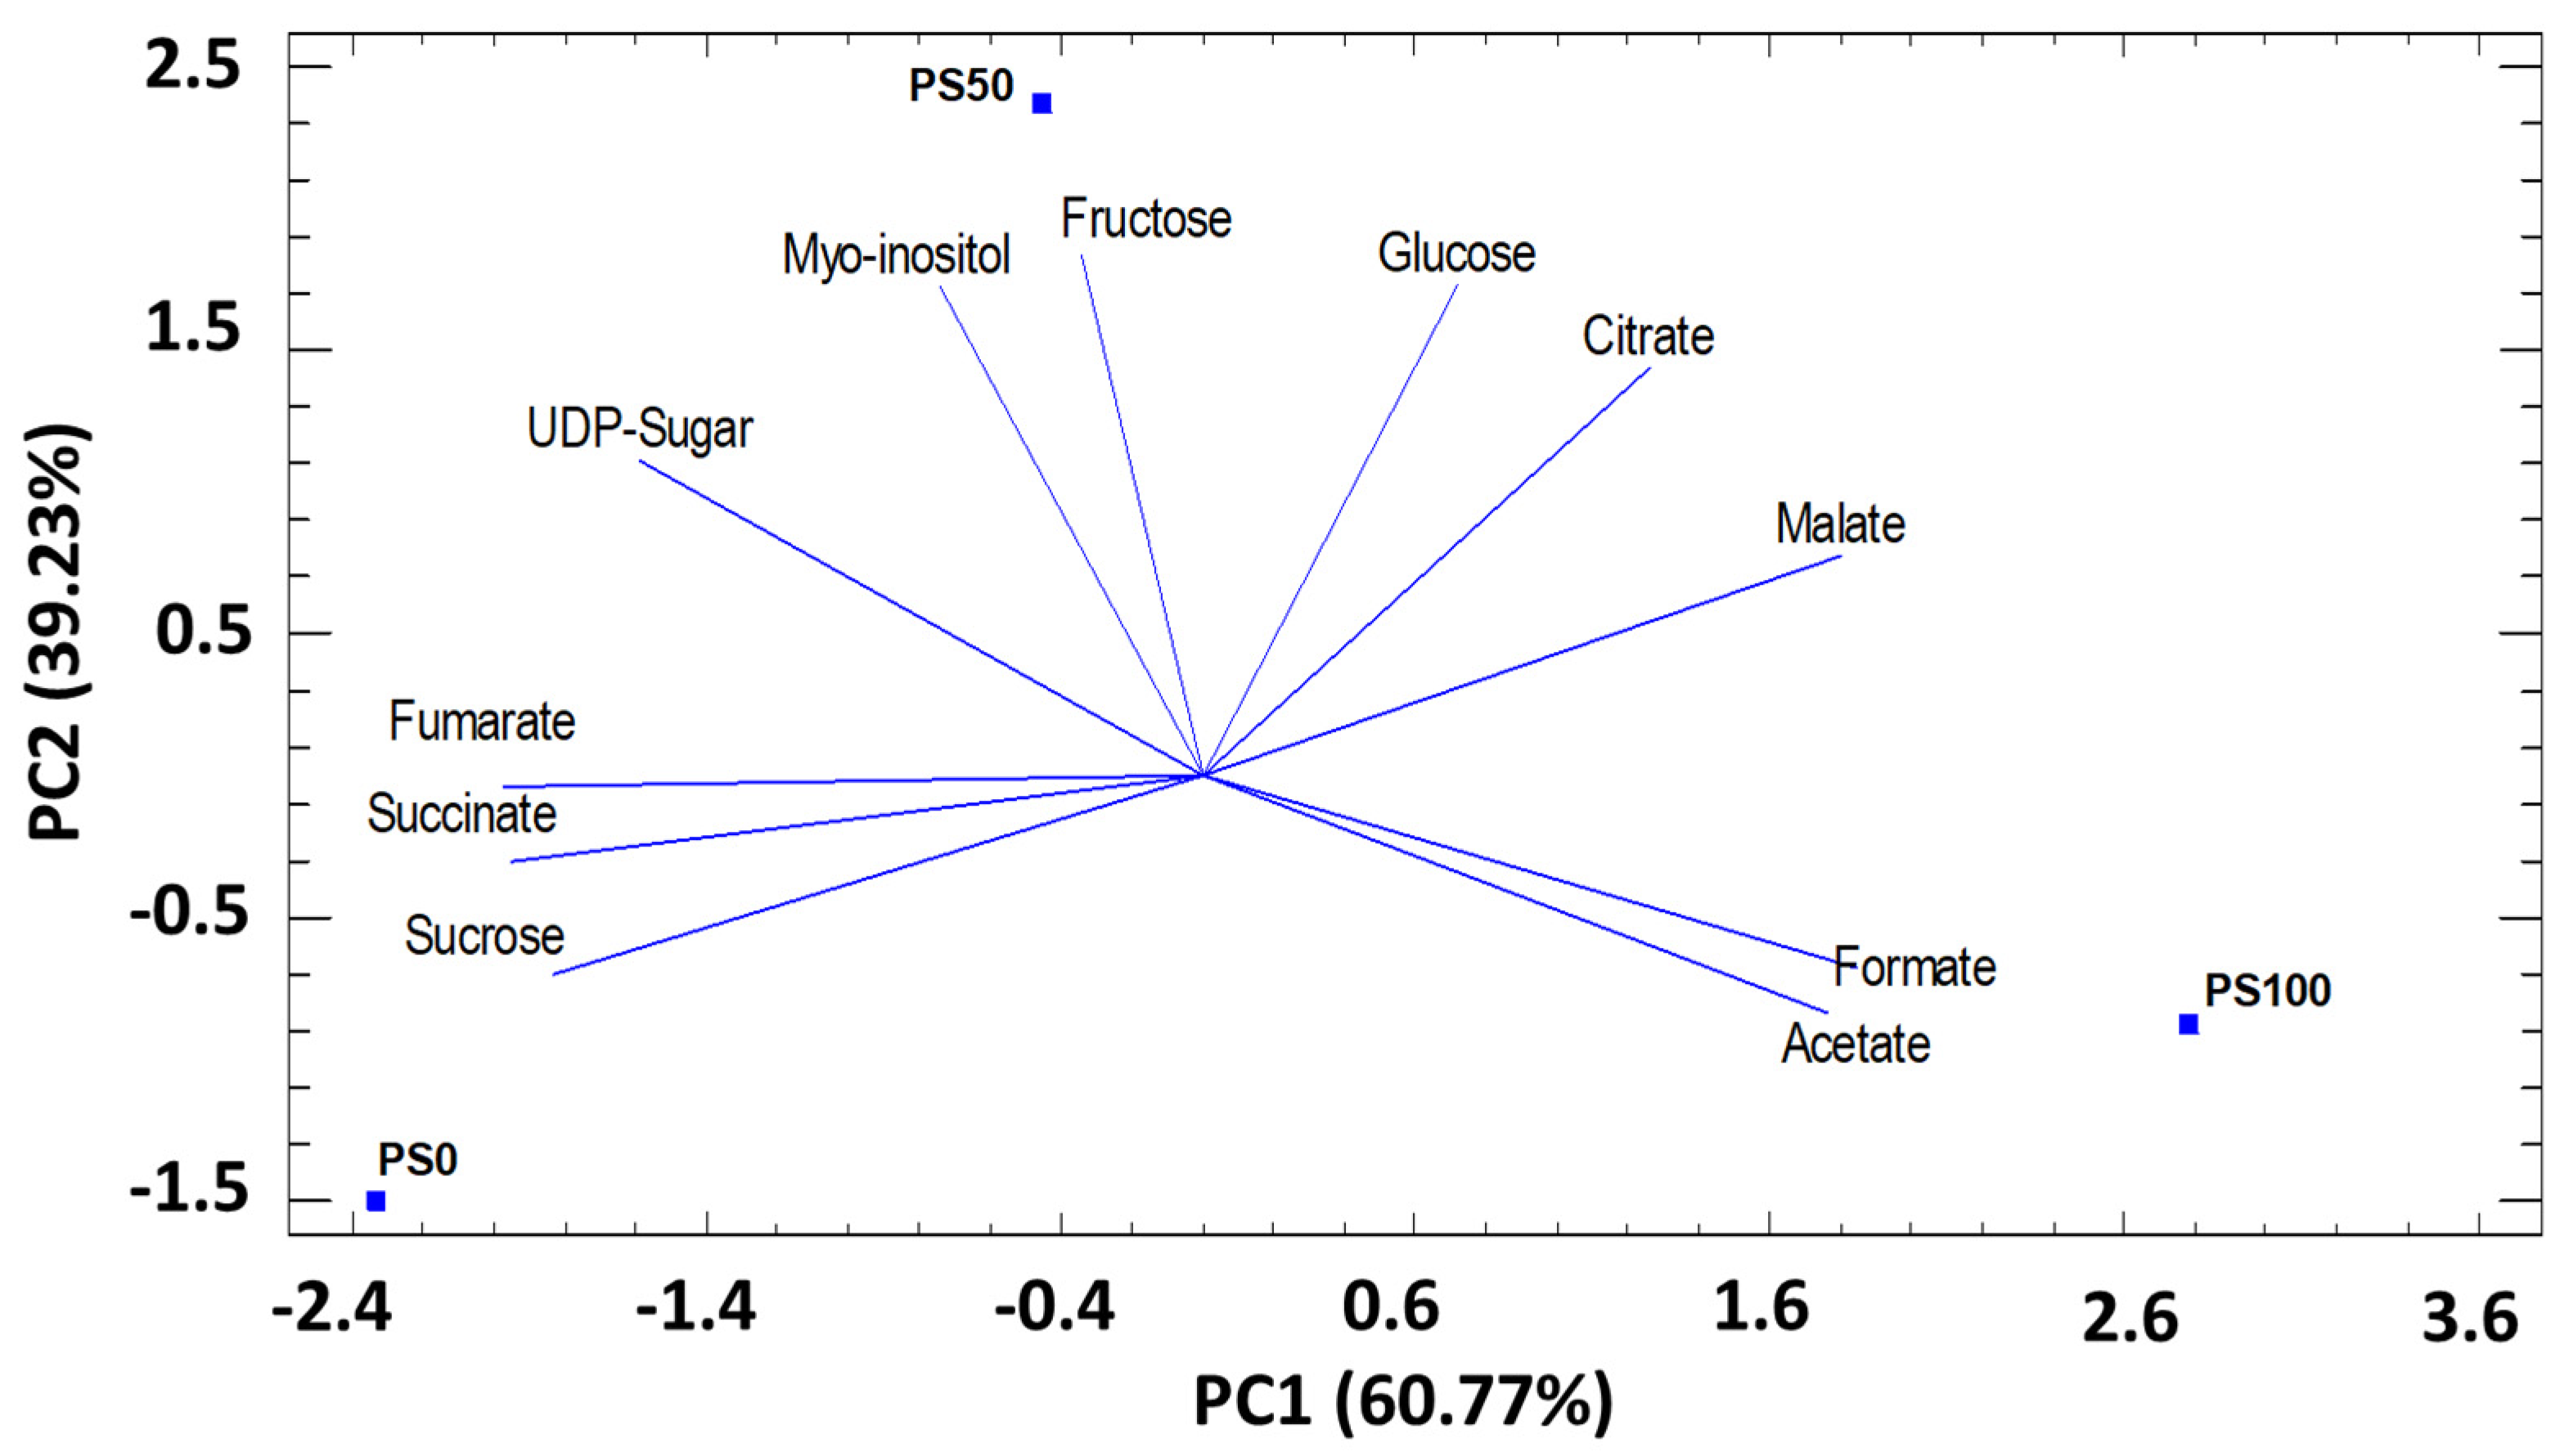
Sugars and Organic Acids
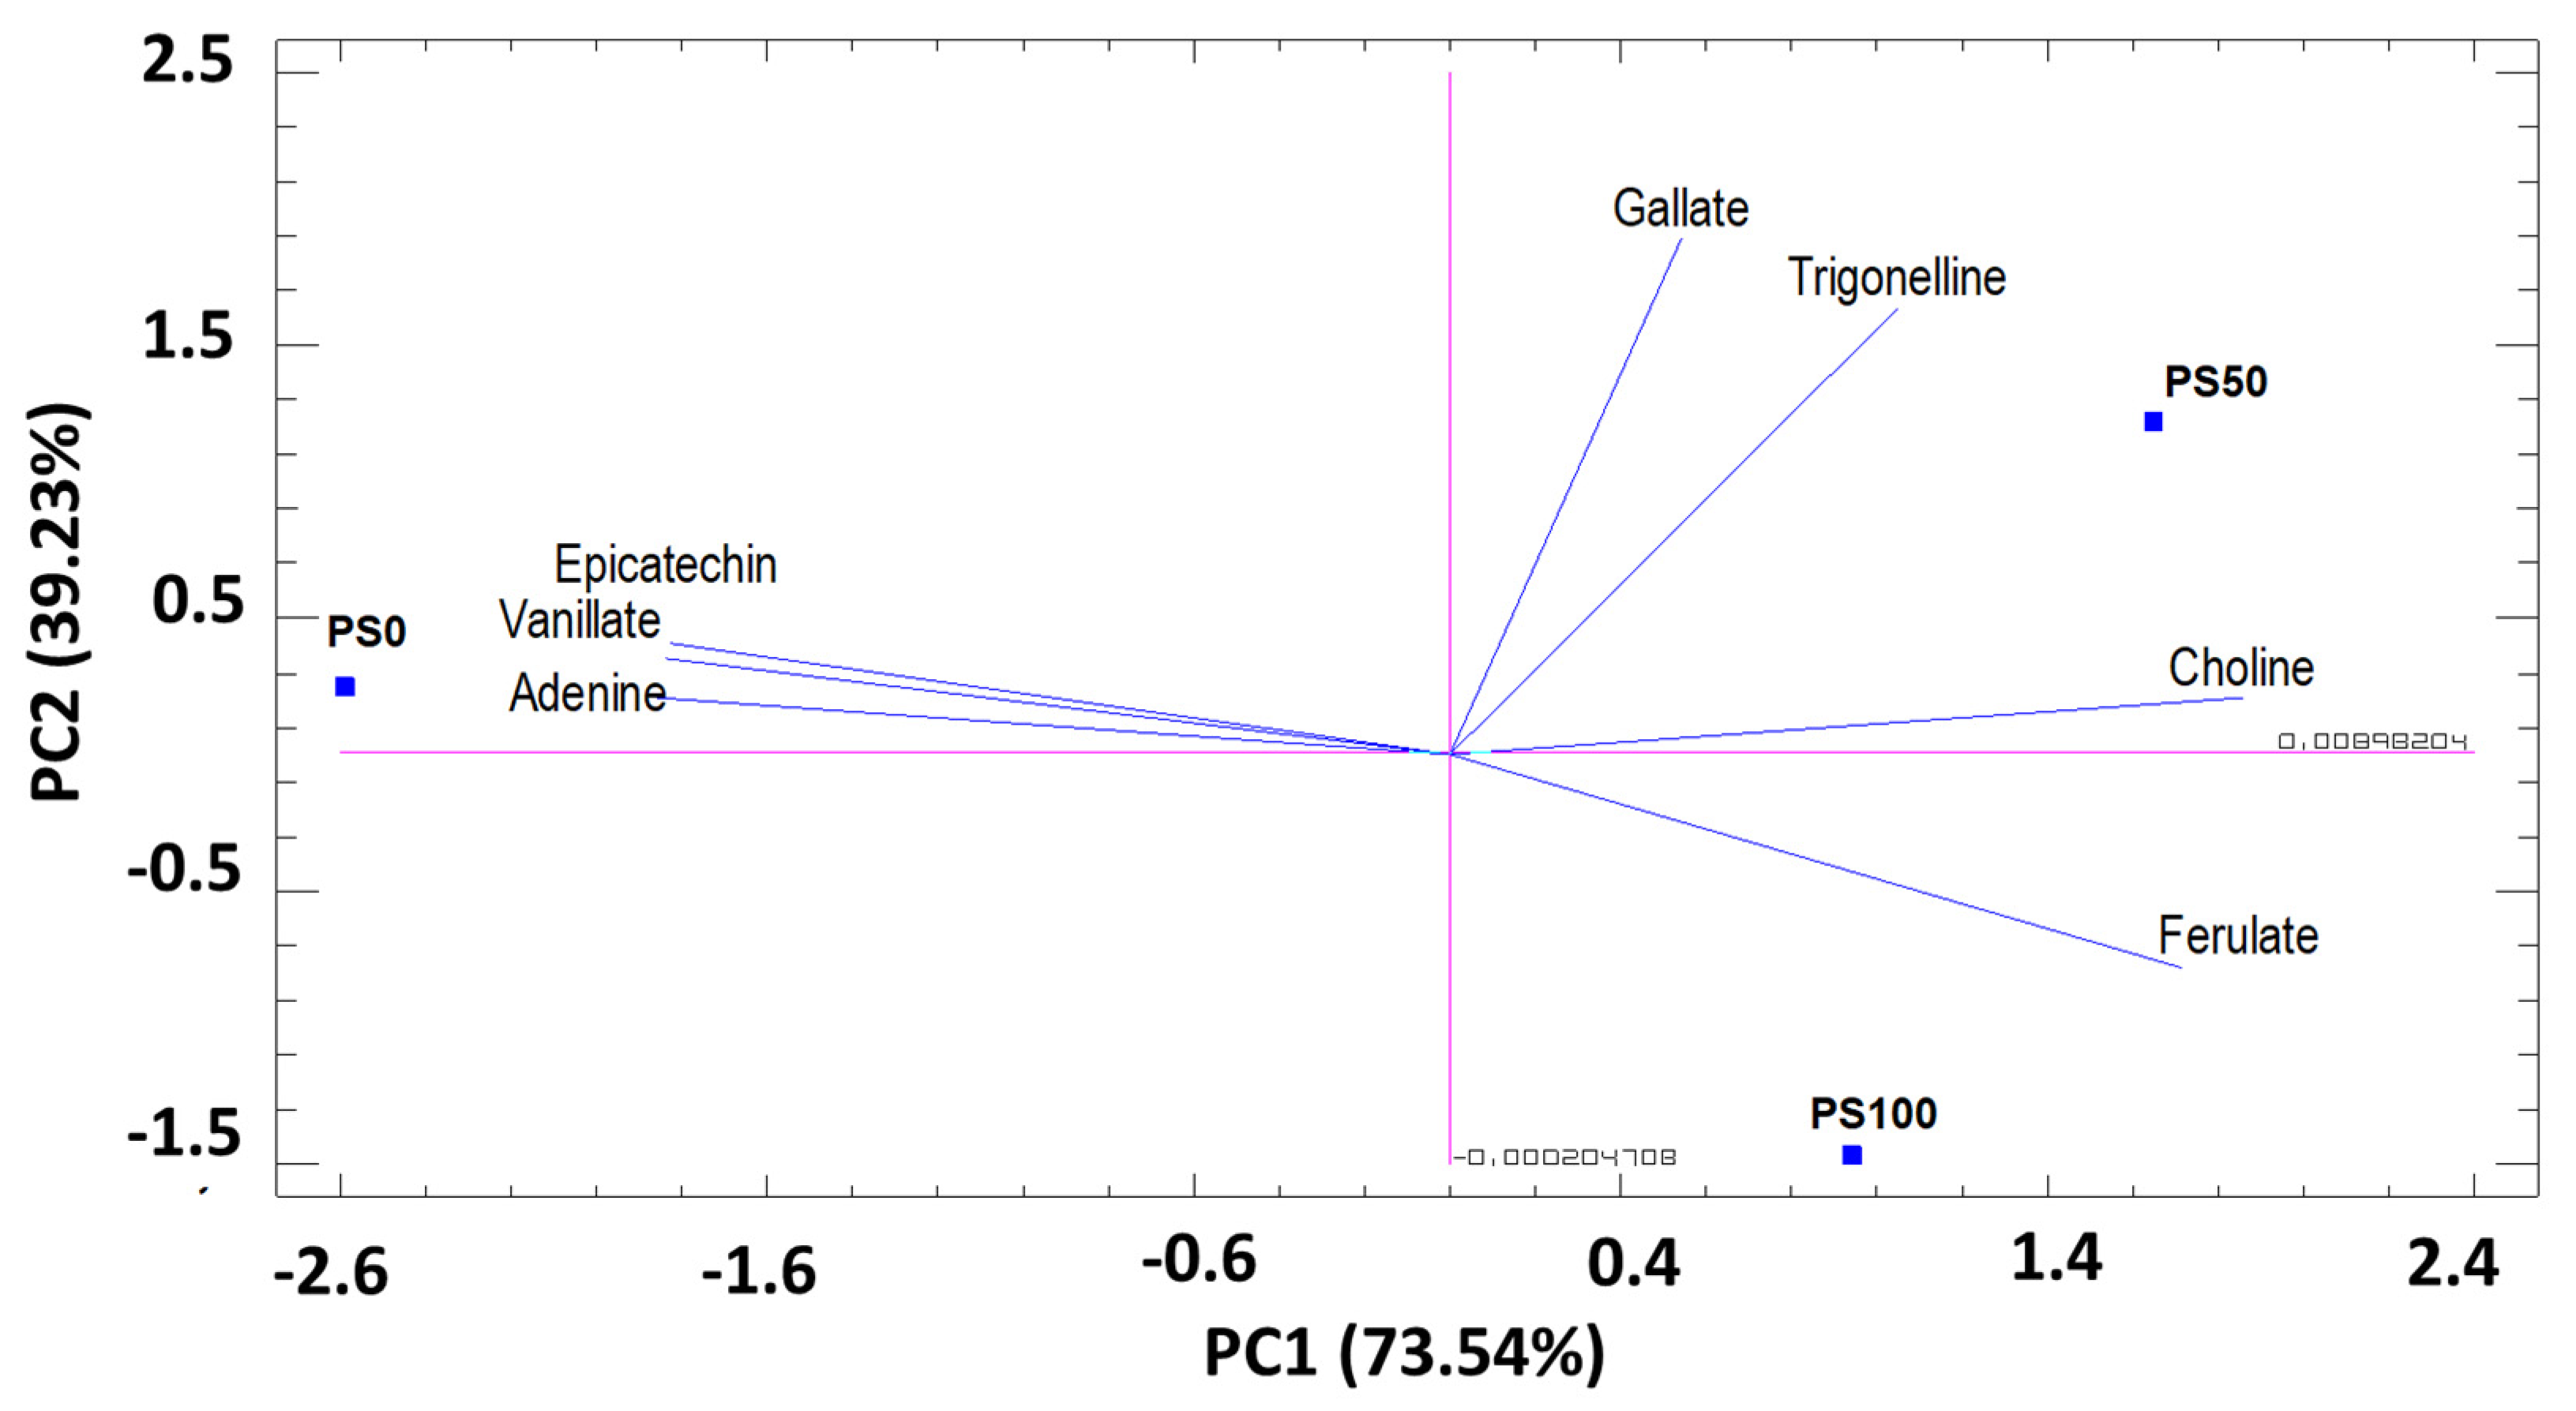
Secondary Metabolites and Others
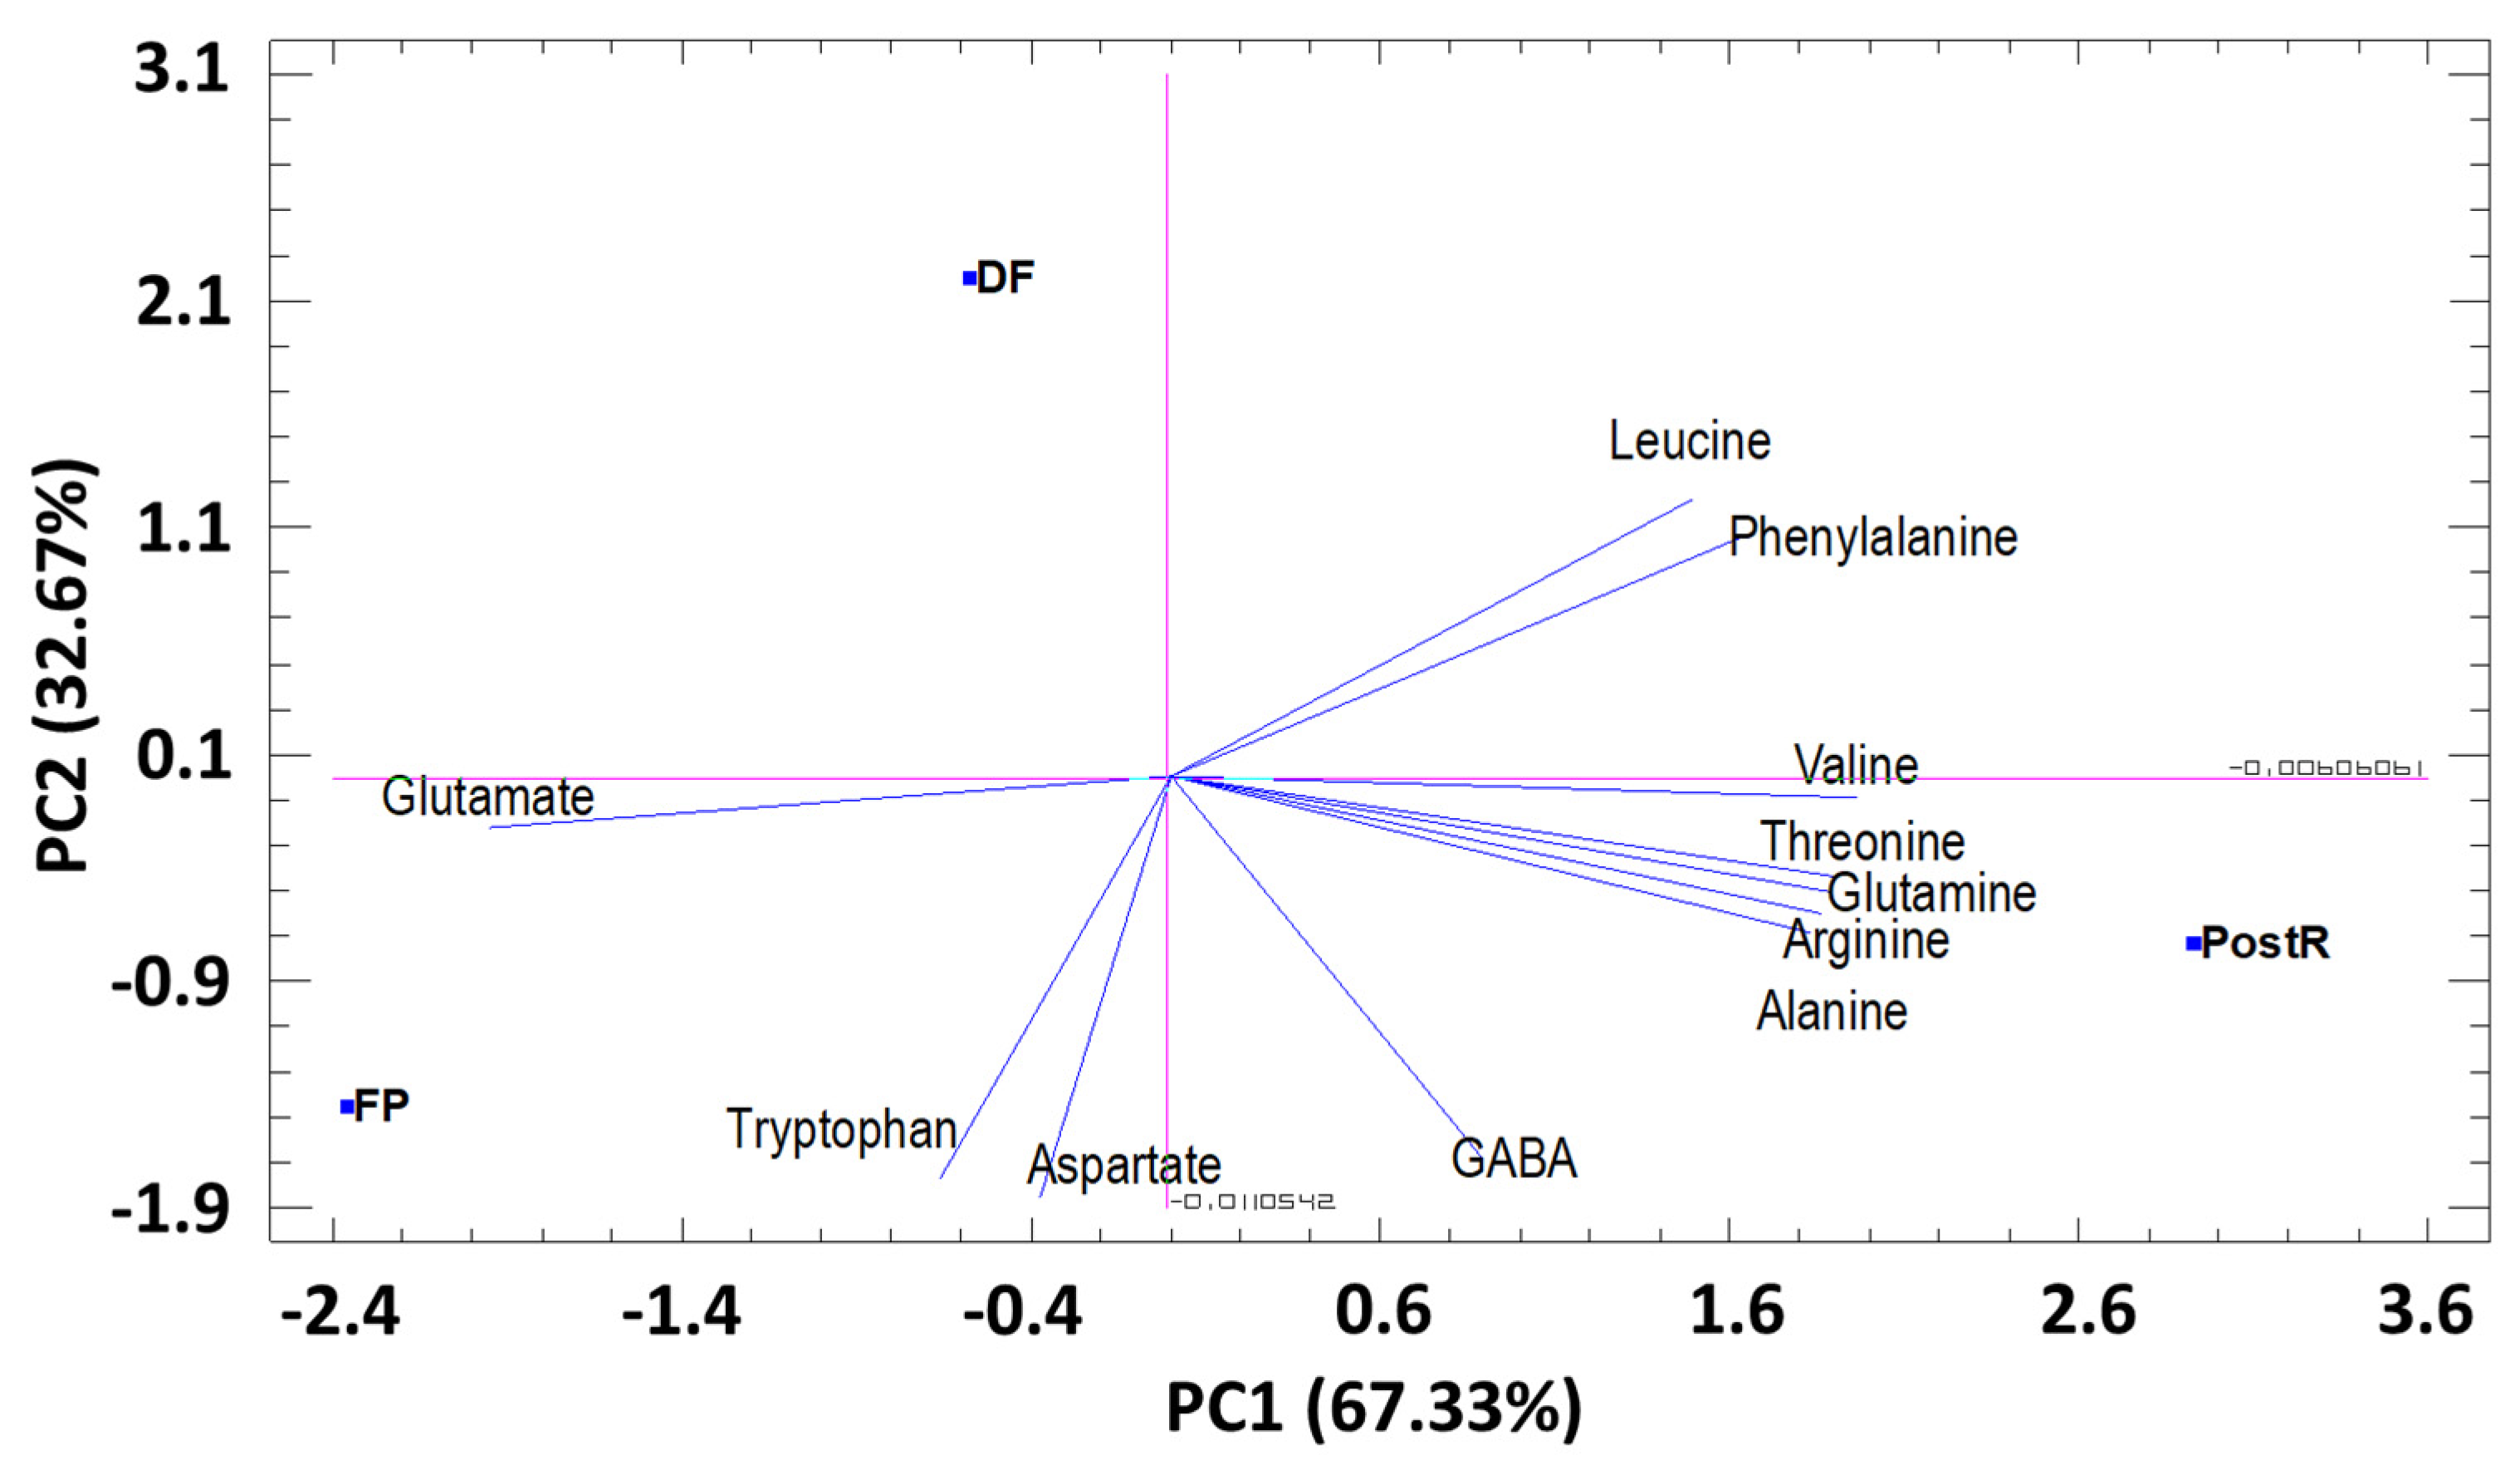
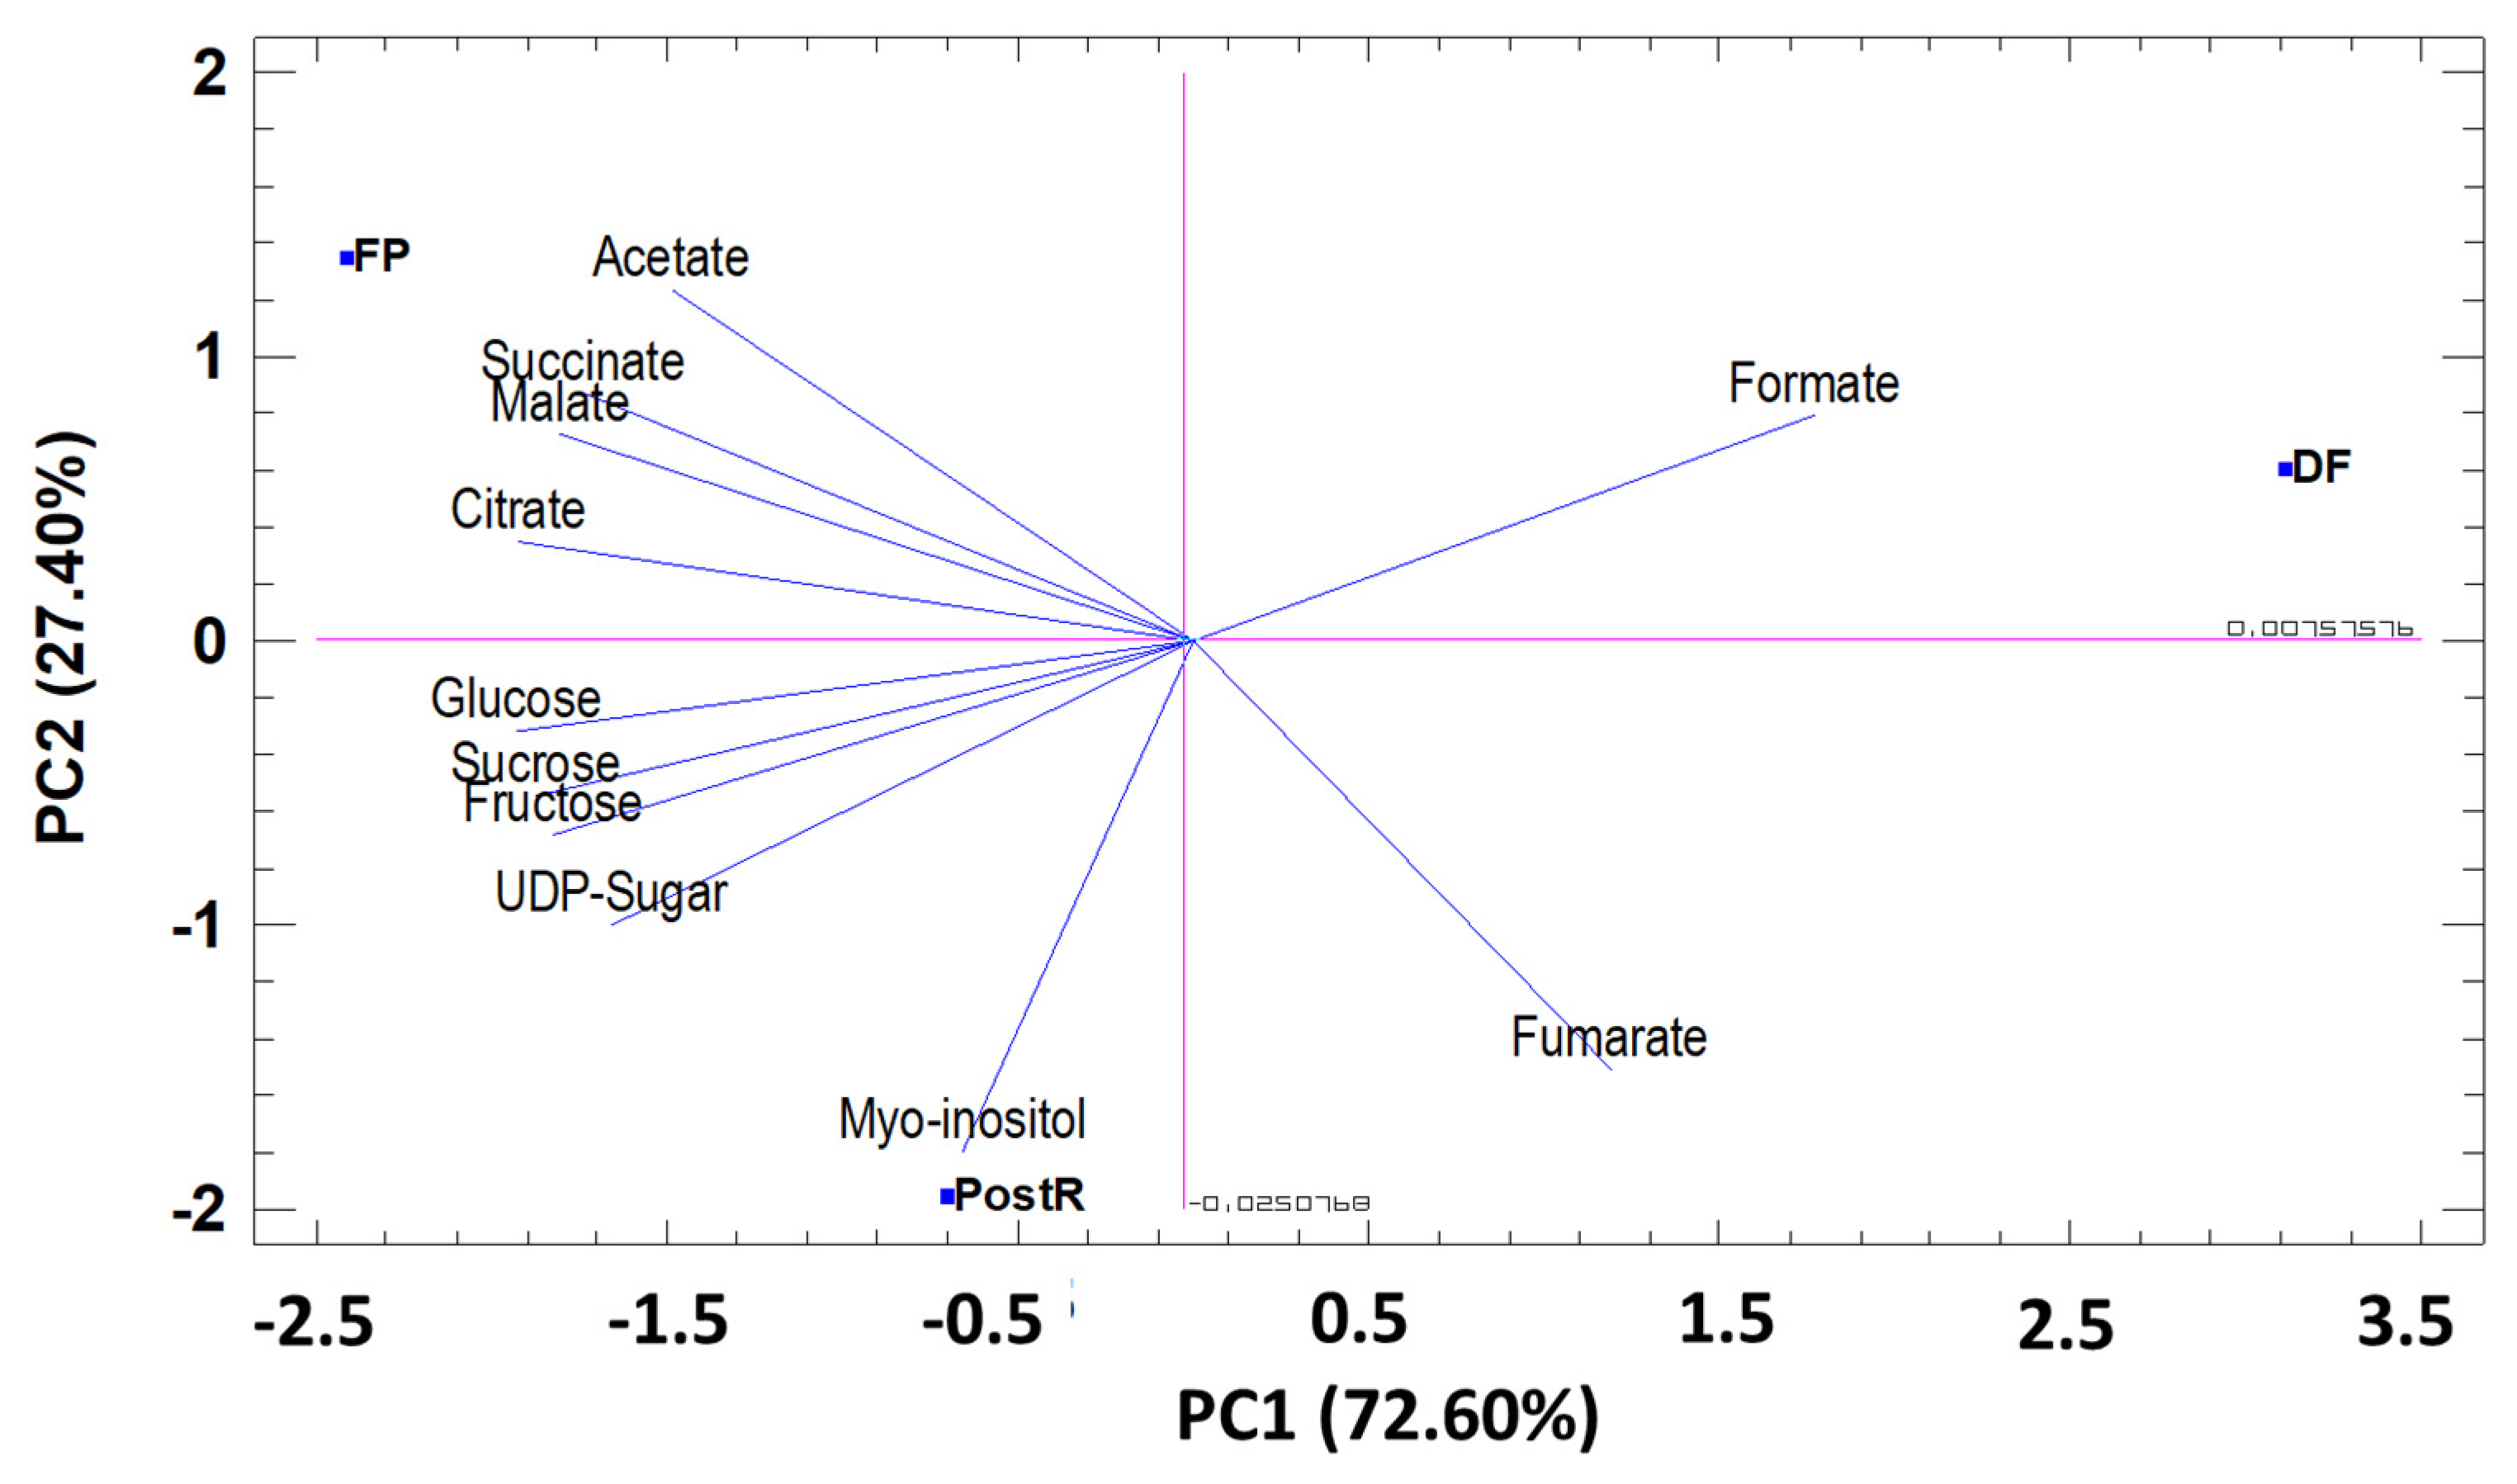
3.3.2. Principal Component Analysis (PCA) by Phenological Stage
Amino Acids (AA)
Sugar and Organic Acids
Secondary Metabolites and Others
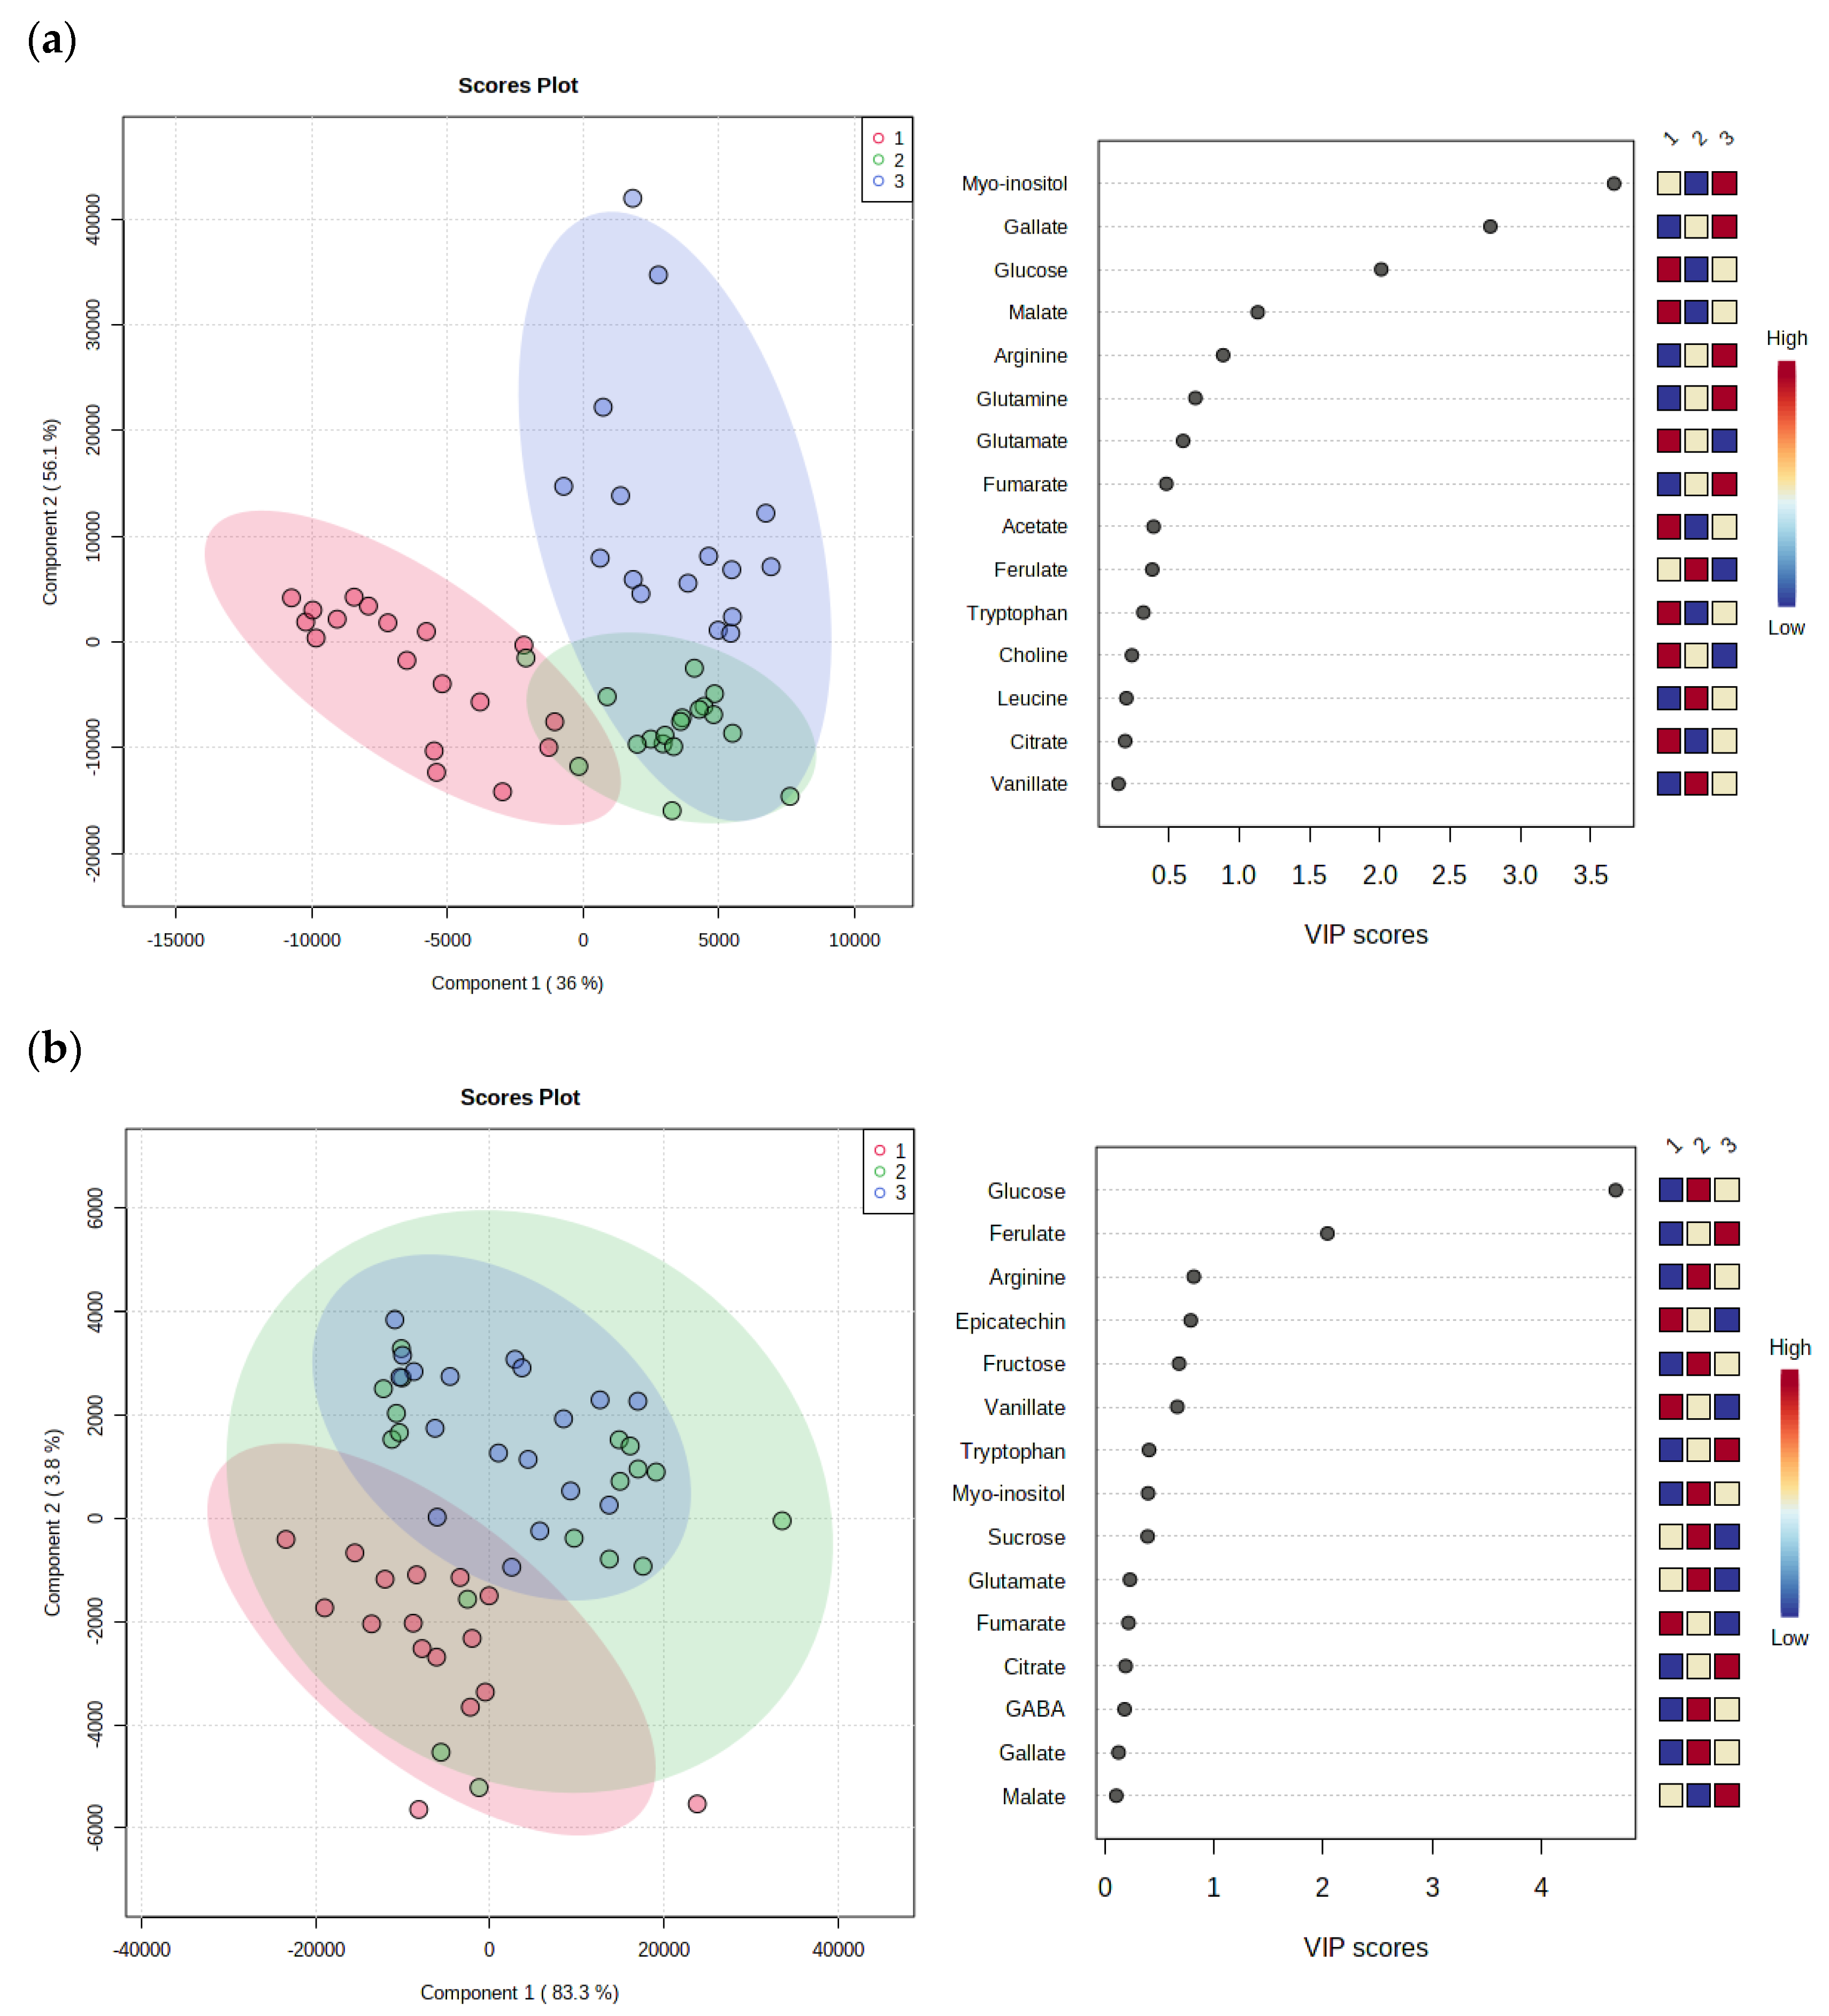
3.3.3. PLS-DA Regression
4. Discusion
4.1. Metabolite Profile According to Substrates
4.2. Metabolite Profile According to Phenological Phases
5. Conclusions
Author Contributions
Funding
Institutional Review Board Statement
Informed Consent Statement
Data Availability Statement
Conflicts of Interest
References
- Witthohn, R. Dredging. In International Shipping: The Role of Sea Transport in the Global Economy; Witthohn, R., Ed.; Springer Fachmedien: Wiesbaden, Germany, 2023; pp. 543–553. ISBN 978-3-658-34273-9. [Google Scholar]
- Rahman, M.; Ali, M.S. Morphological Response of the Pussur River, Bangladesh to Modern-Day Dredging: Implications for Navigability. J. Asian Earth Sci. X 2022, 7, 100088. [Google Scholar] [CrossRef]
- Hernández, F.; Martínez-Nicolás, J.J.; Melgarejo, P.; Núñez-Gómez, D.; Lidón, V.; Martínez-Font, R.; Legua, P. Life Cycle Assessment (LCA) of Substrate Mixes Containing Port Sediments for Sustainable ‘Verna’ Lemon Production. Foods 2022, 11, 3053. [Google Scholar] [CrossRef]
- Review of Legislation on Dredged Sediment Management. Available online: http://www.lifesubsed.com/wp-content/uploads/2019/03/SUBSED-Deliverable-A.1-Review-of-legislation-on-dredged-sediment-management.pdf (accessed on 25 November 2022).
- Martínez-Nicolás, J.J.; Legua, P.; Núñez-Gómez, D.; Martínez-Font, R.; Hernández, F.; Giordani, E.; Melgarejo, P. Potential of Dredged Bioremediated Marine Sediment for Strawberry Cultivation. Sci. Rep. 2020, 10, 19878. [Google Scholar] [CrossRef] [PubMed]
- Martínez-Nicolas, J.J.; Núñez-Gómez, D.; Lidón, V.; Martínez-Font, R.; Melgarejo, P.; Hernández, F.; Legua, P. Physico-Chemical Attributes of Lemon Fruits as Affected by Growing Substrate and Rootstock. Foods 2022, 11, 2487. [Google Scholar] [CrossRef]
- Renella, G. Recycling and Reuse of Sediments in Agriculture: Where Is the Problem? Sustainability 2021, 13, 1648. [Google Scholar] [CrossRef]
- Carlile, W.R.; Cattivello, C.; Zaccheo, P. Organic Growing Media: Constituents and Properties. Vadose Zone J. 2015, 14, 1–13. [Google Scholar] [CrossRef] [Green Version]
- Raviv, M. Composts in growing media: What’s new and what’s next? Acta Hortic. 2013, 982, 39–52. [Google Scholar] [CrossRef]
- Sonneveld, C.; Voogt, W. Nutrient Management in Substrate Systems. In Plant Nutrition of Greenhouse Crops; Sonneveld, C., Voogt, W., Eds.; Springer: Dordrecht, The Netherlands, 2009; pp. 277–312. ISBN 978-90-481-2532-6. [Google Scholar]
- Freeman, B.W.J.; Evans, C.D.; Musarika, S.; Morrison, R.; Newman, T.R.; Page, S.E.; Wiggs, G.F.S.; Bell, N.G.A.; Styles, D.; Wen, Y.; et al. Responsible Agriculture Must Adapt to the Wetland Character of Mid-Latitude Peatlands. Glob. Chang. Biol. 2022, 28, 3795–3811. [Google Scholar] [CrossRef]
- Tittarelli, F.; Rea, E.; Verrastro, V.; Pascual, J.A.; Canali, S.; Ceglie, F.G.; Trinchera, A.; Rivera, C.M. Compost-Based Nursery Substrates: Effect of Peat Substitution on Organic Melon Seedlings. Compost. Sci. Util. 2009, 17, 220–228. [Google Scholar] [CrossRef]
- Pascual, J.A.; Ceglie, F.; Tuzel, Y.; Koller, M.; Koren, A.; Hitchings, R.; Tittarelli, F. Organic Substrate for Transplant Production in Organic Nurseries. A Review. Agron. Sustain. Dev. 2018, 38, 35. [Google Scholar] [CrossRef]
- Shober, A.L.; Wiese, C.; Denny, G.C.; Stanley, C.D.; Harbaugh, B.K.; Chen, J. Plant Performance and Nutrient Losses during Containerized Bedding Plant Production Using Composted Dairy Manure Solids as a Peat Substitute in Substrate. HortScience 2010, 45, 1516–1521. [Google Scholar] [CrossRef] [Green Version]
- Asp, H.; Bergstrand, K.-J.; Caspersen, S.; Hultberg, M. Anaerobic Digestate as Peat Substitute and Fertiliser in Pot Production of Basil. Biol. Agric. Hortic. 2022, 38, 247–257. [Google Scholar] [CrossRef]
- Hirschler, O.; Osterburg, B.; Weimar, H.; Glasenapp, S.; Ohmes, M.-F. Peat Replacement in Horticultural Growing Media: Availability of Bio-Based Alternative Materials; Johann Heinrich von Thünen-Institut: Braunschweig, Germany, 2022. [Google Scholar]
- Mattei, P.; D’Acqui, L.P.; Nicese, F.P.; Lazzerini, G.; Masciandaro, G.; Macci, C.; Doni, S.; Sarteschi, F.; Giagnoni, L.; Renella, G. Use of Phytoremediated Sediments Dredged in Maritime Port as Plant Nursery Growing Media. J. Environ. Manag. 2017, 186, 225–232. [Google Scholar] [CrossRef]
- Fayiga, A.O.; Ma, L.Q.; Cao, X.; Rathinasabapathi, B. Effects of Heavy Metals on Growth and Arsenic Accumulation in the Arsenic Hyperaccumulator Pteris vittata L. Environ. Pollut. 2004, 132, 289–296. [Google Scholar] [CrossRef]
- Melgarejo-Sánchez, P.; Núñez-Gómez, D.; Martínez-Nicolás, J.J.; Hernández, F.; Legua, P.; Melgarejo, P. Pomegranate Variety and Pomegranate Plant Part, Relevance from Bioactive Point of View: A Review. Bioresour. Bioprocess. 2021, 8, 2. [Google Scholar] [CrossRef]
- Li, Y.; Wang, X.; Li, C.; Huang, W.; Gu, K.; Wang, Y.; Yang, B.; Li, Y. Exploration of Chemical Markers Using a Metabolomics Strategy and Machine Learning to Study the Different Origins of Ixeris dnticulata (Houtt.) Stebb. Food Chem. 2020, 330, 127232. [Google Scholar] [CrossRef] [PubMed]
- Moradi, P.; Ford-Lloyd, B.; Pritchard, J. Metabolomic Approach Reveals the Biochemical Mechanisms Underlying Drought Stress Tolerance in Thyme. Anal. Biochem. 2017, 527, 49–62. [Google Scholar] [CrossRef] [PubMed] [Green Version]
- Vermathen, M.; Marzorati, M.; Diserens, G.; Baumgartner, D.; Good, C.; Gasser, F.; Vermathen, P. Metabolic Profiling of Apples from Different Production Systems before and after Controlled Atmosphere (CA) Storage Studied by 1H High Resolution-Magic Angle Spinning (HR-MAS) NMR. Food Chem. 2017, 233, 391–400. [Google Scholar] [CrossRef] [Green Version]
- Hatzakis, E. Nuclear Magnetic Resonance (NMR) Spectroscopy in Food Science: A Comprehensive Review. Compr. Rev. Food Sci. Food Saf. 2019, 18, 189–220. [Google Scholar] [CrossRef] [Green Version]
- Bianchi, V.; Masciandaro, G.; Ceccanti, B.; Peruzzi, E.; Iannelli, R. Phytoremediation of Contaminated Sediments: Evaluation of Agronomic Properties and Risk Assessment. Chem. Ecol. 2011, 27, 1–11. [Google Scholar] [CrossRef]
- Macci, C.; Vannucchi, F.; Doni, S.; Peruzzi, E.; Lucchetti, S.; Castellani, M.; Masciandaro, G. Recovery and Environmental Recycling of Sediments: The Experience of CNR-IRET Pisa. J. Soils Sediments 2022, 22, 2865–2872. [Google Scholar] [CrossRef]
- Melgarejo, P.; Legua, P.; Pérez-Sarmiento, F.; Martínez-Font, R.; Martínez-Nicolás, J.J.; Giordani, E.; Tozzi, F.; Hernández, F. Effect of a New Remediated Substrate on Bioactive Compounds and Antioxidant Characteristics of Pomegranate (Punica granatum L.) Cultivar ‘Purple Queen’. Arch. Agron. Soil Sci. 2019, 65, 1565–1574. [Google Scholar] [CrossRef]
- Tozzi, F.; Renella, G.; Macci, C.; Masciandaro, G.; Gonnelli, C.; Colzi, I.; Giagnoni, L.; Pecchioli, S.; Nin, S.; Giordani, E. Agronomic Performance and Food Safety of Strawberry Cultivated on a Remediated Sediment. Sci. Total Environ. 2021, 796, 148803. [Google Scholar] [CrossRef]
- Melgarejo, P.; Núñez-Gómez, D.; Martínez-Nicolás, J.J.; Hernández, F.; Martínez-Font, R.; Lidón, V.; García-Sánchez, F.; Legua, P. Metabolomic Profile of Citrus Limon Leaves (‘Verna’ Variety) by 1H-NMR and Multivariate Analysis Technique. Agronomy 2022, 12, 1060. [Google Scholar] [CrossRef]
- Korifi, R.; Le Dréau, Y.; Antinelli, J.-F.; Valls, R.; Dupuy, N. CIEL⁎a⁎b⁎ Color Space Predictive Models for Colorimetry Devices—Analysisof Perfume Quality. Talanta 2013, 104, 58–66. [Google Scholar] [CrossRef] [PubMed]
- Littler, D.S.; Hellebust, J.A.; Phycological Society of America; Littler, M.M.; Craigie, J.S. Handbook of Phycological Methods: Culture Methods and Growth Measurements; Stein, J.R., Ed.; Cambridge University Press: Cambridge, UK, 1973; ISBN 978-0-521-20049-3. [Google Scholar]
- van der Sar, S.; Kim, H.K.; Meissner, A.; Verpoorte, R.; Choi, Y.H. Nuclear Magnetic Resonance Spectroscopy for Plant Metabolite Profiling. In The Handbook of Plant Metabolomics; John Wiley & Sons, Ltd.: New York, NY, USA, 2013; pp. 57–76. ISBN 978-3-527-66988-2. [Google Scholar]
- Broadhurst, D.I.; Kell, D.B. Statistical Strategies for Avoiding False Discoveries in Metabolomics and Related Experiments. Metabolomics 2006, 2, 171–196. [Google Scholar] [CrossRef] [Green Version]
- Villa-Ruano, N.; Rosas-Bautista, A.; Rico-Arzate, E.; Cruz-Narvaez, Y.; Zepeda-Vallejo, L.G.; Lalaleo, L.; Hidalgo-Martínez, D.; Becerra-Martínez, E. Study of Nutritional Quality of Pomegranate (Punica granatum L.) Juice Using 1H NMR-Based Metabolomic Approach: A Comparison between Conventionally and Organically Grown Fruits. LWT 2020, 134, 110222. [Google Scholar] [CrossRef]
- Hatfield, R.D.; Ralph, J.; Grabber, J.H. Cell Wall Cross-Linking by Ferulates and Diferulates in Grasses. J. Sci. Food Agric. 1999, 79, 403–407. [Google Scholar] [CrossRef]
- Hoffmann, P.; Voges, M.; Held, C.; Sadowski, G. The Role of Activity Coefficients in Bioreaction Equilibria: Thermodynamics of Methyl Ferulate Hydrolysis. Biophys. Chem. 2013, 173–174, 21–30. [Google Scholar] [CrossRef] [PubMed]
- Zhang, Z.; Liu, Y.; Cao, B.; Chen, Z.; Xu, K. The Effectiveness of Grafting to Improve Drought Tolerance in Tomato. Plant Growth Regul. 2020, 91, 157–167. [Google Scholar] [CrossRef]
- Hennion, N.; Durand, M.; Vriet, C.; Doidy, J.; Maurousset, L.; Lemoine, R.; Pourtau, N. Sugars En Route to the Roots. Transport, Metabolism and Storage within Plant Roots and towards Microorganisms of the Rhizosphere. Physiol. Plant. 2019, 165, 44–57. [Google Scholar] [CrossRef] [PubMed] [Green Version]
- Agius, C.; Von Tucher, S.; Poppenberger, B.; Rozhon, W. Quantification of Glutamate and Aspartate by Ultra-High Performance Liquid Chromatography. Molecules 2018, 23, 1389. [Google Scholar] [CrossRef] [PubMed] [Green Version]
- Igamberdiev, A.U.; Eprintsev, A.T. Organic Acids: The Pools of Fixed Carbon Involved in Redox Regulation and Energy Balance in Higher Plants. Front. Plant Sci. 2016, 7, 1042. [Google Scholar] [CrossRef] [Green Version]
- Maurino, V.G.; Engqvist, M.K.M. 2-Hydroxy Acids in Plant Metabolism. Arab. Book 2015, 13, e0182. [Google Scholar] [CrossRef] [PubMed] [Green Version]
- Osuji, G.O.; Madu, W.C. Using the RNA Synthetic Activity of Glutamate Dehydrogenase to Illuminate the Natural Role of the Enzyme. Adv. Biol. Chem. 2012, 2, 379–389. [Google Scholar] [CrossRef] [Green Version]
- Han, M.; Zhang, C.; Suglo, P.; Sun, S.; Wang, M.; Su, T. L-Aspartate: An Essential Metabolite for Plant Growth and Stress Acclimation. Molecules 2021, 26, 1887. [Google Scholar] [CrossRef]
- Guo, Z.; Yang, N.; Zhu, C.; Gan, L. Exogenously Applied Poly-γ-Glutamic Acid Alleviates Salt Stress in Wheat Seedlings by Modulating Ion Balance and the Antioxidant System. Environ. Sci. Pollut. Res. 2017, 24, 6592–6598. [Google Scholar] [CrossRef]
- Amin, A.A.; Gharib, F.A.E.; El-Awadi, M.; Rashad, E.-S.M. Physiological Response of Onion Plants to Foliar Application of Putrescine and Glutamine. Sci. Hortic. 2011, 129, 353–360. [Google Scholar] [CrossRef]
- Barros, J.; Dixon, R. Plant Phenylalanine/Tyrosine Ammonia-Lyases. Trends Plant Sci. 2020, 25, 66–79. [Google Scholar] [CrossRef]
- Astaneh, R.; Bolandnazar, S.; Nahandi, F.; Oustan, S. Effect of Selenium Application on Phenylalanine Ammonia-Lyase (PAL) Activity, Phenol Leakage and Total Phenolic Content in Garlic (Allium sativum L.) under NaCl Stress. Inf. Process. Agric. 2018, 5, 339–344. [Google Scholar] [CrossRef]


| Culture Media | |||
|---|---|---|---|
| Parameter | PS0 | PS50 | PS100 |
| Leaf Surface (cm2) | 6.77 ± 0.55 a | 6.45 ± 0.82 a | 5.24 ± 0.49 a |
| L* | 35.75 ± 0.41 a | 36.86 ± 0.43 a | 37.90 ± 0.38 a |
| a* | −7.14 ± 0.22 a | −7.24 ± 0.23 a | −7.40 ± 0.17 a |
| b* | 13.46 ± 0.62 a | 14.01 ± 0.44 a | 14.60 ± 0.46 a |
| Chroma | 15.27 ± 0.63 a | 15.79 ± 0.47 a | 16.38 ± 0.48 a |
| Tree height (mm) | 211.09 ± 9.50 a | 193.92 ± 8.74 a | 186.85 ± 8.40 a |
| Pruning weight | 297.95 ± 25.19 a | 404.0 ± 30.60 a | 343.4 ± 27.49 a |
| Yield tree−1 (kg) | 6.63 ± 0.35 a | 6.29 ± 0.28 a | 4.30 ± 0.37 b |
| Fruit tree−1 | 22 ± 1.33 a | 25 ± 1.29 a | 18 ± 1.86 a |
| Fruit weight (g) | 261.8 ± 11.32 a | 248.8 ± 11.64 a | 227.4 ± 10.29 b |
| Seed yield (%) | 54.22 ± 0.80 a | 56.21 ± 1.44 a | 52.17 ± 1.43 a |
| Dry matter (g) | 36.36 ± 2.18 a | 40.4 ± 2.26 a | 38.38 ± 2.18 a |
| Chlorophyll a | 39.39 ± 2.09 a | 35.35 ± 1.87 a | 25.25 ± 1.33 b |
| Chlorophyll b | 20.2 ± 1.07 a | 22.22 ± 1.09 ab | 17.17 ± 0.99 b |
| Chlorophyll a + b | 59.59 ± 3.16 a | 57.57 ± 3.04 a | 42.42 ± 2.25 b |
| Aerial part weight (g) | 7.58 ± 0.42 a | 3.23 ± 0.18 b | 2.32 ± 0.12 c |
| Root weight (g) | 0.51 ± 0.03 a | 0.40 ± 0.02 b | 0.30 ± 0.02 c |
| Total tree weight (g) | 8.08 ± 0.46 a | 3.64 ± 0.25 b | 2.63 ± 0.15 c |
| Pomegranate fruits | |||
| Diam1 equal (mm) | 81.88 ± 1.18 a | 79.93 ± 1.48 a | 78.30 ± 1.34 a |
| Diam2 chalice (mm) | 25.16 ± 0.89 a | 20.43 ± 0.89 b | 16.48 ± 0.56 b |
| Long1 fruit (mm) | 73.91 ± 1.16 a | 70.05 ± 1.34 ab | 67.77 ± 1.05 b |
| Long2 fruit (mm) | 92.47 ± 1.50 a | 86.07 ± 1.83 ab | 82.24 ± 1.16 b |
| Long3 Chalice (mm) | 18.56 ±1.33 a | 16.02 ± 0.80 a | 14.47 ± 0.98 a |
| Carpels (n°) | 5.73 ± 0.18 a | 5.93 ± 0.18 a | 6.20 ± 0.14 a |
| Peel weight (g) | 123.80 ± 5.90 a | 116.34 ± 5.76 a | 115.73 ± 8.84 a |
| Peel thickness (mm) | 4.81 ± 0.17 a | 4.34 ± 0.23 a | 4.61 ± 0.36 a |
| Seed yield (%) | 54.22 ± 0.80 a | 56.21 ± 1.44 a | 52.17 ± 1.43 a |
| Main Effects | |||
|---|---|---|---|
| Compound | A: Substrate | B: Phenological | INTERACTION: A × B |
| Amino acids | |||
| GABA | * | ns | ns |
| Alanine | ns | * | ns |
| Valine | ns | * | ns |
| Arginine | * | * | ns |
| Leucine | * | * | ns |
| Tryptophan | * | * | * |
| Threonine | ns | * | ns |
| Aspartate | ns | ns | ns |
| Phenylalanine | ns | * | ns |
| Glutamine | ns | * | * |
| Glutamate | ns | * | ns |
| Organic Acids and sugars | |||
| Formate | ns | * | ns |
| Acetate | ns | * | * |
| Malate | ns | * | * |
| Fumarate | ns | * | ns |
| Succinate | * | * | ns |
| Citrate | * | * | * |
| Sucrose | ns | * | * |
| Fructose | * | * | * |
| Glucose | * | * | * |
| UDP-Sugar | ns | * | ns |
| Myo-inositol | ns | * | ns |
| Secondary Metabolites and others | |||
| Choline | * | * | ns |
| Trigonelline | ns | * | ns |
| Adenine | ns | * | ns |
| Ferulate | * | * | ns |
| Gallate | ns | * | ns |
| Epicatechin | * | * | ns |
| Vanillate | * | * | ns |
| Culture Media | |||
|---|---|---|---|
| Compound (mM) | PS0 | PS50 | PS100 |
| Amino acids | |||
| GABA | 0.06 ± 0.006 a | 0.10 ± 0.007 b | 0.08 ± 0.009 ab |
| Alanine | 0.06± 0.003 a | 0.07 ± 0.004 a | 0.06 ± 0.002 a |
| Valine | 0.03 ± 0.002 a | 0.03 ± 0.003 a | 0.03 ± 0.001 a |
| Arginine | 0.30 ± 0.03 a | 0.47 ± 0.03 b | 0.36 ± 0.02 a |
| Leucine | 0.04 ± 0.004 a | 0.05 ± 0.005 a | 0.05 ± 0.005 a |
| Tryptophan | 0.09 ± 0.01 a | 0.14 ± 0.02 b | 0.14 ± 0.02 b |
| Threonine | 0.05 ± 0.004 a | 0.06 ± 0.0030 a | 0.05 ± 0.002 a |
| Aspartate | 0.11 ± 0.009 a | 0.12 ± 0.006 a | 0.10 ± 0.009 a |
| Phenylalanine | 0.07 ± 0.003 a | 0.06 ± 0.002 a | 0.07 ± 0.004 a |
| Glutamine | 0.24 ± 0.03 a | 0.24 ± 0.02 a | 0.20 ± 0.01 a |
| Organic acids and sugars | |||
| Glutamate | 0.32 ± 0.02 a | 0.34 ± 0.01 a | 0.29 ± 0.02 a |
| Formate | 0.02 ± 0.002 a | 0.02 ± 0.001 a | 0.02 ± 0.002 a |
| Acetate | 0.06 ± 0.007 a | 0.06 ± 0.006 a | 0.07 ± 0.01 a |
| Malate | 0.33 ± 0.03 a | 0.36 ± 0.02 a | 0.36 ± 0.04 a |
| Fumarate | 0.14 ± 0.01 a | 0.12 ± 0.02 a | 0.11 ± 0.01 a |
| Succinate | 0.02 ± 0.002 a | 0.02 ± 0.001 a | 0.02 ± 0.001 a |
| Citrate | 0.07 ± 0.007 a | 0.10 ± 0.01 a | 0.09 ± 0.01 a |
| Sucrose | 1.18 ± 0.06 a | 1.12 ± 0.04 a | 1.09 ± 0.04 a |
| Fructose | 1.29 ± 0.08 a | 1.57 ± 0.13 a | 1.28 ± 0.09 a |
| Glucose | 2.15 ± 0.26 a | 3.34 ± 0.35 b | 2.72 ± 0.24 ab |
| UDP-sugar | 0.12 ± 0.01 a | 0.12 ± 0.01 a | 0.10 ± 0.01 a |
| Myo-inositol | 0.73 ± 0.12 a | 0.85 ± 0.12 a | 0.68 ± 0.07 a |
| Secondary Metabolites and others | |||
| Choline | 0.06 ± 0.006 a | 0.08 ± 0.005 a | 0.08 ± 0.005 a |
| Trigonelline | 0.03 ± 0.001 a | 0.03 ± 0.003 a | 0.03 ± 0.003 a |
| Adenine | 0.01 ± 0.001 a | 0.01 ± 0.001 a | 0.01 ± 0.001 a |
| Ferulate | 0.30 ± 0.02 a | 0.53 ± 0.01 b | 0.61 ± 0.02 c |
| Gallate | 0.75 ± 0.07 a | 0.77 ± 0.06 a | 0.72 ± 0.06 a |
| Epicatechin | 0.21 ± 0.01 b | 0.10 ± 0.01 a | 0.10 ± 0.01 a |
| Vanillate | 0.18 ± 0.01 b | 0.08 ± 0.005 a | 0.08 ± 0.005 a |
| Phenological Stage | |||
|---|---|---|---|
| Compound (mM) | Flowering Period (FP) | Fruit Development (DF) | Postharvest (PostR) |
| Amino acids | |||
| GABA | 0.08 ± 0.008 a | 0.07 ± 0.008 a | 0.09 ± 0.009 a |
| Alanine | 0.06 ± 0.002 a | 0.06 ± 0.002 a | 0.07 ± 0.002 b |
| Valine | 0.02 ± 0.001 a | 0.03 ± 0.002 a | 0.04 ± 0.003 b |
| Arginine | 0.32 ± 0.03 a | 0.32 ± 0.02 a | 0.49 ± 0.04 b |
| Leucine | 0.02 ± 0.001 a | 0.06 ± 0.003 b | 0.06 ± 0.003 b |
| Tryptophan | 0.18 ± 0.01 c | 0.07 ± 0.006 a | 0.12 ± 0.01 b |
| Threonine | 0.05 ± 0.002 a | 0.05 ± 0.003 a | 0.06 ± 0.004 b |
| Aspartate | 0.13 ± 0.008 b | 0.10 ± 0.009 a | 0.12 ± 0.007 ab |
| Phenylalanine | 0.06 ± 0.004 a | 0.07 ± 0.004 ab | 0.07 ± 0.005 b |
| Glutamine | 0.18 ± 0.02 a | 0.19 ± 0.02 a | 0.31 ± 0.02 b |
| Organic acids and sugars | |||
| Glutamate | 0.37 ± 0.02 b | 0.32 ± 0.02 ab | 0.26 ± 0.01 a |
| Formate | 0.01 ± 0.001 a | 0.03 ± 0.001 b | 0.01 ± 0.001 a |
| Acetate | 0.11 ± 0.008 b | 0.04 ± 0.002 a | 0.04 ± 0.006 a |
| Malate | 0.52 ± 0.03 c | 0.21 ± 0.02 a | 0.32 ± 0.02 b |
| Fumarate | 0.08 ± 0.005 a | 0.15 ± 0.01 b | 0.16 ± 0.01 b |
| Succinate | 0.02 ± 0.001 b | 0.01 ± 0.001 a | 0.01 ± 0.001 a |
| Citrate | 0.12 ± 0.008 c | 0.05 ± 0.007 a | 0.09 ± 0.009 b |
| Sucrose | 1.22 ± 0.02 b | 0.96 ± 0.02 a | 1.22 ± 0.06 b |
| Fructose | 1.60 ± 0.07 b | 0.94 ± 0.04 a | 1.65 ± 0.09 b |
| Glucose | 3.50 ± 0.23 b | 1.55 ± 0.14 a | 3.21 ± 0.32 b |
| UDP-sugar | 0.12 ± 0.005 b | 0.08 ± 0.008 a | 0.14 ± 0.02 b |
| Myo-inositol | 0.58 ± 0.04 a | 0.47 ± 0.02 a | 1.27 ± 0.12 b |
| Secondary Metabolites and others | |||
| Choline | 0.10 ± 0.002 b | 0.06 ± 0.003 a | 0.05 ± 0.003 a |
| Trigonelline | 0.03 ± 0.002 b | 0.02 ± 0.001 a | 0.02 ± 0.001 a |
| Adenine | 0.02 ± 0.001 b | 0.01 ± 0.001 a | 0.01 ± 0.001 a |
| Ferulate | 0.50 ± 0.04 a | 0.50 ± 0.03 a | 0.43 ± 0.02 a |
| Gallate | 0.45 ± 0.02 a | 0.86 ± 0.04 b | 0.95 ± 0.04 b |
| Epicatechin | 0.12 ± 0.02 a | 0.16 ± 0.01 a | 0.13 ± 0.02 a |
| Vanillate | 0.10 ± 0.01 a | 0.13 ± 0.02 a | 0.12 ± 0.01 a |
| Compound | Phenological Stage | Substratum | Mistake |
|---|---|---|---|
| Amino acids (%) | |||
| Arginine | 20.62 | 0.00 | 79.38 |
| Leucine | 0.00 | 38.50 | 61.50 |
| Tryptophan | 5.22 | 34.82 | 59.97 |
| Threonine | 33.65 | 24.43 | 41.92 |
| Aspartate | 77.48 | 7.31 | 15.21 |
| Phenylalanine | 33.45 | 29.29 | 37.27 |
| Glutamine | 20.23 | 2.04 | 77.73 |
| Arginine | 10.17 | 0.00 | 89.83 |
| Leucine | 13.20 | 8.61 | 78.20 |
| Tryptophan | 36.87 | 17.40 | 45.73 |
| Organic acids and sugars (%) | |||
| Glutamate | 27.53 | 0.73 | 71.74 |
| Formate | 67.47 | 1.75 | 30.78 |
| Acetate | 75.72 | 8.79 | 15.49 |
| Malate | 72.58 | 4.32 | 23.11 |
| Fumarate | 46.09 | 3.00 | 50.90 |
| Succinate | 33.97 | 5.55 | 60.48 |
| Citrate | 46.88 | 18.93 | 34.19 |
| Sucrose | 40.35 | 18.56 | 41.09 |
| Fructose | 55.52 | 30.04 | 14.44 |
| Glucose | 45.84 | 26.86 | 27.30 |
| UDP-sugar | 27.85 | 0.00 | 72.15 |
| Myo-inositol | 66.49 | 2.06 | 31.45 |
| Secondary metabolites and others (%) | |||
| Choline | 74.42 | 12.19 | 13.39 |
| Trigonelline | 41.70 | 0.30 | 57.99 |
| Adenine | 53.56 | 0.55 | 45.89 |
| Ferulate | 0.00 | 86.45 | 13.55 |
| Gallate | 78.59 | 0.00 | 21.41 |
| Epicatechin | 0.00 | 70.72 | 29.28 |
| Vanillate | 0.00 | 71.38 | 28.62 |
Disclaimer/Publisher’s Note: The statements, opinions and data contained in all publications are solely those of the individual author(s) and contributor(s) and not of MDPI and/or the editor(s). MDPI and/or the editor(s) disclaim responsibility for any injury to people or property resulting from any ideas, methods, instructions or products referred to in the content. |
© 2023 by the authors. Licensee MDPI, Basel, Switzerland. This article is an open access article distributed under the terms and conditions of the Creative Commons Attribution (CC BY) license (https://creativecommons.org/licenses/by/4.0/).
Share and Cite
Martínez-Nicolás, J.J.; Hernández, F.; Núñez-Gómez, D.; García-Sánchez, F.; Martínez-Font, R.; Legua, P.; Melgarejo, P. Metabolomic Approach to Study the ‘Purple Queen’ Pomegranate Cultivar Response to Alternative Culture Media and Phenological Stages. Foods 2023, 12, 352. https://doi.org/10.3390/foods12020352
Martínez-Nicolás JJ, Hernández F, Núñez-Gómez D, García-Sánchez F, Martínez-Font R, Legua P, Melgarejo P. Metabolomic Approach to Study the ‘Purple Queen’ Pomegranate Cultivar Response to Alternative Culture Media and Phenological Stages. Foods. 2023; 12(2):352. https://doi.org/10.3390/foods12020352
Chicago/Turabian StyleMartínez-Nicolás, Juan José, Francisca Hernández, Dámaris Núñez-Gómez, Francisco García-Sánchez, Rafael Martínez-Font, Pilar Legua, and Pablo Melgarejo. 2023. "Metabolomic Approach to Study the ‘Purple Queen’ Pomegranate Cultivar Response to Alternative Culture Media and Phenological Stages" Foods 12, no. 2: 352. https://doi.org/10.3390/foods12020352