
Layer-by-Layer Deposited Multi-Modal PDAC/rGO Composite-Based Sensors
 ,
,  ,
,  and
and
Abstract
:
1. Introduction
2. Materials and Methods
2.1. Materials Preparation and Sensor Fabrication
2.2. Sensor Physical and Chemical Characterization
2.3. Sensor Performance
2.3.1. Temperature Measurement
2.3.2. Humidity Measurement
2.3.3. VOCs Measurement
2.3.4. Electrochemical Measurement
3. Results and Discussion
3.1. Sensor Physical Properties
3.2. PDAC/rGO-Composites for Temperature Measurements
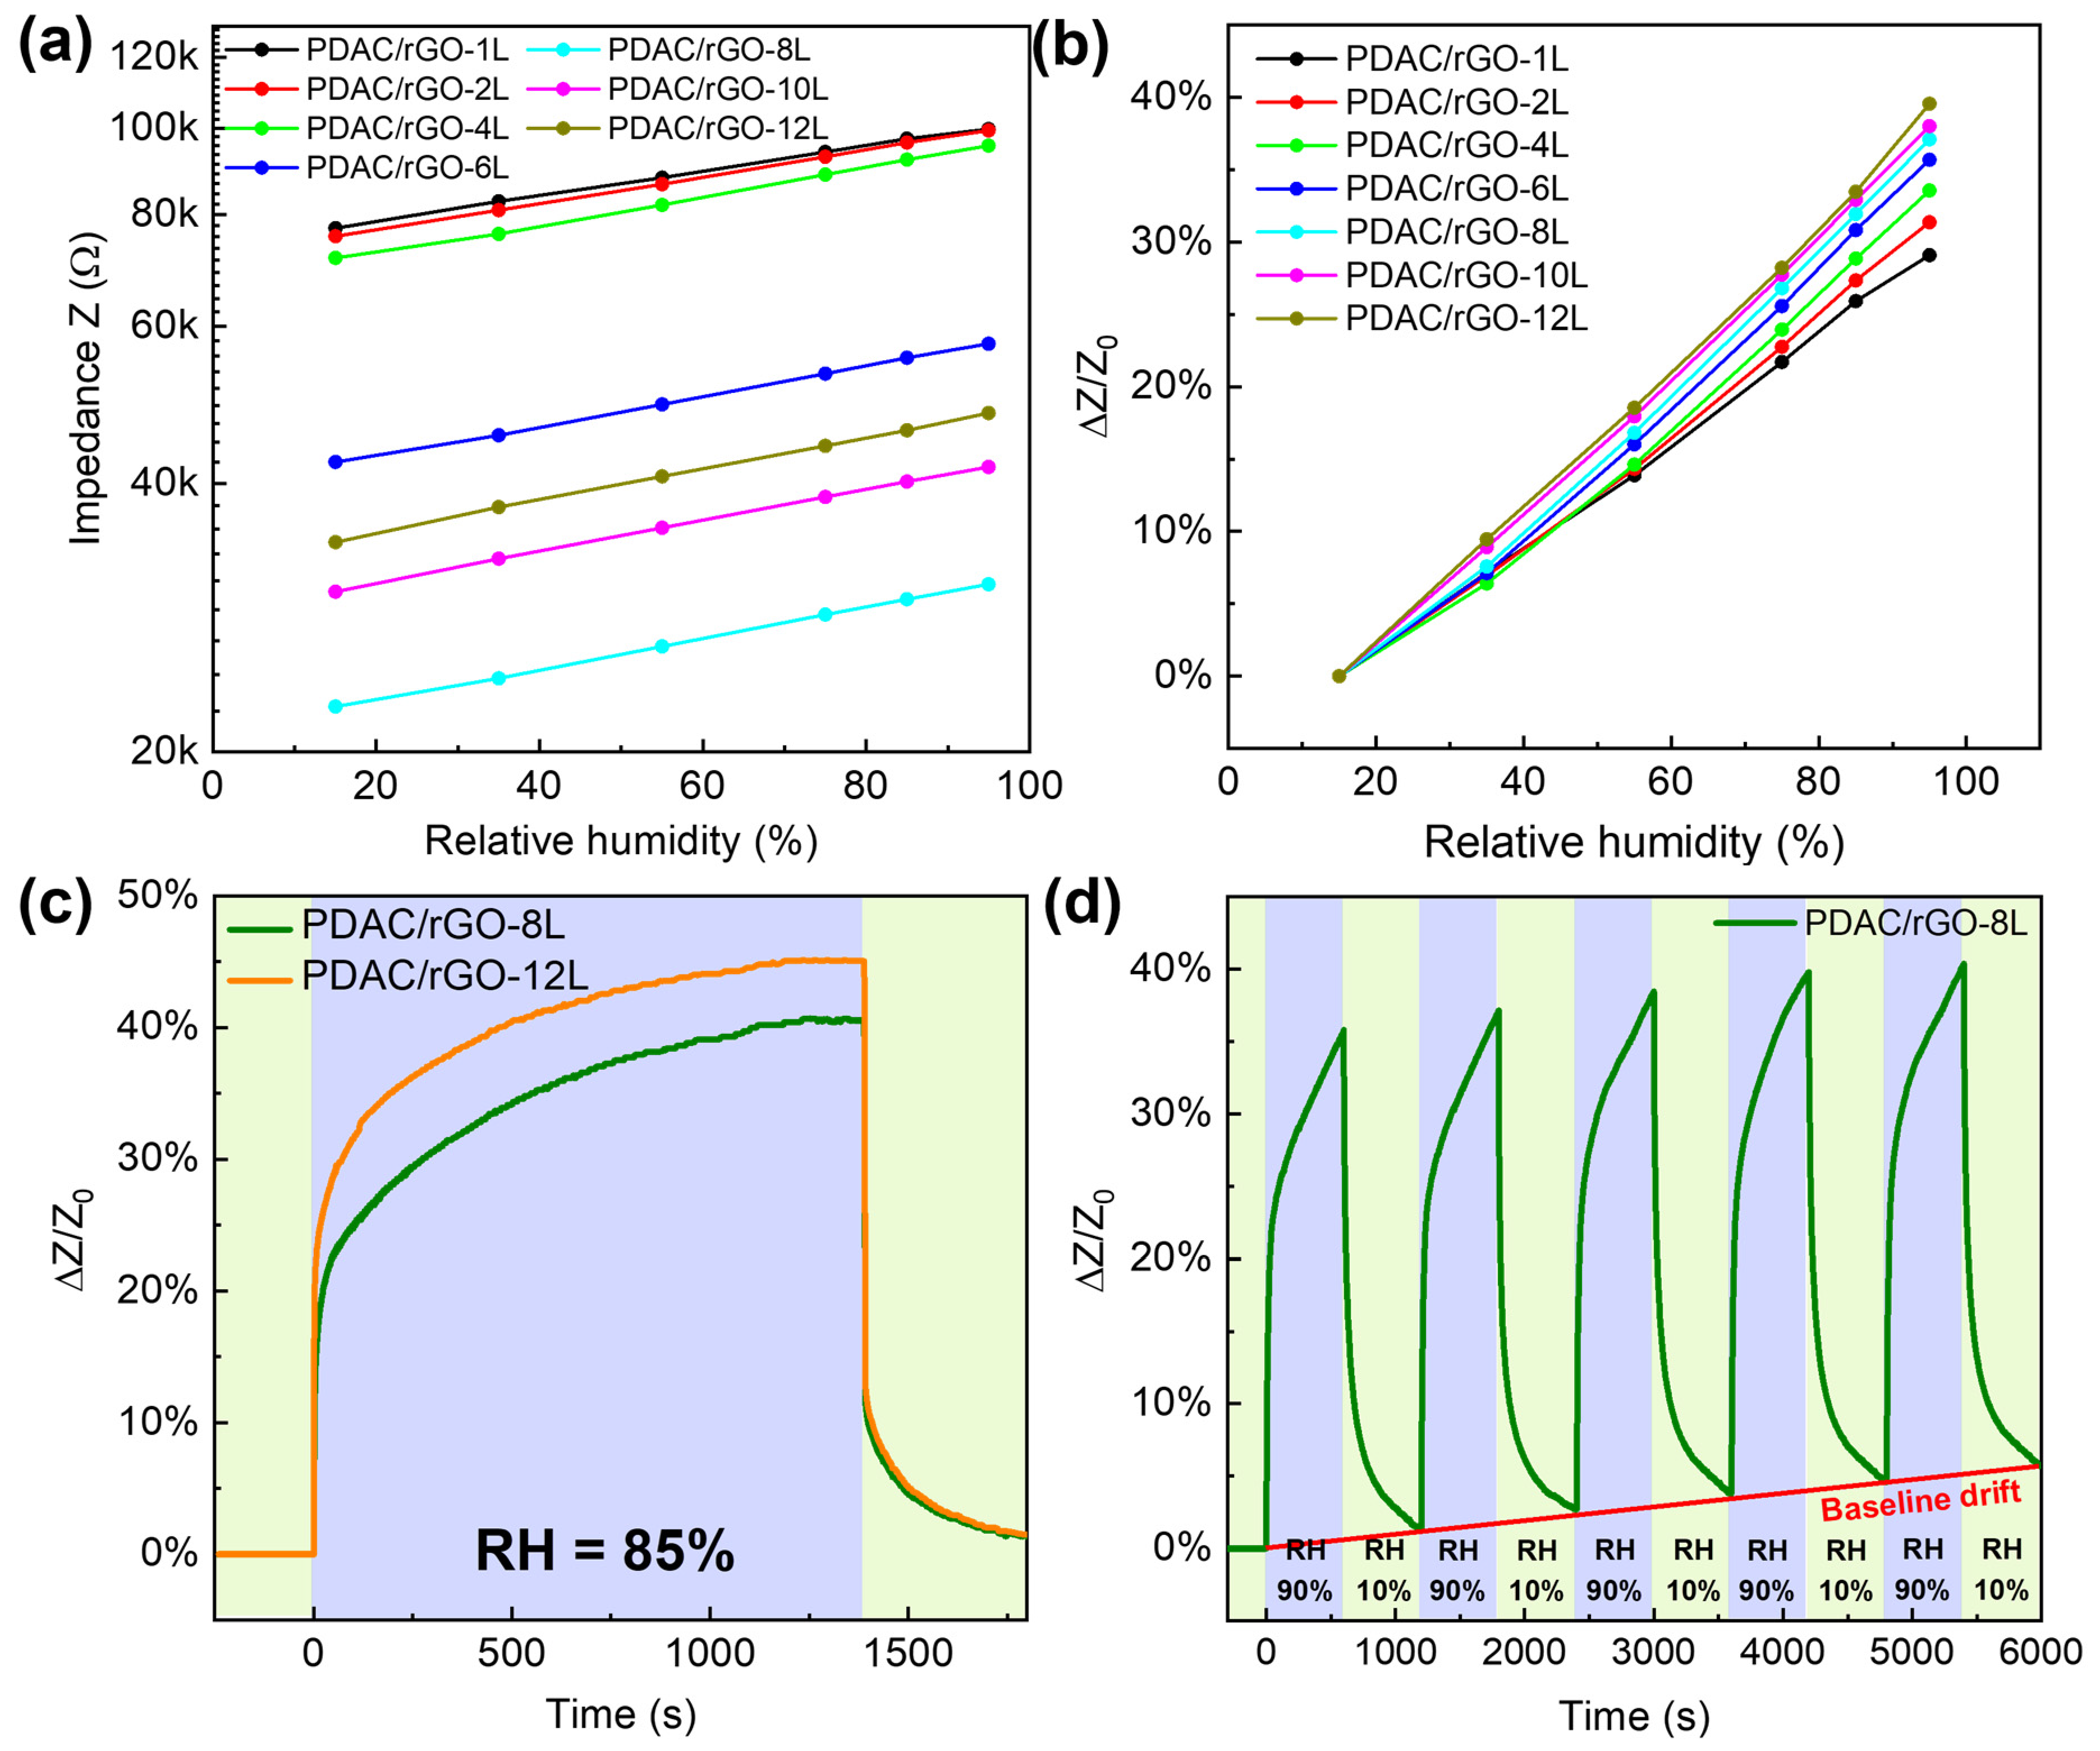
3.3. PDAC/rGO-Composites for Relative Humidity Measurements
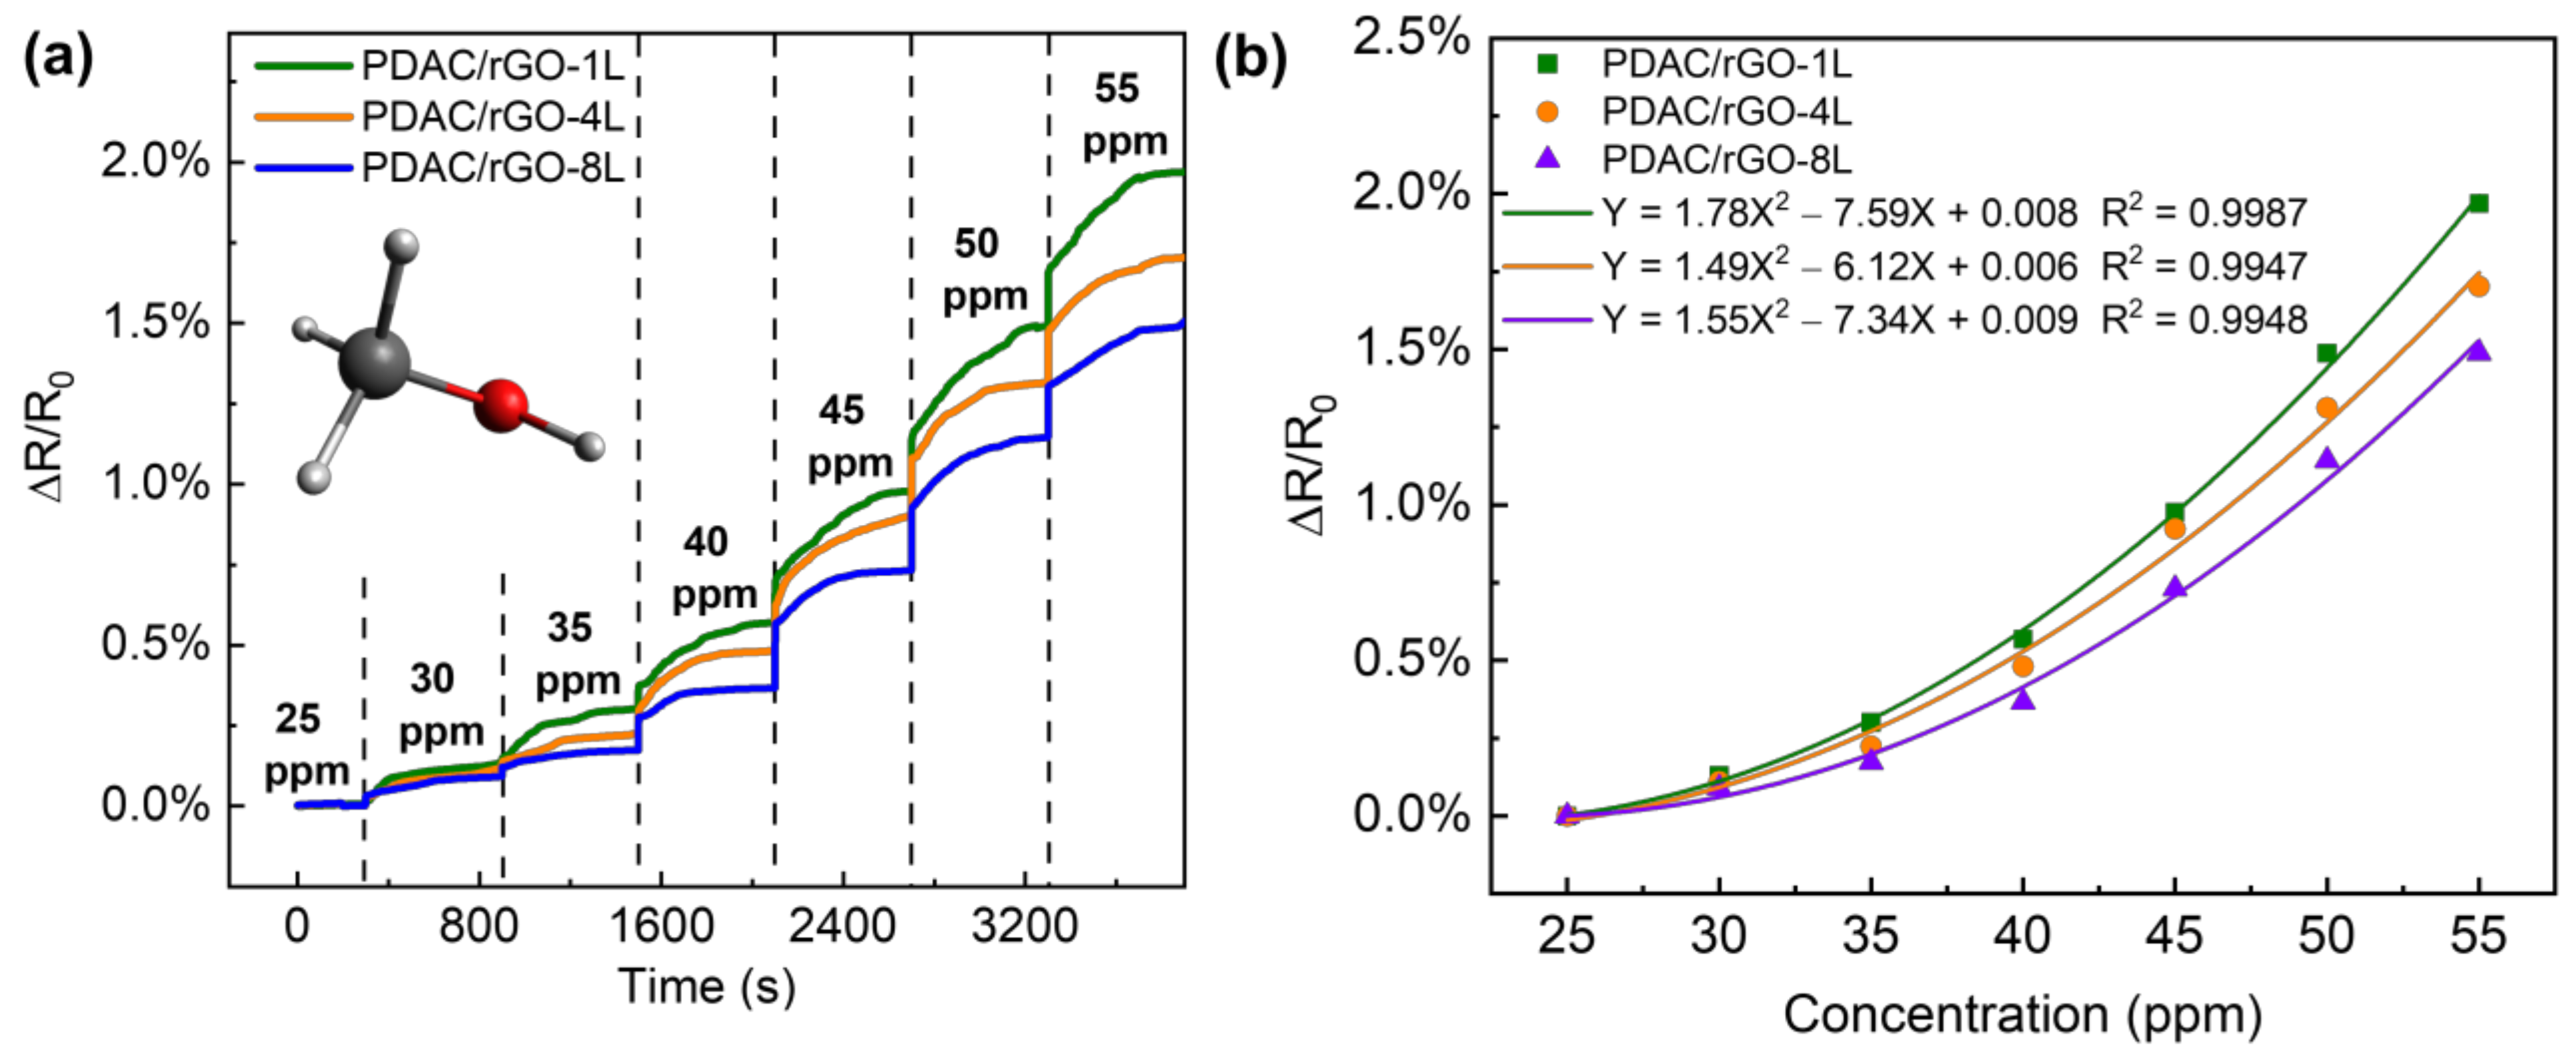
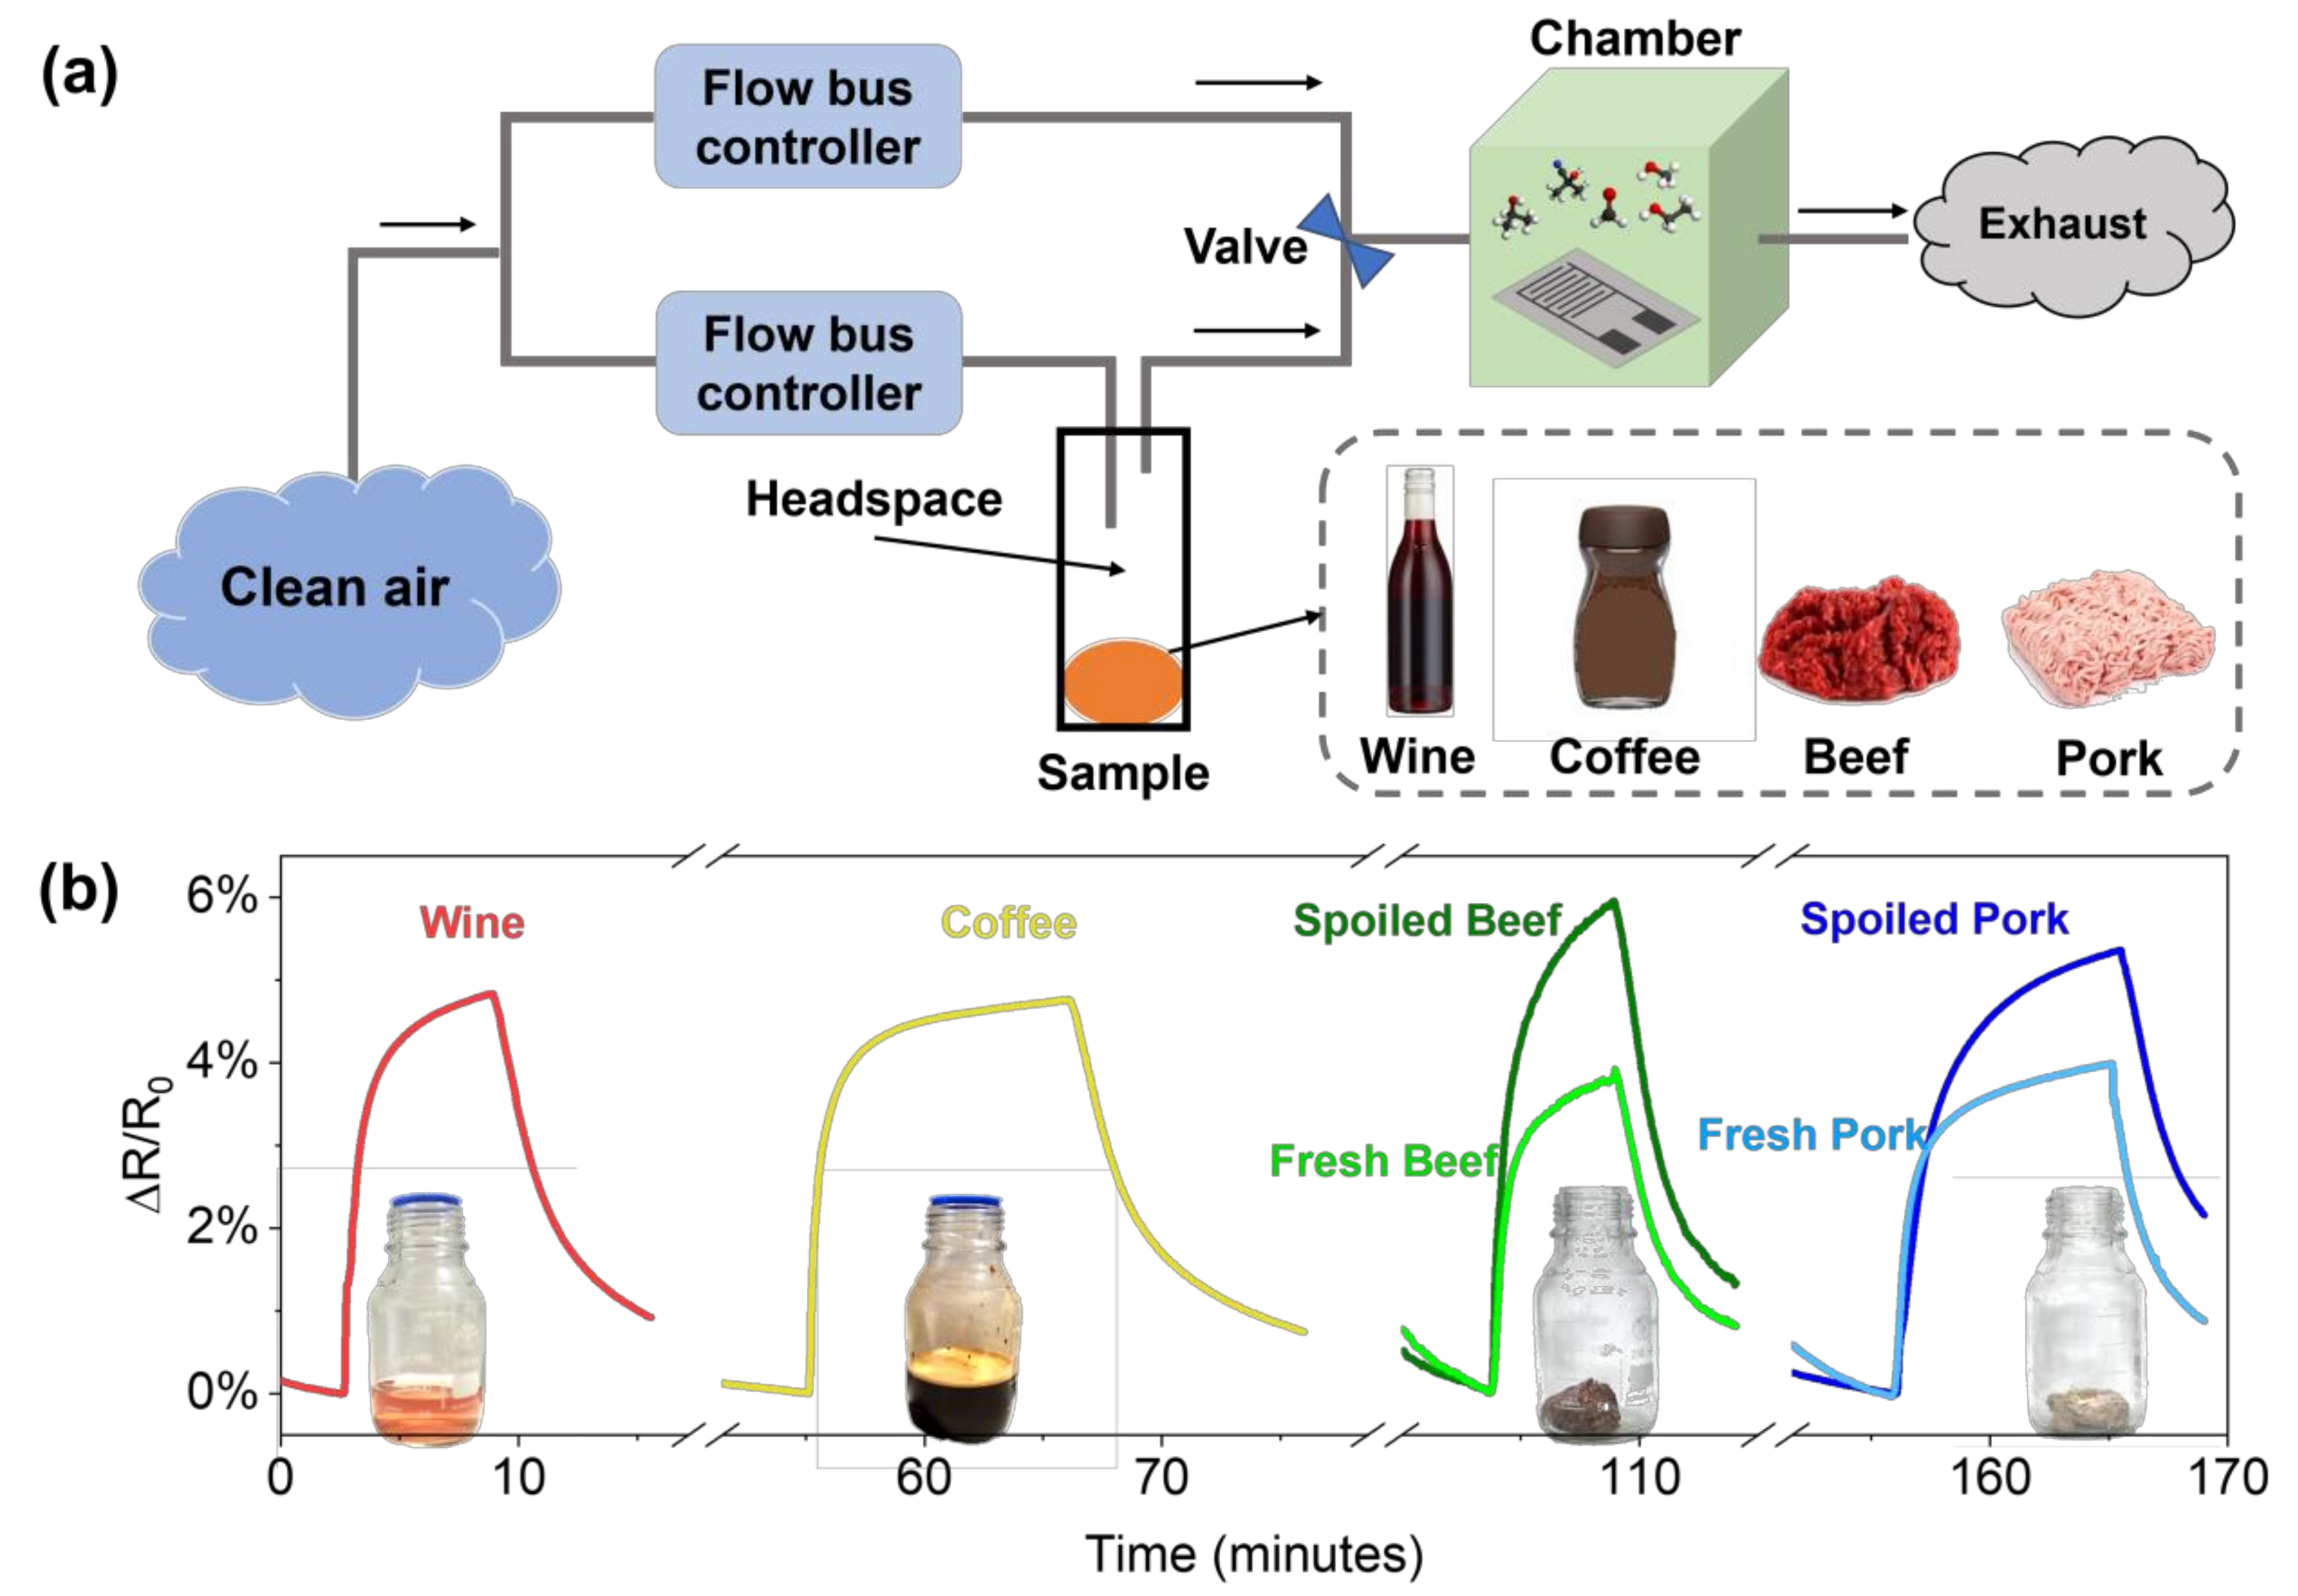
3.4. PDAC/rGO-Composites for VOCs Measurements
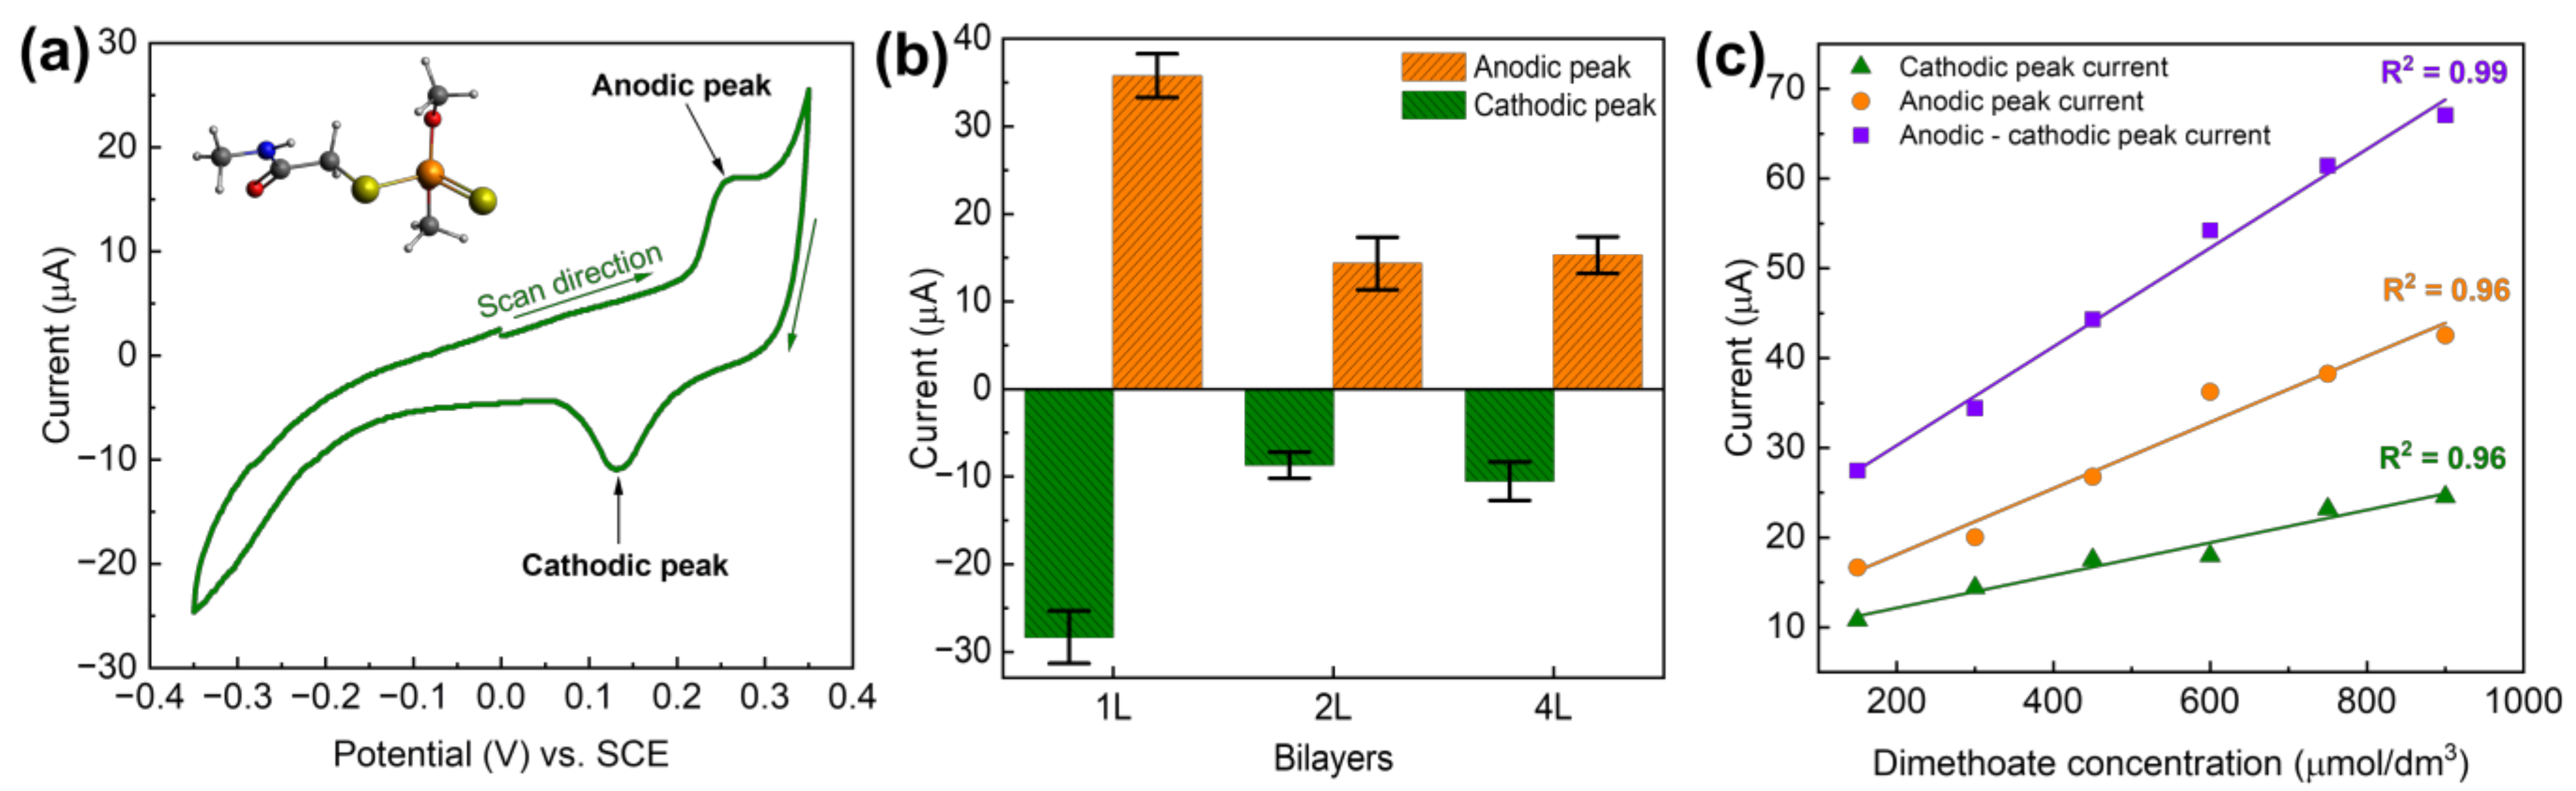
3.5. PDAC/rGO-Composites as Electrochemical Sensors for Organophosphate Pesticides
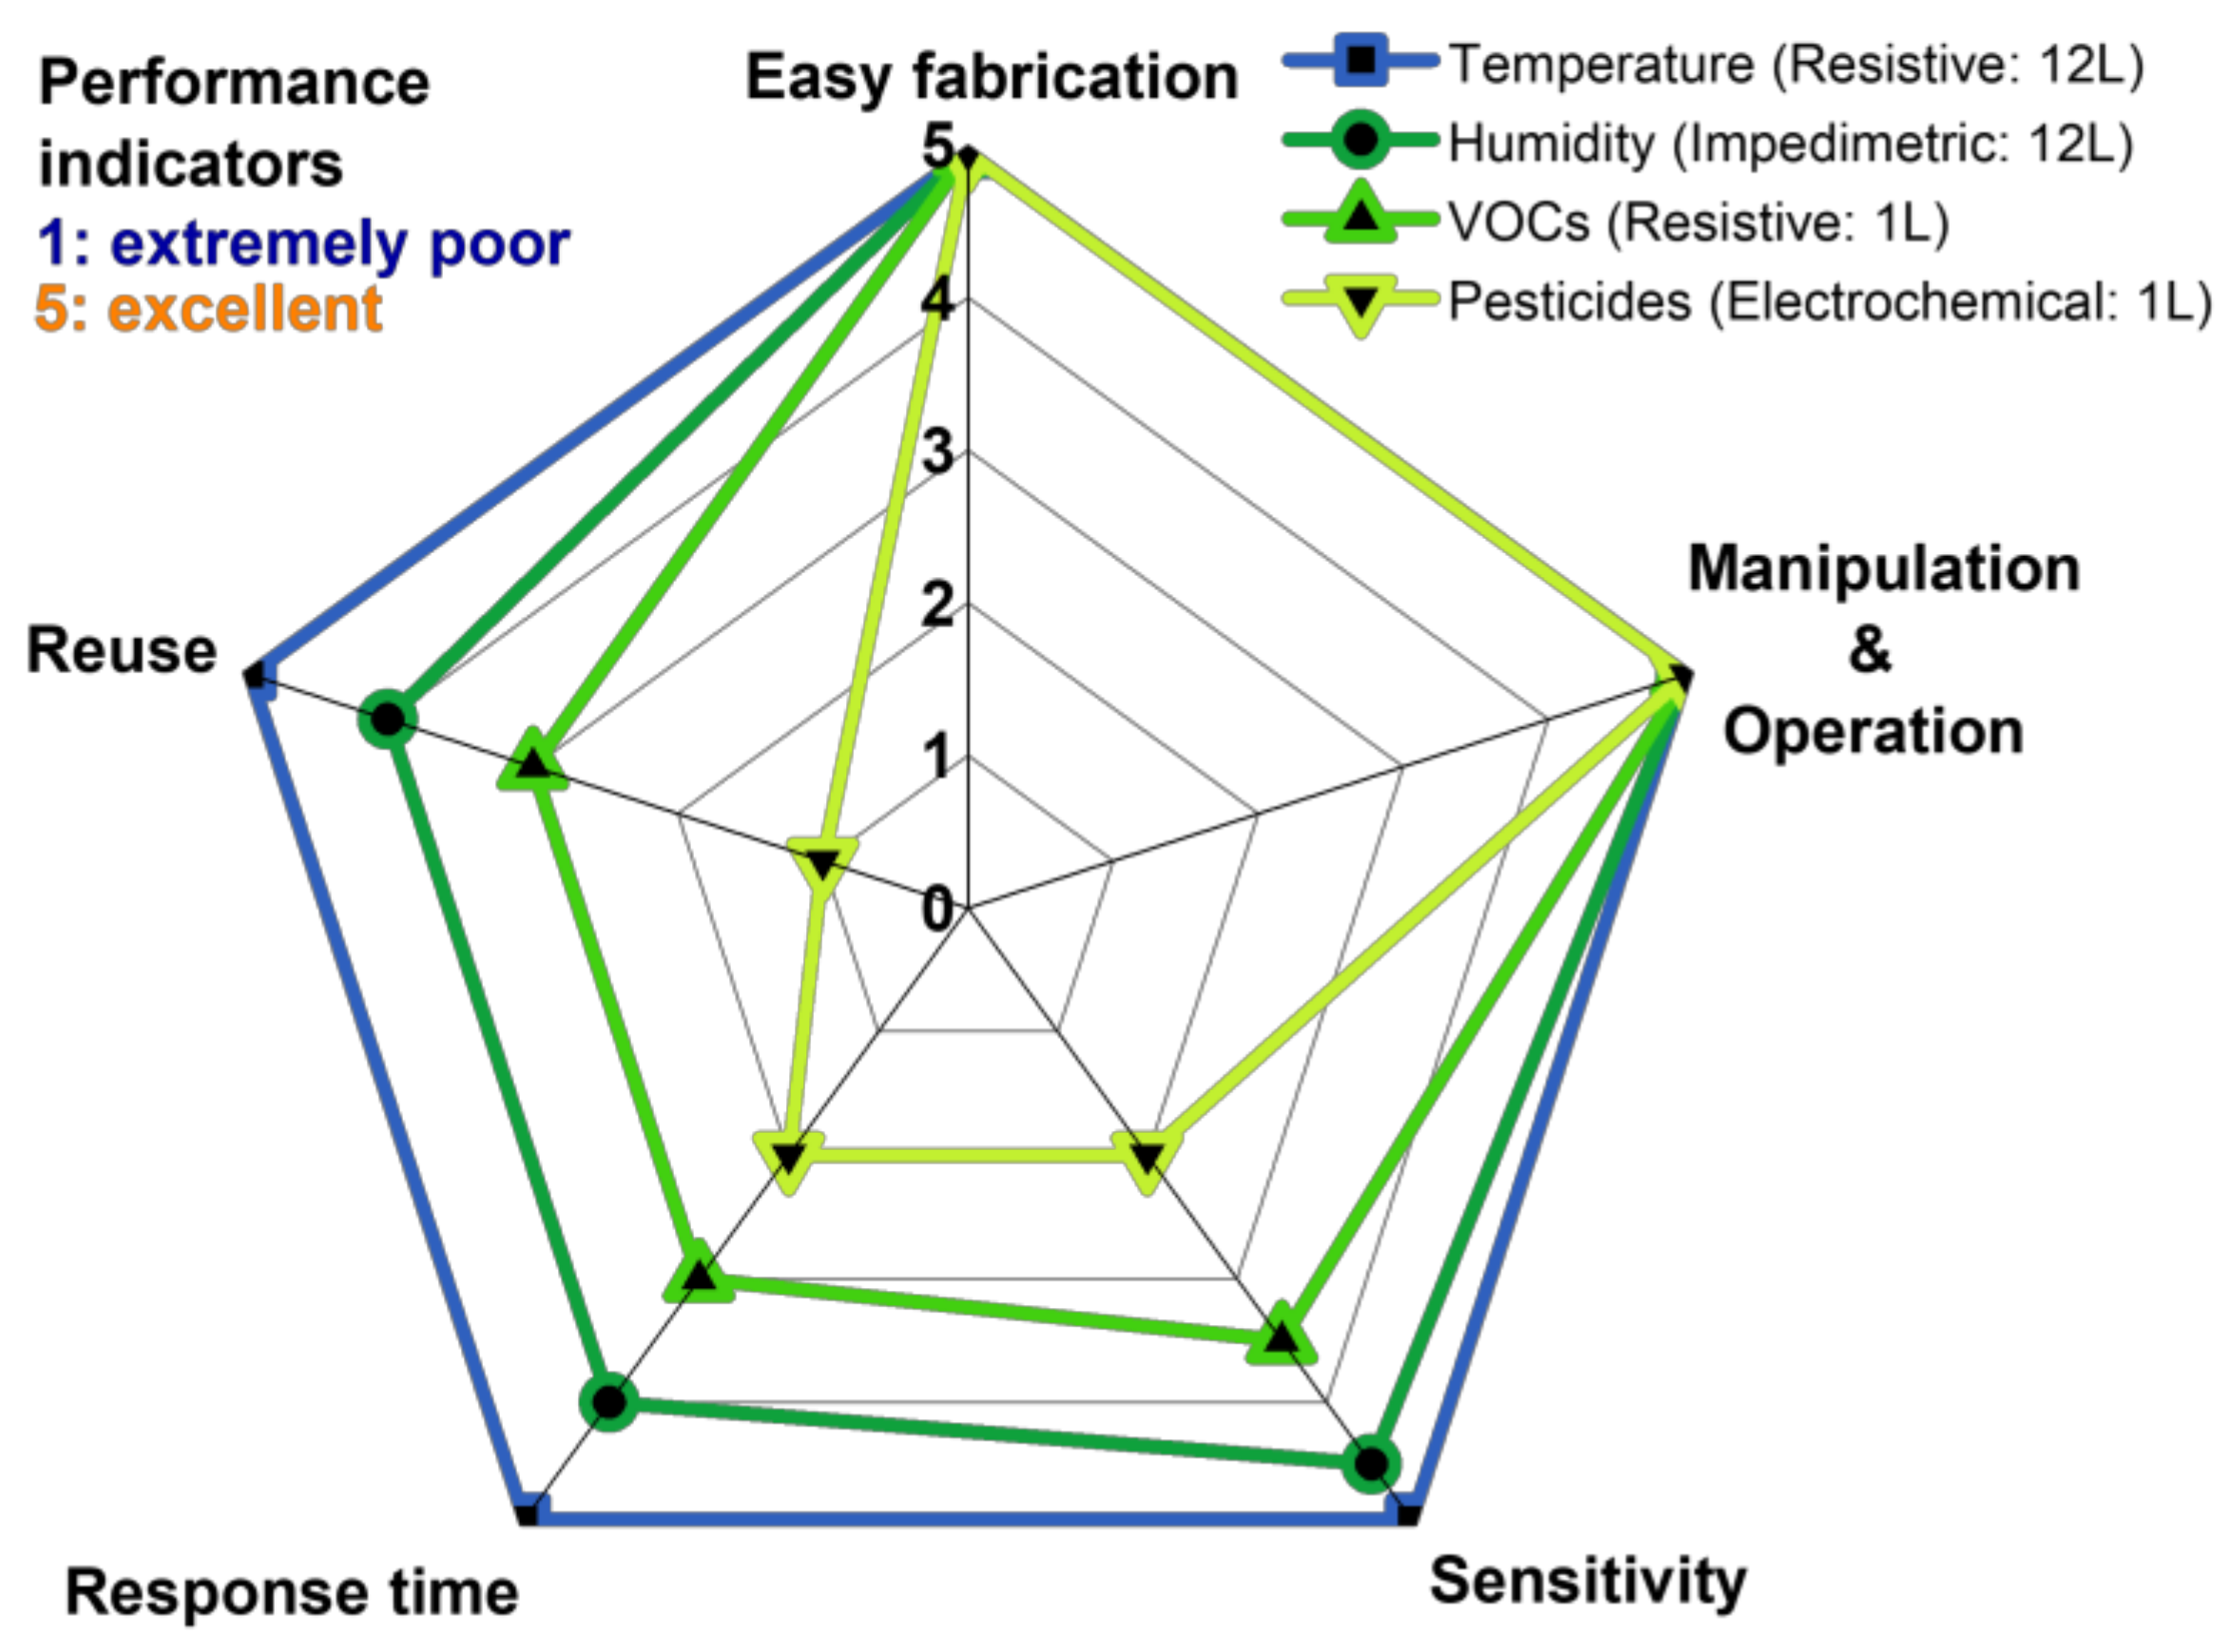
3.6. Critical Evaluation of Sensors’ Properties
4. Conclusions
Supplementary Materials
Author Contributions
Funding
Data Availability Statement
Acknowledgments
Conflicts of Interest
References
- The State of Food Insecurity in the World 2014—Food and Agricultural Organization of the United Nations. Available online: https://www.fao.org/3/i4030e/i4030e.pdf (accessed on 22 November 2022).
- Vera Zambrano, M.; Dutta, B.; Mercer, D.G.; MacLean, H.L.; Touchie, M.F. Assessment of Moisture Content Measurement Methods of Dried Food Products in Small-Scale Operations in Developing Countries: A Review. Trends Food Sci. Technol. 2019, 88, 484–496. [Google Scholar] [CrossRef]
- Bourdichon, F.; Betts, R.; Dufour, C.; Fanning, S.; Farber, J.; McClure, P.; Stavropoulou, D.A.; Wemmenhove, E.; Zwietering, M.H.; Winkler, A. Processing Environment Monitoring in Low Moisture Food Production Facilities: Are We Looking for the Right Microorganisms? Int. J. Food Microbiol. 2021, 356, 109351. [Google Scholar] [CrossRef] [PubMed]
- Global Food Losses and Food Waste—Food and Agricultural Organization of the United Nations. Available online: http://www.fao.org/docrep/014/mb060e/mb060e00.pdf (accessed on 22 November 2022).
- Cui, Y.; Zhang, H.; Zhang, J.; Lv, B.; Xie, B. The Emission of Volatile Organic Compounds during the Initial Decomposition Stage of Food Waste and Its Relationship with the Bacterial Community. Environ. Technol. Innov. 2022, 27, 102443. [Google Scholar] [CrossRef]
- Narenderan, S.T.; Meyyanathan, S.N.; Babu, B. Review of Pesticide Residue Analysis in Fruits and Vegetables. Pre-Treatment, Extraction and Detection Techniques. Food Res. Int. 2020, 133, 109141. [Google Scholar] [CrossRef] [PubMed]
- Arman Kuzubasoglu, B.; Kursun Bahadir, S. Flexible Temperature Sensors: A Review. Sens. Actuators A Phys. 2020, 315, 112282. [Google Scholar] [CrossRef]
- Lee, C.-Y.; Lee, G.-B. Humidity Sensors: A Review. Sens. Lett. 2005, 3, 1–15. [Google Scholar] [CrossRef]
- Galstyan, V.; D’Arco, A.; Di Fabrizio, M.; Poli, N.; Lupi, S.; Comini, E. Detection of Volatile Organic Compounds: From Chemical Gas Sensors to Terahertz Spectroscopy. Rev. Anal. Chem. 2021, 40, 33–57. [Google Scholar] [CrossRef]
- Lu, T.; Al-Hamry, A.; Rosolen, J.M.; Hu, Z.; Hao, J.; Wang, Y.; Adiraju, A.; Yu, T.; Matsubara, E.Y.; Kanoun, O. Flexible Impedimetric Electronic Nose for High-Accurate Determination of Individual Volatile Organic Compounds by Tuning the Graphene Sensitive Properties. Chemosensors 2021, 9, 360. [Google Scholar] [CrossRef]
- Trigona, C.; Lu, T.; Talbi, M.; Baglio, S.; Al-Hamry, A.; Garcia-Martinez, C.; Kanoun, O. MEMS Based on Chitosan—Tetrasulfonated Copper Phthalocyanine Composite for Detection of Ethanol Vapor in Air. In Proceedings of the 2022 IEEE International Workshop on Metrology for Industry 4.0 & IoT (MetroInd4.0&IoT), Trento, Italy, 7 June 2022; pp. 240–244. [Google Scholar] [CrossRef]
- Lu, T.; Al-Hamry, A.; Hao, J.; Liu, Y.; Qu, Y.; Kanoun, O. Machine Learning-Based Multi-Level Fusion Framework for a Hybrid Voltammetric and Impedimetric Metal Ions Electronic Tongue. Chemosensors 2022, 10, 474. [Google Scholar] [CrossRef]
- Lu, T.; Al-Hamry, A.; Talbi, M.; Zhang, J.; Adiraju, A.; Hou, M.; Kanoun, O. Functionalized PEDOT:PSS Based Sensor Array for Determination of Metallic Ions in Smart Agriculture. In Proceedings of the 2021 6th International Conference on Nanotechnology for Instrumentation and Measurement (NanofIM), Opole, Poland, 25 November 2021; pp. 1–4. [Google Scholar] [CrossRef]
- Xiang, H.; Cai, Q.; Li, Y.; Zhang, Z.; Cao, L.; Li, K.; Yang, H. Sensors Applied for the Detection of Pesticides and Heavy Metals in Freshwaters. J. Sens. 2020, 2020, 8503491. [Google Scholar] [CrossRef]
- Kanoun, O.; Lazarević-Pašti, T.; Pašti, I.; Nasraoui, S.; Talbi, M.; Brahem, A.; Adiraju, A.; Sheremet, E.; Rodriguez, R.D.; Ben Ali, M.; et al. A Review of Nanocomposite-Modified Electrochemical Sensors for Water Quality Monitoring. Sensors 2021, 21, 4131. [Google Scholar] [CrossRef]
- Basu, J.; Basu, J.K.; Bhattacharyya, T.K. The Evolution of Graphene-Based Electronic Devices. Int. J. Smart Nano Mater. 2010, 1, 201–223. [Google Scholar] [CrossRef]
- Mukherjee, R.; Thomas, A.V.; Datta, D.; Singh, E.; Li, J.; Eksik, O.; Shenoy, V.B.; Koratkar, N. Defect-Induced Plating of Lithium Metal within Porous Graphene Networks. Nat. Commun. 2014, 5, 3710. [Google Scholar] [CrossRef] [Green Version]
- Mahmood, N.; Zhang, C.; Yin, H.; Hou, Y. Graphene-Based Nanocomposites for Energy Storage and Conversion in Lithium Batteries, Supercapacitors and Fuel Cells. J. Mater. Chem. A 2014, 2, 15–32. [Google Scholar] [CrossRef] [Green Version]
- Mukherjee, R.; Thomas, A.V.; Krishnamurthy, A.; Koratkar, N. Photothermally Reduced Graphene as High-Power Anodes for Lithium-Ion Batteries. ACS Nano 2012, 6, 7867–7878. [Google Scholar] [CrossRef]
- Richardson, J.J.; Cui, J.; Björnmalm, M.; Braunger, J.A.; Ejima, H.; Caruso, F. Innovation in Layer-by-Layer Assembly. Chem. Rev. 2016, 116, 14828–14867. [Google Scholar] [CrossRef] [Green Version]
- Lipton, J.; Weng, G.-M.; Röhr, J.A.; Wang, H.; Taylor, A.D. Layer-by-Layer Assembly of Two-Dimensional Materials: Meticulous Control on the Nanoscale. Matter 2020, 2, 1148–1165. [Google Scholar] [CrossRef]
- Lee, D.; Cui, T. Layer-by-Layer Nano Self-Assembly of PH Sensors Based on Polyelectrolytes and Carboxylated Carbon Nanotubes. ECS Trans. 2008, 16, 3–9. [Google Scholar] [CrossRef]
- Nohria, R.; Khillan, R.K.; Su, Y.; Dikshit, R.; Lvov, Y.; Varahramyan, K. Humidity Sensor Based on Ultrathin Polyaniline Film Deposited Using Layer-by-Layer Nano-Assembly. Sens. Actuators B Chem. 2006, 114, 218–222. [Google Scholar] [CrossRef]
- Zhang, D.; Wang, D.; Li, P.; Zhou, X.; Zong, X.; Dong, G. Facile Fabrication of High-Performance QCM Humidity Sensor Based on Layer-by-Layer Self-Assembled Polyaniline/Graphene Oxide Nanocomposite Film. Sens. Actuators B Chem. 2018, 255, 1869–1877. [Google Scholar] [CrossRef]
- Ren, X.; Zhang, D.; Wang, D.; Li, Z.; Liu, S. Quartz Crystal Microbalance Sensor for Humidity Sensing Based on Layer-by-Layer Self-Assembled PDDAC/Graphene Oxide Film. IEEE Sens. J. 2018, 18, 9471–9476. [Google Scholar] [CrossRef]
- Liu, Z.; Yang, T.; Dong, Y.; Wang, X. A Room Temperature VOCs Gas Sensor Based on a Layer by Layer Multi-Walled Carbon Nanotubes/Poly-Ethylene Glycol Composite. Sensors 2018, 18, 3113. [Google Scholar] [CrossRef] [PubMed] [Green Version]
- Su, P.-G.; Shieh, H.-C. Flexible NO2 Sensors Fabricated by Layer-by-Layer Covalent Anchoring and in Situ Reduction of Graphene Oxide. Sens. Actuators B Chem. 2014, 190, 865–872. [Google Scholar] [CrossRef]
- Zhang, D.; Jiang, C.; Sun, Y. Room-Temperature High-Performance Ammonia Gas Sensor Based on Layer-by-Layer Self-Assembled Molybdenum Disulfide/Zinc Oxide Nanocomposite Film. J. Alloys Compd. 2017, 698, 476–483. [Google Scholar] [CrossRef]
- Ke, F.; Song, F.; Zhang, H.; Xu, J.; Wang, H.; Chen, Y. Layer-by-Layer Assembly for All-Graphene Coated Conductive Fibers toward Superior Temperature Sensitivity and Humidity Independence. Compos. Part B Eng. 2020, 200, 108253. [Google Scholar] [CrossRef]
- Zhang, D.; Tong, J.; Xia, B. Humidity-Sensing Properties of Chemically Reduced Graphene Oxide/Polymer Nanocomposite Film Sensor Based on Layer-by-Layer Nano Self-Assembly. Sens. Actuators B Chem. 2014, 197, 66–72. [Google Scholar] [CrossRef]
- Gross, M.A.; Sales, M.J.A.; Soler, M.A.G.; Pereira-da-Silva, M.A.; da Silva, M.F.P.; Paterno, L.G. Reduced Graphene Oxide Multilayers for Gas and Liquid Phases Chemical Sensing. RSC Adv. 2014, 4, 17917. [Google Scholar] [CrossRef]
- Liu, S.; Yan, J.; He, G.; Zhong, D.; Chen, J.; Shi, L.; Zhou, X.; Jiang, H. Layer-by-Layer Assembled Multilayer Films of Reduced Graphene Oxide/Gold Nanoparticles for the Electrochemical Detection of Dopamine. J. Electroanal. Chem. 2012, 672, 40–44. [Google Scholar] [CrossRef]
- Yang, R.; Zhang, W.; Tiwari, N.; Yan, H.; Li, T.; Cheng, H. Multimodal Sensors with Decoupled Sensing Mechanisms. Adv. Sci. 2022, 9, 2202470. [Google Scholar] [CrossRef]
- Brahem, A.; Al-Hamry, A.; Gross, M.A.; Paterno, L.G.; Ali, M.B.; Kanoun, O. Stability Enhancement of Laser-Scribed Reduced Graphene Oxide Electrodes Functionalized by Iron Oxide/Reduced Graphene Oxide Nanocomposites for Nitrite Sensors. J. Compos. Sci. 2022, 6, 221. [Google Scholar] [CrossRef]
- Ega, T.K.; Al-Hamry, A.; Kanoun, O.; Lazarevic-Pasti, T.; Bogdanovic, D.B.; Pasti, I.A.; Rodriguez, R.D.; Sheremet, E.; Paterno, L.G. Detection of Dimethoate Pesticide Using Layer by Layer Deposition of PDAC/GO on Ag Electrode. In Proceedings of the 2019 16th International Multi-Conference on Systems, Signals & Devices (SSD), Istanbul, Turkey, 21–24 March 2019; pp. 621–625. [Google Scholar]
- Al-Hamry, A.; Kang, H.; Sowade, E.; Dzhagan, V.; Rodriguez, R.D.; Müller, C.; Zahn, D.R.T.; Baumann, R.R.; Kanoun, O. Tuning the Reduction and Conductivity of Solution-Processed Graphene Oxide by Intense Pulsed Light. Carbon 2016, 102, 236–244. [Google Scholar] [CrossRef]
- Ferrari, A.C.; Robertson, J. Interpretation of Raman Spectra of Disordered and Amorphous Carbon. Phys. Rev. B 2000, 61, 14095–14107. [Google Scholar] [CrossRef] [Green Version]
- Sarker, A.K.; Hong, J.-D. Layer-by-Layer Self-Assembled Multilayer Films Composed of Graphene/Polyaniline Bilayers: High-Energy Electrode Materials for Supercapacitors. Langmuir 2012, 28, 12637–12646. [Google Scholar] [CrossRef]
- Al-Hamry, A.; Kanoun, O. Humidity sensitivity investigation of reduced graphene oxide by impedance spectroscopy. In Impedance Spectroscopy; Kanoun, O., Ed.; De Gruyter: Berlin, Germany, 2018; pp. 49–52. ISBN 978-3-11-055892-0. [Google Scholar]
- Al-Hamry, A.; Ega, T.K.; Pasti, I.A.; Bajuk-Bogdanovic, D.; Lazarevic-Pasti, T.; Rodriguez, R.D.; Sheremet, E.; Kanoun, O. Electrochemical Sensor Based on Reduced Graphene Oxide/PDAC for Dimethoate Pesticide Detection. In Proceedings of the 2019 5th International Conference on Nanotechnology for Instrumentation and Measurement (NanofIM), Sfax, Tunisia, 30 October 2019; pp. 1–7. [Google Scholar] [CrossRef]
- Jung, H.; Park, J. Adherable Temperature Sensor to a Porous Structure of Fiber via Reduced Graphene Oxide and Poly(Diallyldimethylammonium Chloride) Complex. J. Micromech. Microeng. 2022, 32, 045001. [Google Scholar] [CrossRef]
- Liu, G.; Tan, Q.; Kou, H.; Zhang, L.; Wang, J.; Lv, W.; Dong, H.; Xiong, J. A Flexible Temperature Sensor Based on Reduced Graphene Oxide for Robot Skin Used in Internet of Things. Sensors 2018, 18, 1400. [Google Scholar] [CrossRef] [Green Version]
- Zhang, C.; Chen, Y.; Li, H.; Tian, R.; Liu, H. Facile Fabrication of Three-Dimensional Lightweight RGO/PPy Nanotube/Fe 3 O 4 Aerogel with Excellent Electromagnetic Wave Absorption Properties. ACS Omega 2018, 3, 5735–5743. [Google Scholar] [CrossRef]
- Muchharla, B.; Narayanan, T.N.; Balakrishnan, K.; Ajayan, P.M.; Talapatra, S. Temperature Dependent Electrical Transport of Disordered Reduced Graphene Oxide. 2D Mater. 2014, 1, 011008. [Google Scholar] [CrossRef]
- Cavallo, P.; Acevedo, D.F.; Fuertes, M.C.; Soler-Illia, G.J.A.A.; Barbero, C.A. Understanding the Sensing Mechanism of Polyaniline Resistive Sensors. Effect of Humidity on Sensing of Organic Volatiles. Sens. Actuators B Chem. 2015, 210, 574–580. [Google Scholar] [CrossRef]
- Liu, L.; Ye, X.; Wu, K.; Zhou, Z.; Lee, D.; Cui, T. Humidity Sensitivity of Carbon Nanotube and Poly (Dimethyldiallylammonium Chloride) Composite Films. IEEE Sens. J. 2009, 9, 1308–1314. [Google Scholar] [CrossRef]
- Al-Hamry, A.; Zubkova, T.; Baumann, R.; Kanoun, O.; Paterno, L.G.; Errachid, A. Sensitivity of Layer-by-Layer Deposited GO/PDAC to Volatile Organic Compounds. In Proceedings of the Tagungsband; AMA Service GmbH: Nürnberg, Germany, 2019; pp. 584–587. [Google Scholar] [CrossRef]
- Aghoutane, Y.; Diouf, A.; Österlund, L.; Bouchikhi, B.; El Bari, N. Development of a Molecularly Imprinted Polymer Electrochemical Sensor and Its Application for Sensitive Detection and Determination of Malathion in Olive Fruits and Oils. Bioelectrochemistry 2020, 132, 107404. [Google Scholar] [CrossRef]
- Fei, A.; Liu, Q.; Huan, J.; Qian, J.; Dong, X.; Qiu, B.; Mao, H.; Wang, K. Label-Free Impedimetric Aptasensor for Detection of Femtomole Level Acetamiprid Using Gold Nanoparticles Decorated Multiwalled Carbon Nanotube-Reduced Graphene Oxide Nanoribbon Composites. Biosens. Bioelectron. 2015, 70, 122–129. [Google Scholar] [CrossRef] [PubMed]
- Vuorinen, T.; Niittynen, J.; Kankkunen, T.; Kraft, T.M.; Mäntysalo, M. Inkjet-Printed Graphene/PEDOT:PSS Temperature Sensors on a Skin-Conformable Polyurethane Substrate. Sci. Rep. 2016, 6, 35289. [Google Scholar] [CrossRef] [PubMed] [Green Version]
- Pan, J.; Liu, S.; Zhang, H.; Lu, J. A Flexible Temperature Sensor Array with Polyaniline/Graphene–Polyvinyl Butyral Thin Film. Sensors 2019, 19, 4105. [Google Scholar] [CrossRef] [PubMed] [Green Version]
- Ozioko, O.; Kumaresan, Y.; Dahiya, R. Carbon Nanotube/PEDOT: PSS Composite-Based Flexible Temperature Sensor with Enhanced Response and Recovery Time. In Proceedings of the 2020 IEEE International Conference on Flexible and Printable Sensors and Systems (FLEPS), Manchester, UK, 16 August 2020; pp. 1–4. [Google Scholar] [CrossRef]


| Polymer | Nanomaterial | Target | Linear Range | Sensitivity | Response Time | Reference |
|---|---|---|---|---|---|---|
| PEDOT:PSS | Graphene | Temperature | 33–45 °C | 0.06 %/°C | 20 s | [50] |
| Polyaniline | Graphene | 25–80 °C | 1.2 %/°C | - | [51] | |
| PEDOT:PSS | CNT | 30–80 °C | 0.64 %/°C | 4.8 s | [52] | |
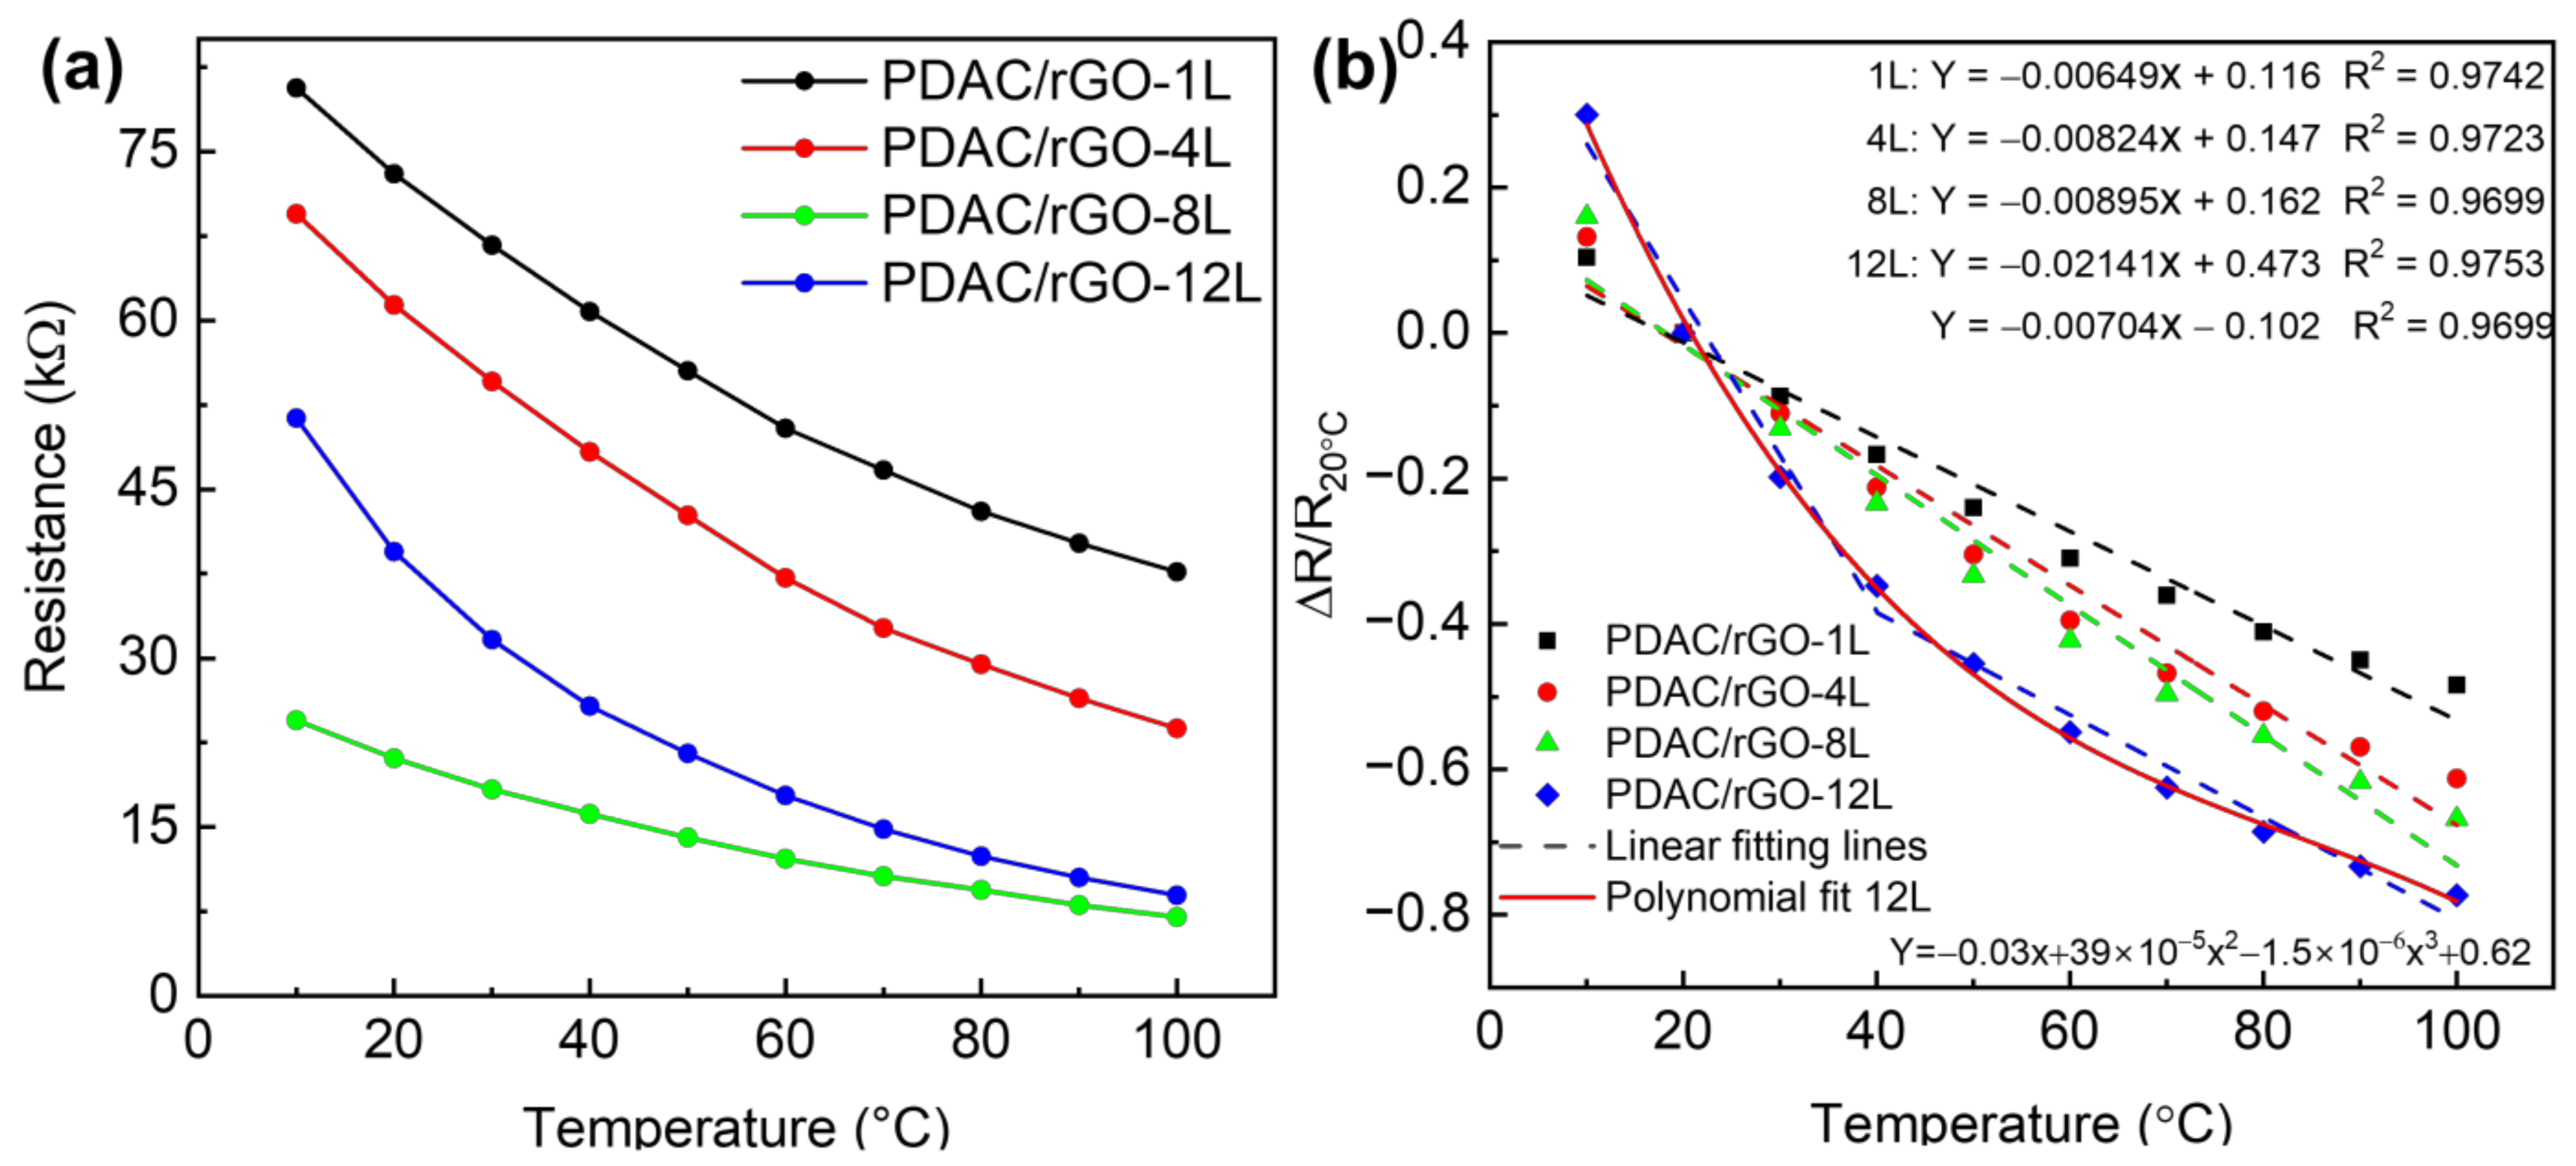
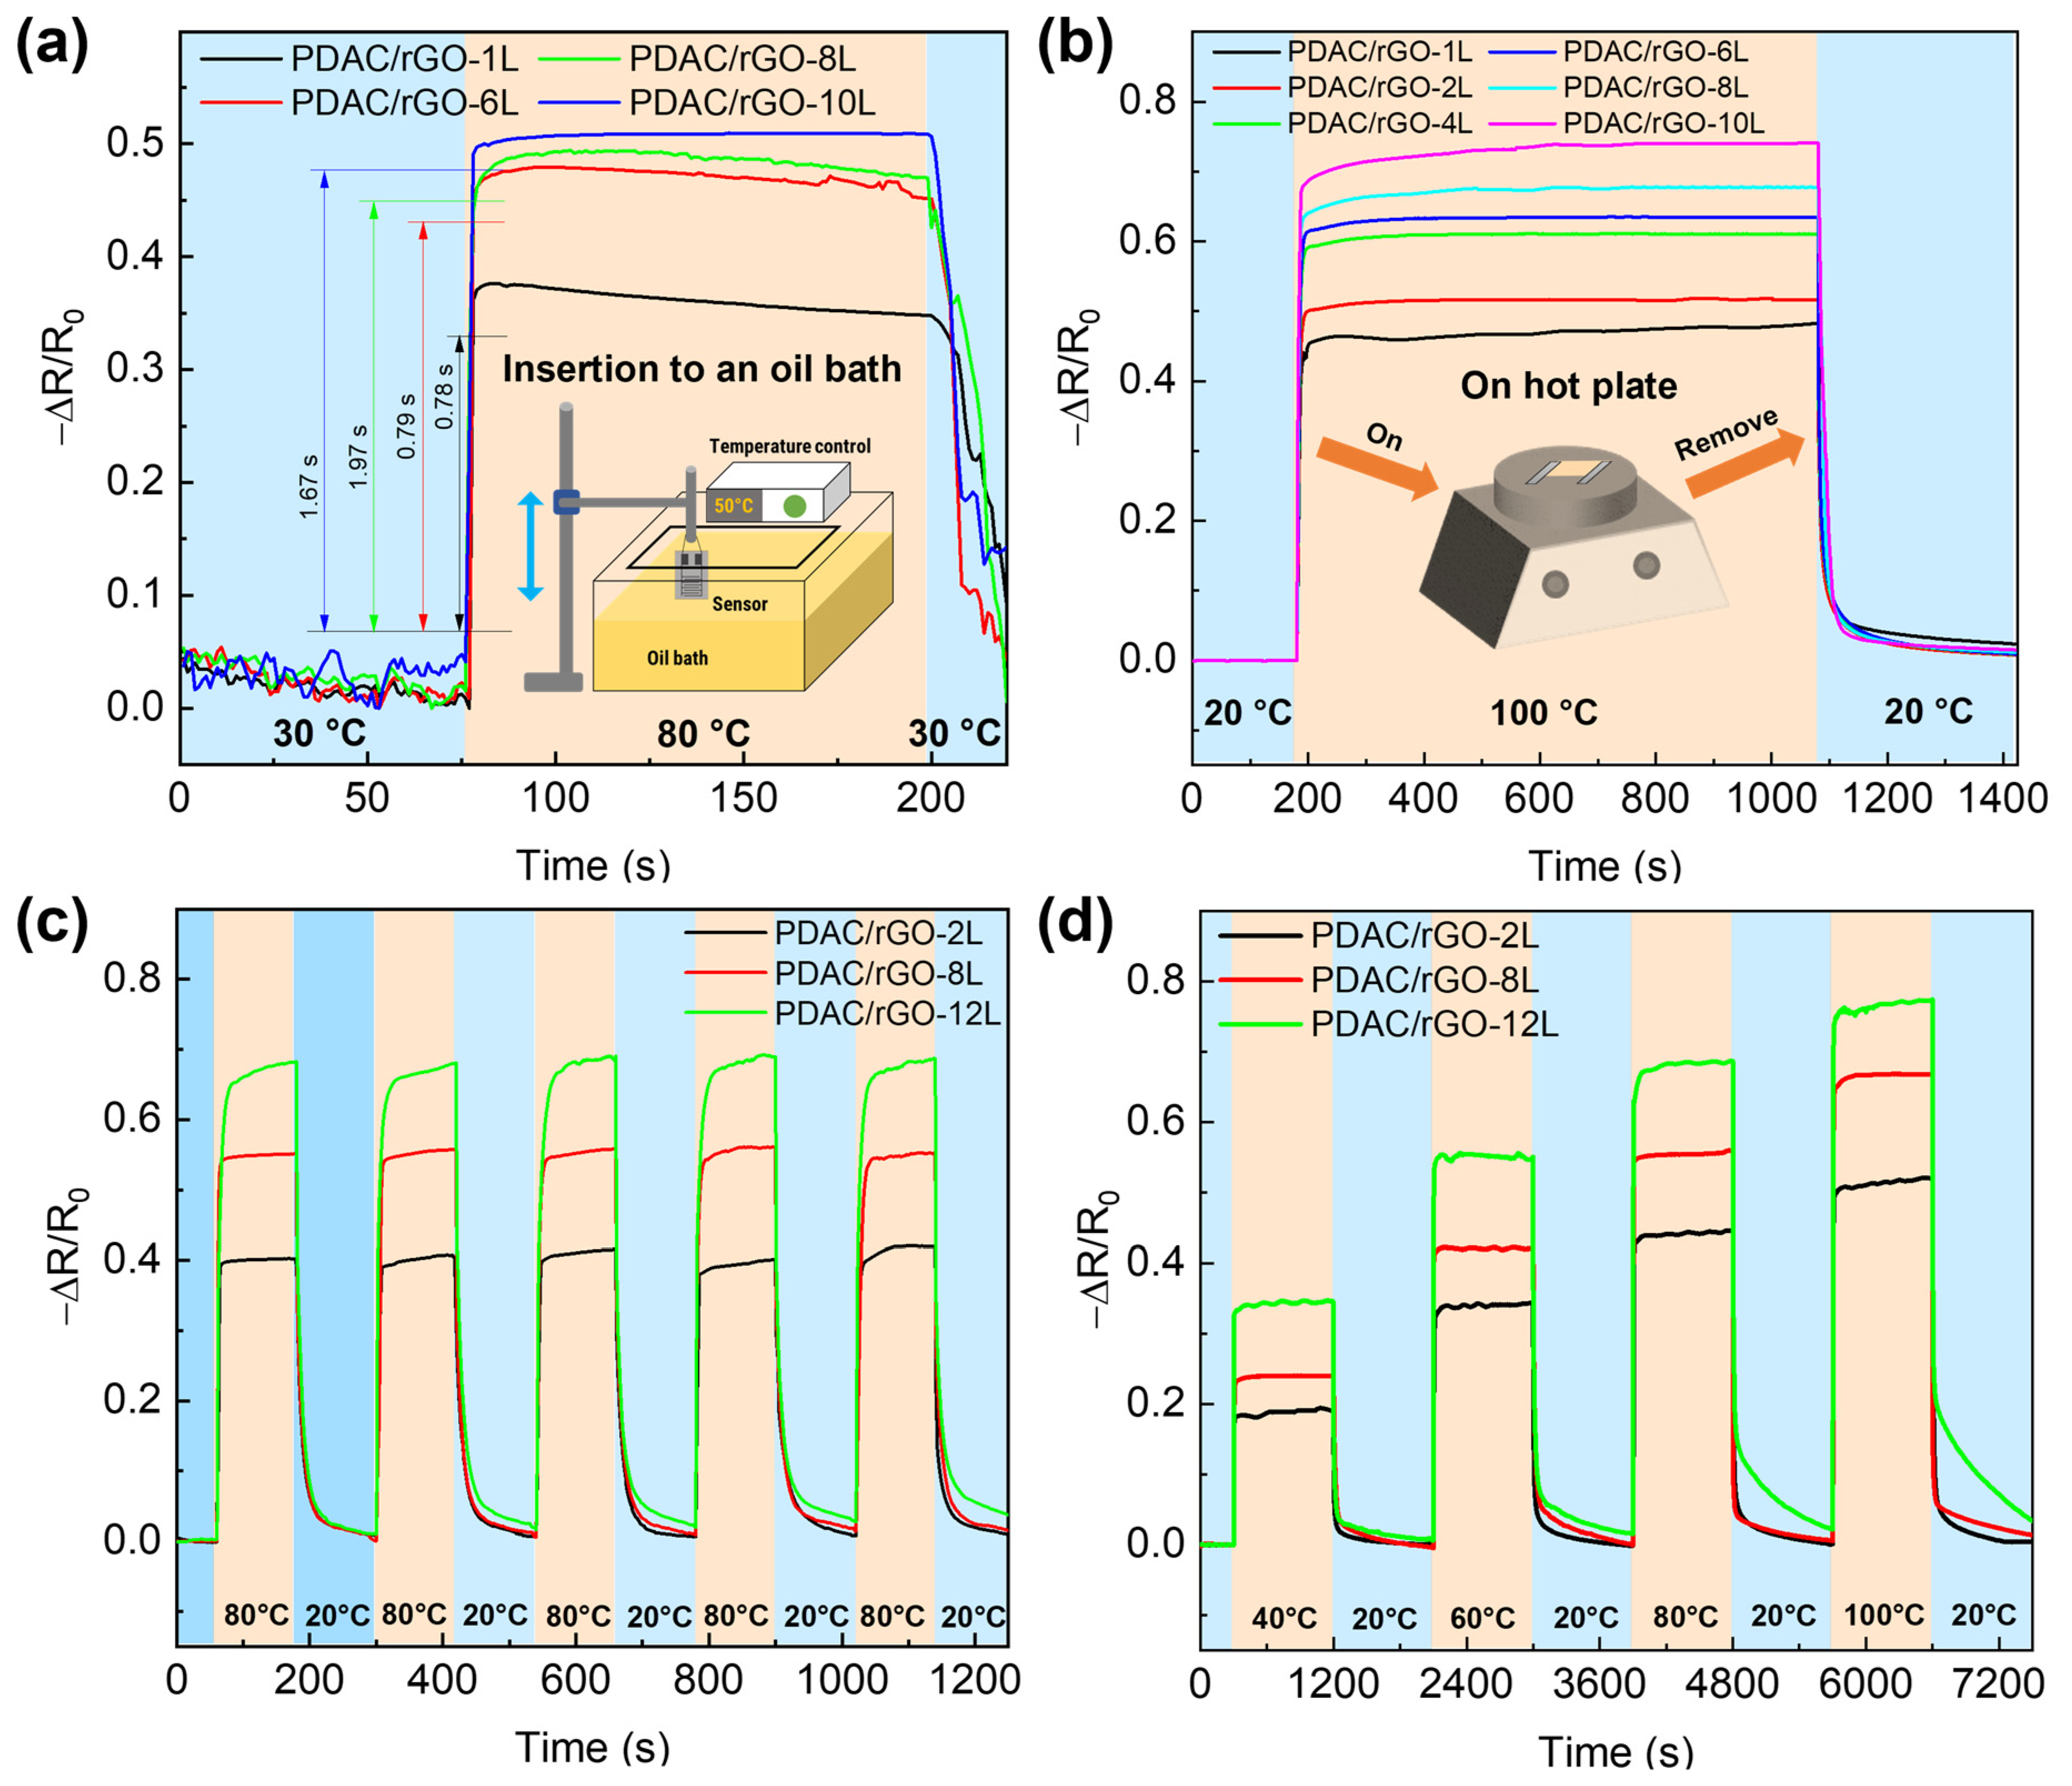
| PDAC | rGO | 10–100 °C | 0.7–2.1 %/°C | 0.78 s | This work *, ** | |
| S-PANI | - | Humidity | 50–90% | 60% (90% RH) | 15–27 s | [23] |
| PDDA | GO | 11–97% RH | 8.69–37.43% | 108–147 s | [30] | |
| PANI | GO | 11–97% RH | 20 Hz/% RH | 5–13 s | [24] | |
| PDDAC | GO | 11–97% RH | 25.4 Hz/% RH | 1–7 s | [25] | |
| PDAC | rGO | 15–95% RH | 46% (100% RH) | ~10 s | This work * | |
| PEG | MWCNT | VOCs | 1–60 μM | - | - | [32] |
| PEG | MWCNT | 10–1000 ppm | 0.06 %/ppm | 110 s | [26] | |
| PDAC | rGO | 35–55 ppm | 0.1 %/ppm | <10 s | This work ** |
Disclaimer/Publisher’s Note: The statements, opinions and data contained in all publications are solely those of the individual author(s) and contributor(s) and not of MDPI and/or the editor(s). MDPI and/or the editor(s) disclaim responsibility for any injury to people or property resulting from any ideas, methods, instructions or products referred to in the content. |
© 2023 by the authors. Licensee MDPI, Basel, Switzerland. This article is an open access article distributed under the terms and conditions of the Creative Commons Attribution (CC BY) license (https://creativecommons.org/licenses/by/4.0/).
Share and Cite
Al-Hamry, A.; Lu, T.; Bai, J.; Adiraju, A.; Ega, T.K.; Pašti, I.A.; Kanoun, O. Layer-by-Layer Deposited Multi-Modal PDAC/rGO Composite-Based Sensors. Foods 2023, 12, 268. https://doi.org/10.3390/foods12020268
Al-Hamry A, Lu T, Bai J, Adiraju A, Ega TK, Pašti IA, Kanoun O. Layer-by-Layer Deposited Multi-Modal PDAC/rGO Composite-Based Sensors. Foods. 2023; 12(2):268. https://doi.org/10.3390/foods12020268
Chicago/Turabian StyleAl-Hamry, Ammar, Tianqi Lu, Jing Bai, Anurag Adiraju, Tharun K. Ega, Igor A. Pašti, and Olfa Kanoun. 2023. "Layer-by-Layer Deposited Multi-Modal PDAC/rGO Composite-Based Sensors" Foods 12, no. 2: 268. https://doi.org/10.3390/foods12020268