
A Comprehensive Quality Analysis of Different Colors of Medicinal and Edible Honeysuckle

Abstract
: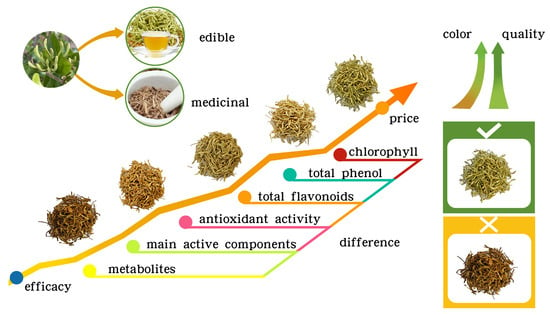
1. Introduction
2. Materials and Methods
2.1. Materials
2.1.1. Reagents
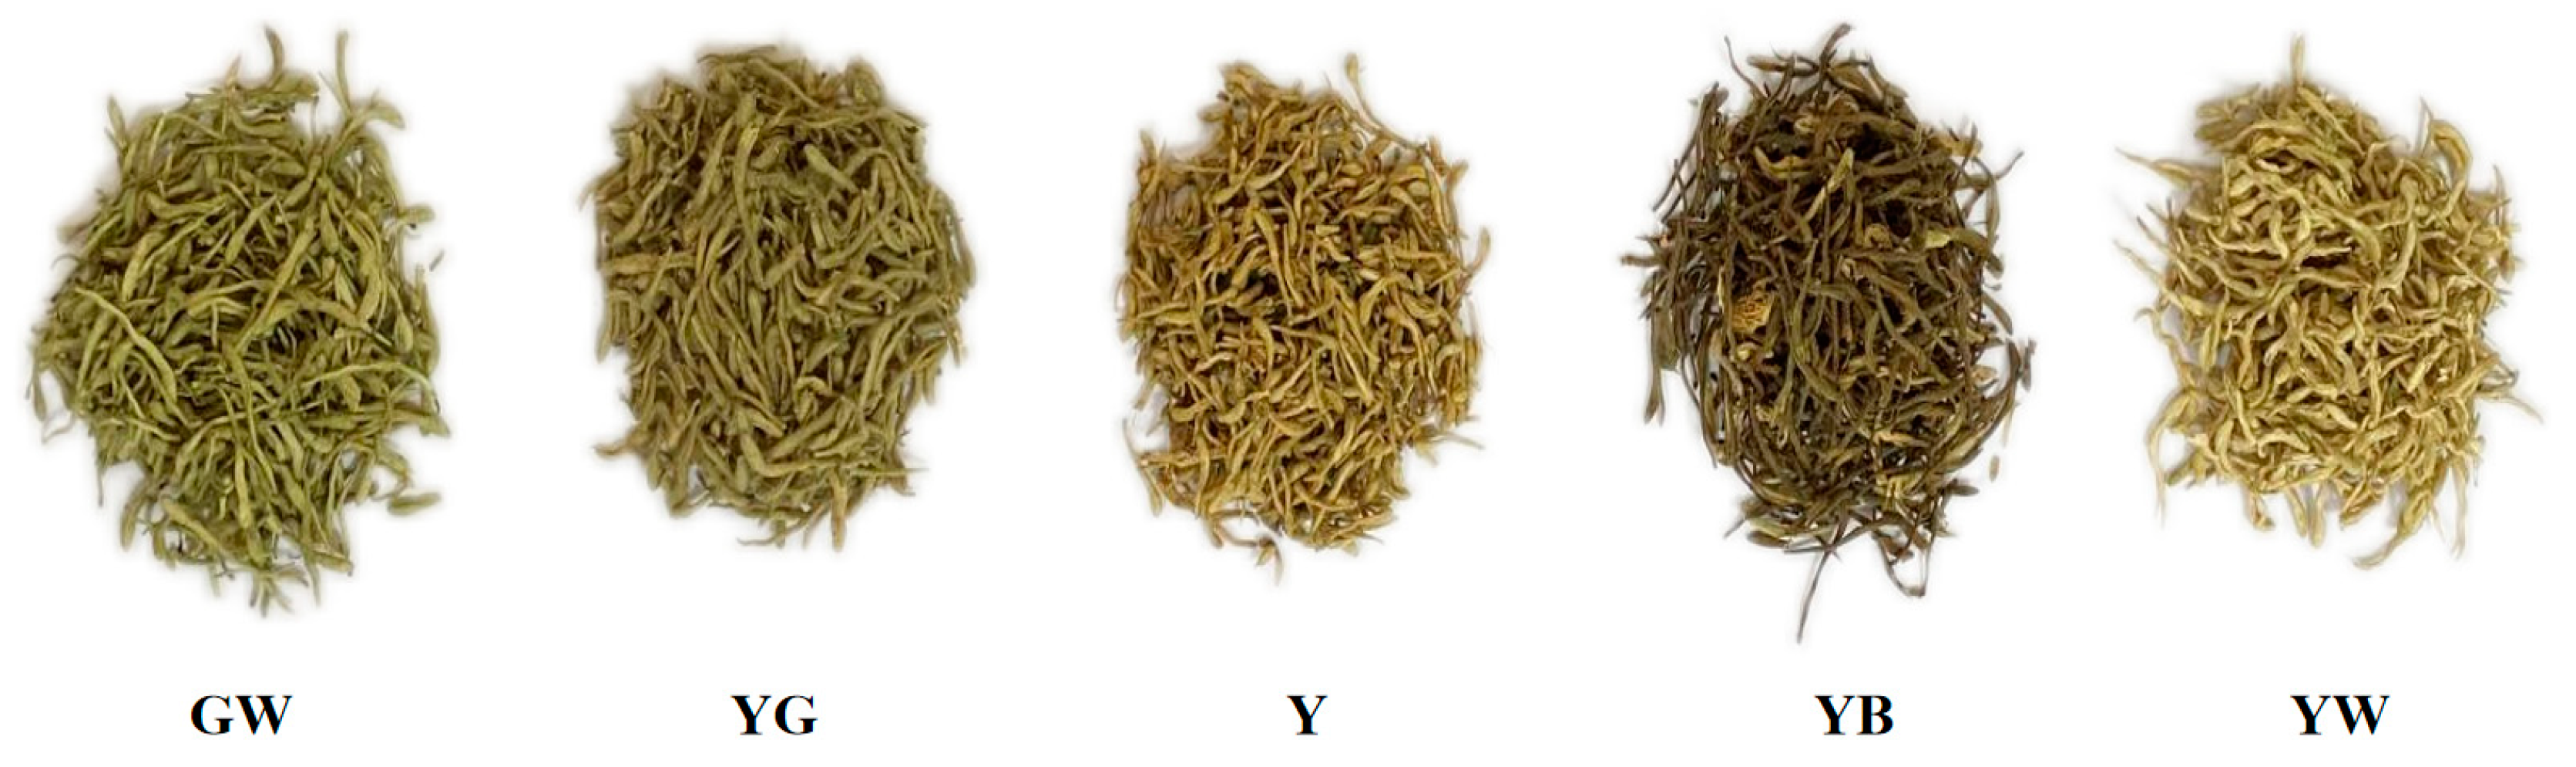
2.1.2. Sample Collection
2.2. Colorimetric Analysis
2.3. Determination of Chlorophyll
2.4. Determination of Total Phenol and Total Flavonoid
2.5. Determination of Antioxidant Activity with an ABTS Free Radical Scavenging Method
2.6. Determination of Antioxidant Activity with a DPPH Radical Scavenging Method
2.7. Determination of Antioxidant Activity with a Ferric Reduction Ability of the Plasma (FRAP) Free Radical Scavenging Method
2.8. HPLC Analysis
2.8.1. Sample Preparation
2.8.2. Mixed Standard Solution Preparation
2.8.3. Spectrometric Conditions
2.8.4. Method Validation
2.9. UPLC-Q-TOF-MS Analysis
2.9.1. Sample Preparation
2.9.2. Spectrometric Conditions
2.9.3. Spectroscopy Processing
2.10. Statistical Analysis
3. Results
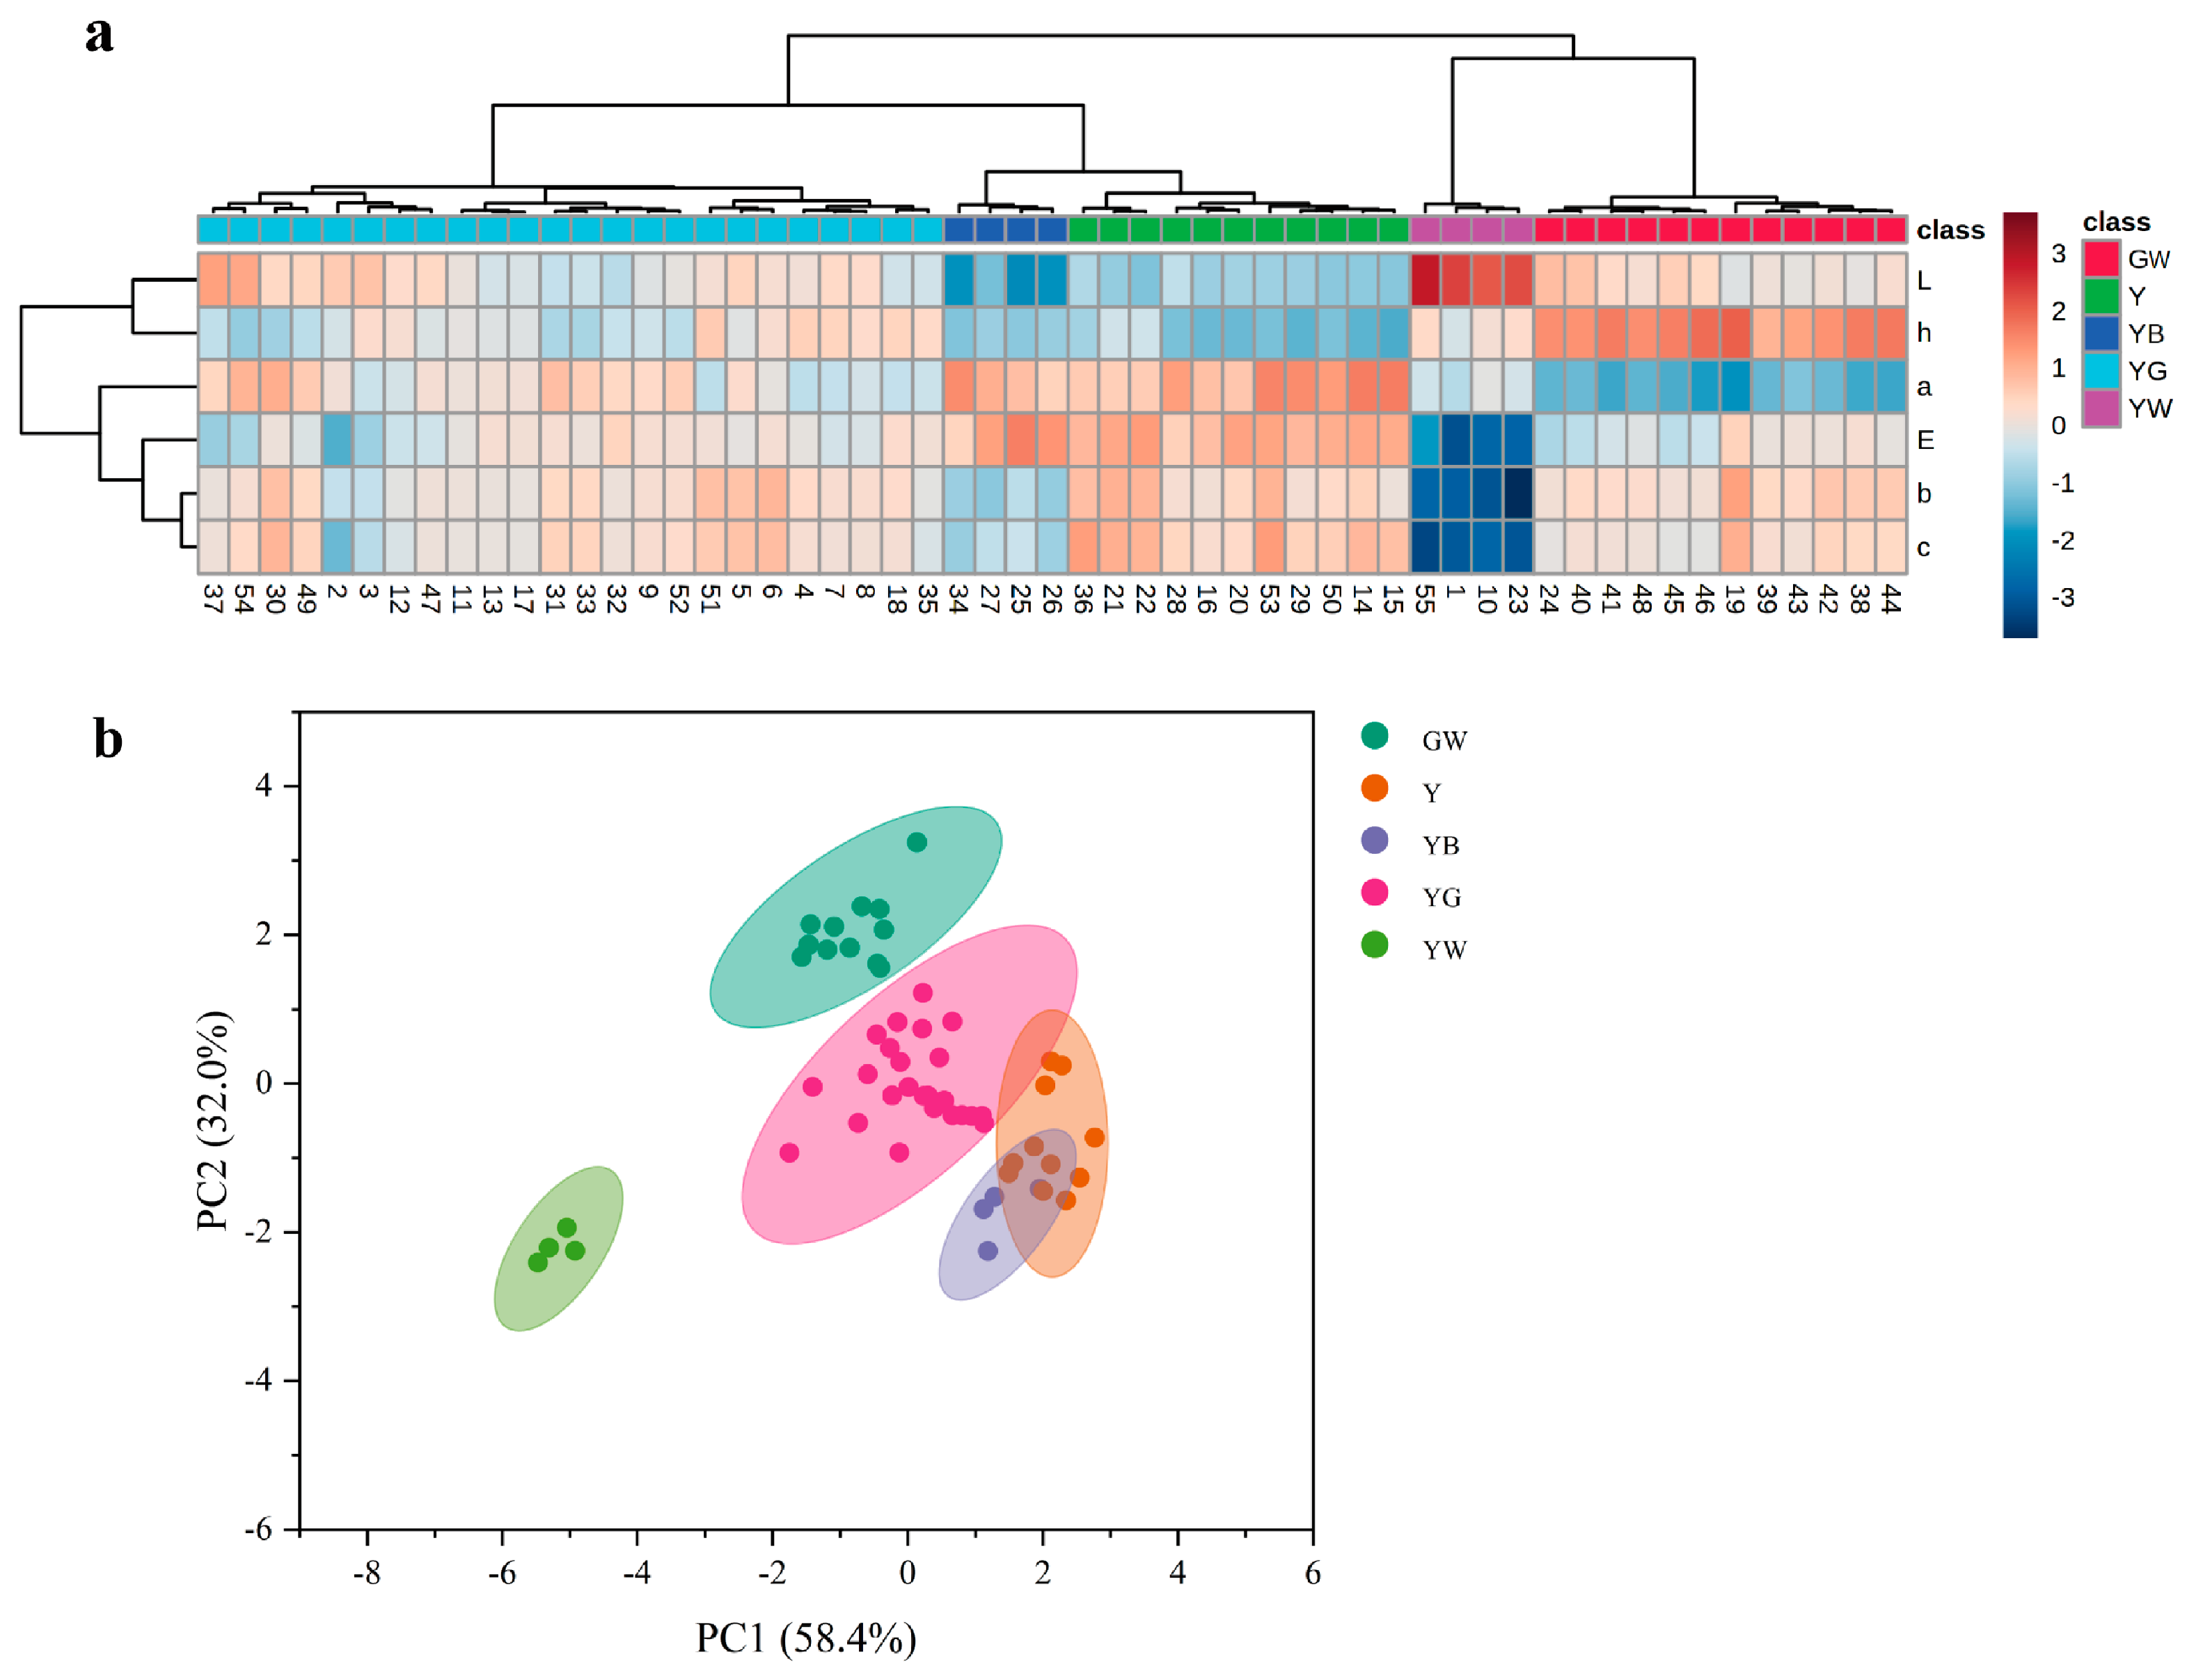
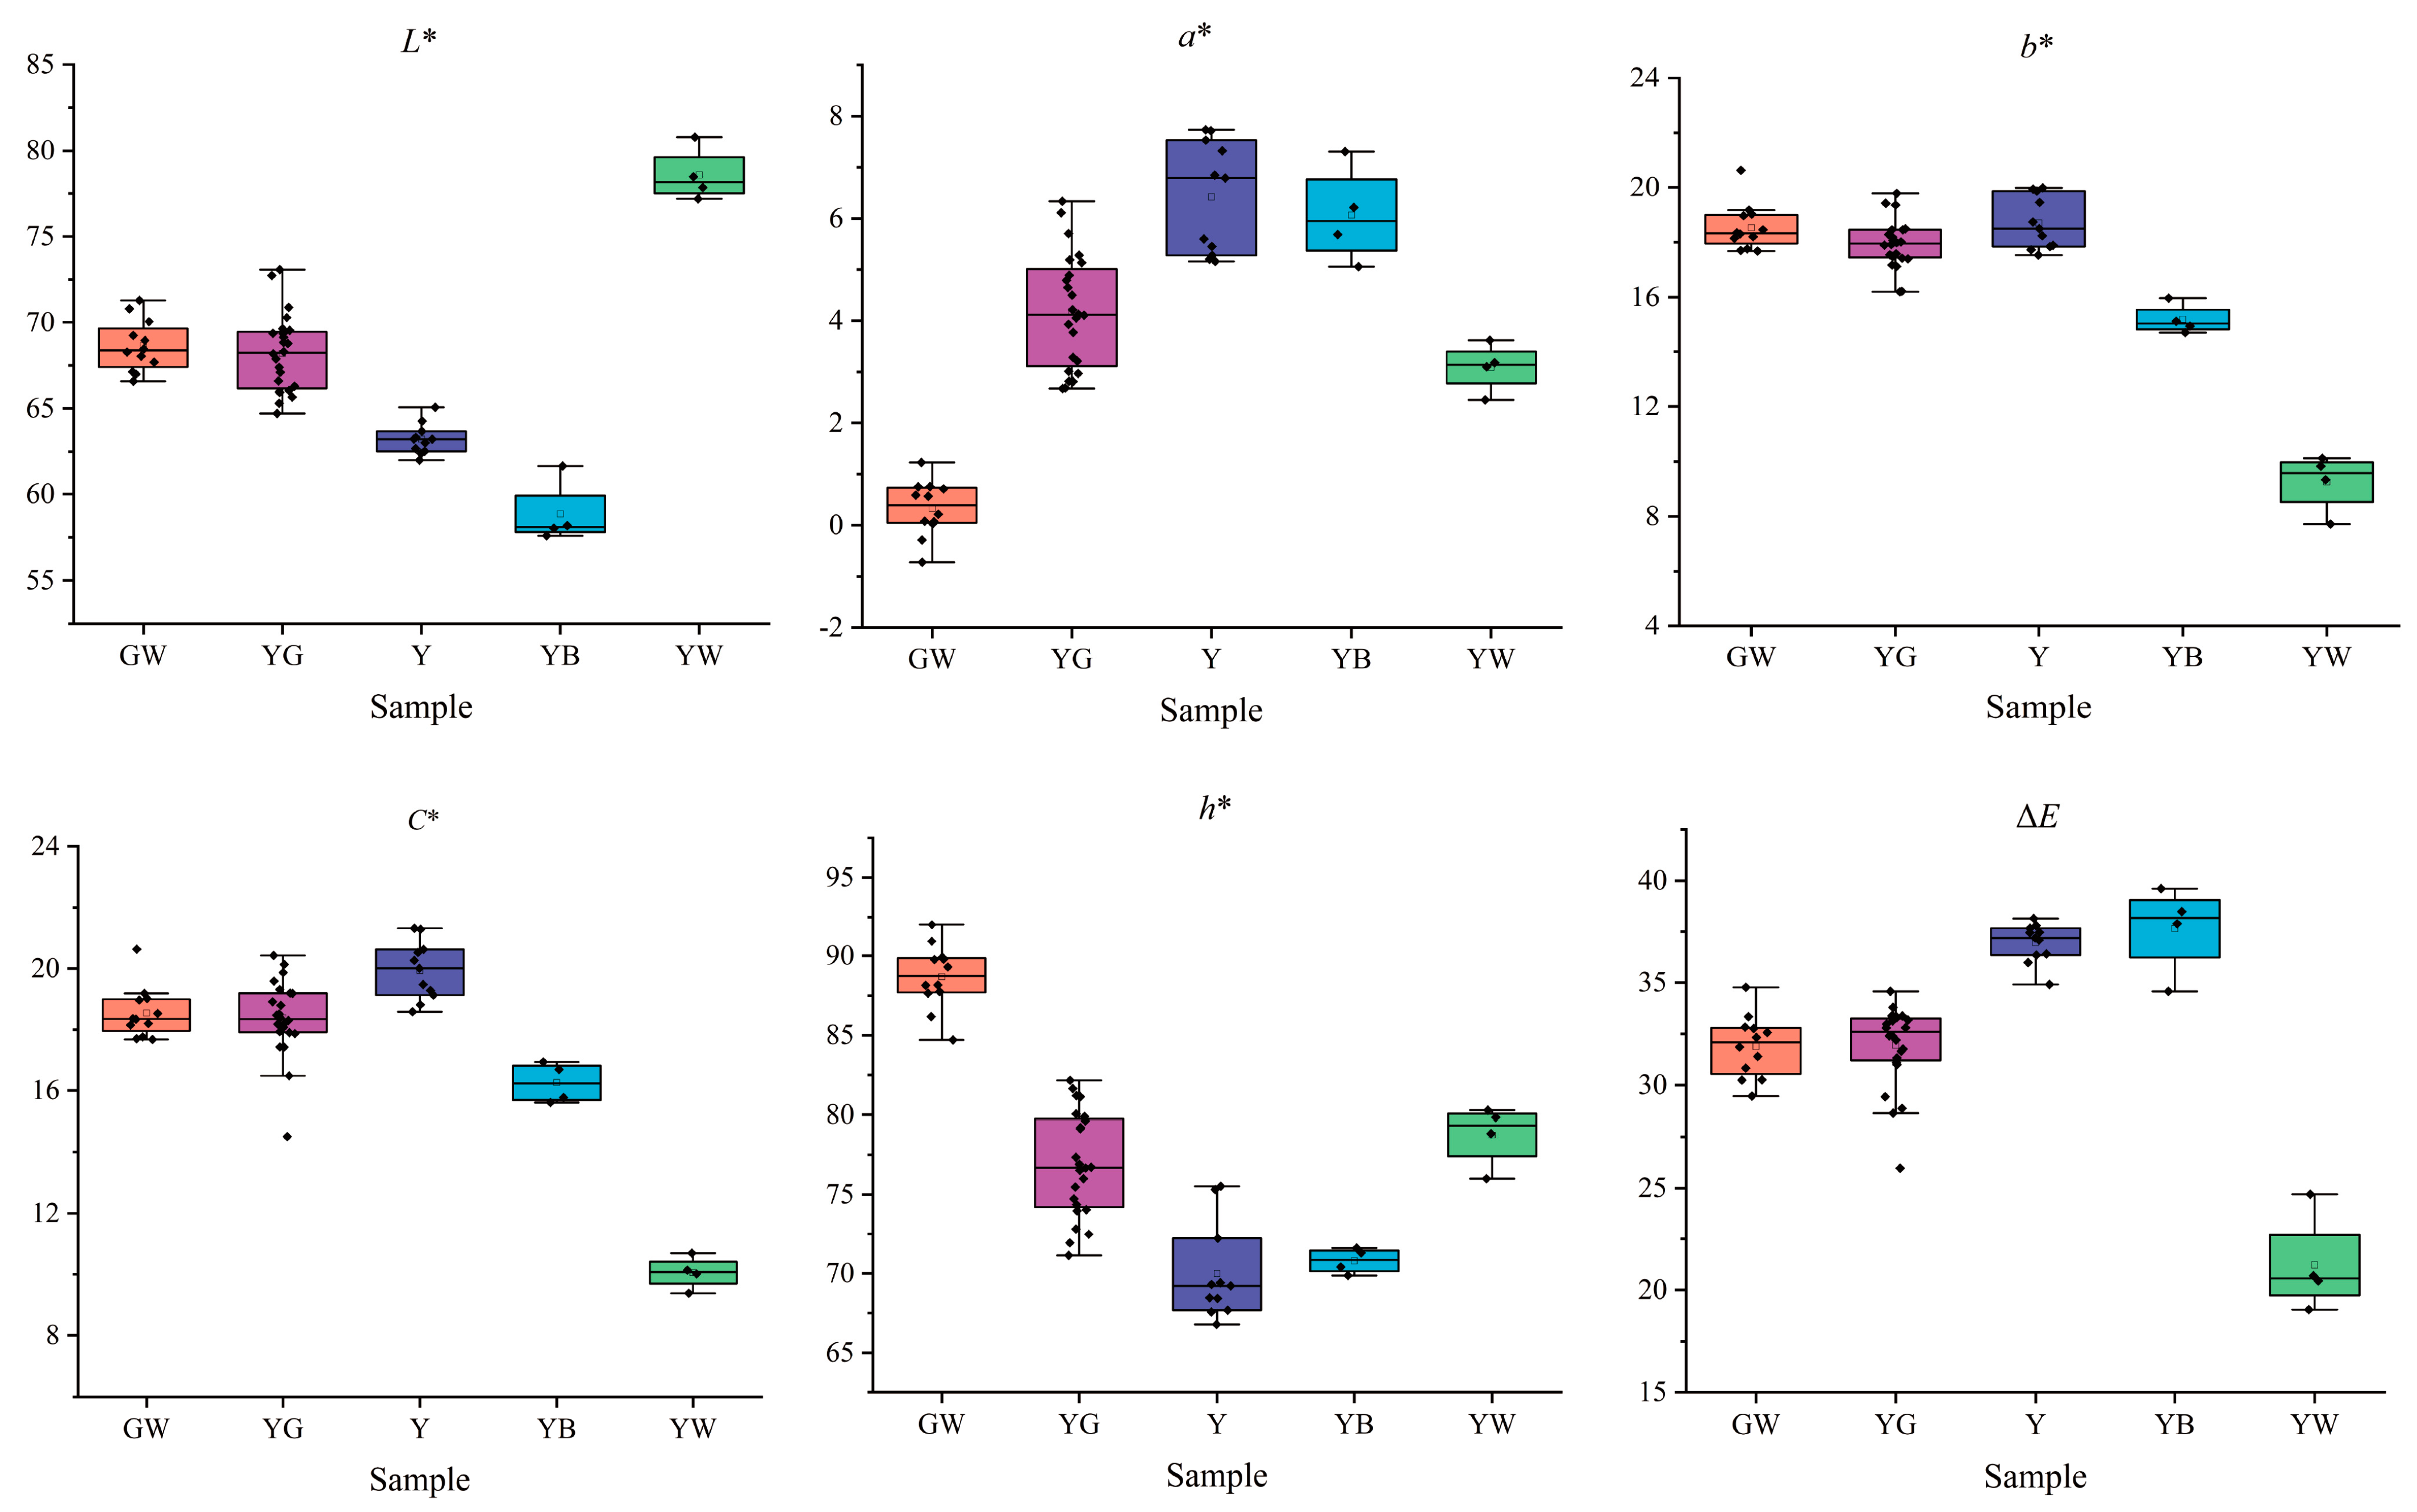
3.1. Colorimetric Analysis
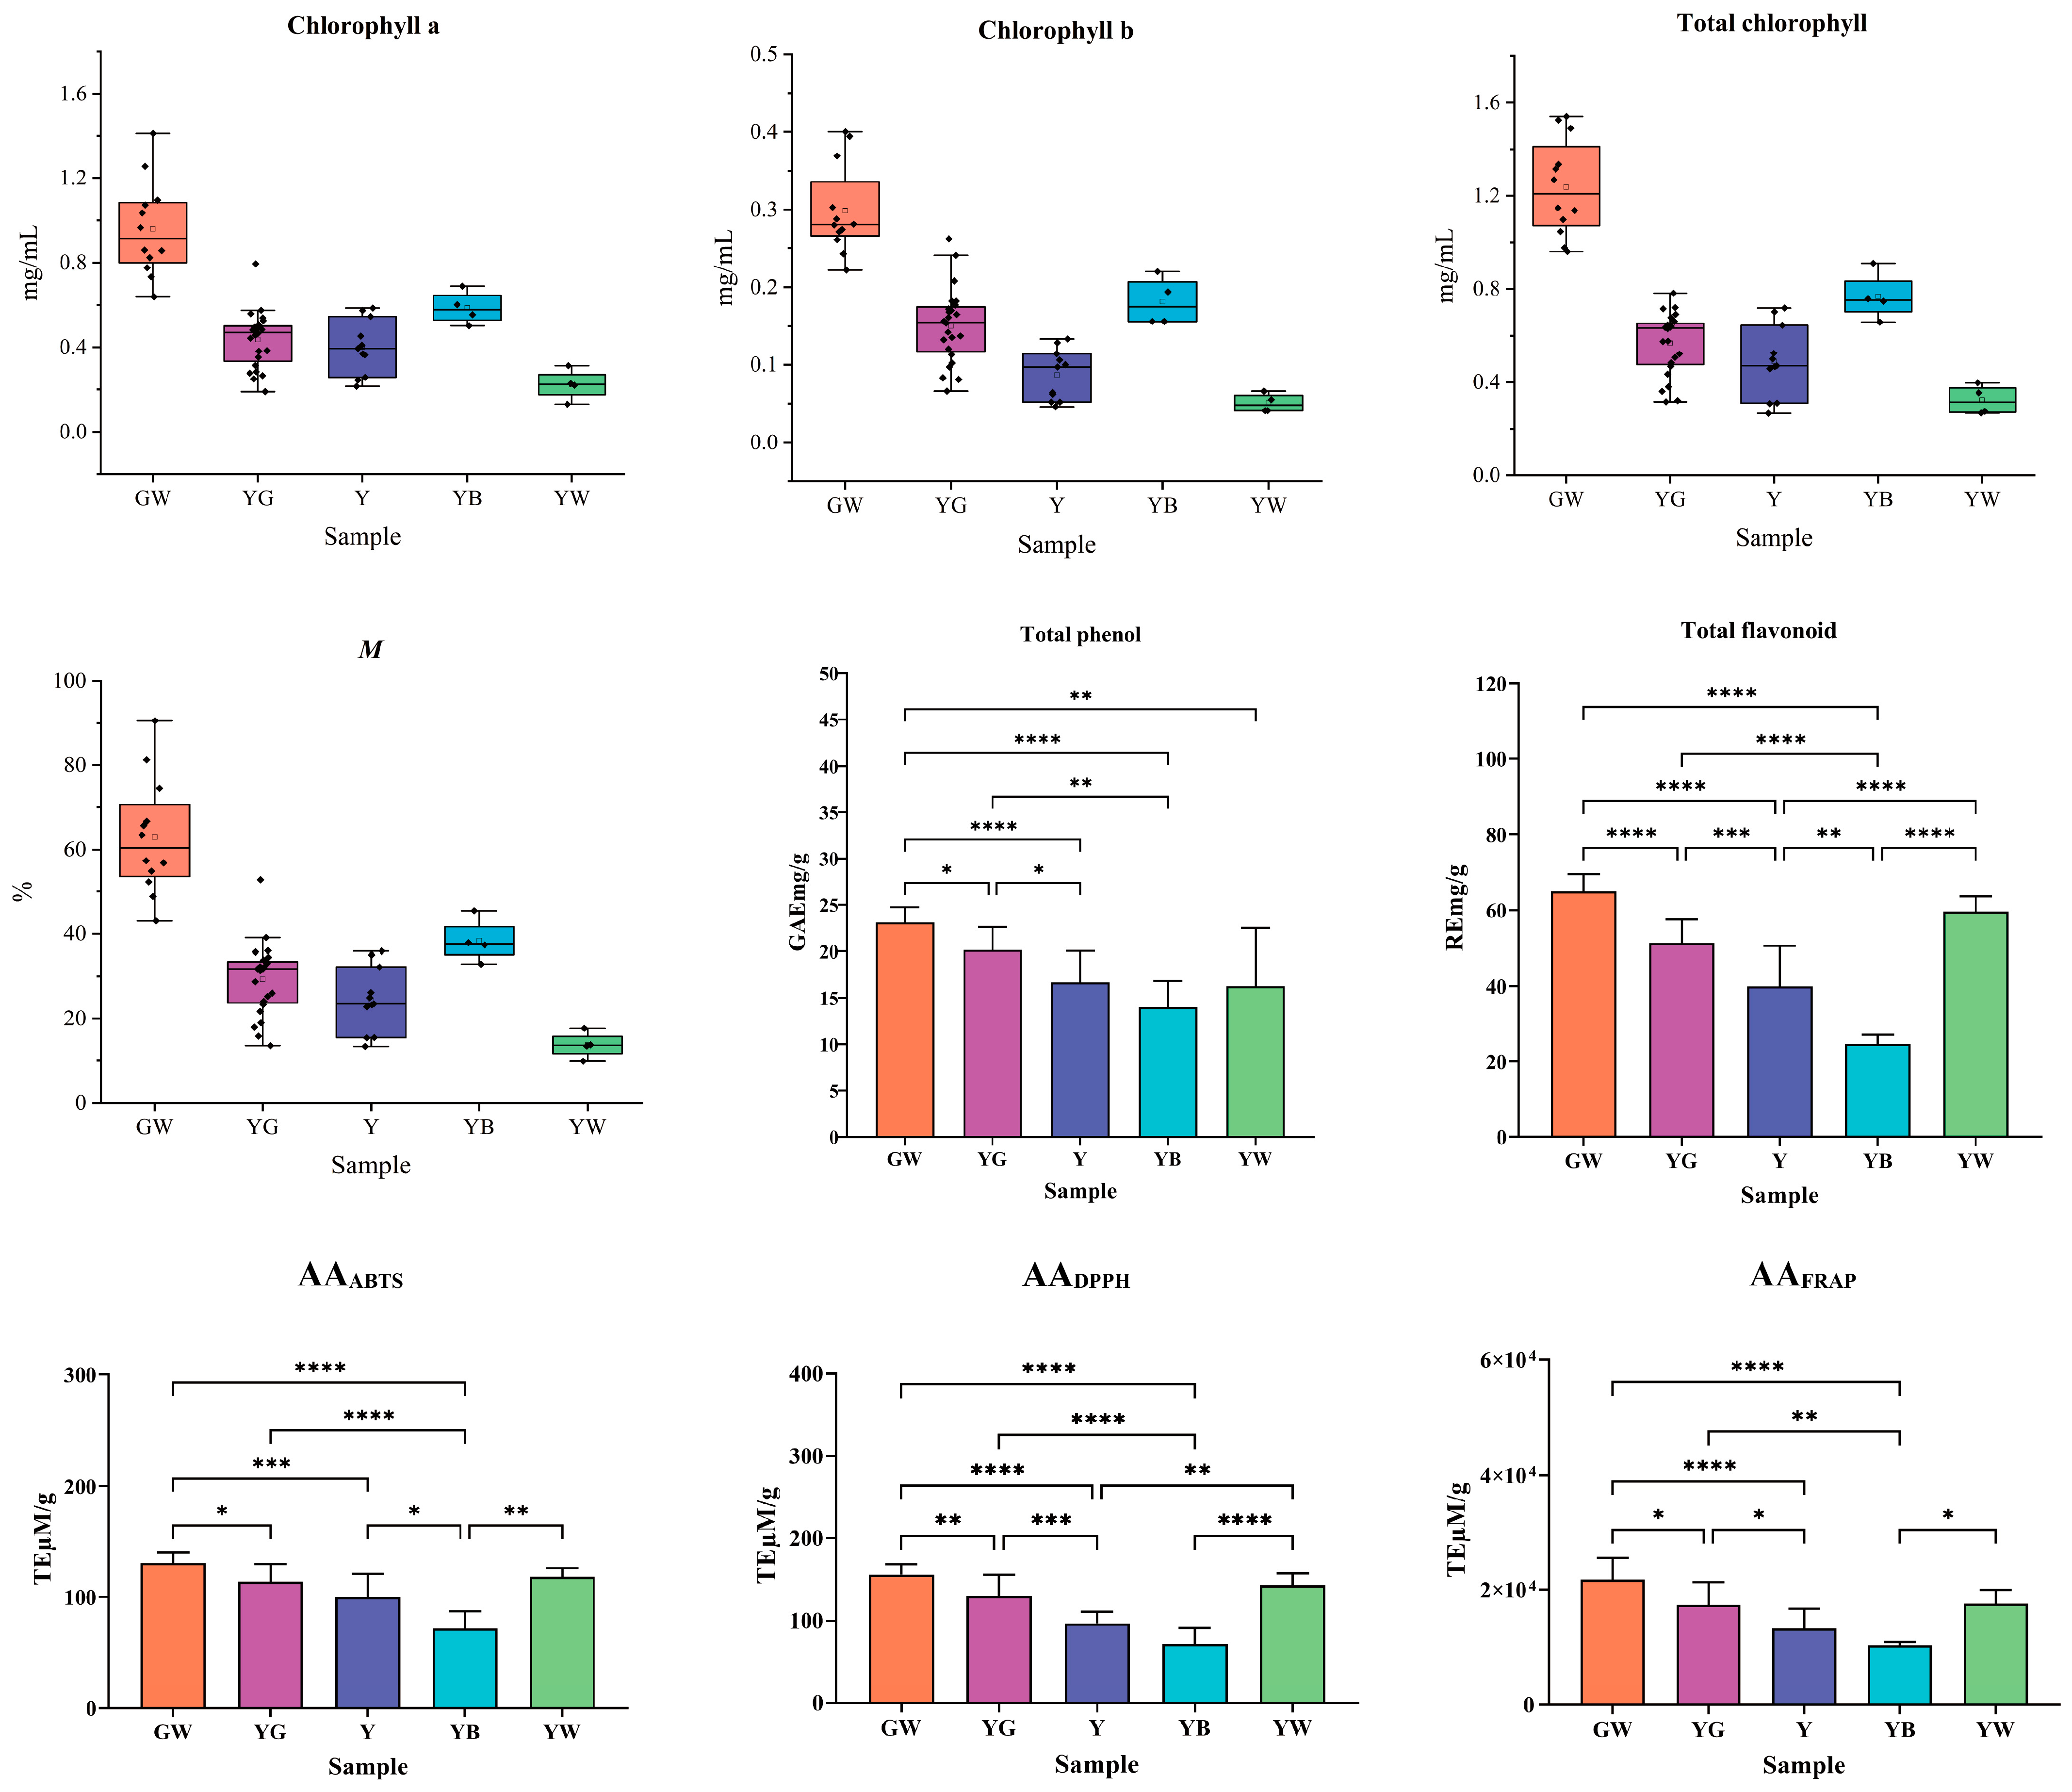
3.2. Chlorophyll Content Analysis
3.3. Total Phenol Content Analysis
3.4. Total Flavonoid Content Analysis
3.5. Antioxidant Activity Analysis
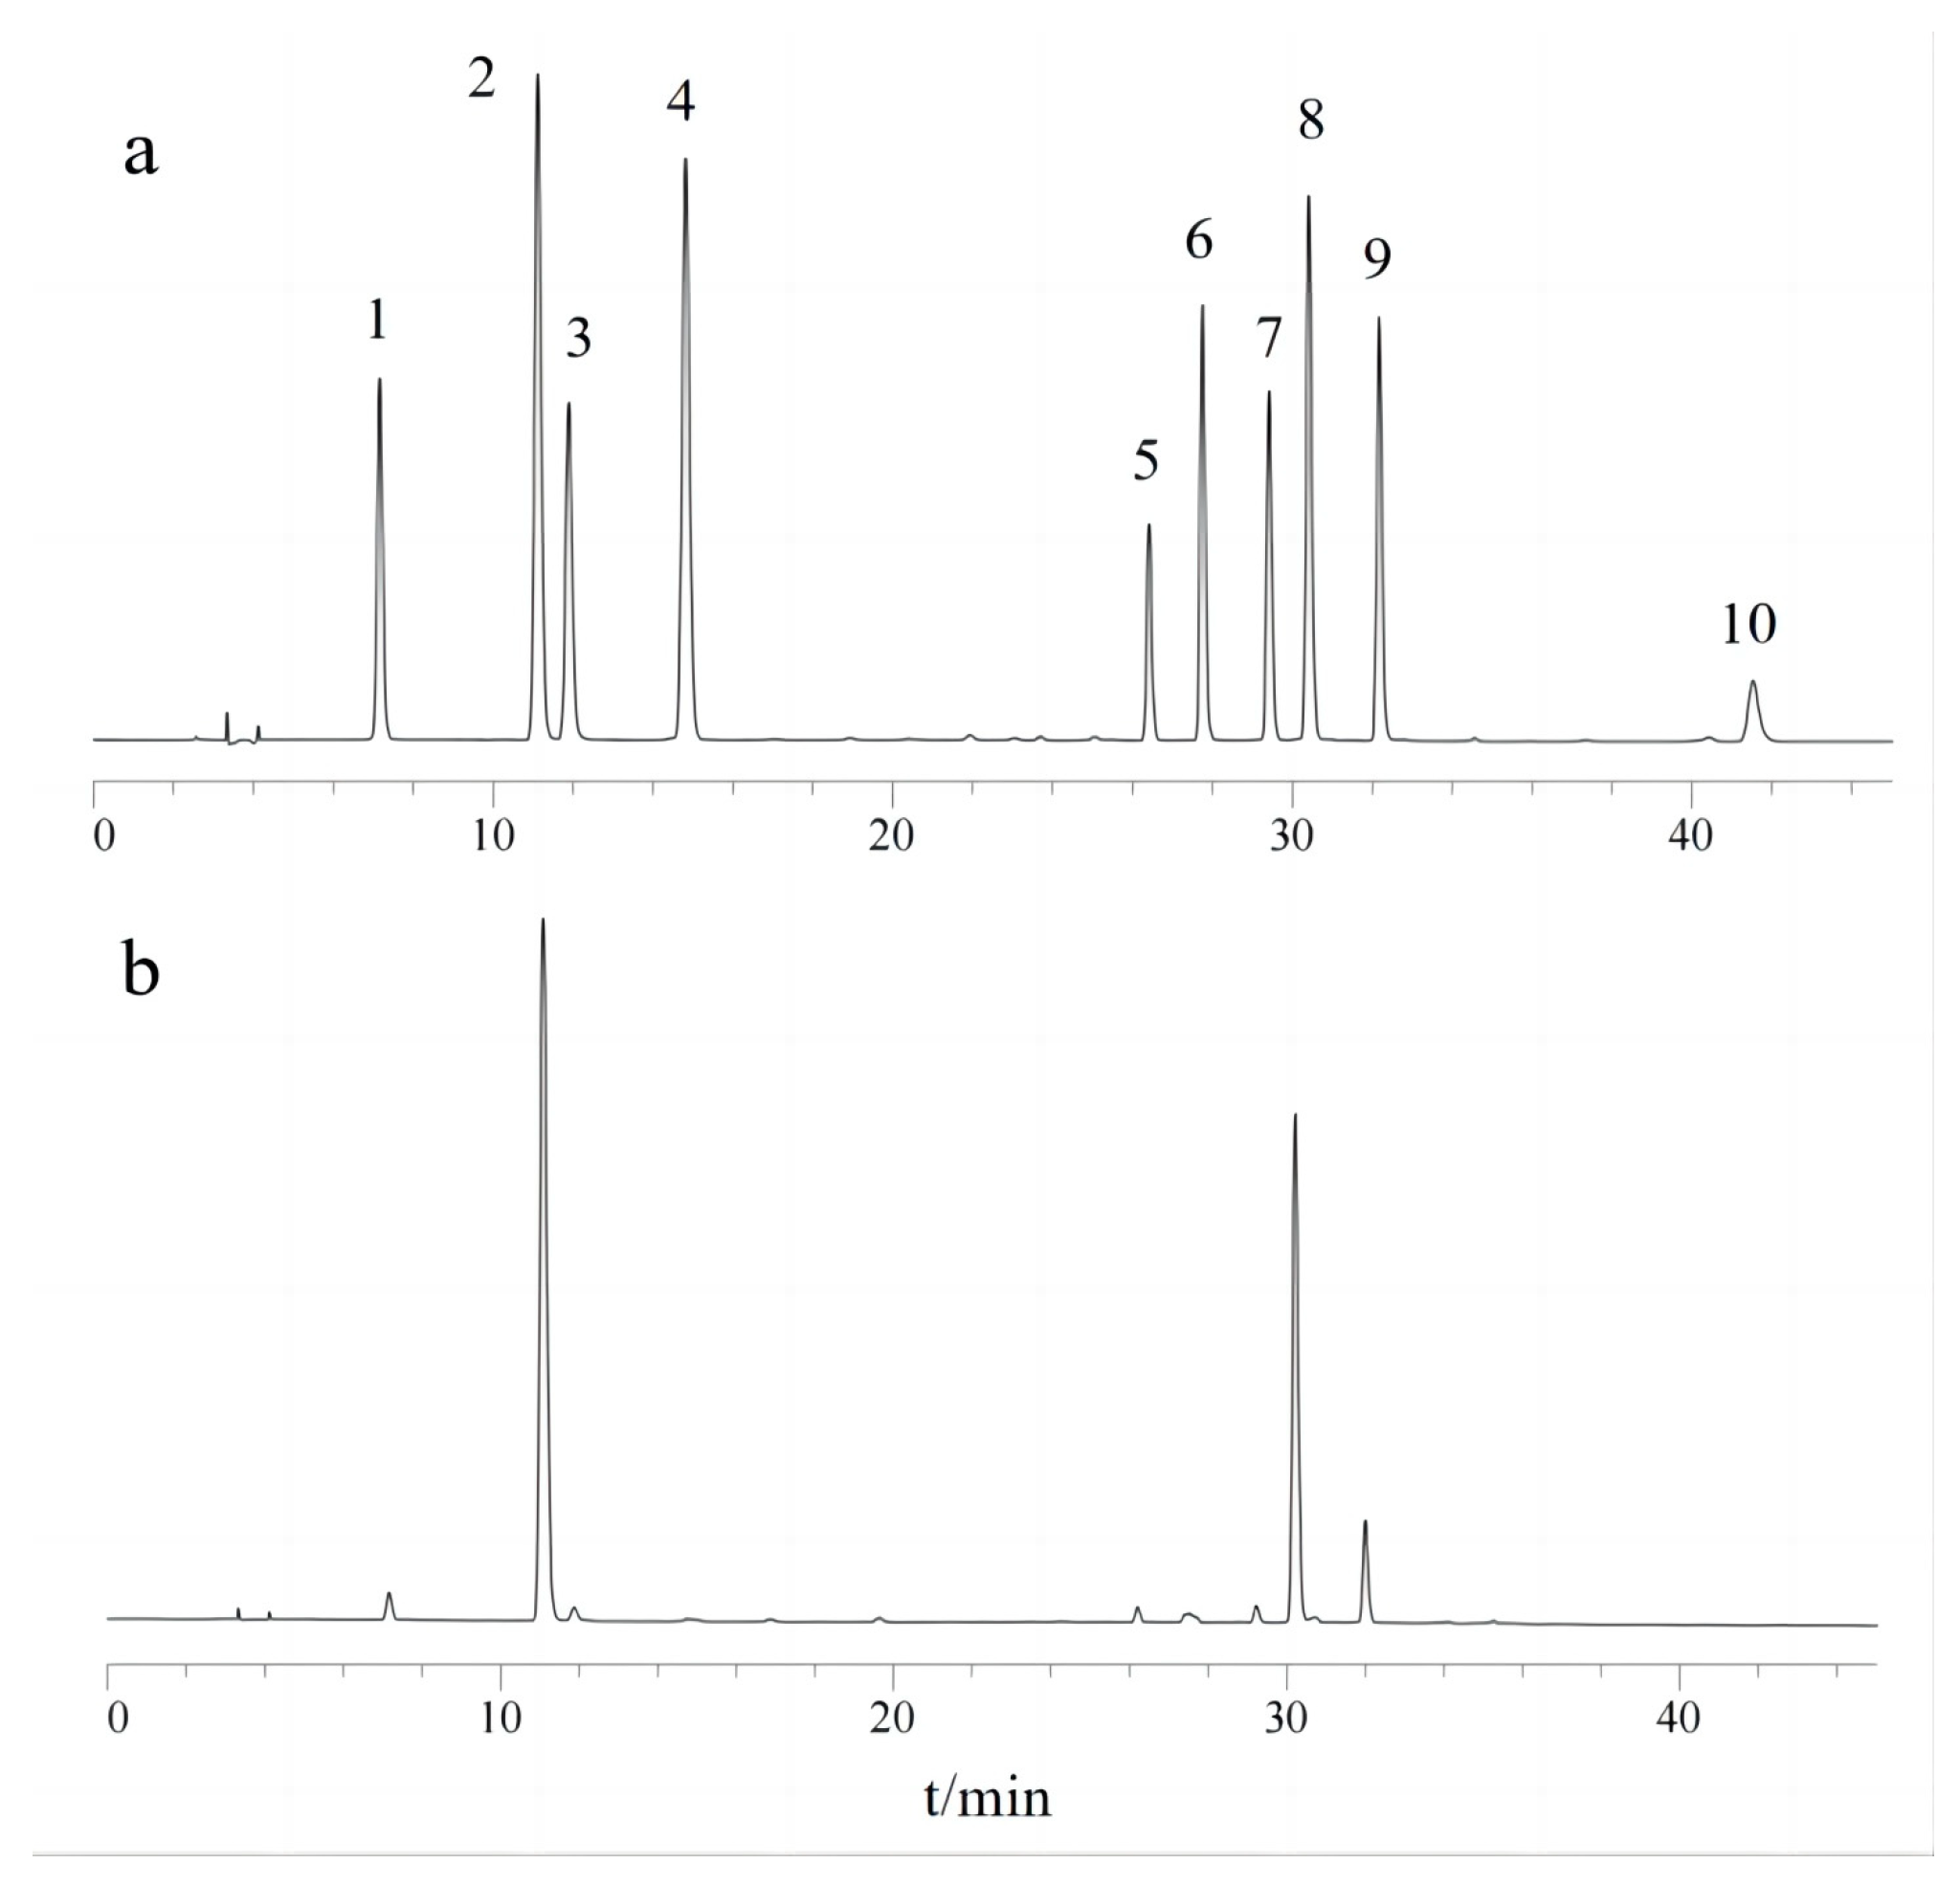
3.6. HPLC Analysis
3.6.1. Method Validation
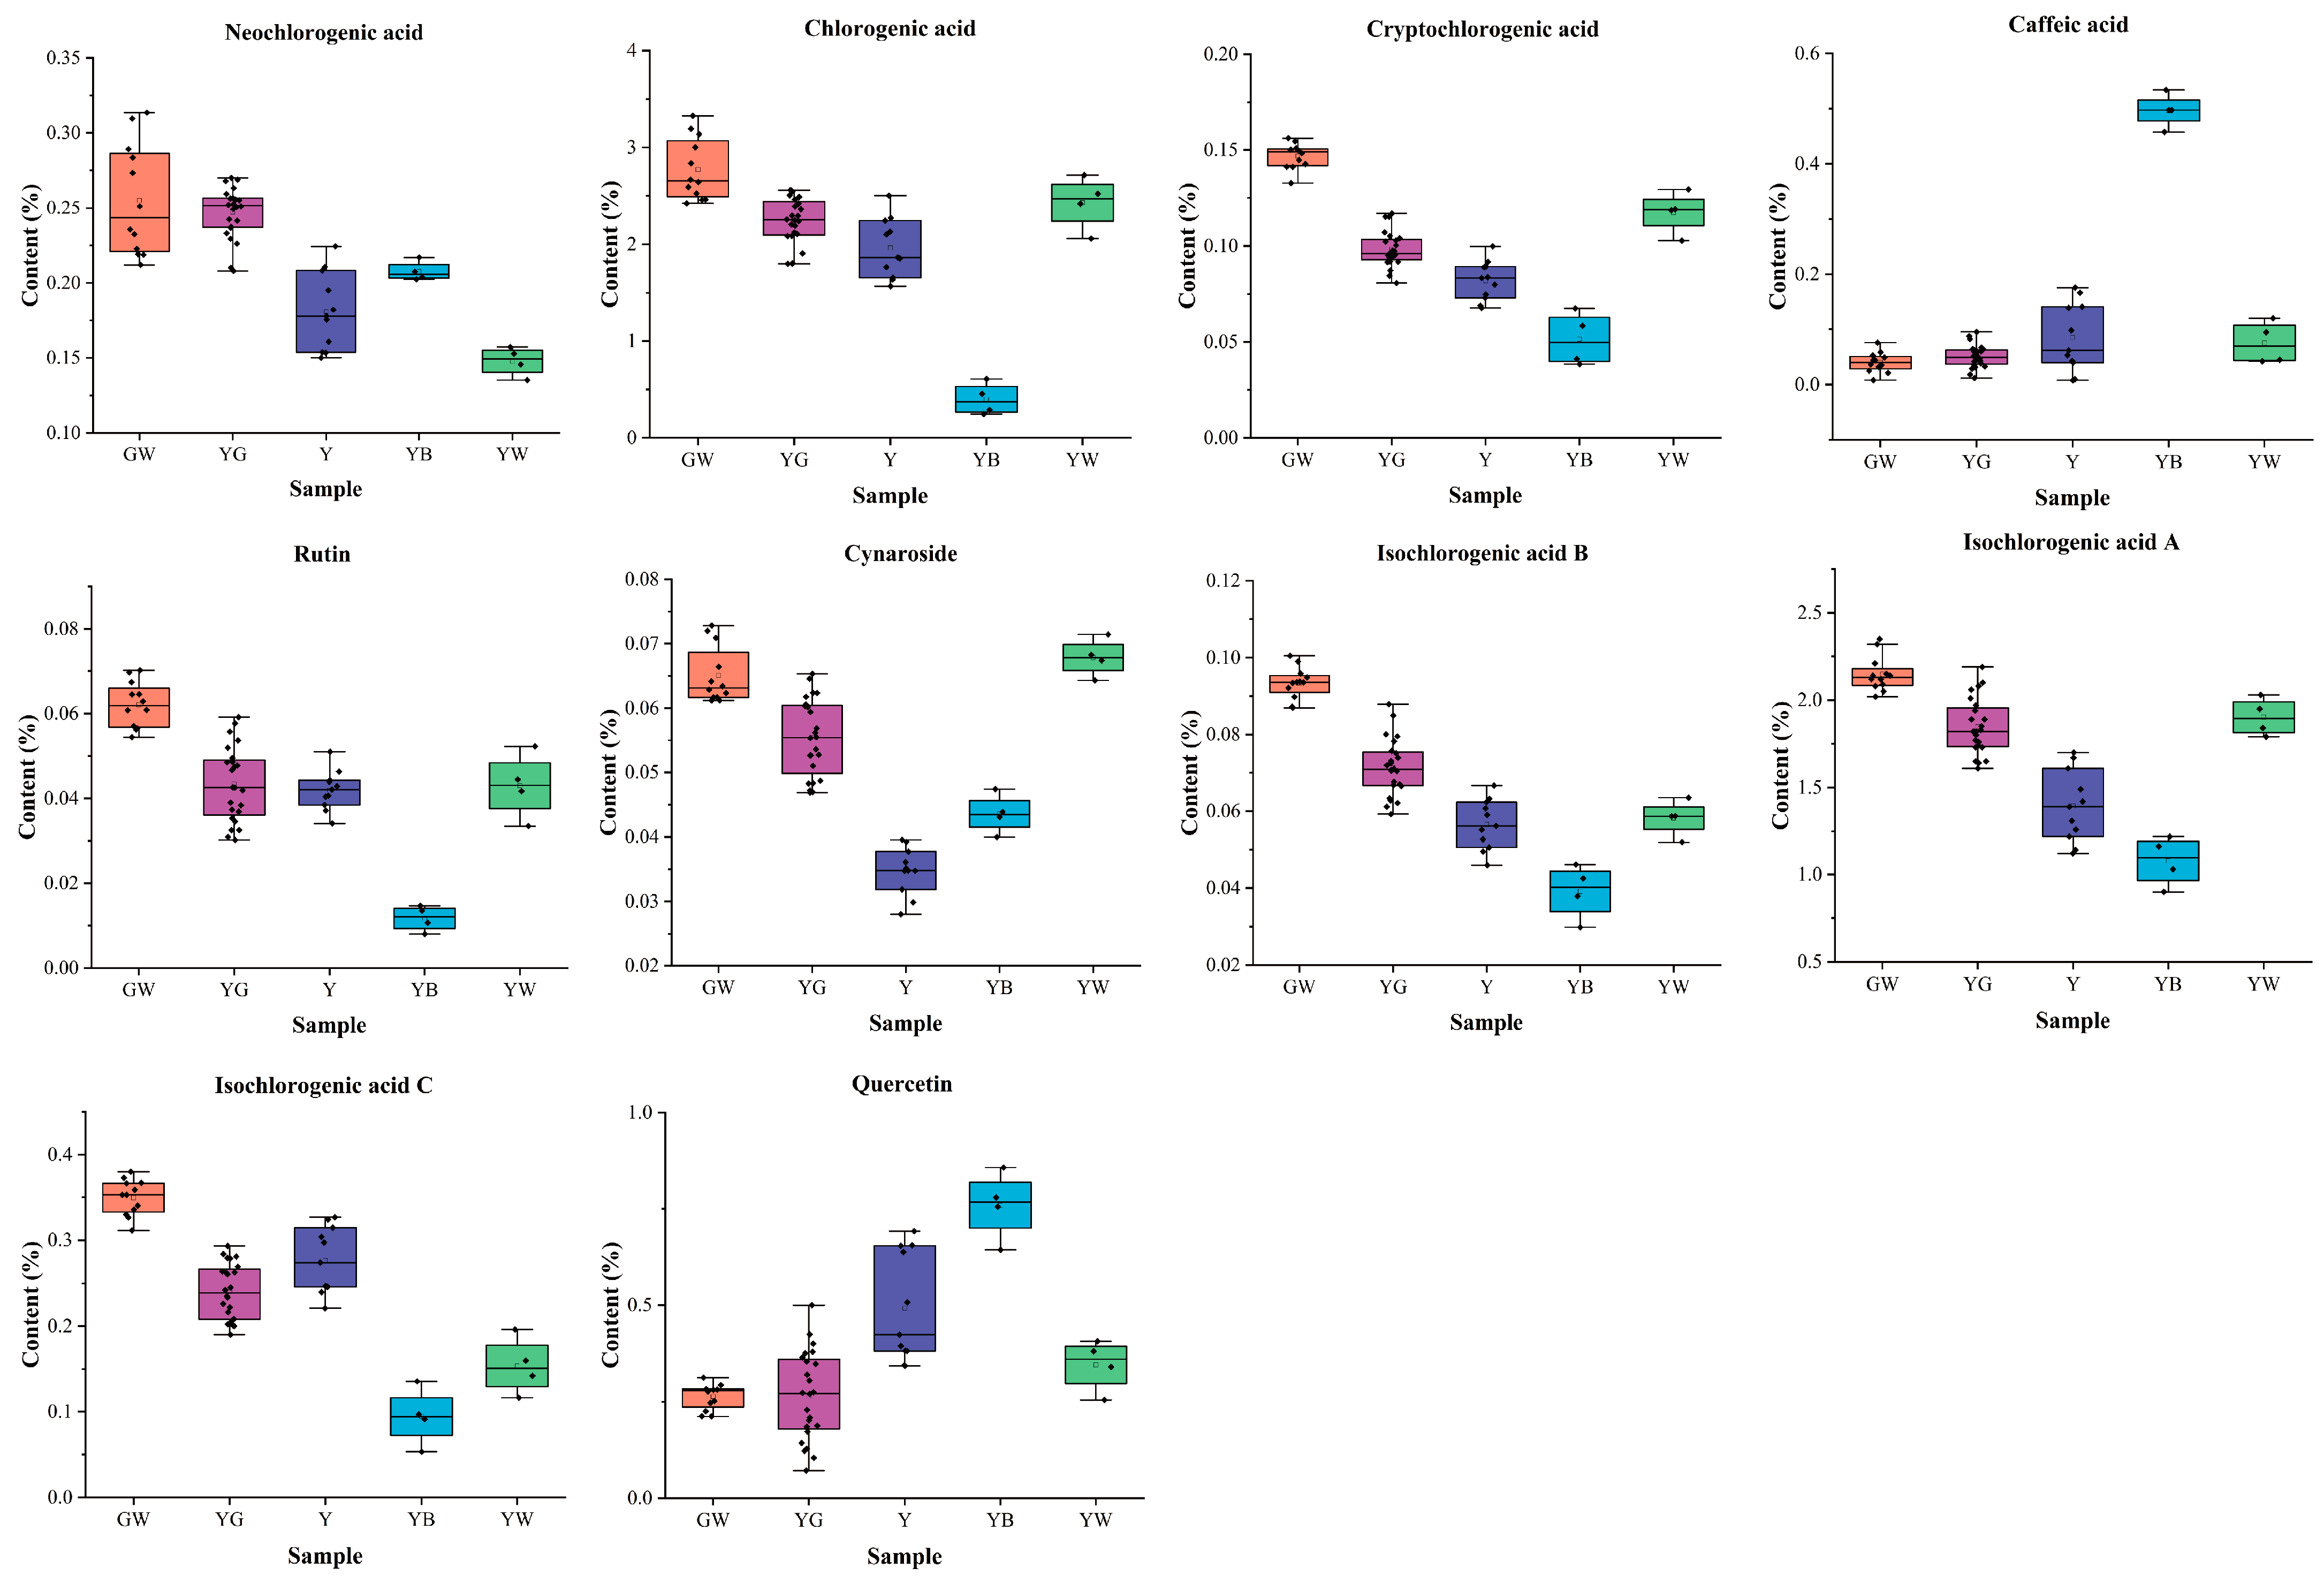
3.6.2. Samples Analysis
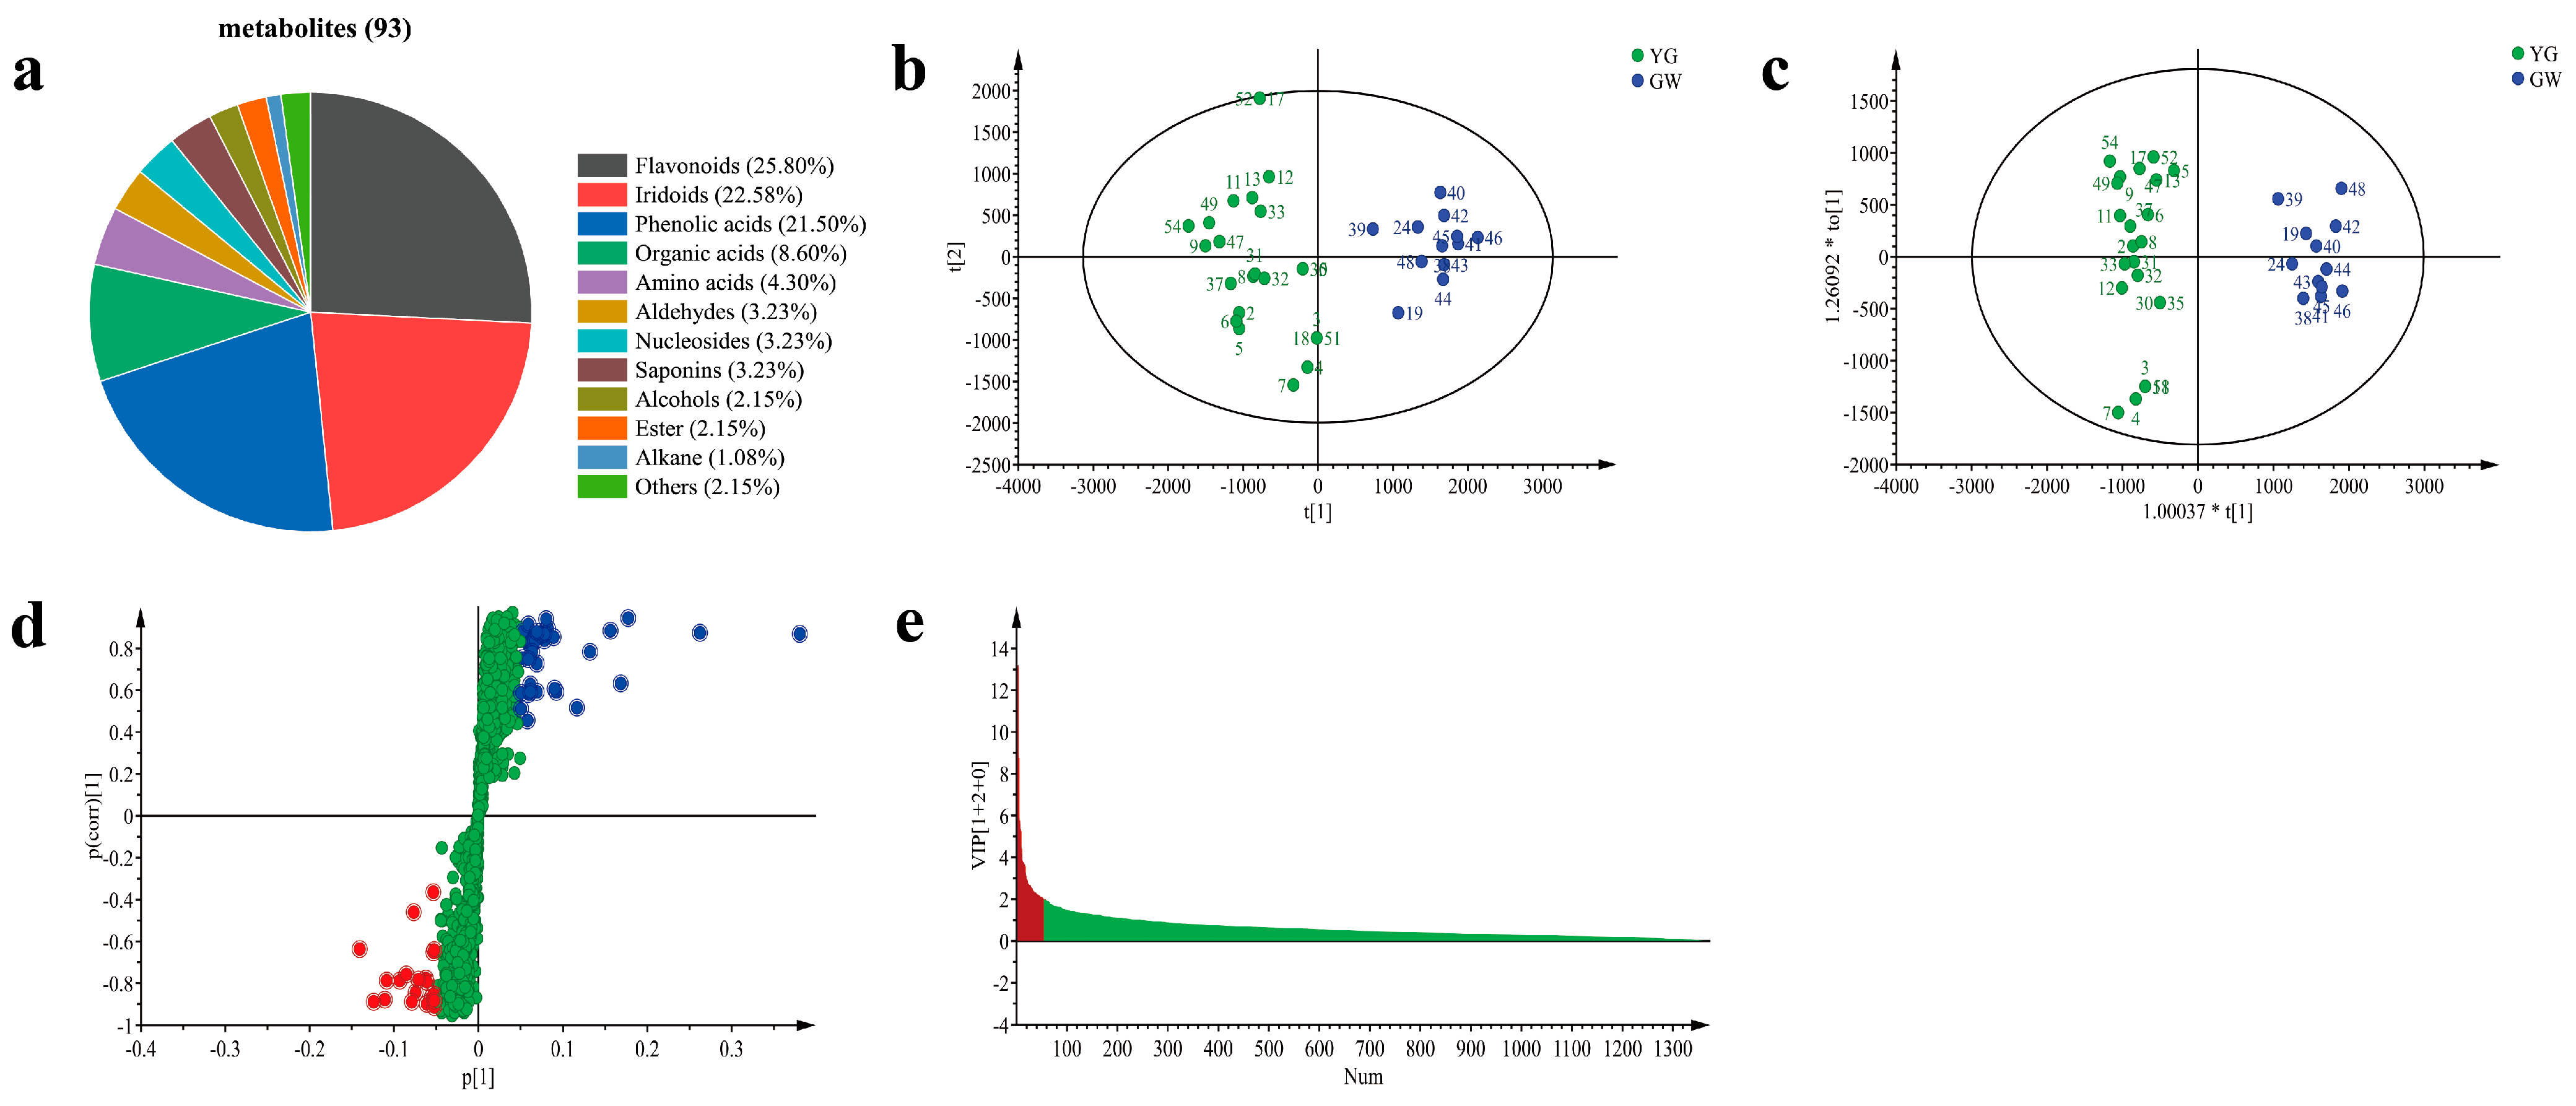
3.7. UPLC-Q-TOF-MS Analysis
3.7.1. Data Quality Assessment
3.7.2. Overview of the Metabolites
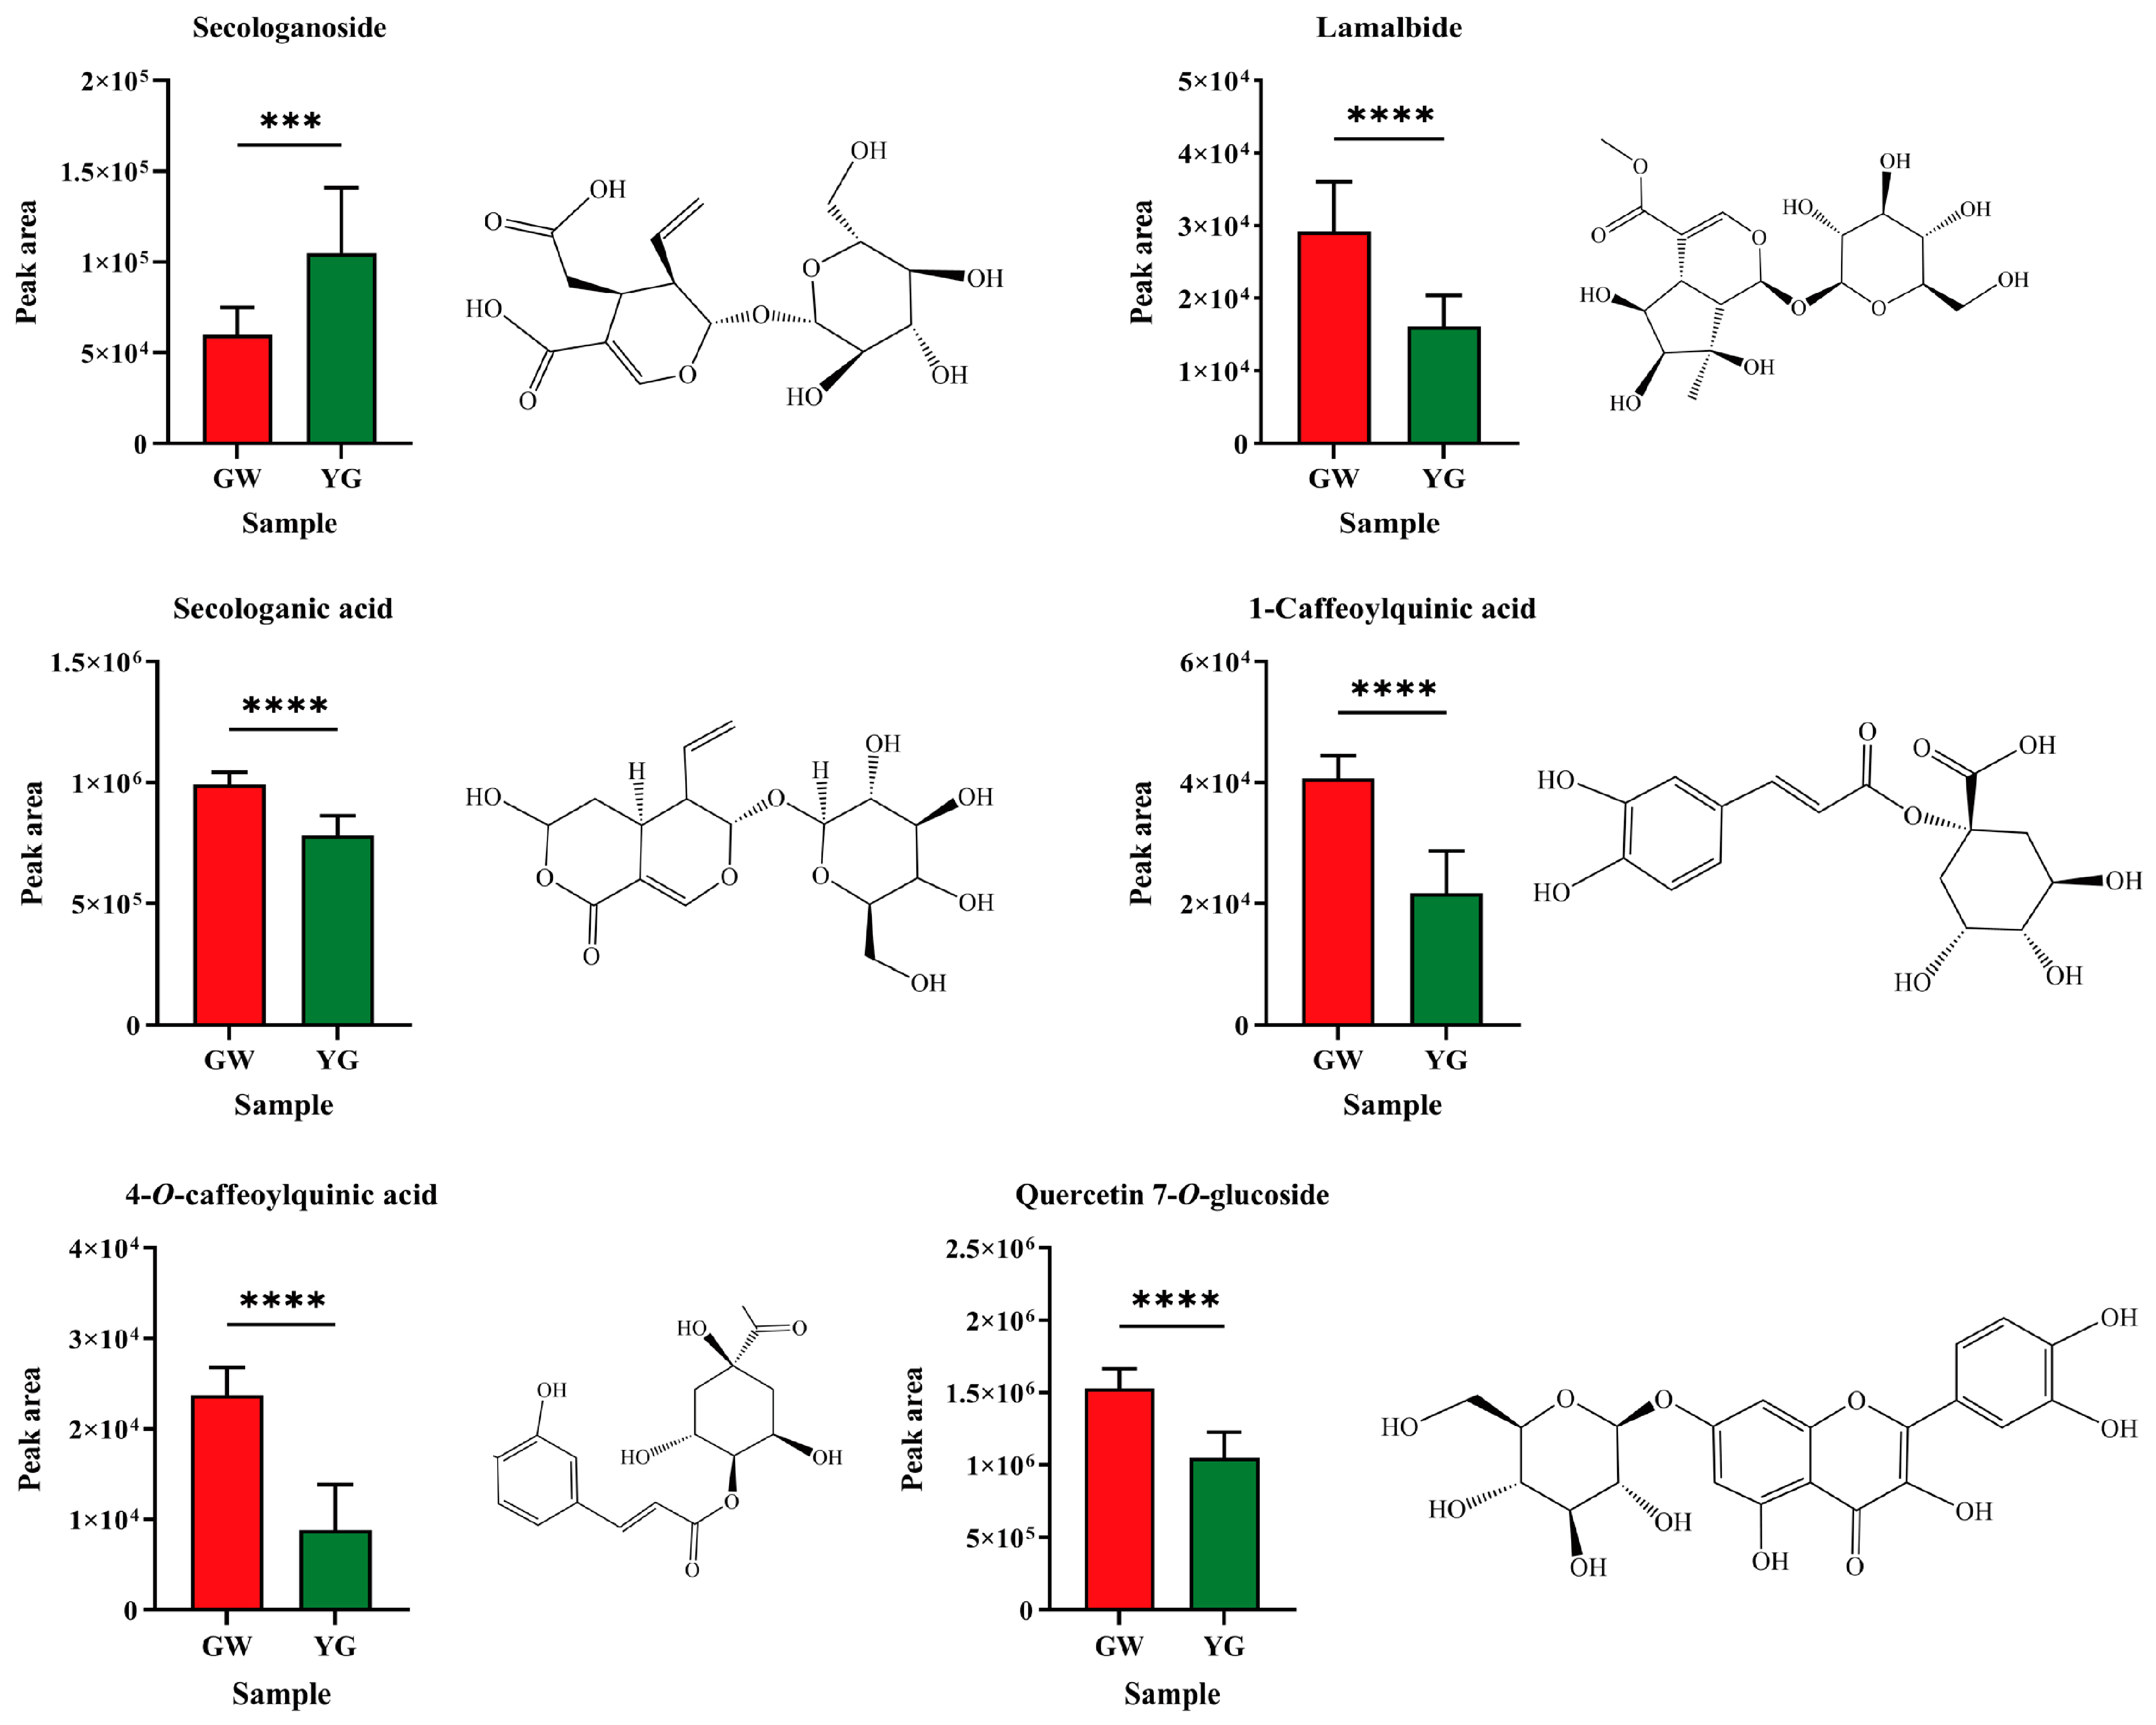
3.7.3. Identification of Differential Metabolites
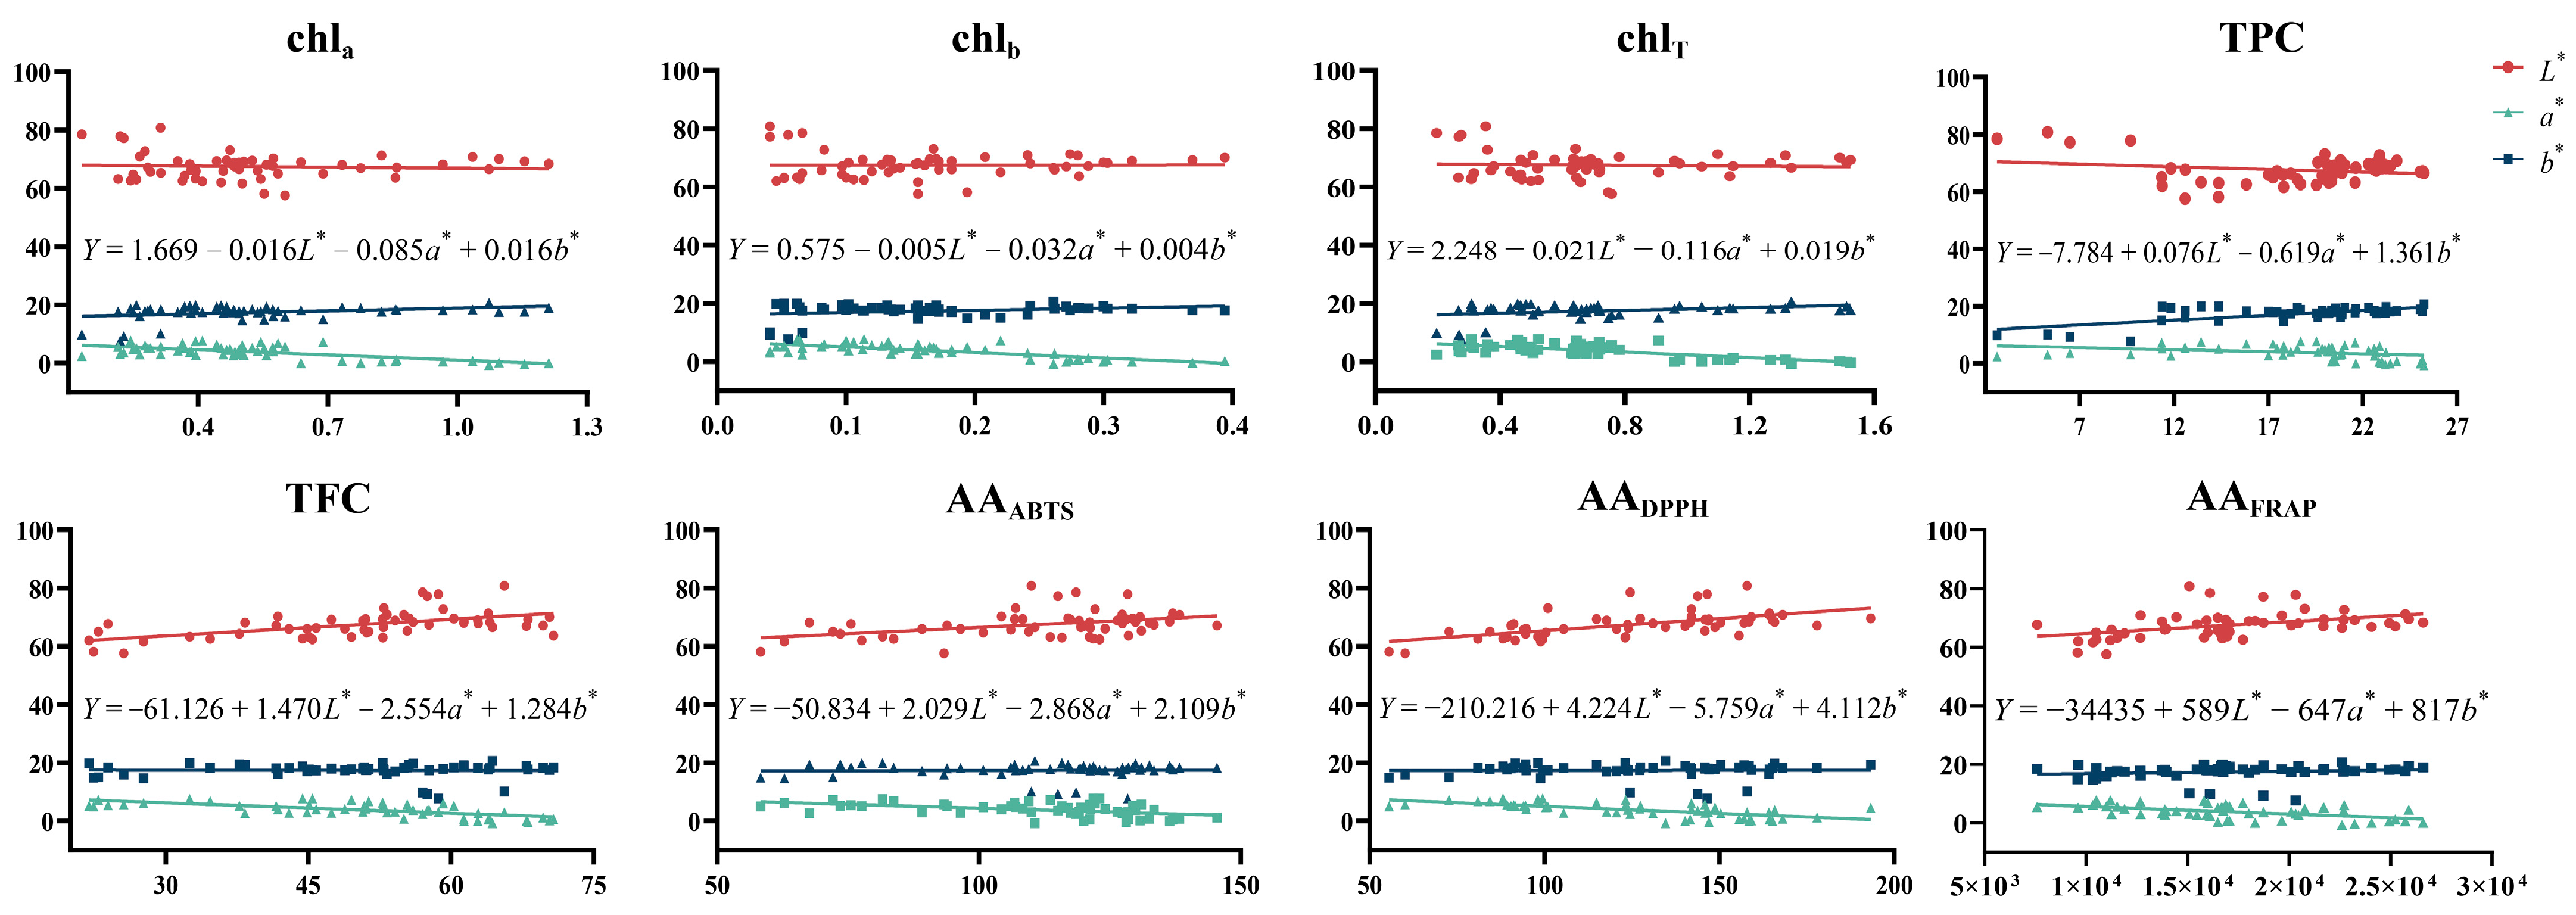
3.8. Correlation Analysis
4. Discussion
5. Conclusions
Supplementary Materials
Author Contributions
Funding
Data Availability Statement
Acknowledgments
Conflicts of Interest
References
- Pharmacopoeia of the People’s Republic of China. Pharmacopoeia of the People’s Republic of China (Part 1); China Medical Science and Technology Press: Beijing, China, 2020; pp. 230–232. ISBN 978-7-5214-1574-2. [Google Scholar]
- Lee, E.J.; Kim, J.S.; Kim, H.P.; Lee, J.; Kang, S.S. Phenolic constituents from the flower buds of Lonicera japonica and their 5-lipoxygenase inhibitory activities. Food Chem. 2010, 120, 134–139. [Google Scholar] [CrossRef]
- Wang, Z.; Clifford, M.N.; Sharp, P. Analysis of chlorogenic acids in beverages prepared from Chinese health foods and investigation, in vitro, of effects on glucose absorption in cultured Caco-2 cells. Food Chem. 2008, 108, 369–373. [Google Scholar] [CrossRef]
- Cao, W.; Chen, J.; Li, L.; Ren, G.; Duan, X.; Zhou, Q.; Zhang, M.; Gao, D.; Zhang, S.; Liu, X. Cookies fortified with Lonicera japonica Thunb. extracts: Impact on phenolic acid content, antioxidant activity and physical properties. Molecules 2022, 27, 5033. [Google Scholar] [CrossRef]
- Wang, M.; Huang, H.; Wang, L.; Yang, H.; He, S.; Liu, F.; Tu, Q.; He, S. Herbal extract mixture modulates intestinal antioxidative capacity and microbiota in weaning piglets. Front. Microbiol. 2021, 12, 706758. [Google Scholar] [CrossRef]
- Mu, W.; Hu, N.; Zhang, L.; Jiang, W.; Yan, T.; Zhang, T.; Liu, A.; Zhang, Y.; Zhao, J.; Shi, L.; et al. Lonicerae japonicae flos ameliorates radiotherapy-induced mesenteric artery endothelial dysfunction through GTPCH1/BH4/eNOS pathway. Phytomedicine 2022, 102, 154146. [Google Scholar] [CrossRef]
- Li, C.; Wang, L.; Zhao, J.; Wei, Y.; Zhai, S.; Tan, M.; Guan, K.; Huang, Z.; Chen, C. Lonicera rupicola Hook.f.et Thoms flavonoids ameliorated dysregulated inflammatory responses, intestinal barrier, and gut microbiome in ulcerative colitis via PI3K/AKT pathway. Phytomedicine 2022, 104, 154284. [Google Scholar] [CrossRef]
- Shin, K.K.; Park, S.H.; Lim, H.Y.; Lorza, L.R.; Qomaladewia, N.P.; You, L.; Aziz, N.; Kim, S.A.; Lee, J.S.; Choung, E.S.; et al. In Vitro anti-photoaging and skin protective effects of licania macrocarpa cuatrec methanol extract. Plants 2022, 11, 1383. [Google Scholar] [CrossRef]
- Ryu, K.H.; Rhee, H.I.; Kim, J.H.; Yoo, H.; Lee, B.Y.; Um, K.; Kim, K.; Noh, J.; Lim, K.; Chung, J. Anti-inflammatory and analgesic activities of SKLJI, a highly purified and injectable herbal extract of Lonicera japonica. Biosci. Biotechnol. Biochem. 2010, 74, 2022–2028. [Google Scholar] [CrossRef]
- Dayar, E.; Cebova, M.; Lietava, J.; Panghyova, E.; Pechanova, O. Antioxidant effect of Lonicera caerulea L. in the cardiovascular system of obese Zucker rats. Antioxidants 2021, 10, 1199. [Google Scholar] [CrossRef]
- Wang, H.; Tian, L.; Han, Y.; Ma, X.; Hou, Y.; Bai, G. Mechanism assay of honeysuckle for heat-clearing based on metabolites and metabolomics. Metabolites 2022, 12, 121. [Google Scholar] [CrossRef]
- Yang, X.; Liu, Y.; Hou, A.; Yang, Y.; Tian, X.; He, L. Systematic review for geo-authentic Lonicerae japonicae Flos. Front. Med. 2017, 11, 203–213. [Google Scholar] [CrossRef]
- Ni, L.; Chen, L.; Huang, X.; Han, C.; Xu, J.; Zhang, H.; Luan, X.; Zhao, Y.; Xu, J.; Yuan, W.; et al. Combating COVID-19 with integrated traditional Chinese and Western medicine in China. Acta Pharm. Sin. B 2020, 10, 1149–1162. [Google Scholar] [CrossRef]
- Jiang, P.; Sheng, Y.; Chen, Y.; Ji, L.; Wang, Z. Protection of Flos Lonicerae against acetaminophen-induced liver injury and its mechanism. Environ. Toxicol. Pharmacol. 2014, 38, 991–999. [Google Scholar] [CrossRef]
- Zhang, T.; Liu, H.; Bai, X.; Liu, P.; Yang, Y.; Huang, J.; Zhou, L.; Min, X. Fractionation and antioxidant activities of the water-soluble polysaccharides from Lonicera japonica Thunb. Int. J. Biol. Macromol. 2020, 151, 1058–1066. [Google Scholar] [CrossRef]
- Fang, L.; Long, N.; Li, Y.; Liao, X.; Shi, L.; Zhao, H.; Zhou, L.; Kong, W. Transfer behavior of pesticides from honeysuckle into tea infusions: Establishment of an empirical model for transfer rate prediction. Ecotoxicol. Environ. Saf. 2022, 234, 113377. [Google Scholar] [CrossRef]
- Liu, Z.; Xu, L.; Song, P.; Wu, C.; Xu, B.; Li, Z.; Chao, Z. Comprehensive quality evaluation for medicinal and edible Ziziphi Spinosae Semen before and after rancidity based on traditional sensory, physicochemical characteristics, and volatile compounds. Foods 2022, 11, 2320. [Google Scholar] [CrossRef]
- Xiao, O.; Li, M.; Chen, D.; Chen, J.; Simal-Gandara, J.; Dai, X.; Kong, Z. The dissipation, processing factors, metabolites, and risk assessment of pesticides in honeysuckle from field to table. J. Hazard. Mater. 2022, 431, 128519. [Google Scholar] [CrossRef]
- Xiong, L.; Jin, Y.; Huang, W.; Wang, Y.; Huang, W.; Zhang, Y.; Zhao, H.; Zhang, L. Study on the correlation between the color of honeysuckles and the content of phenolic acids. Chin. Trad. Pat. Med. 2022, 44, 2736–2739. [Google Scholar]
- Gu, L.; Xie, X.; Wang, B.; Jin, Y.; Wang, L.; Wang, J.; Yin, G.; Bi, K.; Wang, T. Discrimination of Lonicerae japonicae Flos according to species, growth mode, processing method, and geographical origin with ultra-high performance liquid chromatography analysis and chemical pattern recognition. J. Pharm. Biomed. Anal. 2022, 219, 114924. [Google Scholar] [CrossRef]
- Jintao, X.; Quanwei, Y.; Chunyan, L.; Xiaolong, L.; Bingxuan, N. Rapid and simultaneous quality analysis of the three active components in Lonicerae japonicae Flos by near-infrared spectroscopy. Food Chem. 2021, 342, 128386. [Google Scholar] [CrossRef]
- Pu, X.; Li, Z.; Tian, Y.; Gao, R.; Hao, L.; Hu, Y.; He, C.; Sun, W.; Xu, M.; Peters, R.J.; et al. The honeysuckle genome provides insight into the molecular mechanism of carotenoid metabolism underlying dynamic flower coloration. New Phytol. 2020, 227, 930–943. [Google Scholar] [CrossRef]
- Xia, Y.; Chen, W.; Xiang, W.; Wang, D.; Xue, B.; Liu, X.; Xing, L.; Wu, D.; Wang, S.; Guo, Q.; et al. Integrated metabolic profiling and transcriptome analysis of pigment accumulation in Lonicera japonica flower petals during colour-transition. BMC Plant Biol. 2021, 21, 98. [Google Scholar] [CrossRef]
- Belasco, R.; Edwards, T.; Munoz, A.J.; Rayo, V.; Buono, M.J. Analysis of flower color variations at different developmental stages in two honeysuckle (Lonicera japonica Thunb.) cultivars. Front. Nutr. 2020, 7, 779–782. [Google Scholar]
- Pecho, O.E.; Pérez, M.M.; Ghinea, R.; Della Bona, A. Lightness, chroma and hue differences on visual shade matching. Dent. Mater. 2016, 32, 1362–1373. [Google Scholar] [CrossRef]
- Meloni, D.; Spina, A.; Satta, G.; Chessa, V. A rapid colorimetric method reveals fraudulent substitutions in sea urchin roe marketed in sardinia (Italy). Foods 2016, 5, 47. [Google Scholar] [CrossRef]
- Lee, H.J.; Suh, D.H.; Jung, E.S.; Park, H.M.; Jung, G.; Do, S.; Lee, C.H. Metabolomics of Lonicera caerulea fruit during ripening and its relationship with color and antioxidant activity. Food Res. Int. 2015, 78, 343–351. [Google Scholar] [CrossRef]
- Krasulya, O.; Smirnova, A.; Bogush, V.; Shlenskaya, N.; Vostrikova, N.; Mettu, S. Estimation of the stability of skeletal muscle myoglobin of chilled pork treated with brine activated by low-frequency high-intensity ultrasound. Ultrason. Sonochem. 2021, 71, 105363. [Google Scholar] [CrossRef]
- Gebregziabher, B.S.; Zhang, S.; Ghosh, S.; Shaibu, A.S.; Azam, M.; Abdelghany, A.M.; Qi, J.; Agyenim-Boateng, K.G.; Htway, H.T.P.; Feng, Y.; et al. Origin, maturity group and seed coat color influence carotenoid and chlorophyll concentrations in soybean seeds. Plants 2022, 11, 848. [Google Scholar] [CrossRef]
- Yiming, Z.; Hong, W.; Linlin, C.; Xiaoli, Z.; Wen, T.; Xinli, S. Evolution of nutrient ingredients in tartary buckwheat seeds during germination. Food Chem. 2015, 186, 244–248. [Google Scholar] [CrossRef]
- Zhang, P.; Liu, Y.; Chen, X.; Yang, Z.; Zhu, M.; Li, Y. Pollution resistance assessment of existing landscape plants on Beijing streets based on air pollution tolerance index method. Ecotoxicol. Environ. Saf. 2016, 132, 212–223. [Google Scholar] [CrossRef]
- Liu, C.; Zhang, Z.; Dang, Z.; Xu, J.; Ren, X. New insights on phenolic compound metabolism in pomegranate fruit during storage. Sci. Hortic. 2021, 285, 110138. [Google Scholar] [CrossRef]
- Szydłowska-Czerniak, A.; Momot, M.; Stawicka, B.; Rabiej-Kozioł, D. Effects of the chemical composition on the antioxidant and sensory characteristics and oxidative stability of cold-pressed black cumin oils. Antioxidants 2022, 11, 1556. [Google Scholar] [CrossRef]
- Madrona, A.; Pereira-Caro, G.; Bravo, L.; Mateos, R.; Espartero, J.L. Preparation and antioxidant activity of tyrosyl and homovanillyl ethers. Food Chem. 2011, 129, 1169–1178. [Google Scholar] [CrossRef]
- Proestos, C.; Lytoudi, K.; Mavromelanidou, O.; Zoumpoulakis, P.; Sinanoglou, V. Antioxidant capacity of selected plant extracts and their essential oils. Antioxidants 2013, 2, 11–22. [Google Scholar] [CrossRef]
- Benzie, I.F.F.; Strain, J.J. The ferric reducing ability of plasma (FRAP) as a measure of “antioxidant power”: The FRAP Assay. Anal. Biochem. 1996, 239, 70–76. [Google Scholar] [CrossRef]
- Tolpeznikaite, E.; Starkute, V.; Zokaityte, E.; Ruzauskas, M.; Pilkaityte, R.; Viskelis, P.; Urbonaviciene, D.; Ruibys, R.; Rocha, J.M.; Bartkiene, E. Effect of solid-state fermentation and ultrasonication processes on antimicrobial and antioxidant properties of algae extracts. Front. Nutr. 2022, 9, 990274. [Google Scholar] [CrossRef]
- Zheng, Y.; Li, D.; Sun, J.; Cheng, J.; Chai, C.; Zhang, L.; Peng, G. Comprehensive comparison of two color varieties of perillae folium using rapid resolution liquid chromatography coupled with quadruple-time-of-flight mass spectrometry (RRLC-Q/TOF-MS) based metabolic profile andin Vivo/in Vitro anti-oxidative activity. J. Agric. Food. Chem. 2020, 68, 14684–14697. [Google Scholar] [CrossRef]
- Wu, C.; Wang, H.; Liu, Z.; Xu, B.; Li, Z.; Song, P.; Chao, Z. Untargeted metabolomics coupled with chemometrics for leaves and stem barks of Dioecious morus alba L. Metabolites 2022, 12, 106. [Google Scholar] [CrossRef]
- Mais, E.; Alolga, R.N.; Wang, S.; Linus, L.O.; Yin, X.; Qi, L. A comparative UPLC-Q/TOF-MS-based metabolomics approach for distinguishing Zingiber officinale Roscoe of two geographical origins. Food Chem. 2018, 240, 239–244. [Google Scholar] [CrossRef]
- Kus, P.M.; Jerkovic, I.; Marijanovic, Z.; Kranjac, M.; Tuberoso, C. Unlocking Phacelia tanacetifolia Benth. honey characterization through melissopalynological analysis, color determination and volatiles chemical profiling. Food Res. Int. 2018, 106, 243–253. [Google Scholar] [CrossRef]
- Kulapichitr, F.; Borompichaichartkul, C.; Fang, M.; Suppavorasatit, I.; Cadwallader, K.R. Effect of post-harvest drying process on chlorogenic acids, antioxidant activities and CIE-Lab color of Thai Arabica green coffee beans. Food Chem. 2022, 366, 130504. [Google Scholar] [CrossRef] [PubMed]
- Cheng, X.; Ji, H.; Cheng, C.; Sun, Y.; Cheng, H.; Wang, D.; Pan, Y.; Liu, X. Comprehensive determination of the processing level of rhizome of Polygonatum sibiricum by macroscopic, micromorphological, and microscopic characterizations. Microsc. Res. Tech. 2022, 85, 2669–2678. [Google Scholar] [CrossRef] [PubMed]
- Zulfiqar, F.; Chen, J.; Younis, A.; Abideen, Z.; Naveed, M.; Koyro, H.; Siddique, K.H.M. Biochar, compost, and biochar-compost blend applications modulate growth, photosynthesis, osmolytes, and antioxidant system of medicinal plant Alpinia zerumbet. Front. Plant Sci. 2021, 12, 707061. [Google Scholar] [CrossRef] [PubMed]
- Gaglianone, L.A.; Martins, J.D.; Rossi, T.R.; Saraiva, L.O.; Cavalcanti, A.N.; Mathias, P. Changes on the color parameters of air-abraded resin composite exposed to different colored beverages. J. Investig. Clin. Dent. 2011, 2, 201–206. [Google Scholar] [CrossRef]
- Chazaux, M.; Schiphorst, C.; Lazzari, G.; Caffarri, S. Precise estimation of chlorophyll a,b and carotenoid content by deconvolution of the absorption spectrum and new simultaneous equations for Chl determination. Plant J. 2022, 109, 1630–1648. [Google Scholar] [CrossRef]
- Zhao, Y.; Dou, D.; Guo, Y.; Qi, Y.; Li, J.; Jia, D. Comparison of the trace elements and active components of Lonicera japonica flos and Lonicera flos using ICP-MS and HPLC-PDA. Biol. Trace Elem. Res. 2018, 183, 379–388. [Google Scholar] [CrossRef]
- Yang, L.; Jiang, H.; Xing, X.; Yan, M.; Guo, X.; Man, W.; Hou, A.; Yang, L. A Biosensor-based quantitative analysis system of major active ingredients in Lonicera japonica Thunb. using UPLC-QDa and chemometric analysis. Molecules 2019, 24, 1787. [Google Scholar] [CrossRef]
- Song, S.; Shin, Y.; Lee, J.; Shin, S. Color stability of provisional restorative materials with different fabrication methods. J. Adv. Prosthodont. 2020, 12, 259. [Google Scholar] [CrossRef]
- Patsilinakos, A.; Ragno, R.; Carradori, S.; Petralito, S.; Cesa, S. Carotenoid content of Goji berries: CIELAB, HPLC-DAD analyses and quantitative correlation. Food Chem. 2018, 268, 49–56. [Google Scholar] [CrossRef]
- Sun, B.; Liu, H.; Li, W.; Zhou, S. A Color gamut description algorithm for liquid crystal displays in CIELAB space. Sci. World J. 2014, 2014, 671964. [Google Scholar]
- Cesa, S.; Carradori, S.; Bellagamba, G.; Locatelli, M.; Casadei, M.A.; Masci, A.; Paolicelli, P. Evaluation of processing effects on anthocyanin content and colour modifications of blue berry (Vaccinium spp.) extracts: Comparison between HPLC-DAD and CIELAB analyses. Food Chem. 2017, 232, 114–123. [Google Scholar] [CrossRef] [PubMed]
- Pinela, J.; Barros, L.; Antonio, A.; Carvalho, A.; Oliveira, M.; Ferreira, I. Quality control of gamma irradiated dwarf mallow (Malva neglecta Wallr.) based on color, organic acids, total phenolics and antioxidant parameters. Molecules 2016, 21, 467. [Google Scholar] [CrossRef]
- Jiménez-Zamora, A.; Delgado-Andrade, C.; Rufián-Henares, J.A. Antioxidant capacity, total phenols and color profile during the storage of selected plants used for infusion. Food Chem. 2016, 199, 339–346. [Google Scholar] [CrossRef] [PubMed]
- Kamber, U.; Gulbaz, G.; Aksu, P.; Dogan, A. Detoxification of aflatoxin B-1 in red pepper (Capsicum annuum L.) by ozone treatment and its effect on microbiological and sensory quality. J. Food Process Preserv. 2017, 41, e13102. [Google Scholar] [CrossRef]
- Sanmartín, P.; Villa, F.; Silva, B.; Cappitelli, F.; Prieto, B. Color measurements as a reliable method for estimating chlorophyll degradation to phaeopigments. Biodegradation 2011, 22, 763–771. [Google Scholar] [CrossRef]
- Primka, E.J.; Smith, W.K. Synchrony in fall leaf drop: Chlorophyll degradation, color change, and abscission layer formation in three temperate deciduous tree species. Am. J. Bot. 2019, 106, 377–388. [Google Scholar] [CrossRef]
- Gansukh, E.; Kazibwe, Z.; Pandurangan, M.; Judy, G.; Kim, D.H. Probing the impact of quercetin-7-O-glucoside on influenza virus replication influence. Phytomedicine 2016, 23, 958–967. [Google Scholar] [CrossRef]
- Cai, Z.; Liu, X.; Chen, H.; Yang, R.; Chen, J.; Zou, L.; Wang, C.; Chen, J.; Tan, M.; Mei, Y.; et al. Variations in morphology, physiology, and multiple bioactive constituents of Lonicerae japonicae Flos under salt stress. Sci. Rep. 2021, 11, 3939. [Google Scholar] [CrossRef]
- Yang, C.; Zhao, Q.; Yang, S.; Wang, L.; Xu, X.; Li, L.; Al-Jamal, W.T. Intravenous administration of scutellarin nanoparticles augments the protective effect against cerebral ischemia-reperfusion injury in rats. Mol. Pharm. 2022, 19, 1410–1421. [Google Scholar] [CrossRef]
- Wysocka, I.; Kowalska, E.; Trzciński, K.; Łapiński, M.; Nowaczyk, G.; Zielińska-Jurek, A. UV-Vis-Induced degradation of phenol over magnetic photocatalysts modified with Pt, Pd, Cu and Au nanoparticles. Nanomaterials 2018, 8, 28. [Google Scholar] [CrossRef]
- Jiménez-González, O.; López-Malo, A.; González-Pérez, J.E.; Ramírez-Corona, N.; Guerrero-Beltrán, J.Á. Thermal and pH stability of Justicia spicigera (Mexican honeysuckle) pigments: Application of mathematical probabilistic models to predict pigments stability. Food Chem. Mol. Sci. 2023, 6, 100158. [Google Scholar] [CrossRef] [PubMed]


| No. | Identification | Rt (min) | Protonated Molecular Ion | Molecular Formula | Error (ppm) | Fragment Ions | Classification |
|---|---|---|---|---|---|---|---|
| 1 | Glutamine | 0.77 | [M − H]− | C5H10N2O3 | −2.261 | 102.0551, 88.0404 | Amino acid |
| 2 | 5-Hydroxymethyl-2-furancarbox Aldehyde | 0.79 | [3M − H]− | C6H6O3 | −3.837 | 215.0350, 126.0316 | Aldehyde |
| 3 | Inosine | 0.79 | [M − H]− | C10H12N4O5 | −4.551 | 237.0629, 195.0510, 191.0562, 179.0561 | Nucleoside |
| 4 | α-D-Glucopyranose | 0.83 | [M − H]− | C6H12O6 | −1.048 | 149.0455, 129.0189, 113.0237, 101.0236 | Others |
| 5 | Malic acid | 0.87 | [M − H]− | C4H6O5 | −5.082 | 133.0137, 115.0029, 71.0079 | Organic acid |
| 6 | Citric acid | 0.85 | [M − H]− | C6H8O7 | −0.075 | 111.0084, 87.0126 | Organic acid |
| 7 | Uridine | 1.06 | [M − H]− | C9H12N2O6 | −1.537 | 243.0615, 143.0728, 85.0286 | Nucleoside |
| 8 | L-(-)-Tyrosine | 1.09 | [M − H]− | C9H11NO3 | −2.909 | 180.0659, 163.0400 | Amino acid |
| 9 | Succinic acid | 1.18 | [M − H]− | C4H6O4 | −6.460 | 117.0186, 114.0553, 96.9622 | Organic acid |
| 10 | Secologanoside | 1.84 | [M − H]− | C16H22O11 | −0.347 | 389.1085, 227.0561, 209.0450, 183.0657, 165.0555 | Iridoid |
| 11 | Phenylalanine | 1.87 | [M − H]− | C9H11NO2 | −4.009 | 164.0709, 146.0444, 103.0527 | Amino acid |
| 12 | Pantothenic acid | 2.07 | [M − H]− | C9H17NO5 | −2.742 | 218.1026, 146.0811 | Organic acid |
| 13 | Protocatechuic acid | 2.23 | [M − H]− | C7H6O4 | −3.977 | 153.0186, 109.0285, 108.0207 | Phenolic acid |
| 14 | Neochlorogenic acid * | 2.49 | [M − H]− | C16H18O9 | −0.631 | 191.0560, 179.0347, 135.0446, 85.0295 | Phenolic acid |
| 15 | Lamalbide | 2.67 | [M − H]− | C17H26O12 | −0.688 | 240.0711, 191.0577, 179.0546 | Iridoid |
| 16 | Loganic acid | 2.78 | [M − H]− | C16H24O10 | −0.610 | 375.1294, 213.0764, 169.0865, 151.0756 | Iridoid |
| 17 | L-Tryptophan | 2.83 | [M − H]− | C11H12N2O2 | −3.046 | 203.0817, 186.0560, 116.0505 | Amino acid |
| 18 | Methyl caffeate | 3.02 | [3M − H]− | C10H10O4 | 6.264 | 161.0242, 135.0443 | Ester |
| 19 | 8-Epi-loganic acid | 3.13 | [M − H]− | C16H24O10 | −0.711 | 375.1295, 213.0766 | Organic acid |
| 20 | 3,4-Dihydroxybenzaldehyde | 3.17 | [M − H]− | C7H6O3 | −3.708 | 136.0159, 108.0217 | Aldehyde |
| 21 | Chlorogenic acid * | 3.49 | [M − H]− | C16H18O9 | −0.645 | 191.0575, 127.0315, 85.0295 | Phenolic acid |
| 22 | 1-O-methyl-myo-inositol | 3.58 | [M − H2O − H]− | C7H14O6 | −1.722 | 115.0401 | Alcohol |
| 23 | Morroniside | 3.59 | [M − H]− | C17H26O11 | −0.431 | 405.1402, 375.1292, 343.1034, 243.0871, 195.0657, 179.0551 | Iridoid |
| 24 | Vanillic acid | 3.60 | [3M − H]− | C8H8O4 | −4.013 | 375.1293, 243.0871, 195.0657, 123.0451 | Phenolic acid |
| 25 | Dimethyl secologanoside | 3.76 | [M − H]− | C18H26O11 | −2.787 | 353.0875, 191.0561, 173.0455, 155.0350 | Iridoid |
| 26 | Quinic acid | 3.77 | [M − H2O − H]− | C7H12O6 | −2.208 | 173.0455, 137.0239, 93.0346 | Phenolic acid |
| 27 | Cryptochlorogenic acid * | 3.77 | [M − H]− | C16H18O9 | −0.592 | 353.0874, 191.0561,127.0446 | Phenolic acid |
| 28 | Harpagide | 3.85 | [M − H2O − H]− | C15H24O10 | 0.258 | 345.1190, 209.0454, 183.0661, 165.0555, 101.0237 | Iridoid |
| 29 | Apioside | 3.97 | [M − H2O − H]− | C26H28O14 | −2.645 | 527.1195, 353.0872, 215.0562, 97.0295 | Iridoid |
| 30 | Caffeic acid * | 3.99 | [M − H]− | C9H8O4 | 2.831 | 135.0446 | Phenolic acid |
| 31 | Methyl benzoate | 4.01 | [M − H]− | C8H8O2 | −4.546 | 135.0445, 134.0367, 121.0295 | Ester |
| 32 | Secologanic acid | 4.16 | [M − H]− | C16H22O10 | 0.011 | 193.0505, 149.0603, 105.0361 | Iridoid |
| 33 | 3,5-O-Dicaffeoylquinic ethyl ester | 4.26 | [M − H]− | C27H28O12 | −4.231 | 507.1718, 357.1187, 191.1178 | Phenolic acid |
| 34 | Secoxyloganin | 4.30 | [M − H]− | C17H24O11 | −0.060 | 149.0504, 121.0193 | Iridoid |
| 35 | 1-O-Caffeoylquinic acid | 4.63 | [M − H]− | C16H18O9 | −0.235 | 191.0561, 179.0455, 135.0295 | Phenolic acid |
| 36 | 4-O-Caffeoylquinic acid | 4.64 | [M − H]− | C16H18O9 | −0.673 | 191.0561, 85.0295 | Phenolic acid |
| 37 | 4′-O-β-D-glucosyl-cis-p-coumaric acid | 4.79 | [M − H2O − H]− | C15H18O8 | 8.857 | 307.0824, 269.1027, 179.0561, 161.0450, 113.0245, 101.0236 | Phenolic acid |
| 38 | 7-O-ethyl sweroside | 4.80 | [M − H]− | C18H26O10 | −1.834 | 401.1448, 175.0450, 101.0236 | Iridoid |
| 39 | Kaempferol-3-O-β-D-rutinoside | 4.92 | [M − H]− | C27H30O15 | −0.063 | 447.1185, 285.0418 | Flavonoid |
| 40 | Sweroside | 5.11 | [M + HCOO]− | C16H22O9 | −0.543 | 151.0660, 149.0560, 125.0239 | Iridoid |
| 41 | Guanosine | 5.20 | [M − H]− | C10H13N5O5 | 1.451 | 282.0816, 133.0524 | Nucleoside |
| 42 | Loganin | 5.41 | [M + HCOO]− | C17H26O10 | −2.289 | 389.1721, 227.1130 | Iridoid |
| 43 | 3-O-feruloyl-D-quinic acid | 5.44 | [M − H]− | C17H20O9 | −1.071 | 191.0561, 173.0451, 117.0353 | Phenolic acid |
| 44 | Quercetin 3-O-sambubioside | 6.12 | [M − H]− | C26H28O16 | 0.605 | 300.0275, 271.0248, 151.0037 | Flavonoid |
| 45 | 7-Epi-vogeloside | 6.38 | [M − H]− | C17H24O10 | −1.784 | 387.1290, 373.1139, 255.0765, 179.0546, 155.0345, 101.0237, 89.0235 | Iridoid |
| 46 | Quercetin 7-O-glucoside * | 6.38 | [M − H]− | C21H20O12 | 0.805 | 301.0275, 271.0254, 151.0032 | Flavonoid |
| 47 | Ferulic acid * | 6.46 | [M − H]− | C10H10O4 | 5.645 | 149.0621, 133.0256 | Phenolic acid |
| 48 | Rutin * | 6.70 | [M − H]− | C27H30O16 | 0.805 | 301.0276 | Flavonoid |
| 49 | L-Phenylalanino secologanin | 6.70 | [M − H]− | C26H35NO11 | 0.648 | 300.0276, 271.0249, 164.0714 | Iridoid |
| 50 | Hyperoside | 6.78 | [M − H]− | C21H20O12 | −0.157 | 301.0274, 283.0248, 255.0298, 151.0037 | Flavonoid |
| 51 | Luteolin-7-O-neohesperidoside | 7.05 | [M − H]− | C27H30O15 | 0.380 | 447.0925, 285.0403, 135.0451 | Flavonoid |
| 52 | Luteolin | 7.23 | [M − H]− | C15H10O6 | −2.078 | 199.0428, 151.0037, 133.0281 | Flavonoid |
| 53 | Cynaroside | 7.24 | [M − H]− | C21H20O11 | −0.580 | 447.0929, 327.0510, 285.0404, 133.0295 | Iridoid |
| 54 | Secologanin dimethyl acetal | 7.41 | [M − H2O − H]− | C20H34O11 | −1.676 | 433.1647, 373.1133, 353.0871, 291.0866, 191.0557, 173.0451 | Iridoid |
| 55 | Lonicerin * | 7.46 | [M − H]− | C27H30O15 | 0.202 | 285.0104 | Flavonoid |
| 56 | 3′,4′,5,5′,7-Pentamethoxyflavone | 7.51 | [2M − H]− | C20H20O7 | 7.741 | 743.2399, 729.2189, 179.0350 | Flavonoid |
| 57 | Kaempferol-3-O-Rutinoside | 7.73 | [M − H]− | C27H30O15 | 0.270 | 593.1511, 285.0400, 255.0299 | Flavonoid |
| 58 | Isochlorogenic acid B * | 7.80 | [M − H]− | C25H24O12 | −2.700 | 353.0874, 191.0561, 179.0350, 173.0455, 161.0238, 135.0446 | Phenolic acid |
| 59 | Isochlorogenic acid A * | 7.98 | [M − H]− | C25H24O12 | −3.419 | 353.0877, 191.0372, 179.0348, 173.0452, 135.0445 | Phenolic acid |
| 60 | Isochlorogenic acid C * | 8.04 | [M − H]− | C25H24O12 | −2.925 | 353.0876, 191.0564, 179.0351, 173.0485, 155.0362, 135.0445 | Phenolic acid |
| 61 | Quercetin * | 8.10 | [M − H]− | C15H10O7 | 0.431 | 301.0658, 193.0315, 151.2276 | Flavonoid |
| 62 | Isorhamnetin-3-O-glucoside | 8.14 | [M − H]− | C22H22O12 | −0.469 | 314.0423, 285.0399 | Flavonoid |
| 63 | Kingiside | 8.18 | [M − H]− | C17H24O11 | −1.296 | 165.0558, 149.0261, 119.0322 | Iridoid |
| 64 | Paeonol | 8.23 | [3M − H]− | C9H10O3 | −4.502 | 497.1817, 461.2023, 395.1917, 261.1337, 96.9686 | Phenolic acid |
| 65 | Isomer | 8.29 | [M − H]− | C33H44O19 | 0.124 | 511.1104, 467.1526, 339.1299, 287.1401, 255.1931 | Iridoid |
| 66 | Apigetrin | 8.48 | [M − H]− | C21H20O10 | −0.686 | 431.0980, 339.0510, 268.0375 | Flavonoid |
| 67 | Isorhamnetin-3-O-β-D-rutinoside | 8.53 | [M − H]− | C28H32O16 | −0.815 | 315.1563, 300.0455 | Flavonoid |
| 68 | Viscumneoside III | 8.53 | [M − H2O − H]− | C27H32O15 | 0.003 | 577.1563, 569.1875, 535.1458, 195.0662, 151.0764 | Flavonoid |
| 69 | 7-Hydroxycoumarin | 8.76 | [M − H]− | C9H6O3 | −3.108 | 161.0240, 150.0332, 137.0239, 135.0447, 133.0289 | Flavonoid |
| 70 | Chrysoeriol 7-O-glucoside | 8.92 | [M − H]− | C22H22O11 | −0.597 | 298.0561, 283.0506, 255.2143 | Flavonoid |
| 71 | Tricin 7-O-β-D-glucoside | 8.99 | [M − H]− | C23H24O12 | −1.523 | 491.1188, 476.0960, 447.0924 | Flavonoid |
| 72 | Harpagoside | 9.12 | [M − H]− | C24H30O11 | −3.582 | 493.1714, 313.1081, 179.0561, 161.0455, 71.0138 | Iridoid |
| 73 | Centauroside | 9.12 | [M − H]− | C34H46O19 | 0.683 | 725.2298, 595.2032, 525.1613, 179.0561 | Iridoid |
| 74 | Nonadecane | 9.12 | [3M − H]− | C19H40 | −6.636 | 757.2564, 595.2034, 525.1615, 493.1714 | Alkane |
| 75 | (E)-Aldosecologanin | 9.69 | [M − H]− | C34H46O19 | 0.087 | 757.2556, 577.2032, 483.1713, 367.1034, 119.0561 | Iridoid |
| 76 | Cyanin chloride | 9.84 | [M − H2O − H]− | C27H31ClO16 | −1.603 | 529.1349, 367.1028, 353.0875, 191.0561 | others |
| 77 | Rhoifolin | 10.11 | [M − H]− | C27H30O14 | 1.199 | 413.0882, 269.0451 | Flavonoid |
| 78 | 3-Indoleacrylic acid | 10.45 | [3M − H]− | C11H9NO2 | −9.405 | 284.0923, 252.0666, 172.0767 | Organic acid |
| 79 | 3,4-O-Dicaffeoylquinic acid methyl ester | 10.50 | [M − H]− | C26H26O12 | −0.635 | 367.1018, 179.0349, 161.0241, 135.0451 | Phenolic acid |
| 80 | Abscisic acid | 10.80 | [M − H]− | C15H20O4 | −2.198 | 245.1382, 209.1155, 152.0914 | Phenolic acid |
| 81 | Kaempferol * | 10.85 | [M − H]− | C15H10O6 | −0.425 | 285.0403, 215.0299, 175.0506, 151.0037, 133.0295 | Flavonoid |
| 82 | 3,4,5-Tricaffeoylquinic acid | 11.44 | [M − H]− | C34H30O15 | −0.040 | 677.1506, 515.1193, 179.0364, 161.0242, 135.0444 | Phenolic acid |
| 83 | Madreselvin A | 11.51 | [M − H]− | C29H34O16 | −0.654 | 315.0432, 300.4218 | Flavonoid |
| 84 | Aloinoside A | 11.64 | [M − H]− | C27H32O13 | 0.760 | 563.1769, 113.0244, 101.0244 | Flavonoid |
| 85 | Macranthoside B | 11.76 | [M − H]− | C53H86O22 | 1.195 | 1073.5543, 937.5166, 749.4481 | Saponin |
| 86 | Apigenin | 11.89 | [M − H]− | C15H10O5 | −2.416 | 117.0185 | Flavonoid |
| 87 | Macranthoidin A | 11.92 | [M − H]− | C59H96O27 | −0.441 | 911.4579, 749.4481, 603.3887, 471.3681 | Saponin |
| 88 | Hydnocarpin | 12.71 | [M − H]− | C25H20O9 | −0.968 | 463.1025, 285.0392, 283.0240 | Flavonoid |
| 89 | Decyl aldehyde | 15.54 | [2M − H]− | C10H20O | −2.384 | 311.2950, 281.2475, 253.2173, 199.1704, 125.0972 | Aldehyde |
| 90 | Lauric acid | 15.76 | [2M − H]− | C12H24O2 | −2.341 | 399.3480, 297.2800, 255.2326 | Organic acid |
| 91 | Citronellol | 15.79 | [2M − H]− | C10H20O | −0.555 | 311.2953, 281.2850, 255.2329, 197.1911, 183.1755 | Alcohol |
| 92 | Oleanic acid | 15.82 | [M − H]− | C30H48O3 | −1.861 | 438.3207, 249.1672, 203.4275, 189.3225, 133.8216 | Saponin |
| 93 | Tridecylic acid | 16.52 | [2M − H]− | C13H26O2 | −1.863 | 427.3793, 353.3061, 255.2326 | Organic acid |
| chla | chlb | chlT | TPC | TFC | AAABTS | AADPPH | AAFRAP | |
|---|---|---|---|---|---|---|---|---|
| L* | −0.07 | 0.01 | −0.05 | −0.21 | 0.55 ** | 0.41 ** | 0.66 ** | 0.54 ** |
| a* | −0.65 ** | −0.73 ** | −0.69 ** | −0.32 * | −0.66 ** | −0.48 ** | −0.71 ** | −0.49 ** |
| b* | 0.32 * | 0.26 | 0.31 * | 0.67 ** | −0.02 | 0.02 | 0.13 | 0.28 * |
| C* | 0.22 | 0.14 | 0.21 | 0.62 ** | −0.09 | 0.01 | 0.06 | 0.14 |
| h* | 0.68 ** | 0.74 ** | 0.72 ** | 0.37 ** | 0.68 ** | 0.49 ** | 0.75 ** | 0.54 ** |
| ΔE | 0.10 | −0.03 | 0.07 | 0.25 | −0.53 ** | −0.42 ** | −0.66 ** | −0.52 ** |
| 1 | 2 | 3 | 4 | 5 | 6 | 7 | 8 | 9 | 10 | |
|---|---|---|---|---|---|---|---|---|---|---|
| L* | −0.37 ** | 0.46 * | 0.17 | −0.49 ** | 0.09 | 0.65 ** | 0.13 | 0.13 | −0.05 | −0.32 * |
| a* | 0.69 ** | −0.64 ** | −0.06 | 0.41 ** | 0.34 * | −0.57 ** | 0.32 * | 0.56 ** | 0.54 ** | 0.47 ** |
| b* | −0.06 | 0.18 | −0.03 | −0.24 | 0.09 | −0.10 | −0.07 | −0.05 | −0.03 | −0.15 |
| C* | 0.14 | 0.09 | −0.02 | −0.17 | 0.13 | −0.23 | −0.01 | 0.04 | 0.07 | −0.08 |
| h* | −0.68 ** | 0.65 ** | 0.07 | −0.38 ** | −0.35 ** | 0.56 ** | −0.29 * | −0.55 ** | −0.51 ** | −0.44 ** |
| ΔE | 0.42 ** | −0.35 ** | −0.12 | 0.31 * | −0.04 | −0.58 ** | −0.15 | −0.03 | 0.04 | 0.17 |
| R | R2 | Adjusted R2 | Durbin-Watson |
|---|---|---|---|
| 0.735b | 0.540 | 0.513 | 1.619 |
| Model | Sum of Squares | Df | Mean Square | F | Sig. |
|---|---|---|---|---|---|
| Regression | 752.348 | 3 | 250.783 | 19.991 | 0.000 |
| Residual | 639.796 | 51 | 12.545 | ||
| Total | 1392.143 | 54 |
| Model | Unstandardized Coefficients | Collinearity Statistics | |
|---|---|---|---|
| B | Tolerance | VIF | |
| (Constant) | −7.784 | ||
| L* | 0.076 | 0.535 | 1.868 |
| a* | −0.619 | 0.770 | 1.299 |
| b* | 1.361 | 0.634 | 1.578 |
Disclaimer/Publisher’s Note: The statements, opinions and data contained in all publications are solely those of the individual author(s) and contributor(s) and not of MDPI and/or the editor(s). MDPI and/or the editor(s) disclaim responsibility for any injury to people or property resulting from any ideas, methods, instructions or products referred to in the content. |
© 2023 by the authors. Licensee MDPI, Basel, Switzerland. This article is an open access article distributed under the terms and conditions of the Creative Commons Attribution (CC BY) license (https://creativecommons.org/licenses/by/4.0/).
Share and Cite
Liu, Z.; Cheng, Y.; Chao, Z. A Comprehensive Quality Analysis of Different Colors of Medicinal and Edible Honeysuckle. Foods 2023, 12, 3126. https://doi.org/10.3390/foods12163126
Liu Z, Cheng Y, Chao Z. A Comprehensive Quality Analysis of Different Colors of Medicinal and Edible Honeysuckle. Foods. 2023; 12(16):3126. https://doi.org/10.3390/foods12163126
Chicago/Turabian StyleLiu, Zhenying, Yunxia Cheng, and Zhimao Chao. 2023. "A Comprehensive Quality Analysis of Different Colors of Medicinal and Edible Honeysuckle" Foods 12, no. 16: 3126. https://doi.org/10.3390/foods12163126