
The Effect of Response Conditions on Food Images-Evoked Emotions Measured Using the Valence × Arousal Circumplex-Inspired Emotion Questionnaire (CEQ)


Abstract
:1. Introduction
2. Study 1—Comparison between Single and Multiple Response Conditions with Respect to Food Image-Evoked Emotions Rated within One Session in the Within-Participants Design
2.1. Materials and Methods
2.1.1. Participants
2.1.2. Food Images
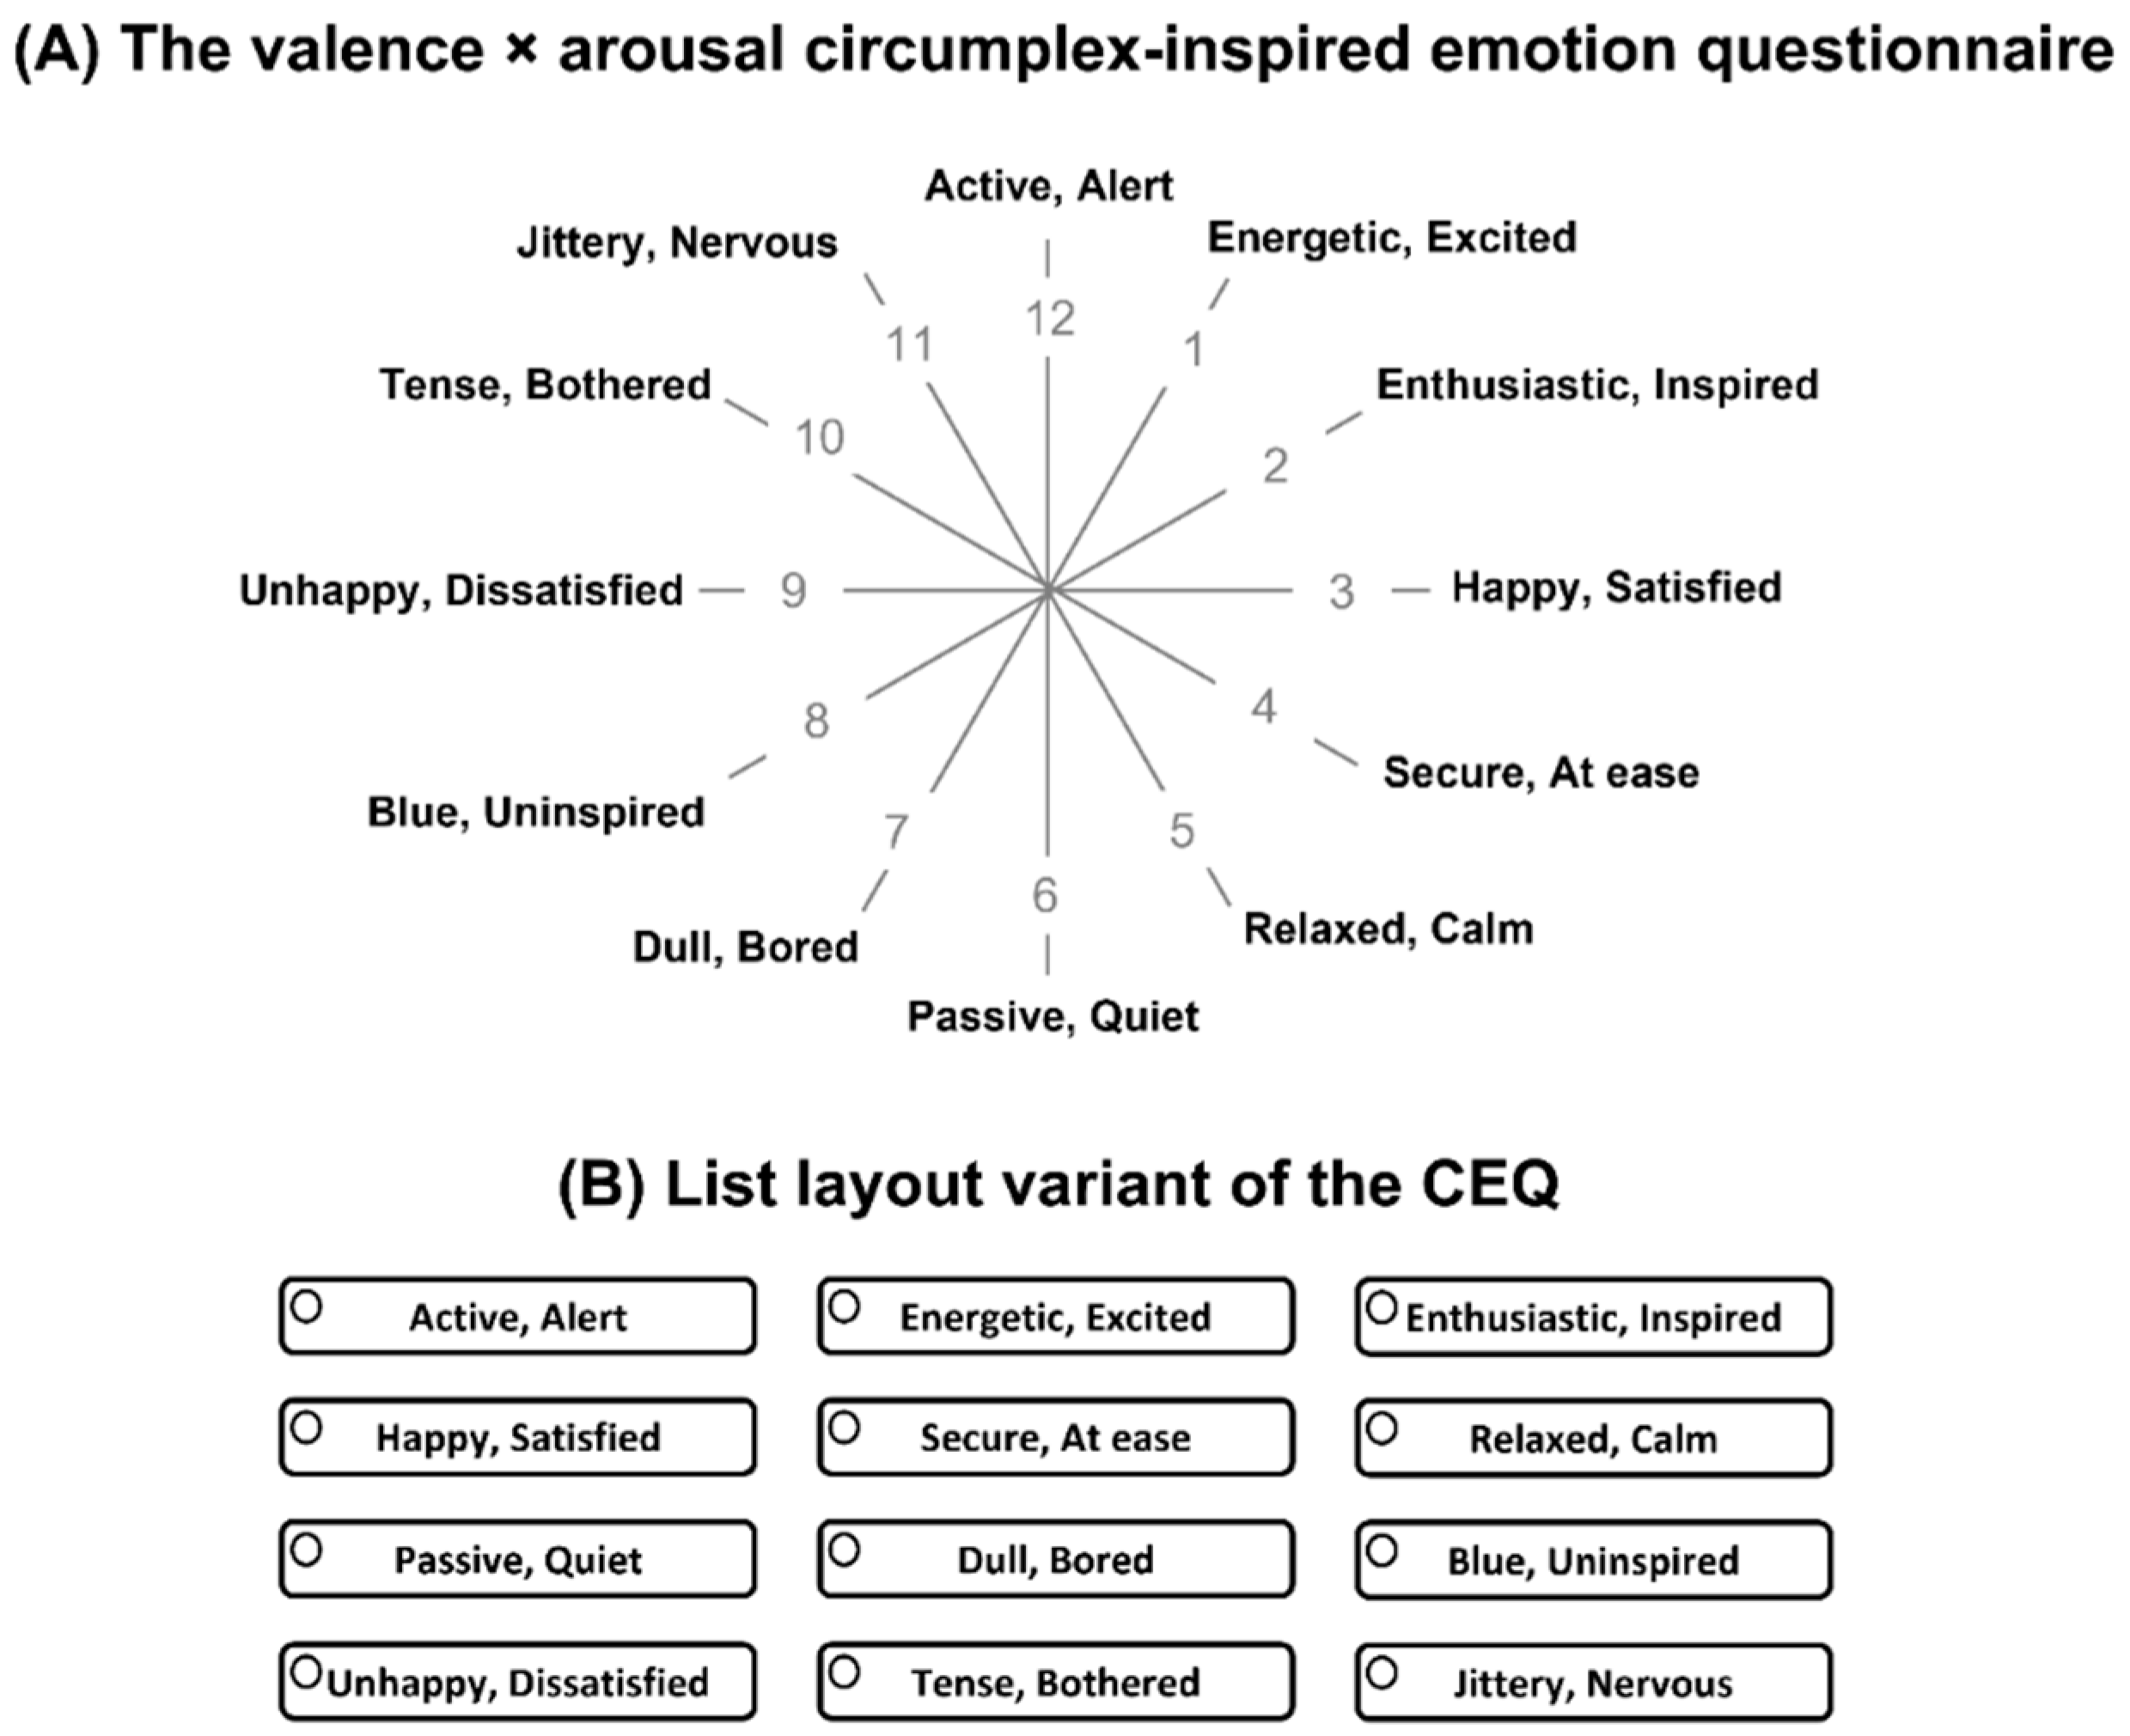
2.1.3. Procedure
2.1.4. Data Analysis
2.2. Results and Discussion
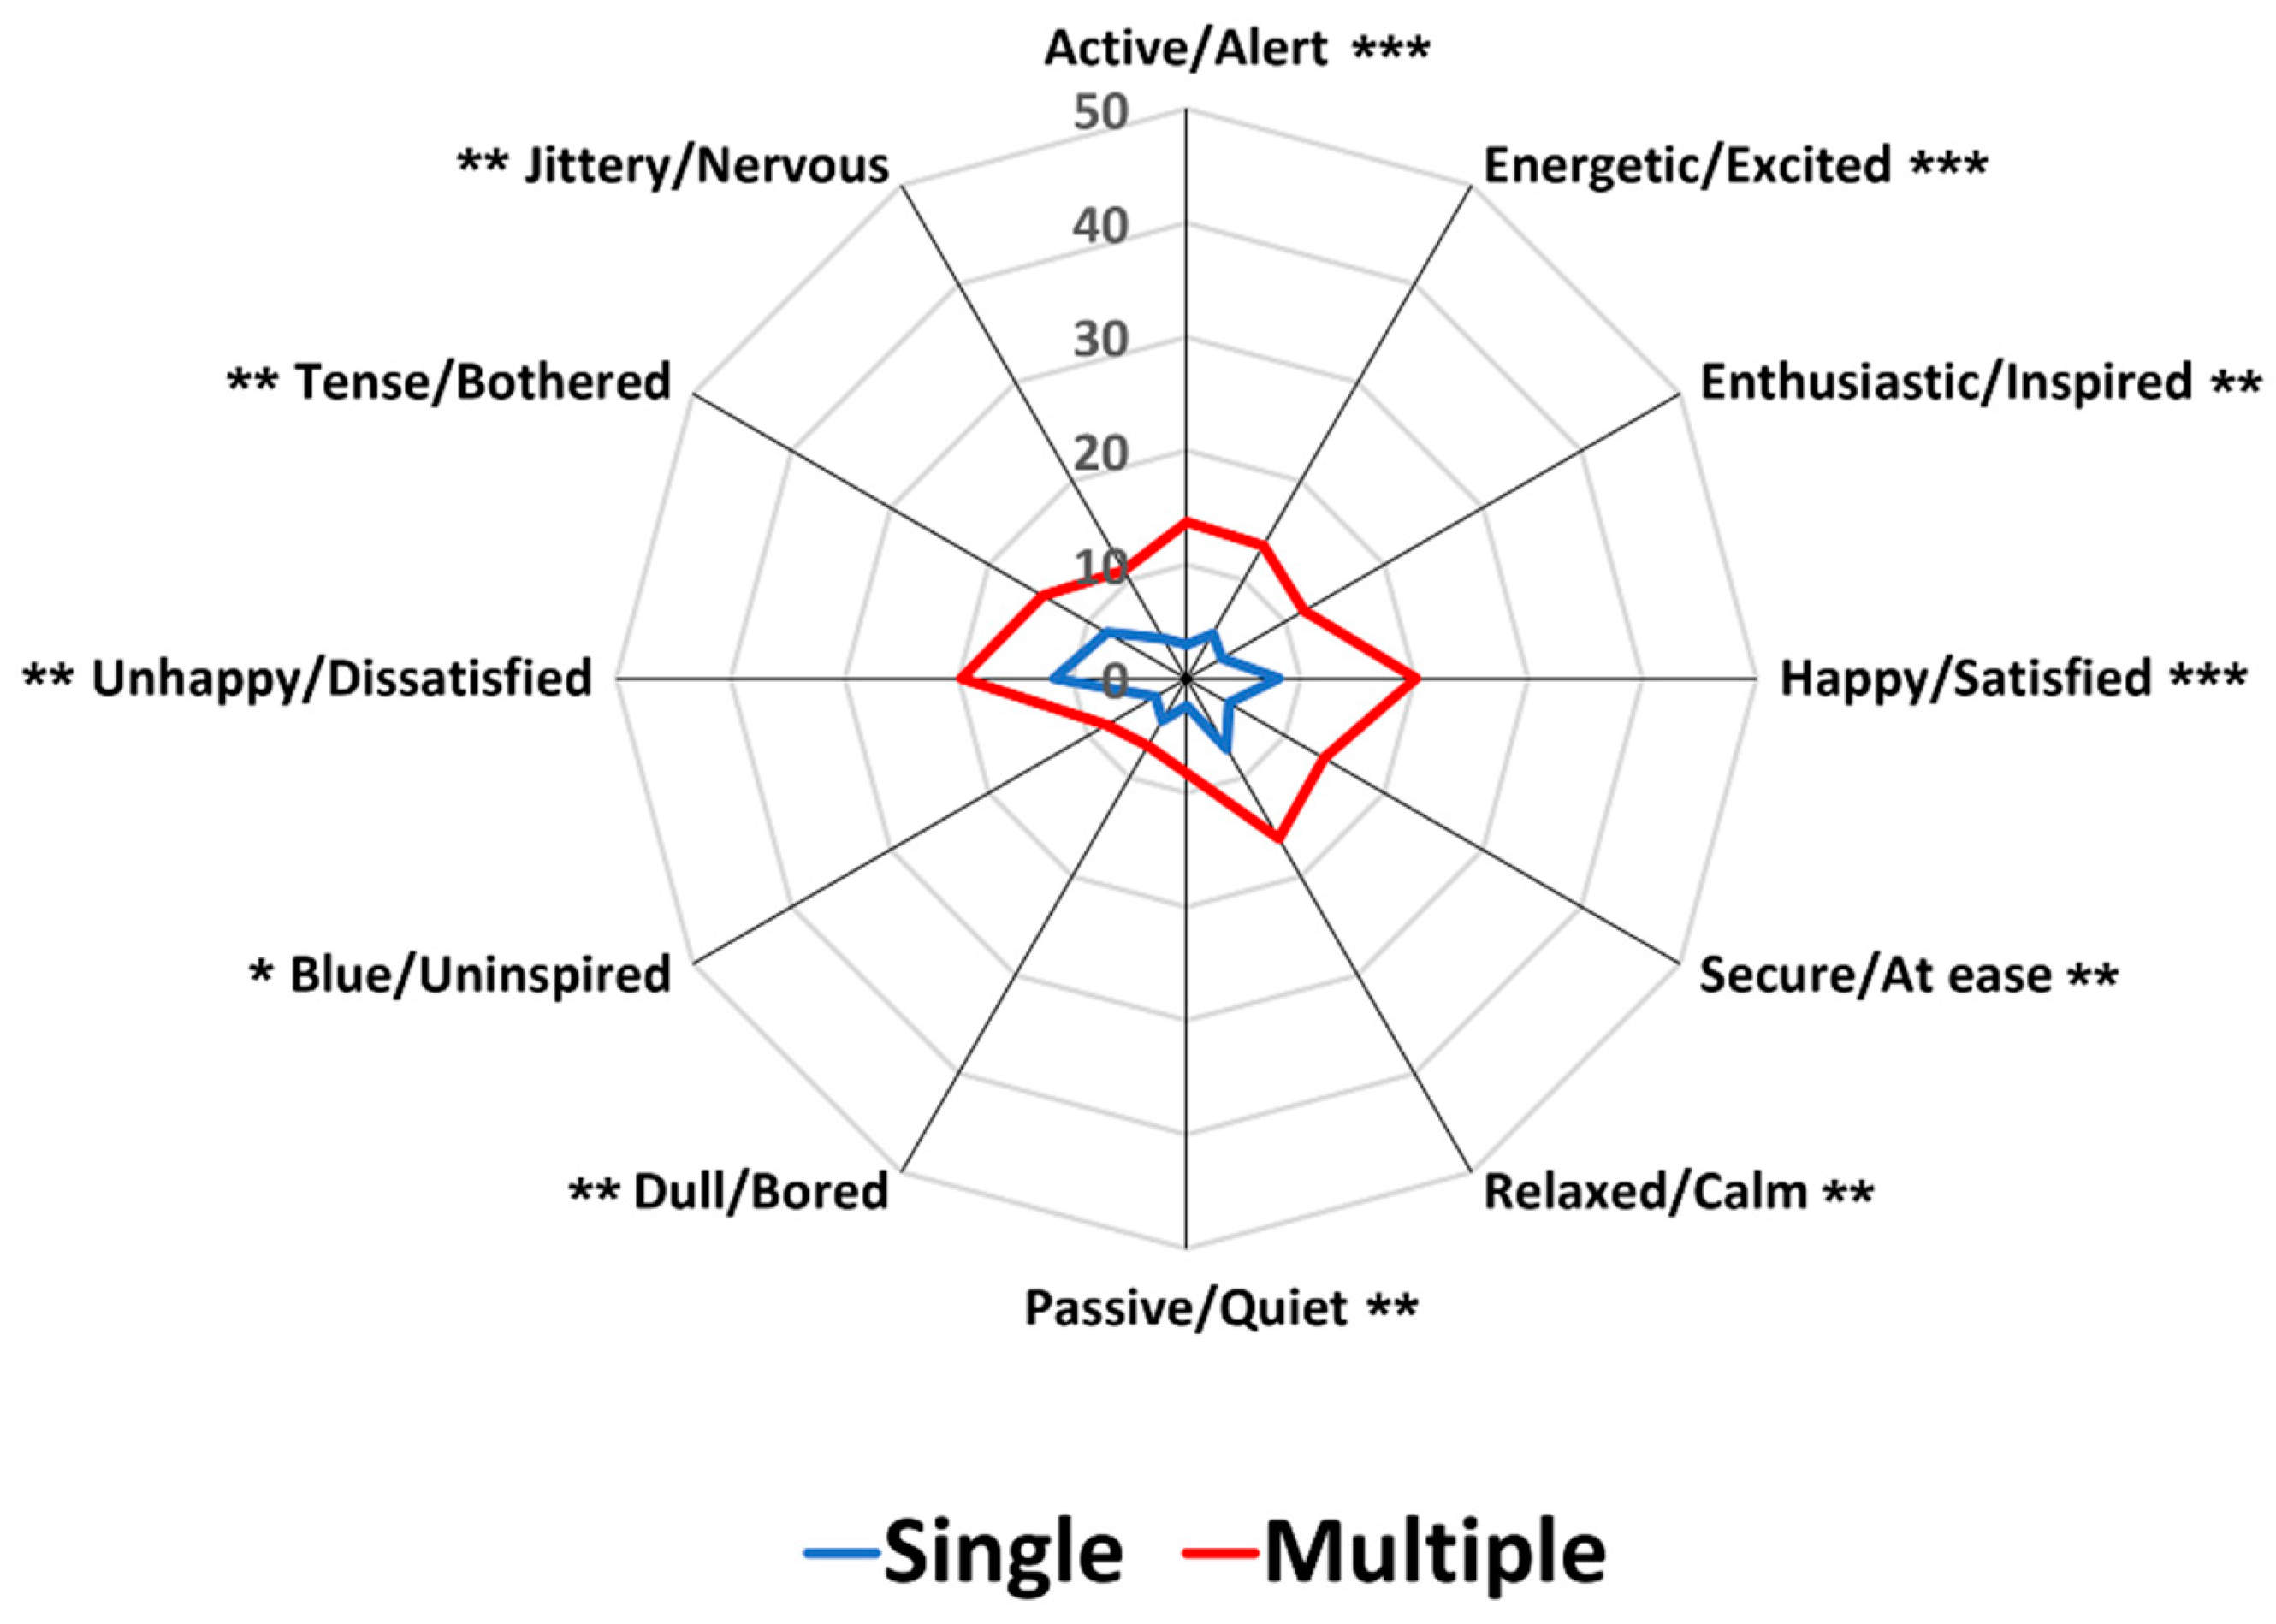
2.2.1. Mean Frequency of Citations per Food Image Sample for Each Pair of Emotion Terms
2.2.2. Discriminability between Food Image Samples for Each Pair of Emotion Terms
2.2.3. Associations between Food Image Samples and Pairs of Emotion Terms
2.2.4. Similarities to the Configurations of Valence and Arousal Dimensions in Response to Food Image Samples
3. Study 2—Comparison between Single and Multiple Response Conditions with Respect to Food Image-Evoked Emotions Rated over Separated Sessions of the Within-Participants Design
3.1. Materials and Methods
3.1.1. Participants
3.1.2. Food Images
3.1.3. Procedure
3.1.4. Data Analysis
3.2. Results and Discussion
3.2.1. Mean Frequency of Citations per Food Image Sample for Each Pair of Emotion Terms
3.2.2. Discriminability between Food Image Samples for Each Pair of Emotion Terms
3.2.3. Associations between Food Image Samples and Pairs of Emotion Terms
3.2.4. Similarities to the Configurations of Valence and Arousal Dimensions in Response to Food Image Samples
4. General Discussion
5. Conclusions
Supplementary Materials
Author Contributions
Funding
Institutional Review Board Statement
Informed Consent Statement
Data Availability Statement
Acknowledgments
Conflicts of Interest
References
- Seo, H.-S. Sensory Nudges: The influences of environmental contexts on consumers’ sensory perception, emotional responses, and behaviors toward foods and beverages. Foods 2020, 9, 509. [Google Scholar] [CrossRef] [PubMed] [Green Version]
- King, S.C.; Meiselman, H.L. Development of a method to measure consumer emotions associated with foods. Food Qual. Prefer. 2010, 21, 168–177. [Google Scholar] [CrossRef]
- Gutjar, S.; de Graaf, C.; Kooijman, V.; de Wijk, R.A.; Nys, A.; ter Horst, G.J.; Jager, G. The role of emotions in food choice and liking. Food Res. Int. 2015, 76, 216–223. [Google Scholar] [CrossRef]
- Gutjar, S.; Dalenberg, J.R.; de Graaf, C.; de Wijk, R.A.; Palascha, A.; Renken, R.J.; Jager, G. What reported food-evoked emotions may add: A model to predict consumer food choice. Food Qual. Prefer. 2015, 45, 140–148. [Google Scholar] [CrossRef]
- Chen, P.-J.; Antonelli, M. Conceptual models of food choice: Influential factors related to foods, individual differences, and society. Foods 2020, 9, 1898. [Google Scholar] [CrossRef] [PubMed]
- Chonpracha, P.; Ardoin, R.; Gao, Y.; Waimaleongor-ek, P.; Tuuri, G.; Prinyawiwatkul, W. Effects of intrinsic and extrinsic visual cues on consumer emotion and purchase intent: A case of ready-to-eat salad. Foods 2020, 9, 396. [Google Scholar] [CrossRef] [PubMed] [Green Version]
- Samant, S.S.; Seo, H.-S. Influences of sensory attribute intensity, emotional responses, and non-sensory factors on purchase intent toward mixed-vegetable juice products under informed tasting condition. Food Res. Int. 2020, 132, 109095. [Google Scholar] [CrossRef] [PubMed]
- Kenney, E.; Adhikari, K. Recent developments in identifying and quantifying emotions during food consumption. J. Sci. Food Agric. 2016, 96, 3627–3630. [Google Scholar] [CrossRef]
- Samant, S.S.; Chapko, M.J.; Seo, H.-S. Predicting consumer liking and preference based on emotional responses and sensory perception: A study with basic taste solutions. Food Res. Int. 2017, 100, 325–334. [Google Scholar] [CrossRef]
- Seo, H.-S.; Lee, Y.; Yoon, N.-R.; Song, J.M.; Shin, J.-M.; Lee, S.-Y.; Hwang, I. Impacts of sensory attributes and emotional responses on the hedonic ratings of odors in dairy products. Appetite 2009, 53, 50–55. [Google Scholar] [CrossRef]
- King, S.C.; Meiselman, H.L.; Carr, B.T. Measuring emotions associated with foods in consumer testing. Food Qual. Prefer. 2010, 21, 1114–1116. [Google Scholar] [CrossRef]
- Jiang, Y.; King, J.M.; Prinyawiwatkul, W. A review of measurement and relationships between food, eating behavior and emotion. Trends Food Sci. Technol. 2014, 36, 15–28. [Google Scholar] [CrossRef]
- Low, J.Y.Q.; Janin, N.; Traill, R.M.; Hort, J. The who, what, where, when, why and how of measuring emotional response to food. A systematic review. Food Qual. Prefer. 2022, 100, 104607. [Google Scholar] [CrossRef]
- Ng, M.; Chaya, C.; Hort, J. Beyond liking: Comparing the measurement of emotional response using EsSense Profile and consumer defined check-all-that-apply methodologies. Food Qual. Prefer. 2013, 28, 193–205. [Google Scholar] [CrossRef]
- Spinelli, S.; Masi, C.; Dinnella, C.; Zoboli, G.P.; Monteleone, E. How does it make you feel? A new approach to measuring emotions in food product experience. Food Qual. Prefer. 2014, 37, 109–122. [Google Scholar] [CrossRef]
- Singh, A.; Seo, H.-S. Sample temperatures can modulate both emotional responses to and sensory attributes of tomato soup samples. Food Qual. Prefer. 2020, 86, 104005. [Google Scholar] [CrossRef]
- Seo, H.-S.; Buffin, K.; Singh, A.; Beekman, T.L.; Jarma Arroyo, S.E. Stay safe in your vehicle: Drive-in booths can be an alternative to indoor booths or laboratory sensory testing. Food Qual. Prefer. 2021, 94, 104332. [Google Scholar] [CrossRef]
- Samant, S.S.; Seo, H.-S. Using both emotional responses and sensory attribute intensities to predict consumer liking and preference toward vegetable juice products. Food Qual. Prefer. 2019, 73, 75–85. [Google Scholar] [CrossRef]
- Samant, S.S.; Seo, H.-S. Personality traits affect the influences of intensity perception an emotional responses on hedonic rating and preference rank toward basic taste solutions. J. Neurosci. Res. 2019, 97, 276–291. [Google Scholar] [CrossRef] [PubMed]
- Luo, L.; Han, P. Assessing food-evoked emotions using functional magnetic resonance imaging: A systematic review. Food Qual. Prefer. 2023, 108, 104877. [Google Scholar] [CrossRef]
- Lagast, S.; Gellynck, X.; Schouteten, J.J.; De Herdt, V.; De Steur, H. Consumers’ emotions elicited by food: A systematic review of explicit and implicit methods. Trends Food Sci. Technol. 2017, 69, 172–189. [Google Scholar] [CrossRef]
- Prescott, J. Some considerations in the measurement of emotions in sensory and consumer research. Food Qual. Prefer. 2017, 62, 360–368. [Google Scholar] [CrossRef]
- Spinelli, S.; Jaeger, S.R. What do we know about the sensory drivers of emotions in foods and beverages? Curr. Opin. Food Sci. 2019, 27, 82–89. [Google Scholar] [CrossRef]
- Meiselman, H.L. The (gradual) development of emotion measurement for food. Curr. Opin. Food Sci. 2021, 40, 187–191. [Google Scholar] [CrossRef]
- Moranges, M.; Rouby, C.; Plantevit, M.; Bensafi, M. Explicit and implicit measures of emotions: Data-science might help to account for data complexity and heterogeneity. Food Qual. Prefer. 2021, 92, 104181. [Google Scholar] [CrossRef]
- Schouteten, J.J. Are questionnaires the best way to measure emotions for food products and beverages? Food Qual. Prefer. 2021, 92, 104122. [Google Scholar] [CrossRef]
- Panagiotou, M.; Gkatzionis, K. Lexicon development to measure emotions evoked by foods: A review. Meas. Food 2022, 7, 100054. [Google Scholar] [CrossRef]
- Kaneko, D.; Toet, A.; Brouwer, A.-M.; Kallen, V.; van Erp, J.B.F. Methods for evaluating emotions evoked by food experiences: A literature review. Front. Psychol. 2018, 9, 911. [Google Scholar] [CrossRef] [PubMed] [Green Version]
- Cardello, A.V.; Jaeger, S.R. Questionnaires should be the default method in food-related emotion research. Food Qual. Prefer. 2021, 92, 104180. [Google Scholar] [CrossRef]
- Cardello, A.V.; Jaeger, S.R. Measurement of consumer product emotions using questionnaires. In Emotion Measurement, 2nd ed.; Meiselman, H.L., Ed.; Woodhead Publishing: Cambridge, UK, 2021; pp. 273–321. [Google Scholar]
- Meiselman, H.L. A review on the current state of emotion research in product development. Food Res. Int. 2015, 76, 192–199. [Google Scholar] [CrossRef]
- Chrea, C.; Grandjean, D.; Delplanque, S.; Cayeux, I.; Le Calvé, B.; Aymard, L.; Inés Velazco, M.; Sander, D.; Scherer, K.R. Mapping the semantic space for the subjective experience of emotional responses to odors. Chem. Senses 2009, 34, 49–62. [Google Scholar] [CrossRef] [PubMed] [Green Version]
- Nestrud, M.A.; Meiselman, H.L.; King, S.C.; Lesher, L.L.; Cardello, A.V. Development of EsSense25, a shorter version of the EsSense Profile®. Food Qual. Prefer. 2016, 48, 107–117. [Google Scholar] [CrossRef]
- Jaeger, S.R.; Swaney-Stueve, M.; Chheang, S.L.; Hunter, D.C.; Pineau, B.; Ares, G. An assessment of the CATA-variant of the EsSense Profile®. Food Qual. Prefer. 2018, 68, 360–370. [Google Scholar] [CrossRef]
- Jaeger, S.R.; Roigard, C.M.; Jin, D.; Xia, Y.; Zhong, F.; Hedderley, D.I. A single-response emotion word questionnaire for measuring product-related emotional associations inspired by a circumplex model of core affect: Method characterisation with an applied focus. Food Qual. Prefer. 2020, 83, 103805. [Google Scholar] [CrossRef]
- Jaeger, S.R.; Jin, D.; Ryan, G.S.; Schouteten, J.J. Emoji for food and beverage research: Pleasure, arousal and dominance meanings and appropriateness for use. Foods 2021, 10, 2880. [Google Scholar] [CrossRef]
- Schouteten, J.J.; Llobell, F.; Chheang, S.L.; Jin, D.; Jaeger, S.R. Emoji meanings (pleasure-arousal-dominance dimensions) in consumer research: Between-country and interpersonal differences. J. Food Sci. 2023, 88, A106–A121. [Google Scholar] [CrossRef]
- Jaeger, S.R.; Roigard, C.M.; Chheang, S.L. The valence×arousal circumplex-inspired emotion questionnaire (CEQ): Effect of response format and question layout. Food Qual. Prefer. 2021, 90, 104172. [Google Scholar] [CrossRef]
- Jaeger, S.R.; Ryan, G.S.; Jin, D.; Ares, G. Comparison of variants of the valence × arousal circumplex-inspired emotion word questionnaire. Food Qual. Prefer. 2022, 98, 104504. [Google Scholar] [CrossRef]
- Schouteten, J.J.; Verwaeren, J.; Gellynck, X.; Almli, V.L. Comparing a standardized to a product-specific emoji list for evaluating food products by children. Food Qual. Prefer. 2019, 72, 86–97. [Google Scholar] [CrossRef]
- Koubaa, Y.; Eleuch, A. Gender effects on odor-induced taste enhancement and subsequent food consumption. J. Consum. Mark. 2020, 37, 511–519. [Google Scholar] [CrossRef]
- Charness, G.; Gneezy, U.; Kuhn, M.A. Experimental methods: Between-subject and within-subject design. J. Econ. Behav. Organ. 2012, 81, 1–8. [Google Scholar] [CrossRef]
- Cardello, A.V.; Meiselman, H.L.; Schutz, H.G.; Craig, C.; Given, Z.; Lesher, L.L.; Eicher, S. Measuring emotional responses to foods and food names using questionnaires. Food Qual. Prefer. 2012, 24, 243–250. [Google Scholar] [CrossRef]
- Piqueras-Fiszman, B.; Jaeger, S.R. The impact of the means of context evocation on consumers’ emotion associations towards eating occasions. Food Qual. Prefer. 2014, 37, 61–70. [Google Scholar] [CrossRef]
- Jaeger, S.R.; Hedderley, D.; MacFie, H.J.H. Methodological issues in conjoint analysis: A case study. Eur. J. Mark. 2001, 35, 1217–1237. [Google Scholar] [CrossRef]
- Garitta, L.; Hough, G.; Chaves, A. Sensory analysis of broccoli over time: Consumer defined critical attributes and evaluations of digital photographs in comparison to real product appearance. Food Qual. Prefer. 2013, 29, 48–52. [Google Scholar] [CrossRef]
- Gallo, K.E.; Swaney-Stueve, M.; Chambers, D.H. Comparing visual food images versus actual food when measuring emotional response of children. J. Sens. Stud. 2017, 32, e12267. [Google Scholar] [CrossRef]
- Ares, G.; Tárrega, A.; Izquierdo, L.; Jaeger, S.R. Investigation of the number of consumers necessary to obtain stable sample and descriptor configurations from check-all-that-apply (CATA) questions. Food Qual. Prefer. 2014, 31, 135–141. [Google Scholar] [CrossRef]
- Pramudya, R.C.; Seo, H.-S. Influences of product temperature on emotional responses to, and sensory attributes of, coffee and green tea beverages. Front. Psychol. 2018, 8, 2264. [Google Scholar] [CrossRef] [Green Version]
- Sick, J.; Spinelli, S.; Dinnella, C.; Monteleone, E. Children’s selection of emojis to express food-elicited emotions in varied eating contexts. Food Qual. Prefer. 2020, 85, 103953. [Google Scholar] [CrossRef]
- Blechert, J.; Lender, A.; Polk, S.; Busch, N.A.; Ohla, K. Food-pics: An image database for experimental research on eating and appetite. Front. Psychol. 2014, 5, 617. [Google Scholar] [CrossRef]
- Blechert, J.; Lender, A.; Polk, S.; Busch, N.A.; Ohla, K. Food-Pics_Extended–An image database for experimental research on eating and appetite: Additional images, normative ratings and an updated review. Front. Psychol. 2019, 10, 307. [Google Scholar] [CrossRef] [Green Version]
- Toet, A.; Kaneko, D.; de Kruijf, I.; Ushiama, S.; van Schaik, M.G.; Brouwer, A.-M.; Kallen, V.; van Erp, J.B.F. CROCUFID: A cross-cultural food image database for research on food elicited affective responses. Front. Psychol. 2019, 10, 58. [Google Scholar] [CrossRef] [PubMed] [Green Version]
- Fisher, C.M.; King, S.K.; Castura, J.C.; Findlay, C.J. Does data collection device affect sensory descriptive analysis results? J. Sens. Stud. 2016, 31, 275–282. [Google Scholar] [CrossRef]
- Jang, J.A.; Oh, J.E.; Na, Y.; Yeo, G.E.; Cho, M.S. Emotions evoked by colors and health functionality information of colored rice: A cross-cultural study. Foods 2021, 10, 231. [Google Scholar] [CrossRef]
- Hu, X.; Lee, J. Emotions elicited while drinking coffee: A cross-cultural comparison between Korean and Chinese consumers. Food Qual. Prefer. 2019, 76, 160–168. [Google Scholar] [CrossRef]
- Schlich, P. Defining and validating assessor compromises about product distance and attribute correlations (Chapter 9). In Multivariate Analysis of Data in Sensory Science; Næs, T., Risvik, E., Eds.; Elsevier Science: New York, NY, USA, 1996; pp. 259–306. [Google Scholar] [CrossRef]
- Chapko, M.J.; Seo, H.-S. Characterizing product temperature-dependent sensory perception of brewed coffee beverages: Descriptive sensory analysis. Food Res. Int. 2019, 121, 612–621. [Google Scholar] [CrossRef]
- Morgan, R.L.; Heise, D. Structure of emotions. Soc. Psychol. Q. 1988, 51, 19–31. [Google Scholar] [CrossRef]
- Cassani, L.; Fiszman, S.; Alvarez, M.V.; Moreira, M.R.; Laguna, L.; Tarrega, A. Emotional response evoked when looking at and trying a new food product, measured through images and words. A case-study with novel fruit and vegetable smoothies. Food Qual. Prefer. 2020, 84, 103955. [Google Scholar] [CrossRef]
- Köster, E.P.; Mojet, J. From mood to food and from food to mood: A psychological perspective on the measurement of food-related emotions in consumer research. Food Res. Int. 2015, 76, 180–191. [Google Scholar] [CrossRef]
- Cho, S.; Camacho, A.; Patten, E.; Costa, D.; Silva Damiao, B.; Fuller, R.; da Palma, L.; Seo, H.-S. The effect of cigarette smoking on chemosensory perception of common beverages. Chemosens. Percept. 2017, 10, 1–7. [Google Scholar] [CrossRef]
- Ares, G.; Jaeger, S.R. Check-all-that-apply (CATA) questions with consumers in practice: Experimental considerations and impact on outcome. In Rapid Sensory Profiling Techniques; Delaure, J., Lawlor, J.B., Rogeaux, M., Eds.; Woodhead Publishing: Cambridge, UK, 2015; pp. 227–245. [Google Scholar]
- Patel, K.A.; Schlundt, D.G. Impact of moods and social context on eating behavior. Appetite 2001, 36, 111–118. [Google Scholar] [CrossRef] [PubMed]
- Desmet, P.M.A.; Schifferstein, H.N.J. Sources of positive and negative emotions in food experience. Appetite 2008, 50, 290–301. [Google Scholar] [CrossRef] [PubMed]
- Otake, K.; Kato, K. Subjective happiness and emotional responsiveness to food stimuli. J. Happiness Stud. 2017, 18, 691–708. [Google Scholar] [CrossRef]
- Laros, F.J.M.; Steenkamp, J.-B.E.M. Emotions in consumer behavior: A hierarchical approach. J. Bus. Res. 2005, 58, 1437–1445. [Google Scholar] [CrossRef]


| Reference | Study | CEQ Variant 1 | Sample Type | Sample Module | Test Type | Test Place | Experimental Design | No. of Participants |
|---|---|---|---|---|---|---|---|---|
| Jaeger et al. [38] | 1 | C and S vs. C and M vs. L and S vs. L and M | 15 foods | Written names | Remote | New Zealand | Between-participants | 160 vs. 160 vs. 160 vs. 160 |
| Jaeger et al. [39] | 1 | C and S vs. L and M | 9 fruits | Tasted | On site | New Zealand | Between-participants | 91 vs. 94 |
| 2 | C and S vs. L and M | 9 candies | Tasted | On site | New Zealand | Between-participants | 91 vs. 94 | |
| 3 | C and S vs. L and M | 5 kiwifruits | Written concepts | Remote | UK | Between-participants | 209 vs. 210 | |
| 4 | C and S vs. C and M | 17 foods | Written names | Remote | USA | Between-participants | 628 vs. 625 | |
| The present study | 1 | S vs. M | 14 foods | Pictures | Remote | Republic of Korea | Within-participants | 105 |
| 2 | S vs. M | 14 foods | Pictures | On site | USA | Within-participants | 64 |
| Study No. | Category | RV Coefficient | p-Value |
|---|---|---|---|
| Study 1 | Food image samples | 0.97 | <0.001 |
| Pairs of emotion terms | 0.96 | <0.001 | |
| Study 2 | Food image samples | 0.95 | <0.001 |
| Pairs of emotion terms | 0.88 | <0.001 |
| Study No. | Response Condition | RV Coefficient | p-Value |
|---|---|---|---|
| Study 1 | Single response | 0.92 | <0.001 |
| Multiple response | 0.96 | <0.001 | |
| Study 2 | Single response | 0.75 | <0.001 |
| Multiple response | 0.84 | <0.001 |
Disclaimer/Publisher’s Note: The statements, opinions and data contained in all publications are solely those of the individual author(s) and contributor(s) and not of MDPI and/or the editor(s). MDPI and/or the editor(s) disclaim responsibility for any injury to people or property resulting from any ideas, methods, instructions or products referred to in the content. |
© 2023 by the authors. Licensee MDPI, Basel, Switzerland. This article is an open access article distributed under the terms and conditions of the Creative Commons Attribution (CC BY) license (https://creativecommons.org/licenses/by/4.0/).
Share and Cite
Seo, H.-S.; Rockers, L.; Kim, Y.-G. The Effect of Response Conditions on Food Images-Evoked Emotions Measured Using the Valence × Arousal Circumplex-Inspired Emotion Questionnaire (CEQ). Foods 2023, 12, 2250. https://doi.org/10.3390/foods12112250
Seo H-S, Rockers L, Kim Y-G. The Effect of Response Conditions on Food Images-Evoked Emotions Measured Using the Valence × Arousal Circumplex-Inspired Emotion Questionnaire (CEQ). Foods. 2023; 12(11):2250. https://doi.org/10.3390/foods12112250
Chicago/Turabian StyleSeo, Han-Seok, Lydia Rockers, and Young-Gab Kim. 2023. "The Effect of Response Conditions on Food Images-Evoked Emotions Measured Using the Valence × Arousal Circumplex-Inspired Emotion Questionnaire (CEQ)" Foods 12, no. 11: 2250. https://doi.org/10.3390/foods12112250