2.1. Data
We used cross-sectional data from the Map the Meal Gap (MMG) in 2019. MMG data were developed and sourced from the American Community Survey (ACS), Current Population Survey (CPS), and Bureau of Labor Statistics data [
12]. The ACS contains demographic, economic, social, and housing status information from a nationally representative sample. The CPS is a nationally representative survey that contains household information on employment status and occupational parameters (hours worked, income, and other similar factors) conducted by the US Census Bureau for the Bureau of Labor Statistics. The data were structured to a scientifically selected multistage probability-based sample of households, with the sample designed to represent the civilian noninstitutional population of each state (as well as the District of Columbia) and the US as a whole.
The MMG data at the state level were derived from the Core Food Security Model (CFSM) within the CPS. Using the household information in the CPS on food insecurity status and socioeconomic factors, including unemployment, poverty, homeownership, and median income, MMG aggregated the data to the state level and race. CPS survey data were mainly used to assess the relationship between food insecurity and its determinants at the state level. County and district level data on the above variables were drawn from the ACS, except for unemployment data, which were drawn from the BLS.
The data from MMG, originally sourced from CFSM and the CPS, contained food insecurity rates by race and an established rich set of socioeconomic characteristics, including unemployment, poverty, homeownership, and median income. To assess the prevalence of food insecurity, respondents were asked about situations potentially conducive to food scarcities. The data were based on 15 food insecurity questions of the USDA concerning food shortages in the household, including: (1) “We worried whether our food would run out before we got money to buy more. Was that often, sometimes, or never true for you in the last 12 months?” (2) “We couldn’t afford to eat balanced meals. Was that often, sometimes, or never true for you in the last 12 months?” and (3) “In the last 12 months did you or other adults in your household ever not eat for a whole day because there wasn’t enough money for food? If yes, how often did this happen—almost every month, some months but not every month, or in only 1 or 2 months?”
The food insecurity rates at the county level were estimated using a two-step approach. In the first stage, a multivariate regression was used to estimate state-year-level food insecurity rates using state-level data from 2009 to 2018. Variables in the model included unemployment, non-undergraduate student poverty rate, median income, disability rate, percent of homeowners, percent of Blacks, percent of Hispanics, state, and year fixed effects. These variables were selected based on the literature guidance [
9]. In the second stage, the projected food insecurity rates at the county level were obtained from the prediction equation in the first stage with county-level explanatory variables based on 2015–2019 ACS 5-year estimates and 2019 BLS 1-year averages. Overall, our analyses included 50 states and the District of Columbia for the state-level regressions and 1675 counties for the county-level regressions.
2.2. Methods
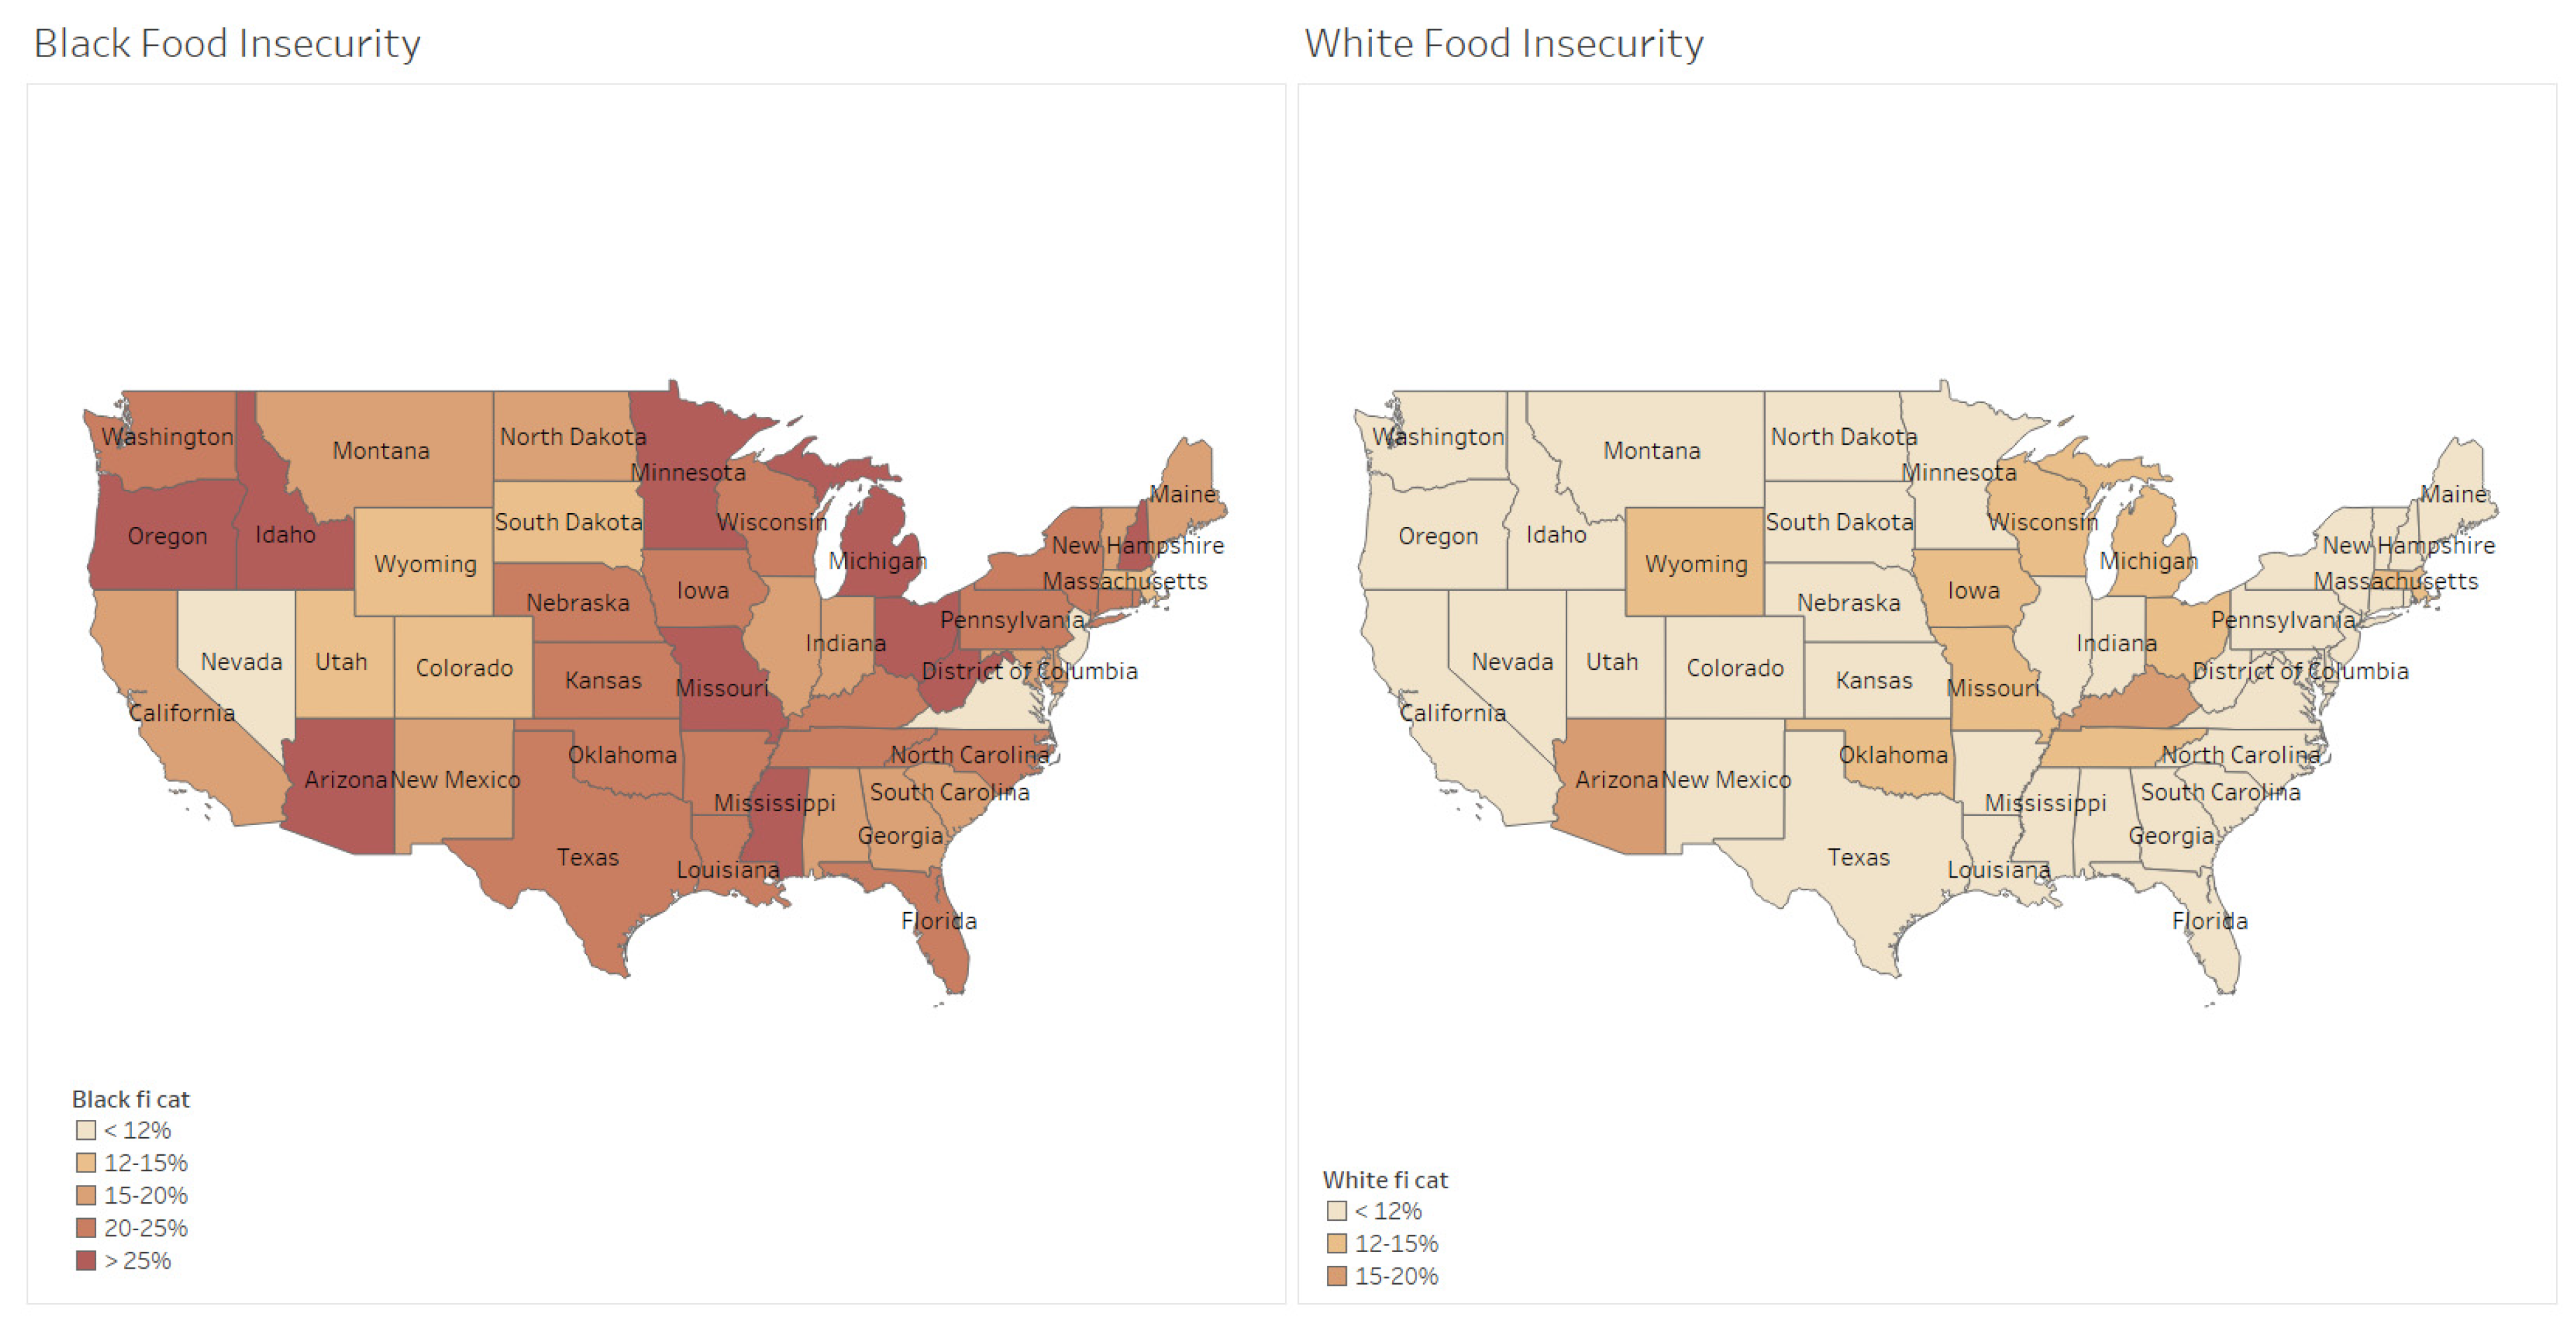
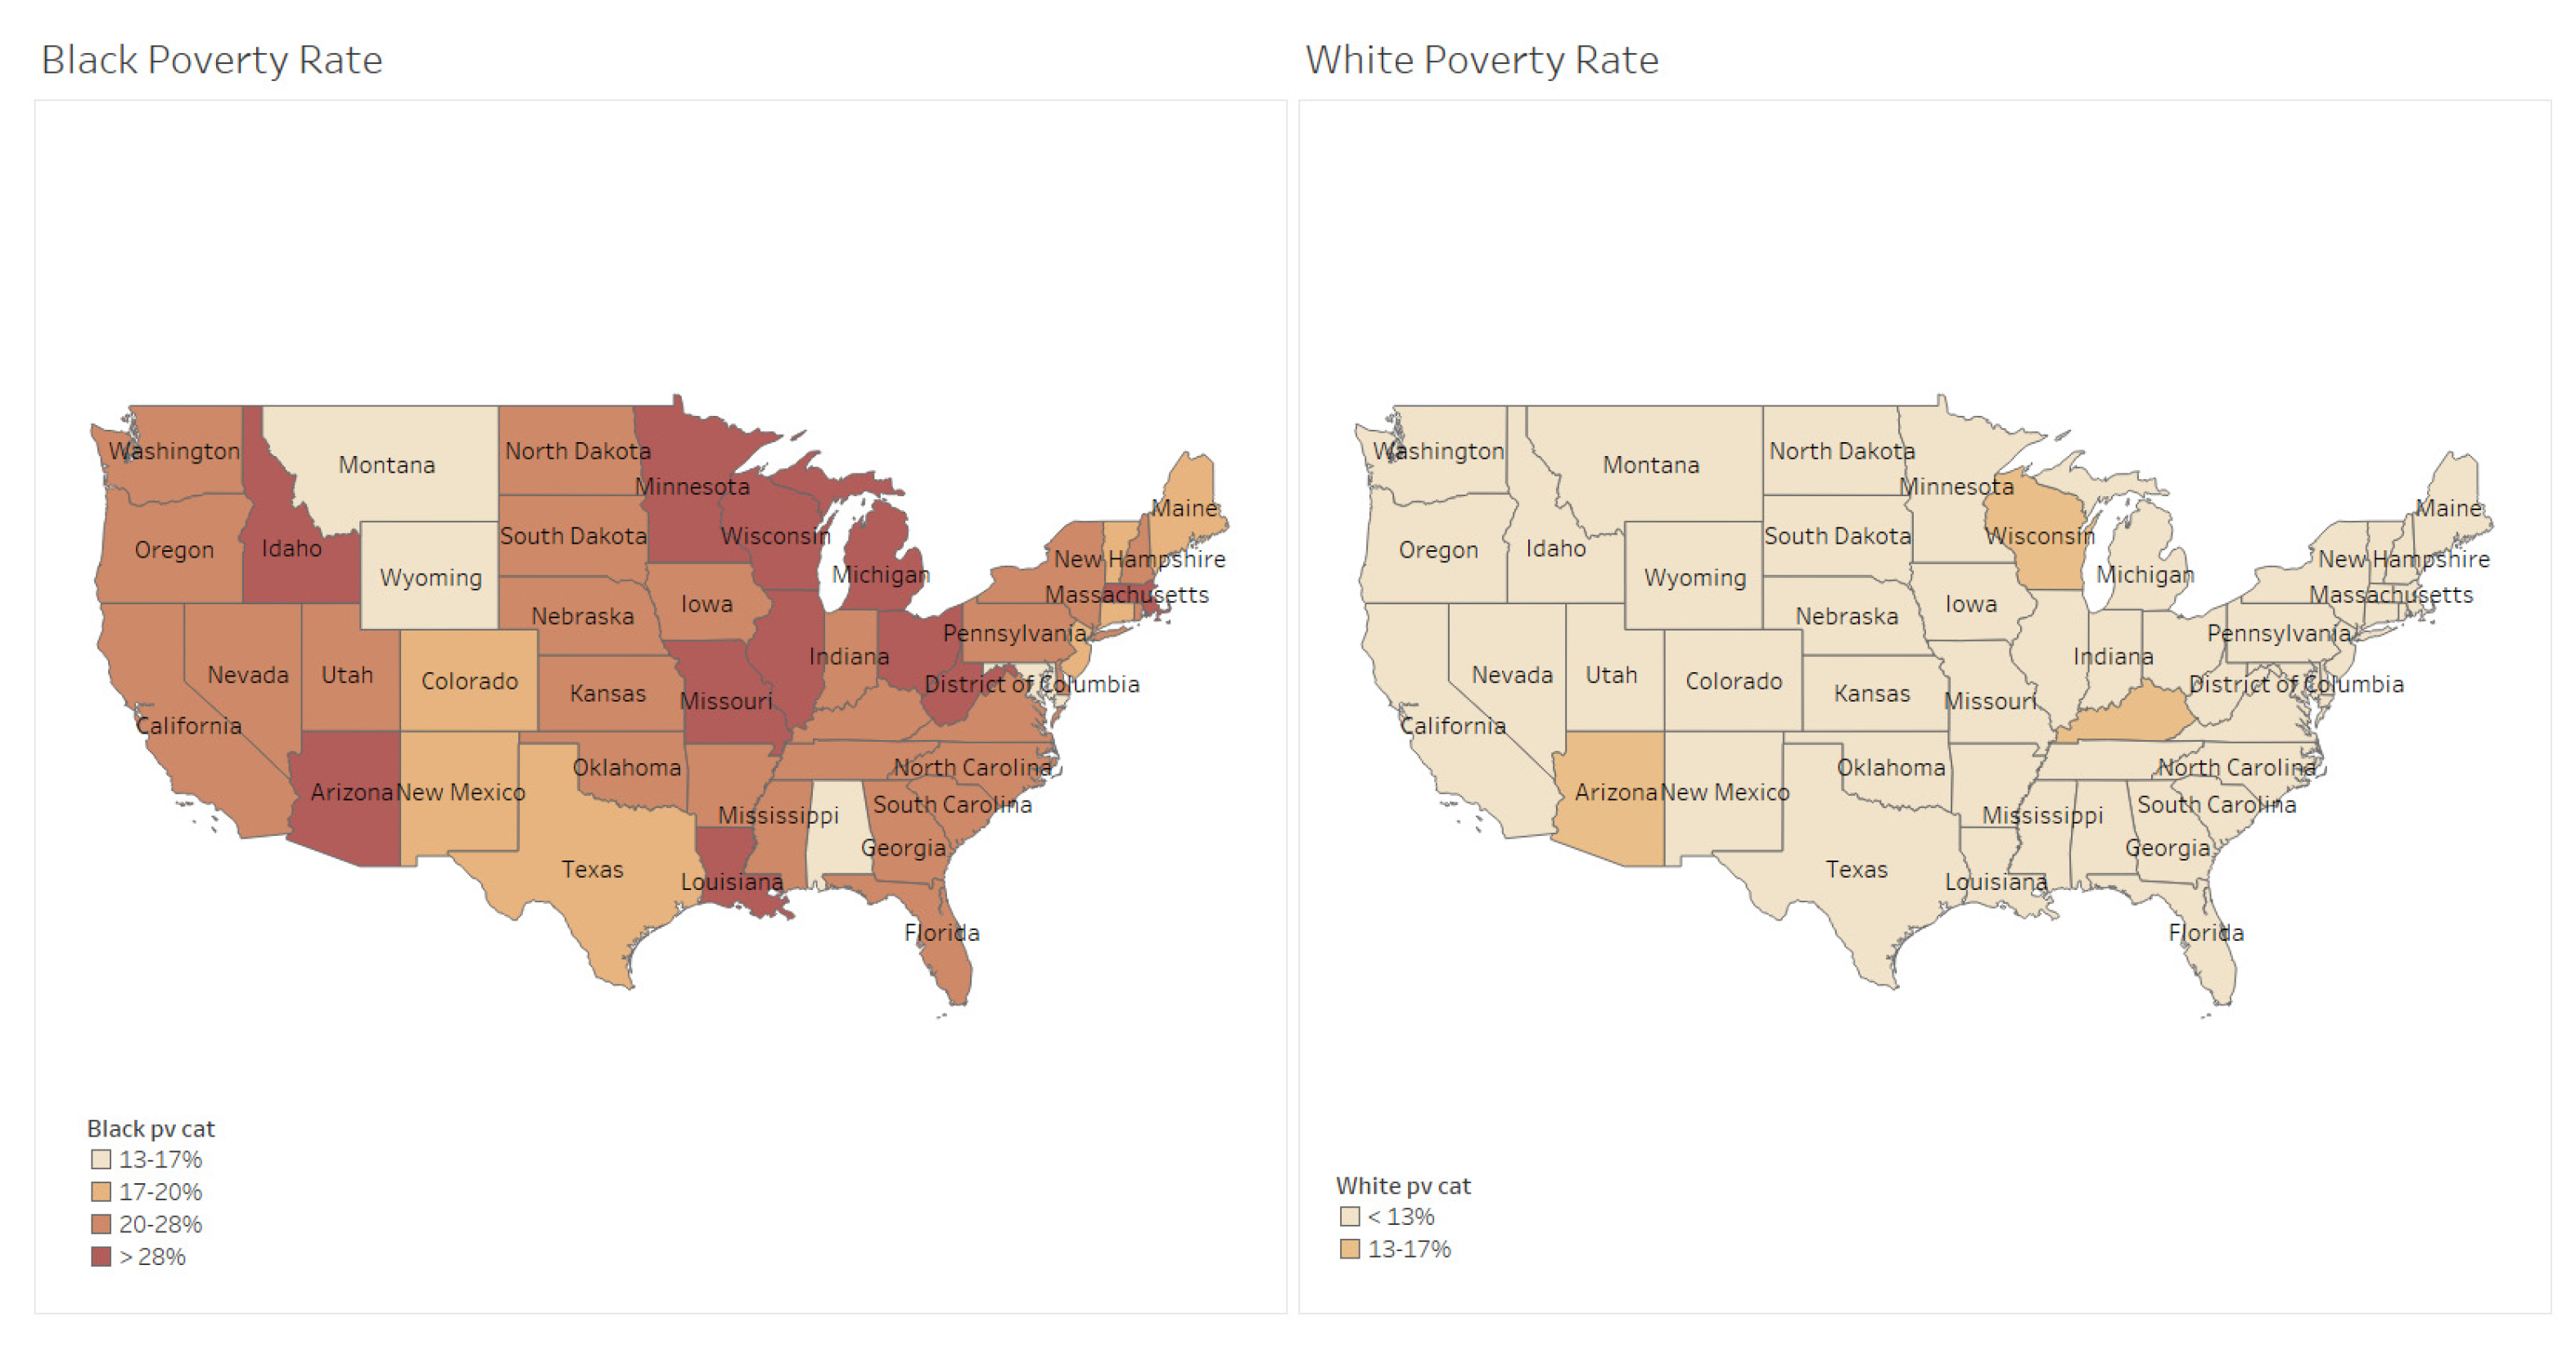
We used univariate analyses to determine the descriptive statistics for food insecurity rates and socioeconomic determinants among Blacks and Whites at the state and county levels. Furthermore, multivariate linear models were performed to examine socioeconomic factors that are significantly associated with the Black–White gap in food insecurity rates in the US in general and food insecurity rates for African Americans in the US.
We used the student t-test to examine whether the means of two populations, Blacks and Whites, were different. The two-independent-samples t-test was employed when the Black and White populations were compared on one common variable. In this case, the t-tests were performed to analyze whether the differences in average food insecurity rates, average poverty rates, average unemployment rates, average homeownership rates, and average median incomes between Blacks and Whites were statistically significant at the state level and county level, respectively.
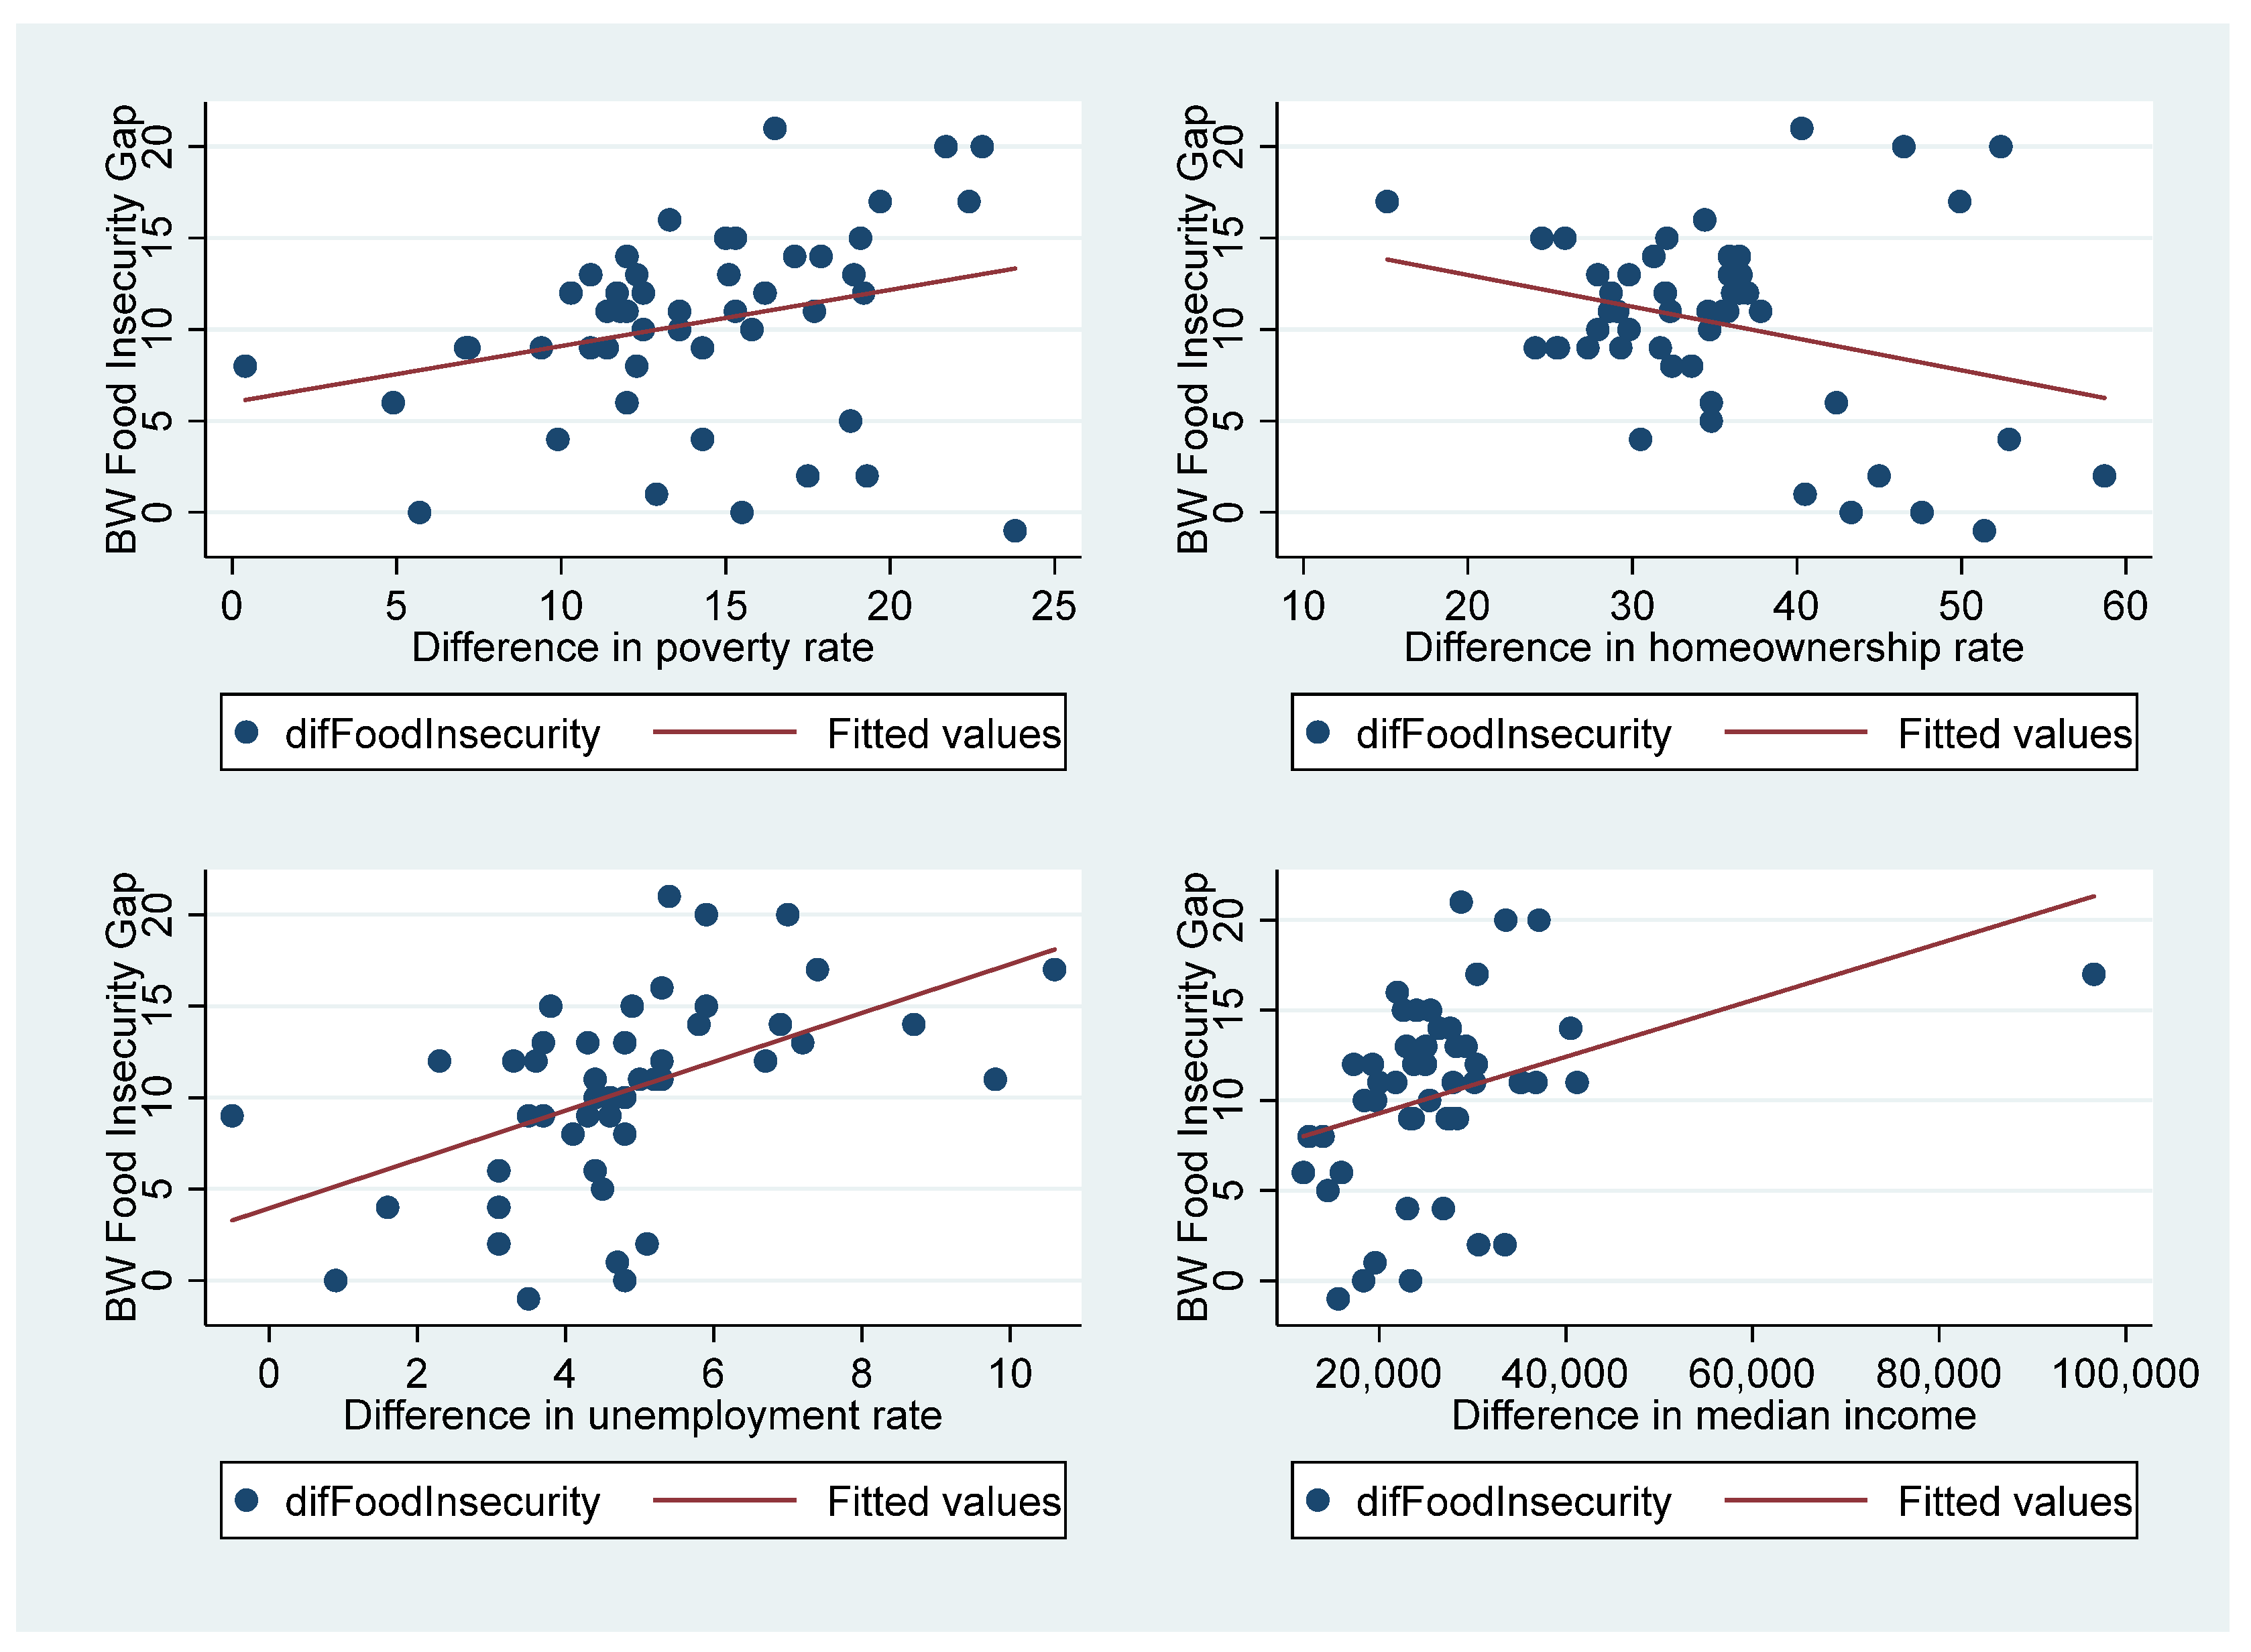
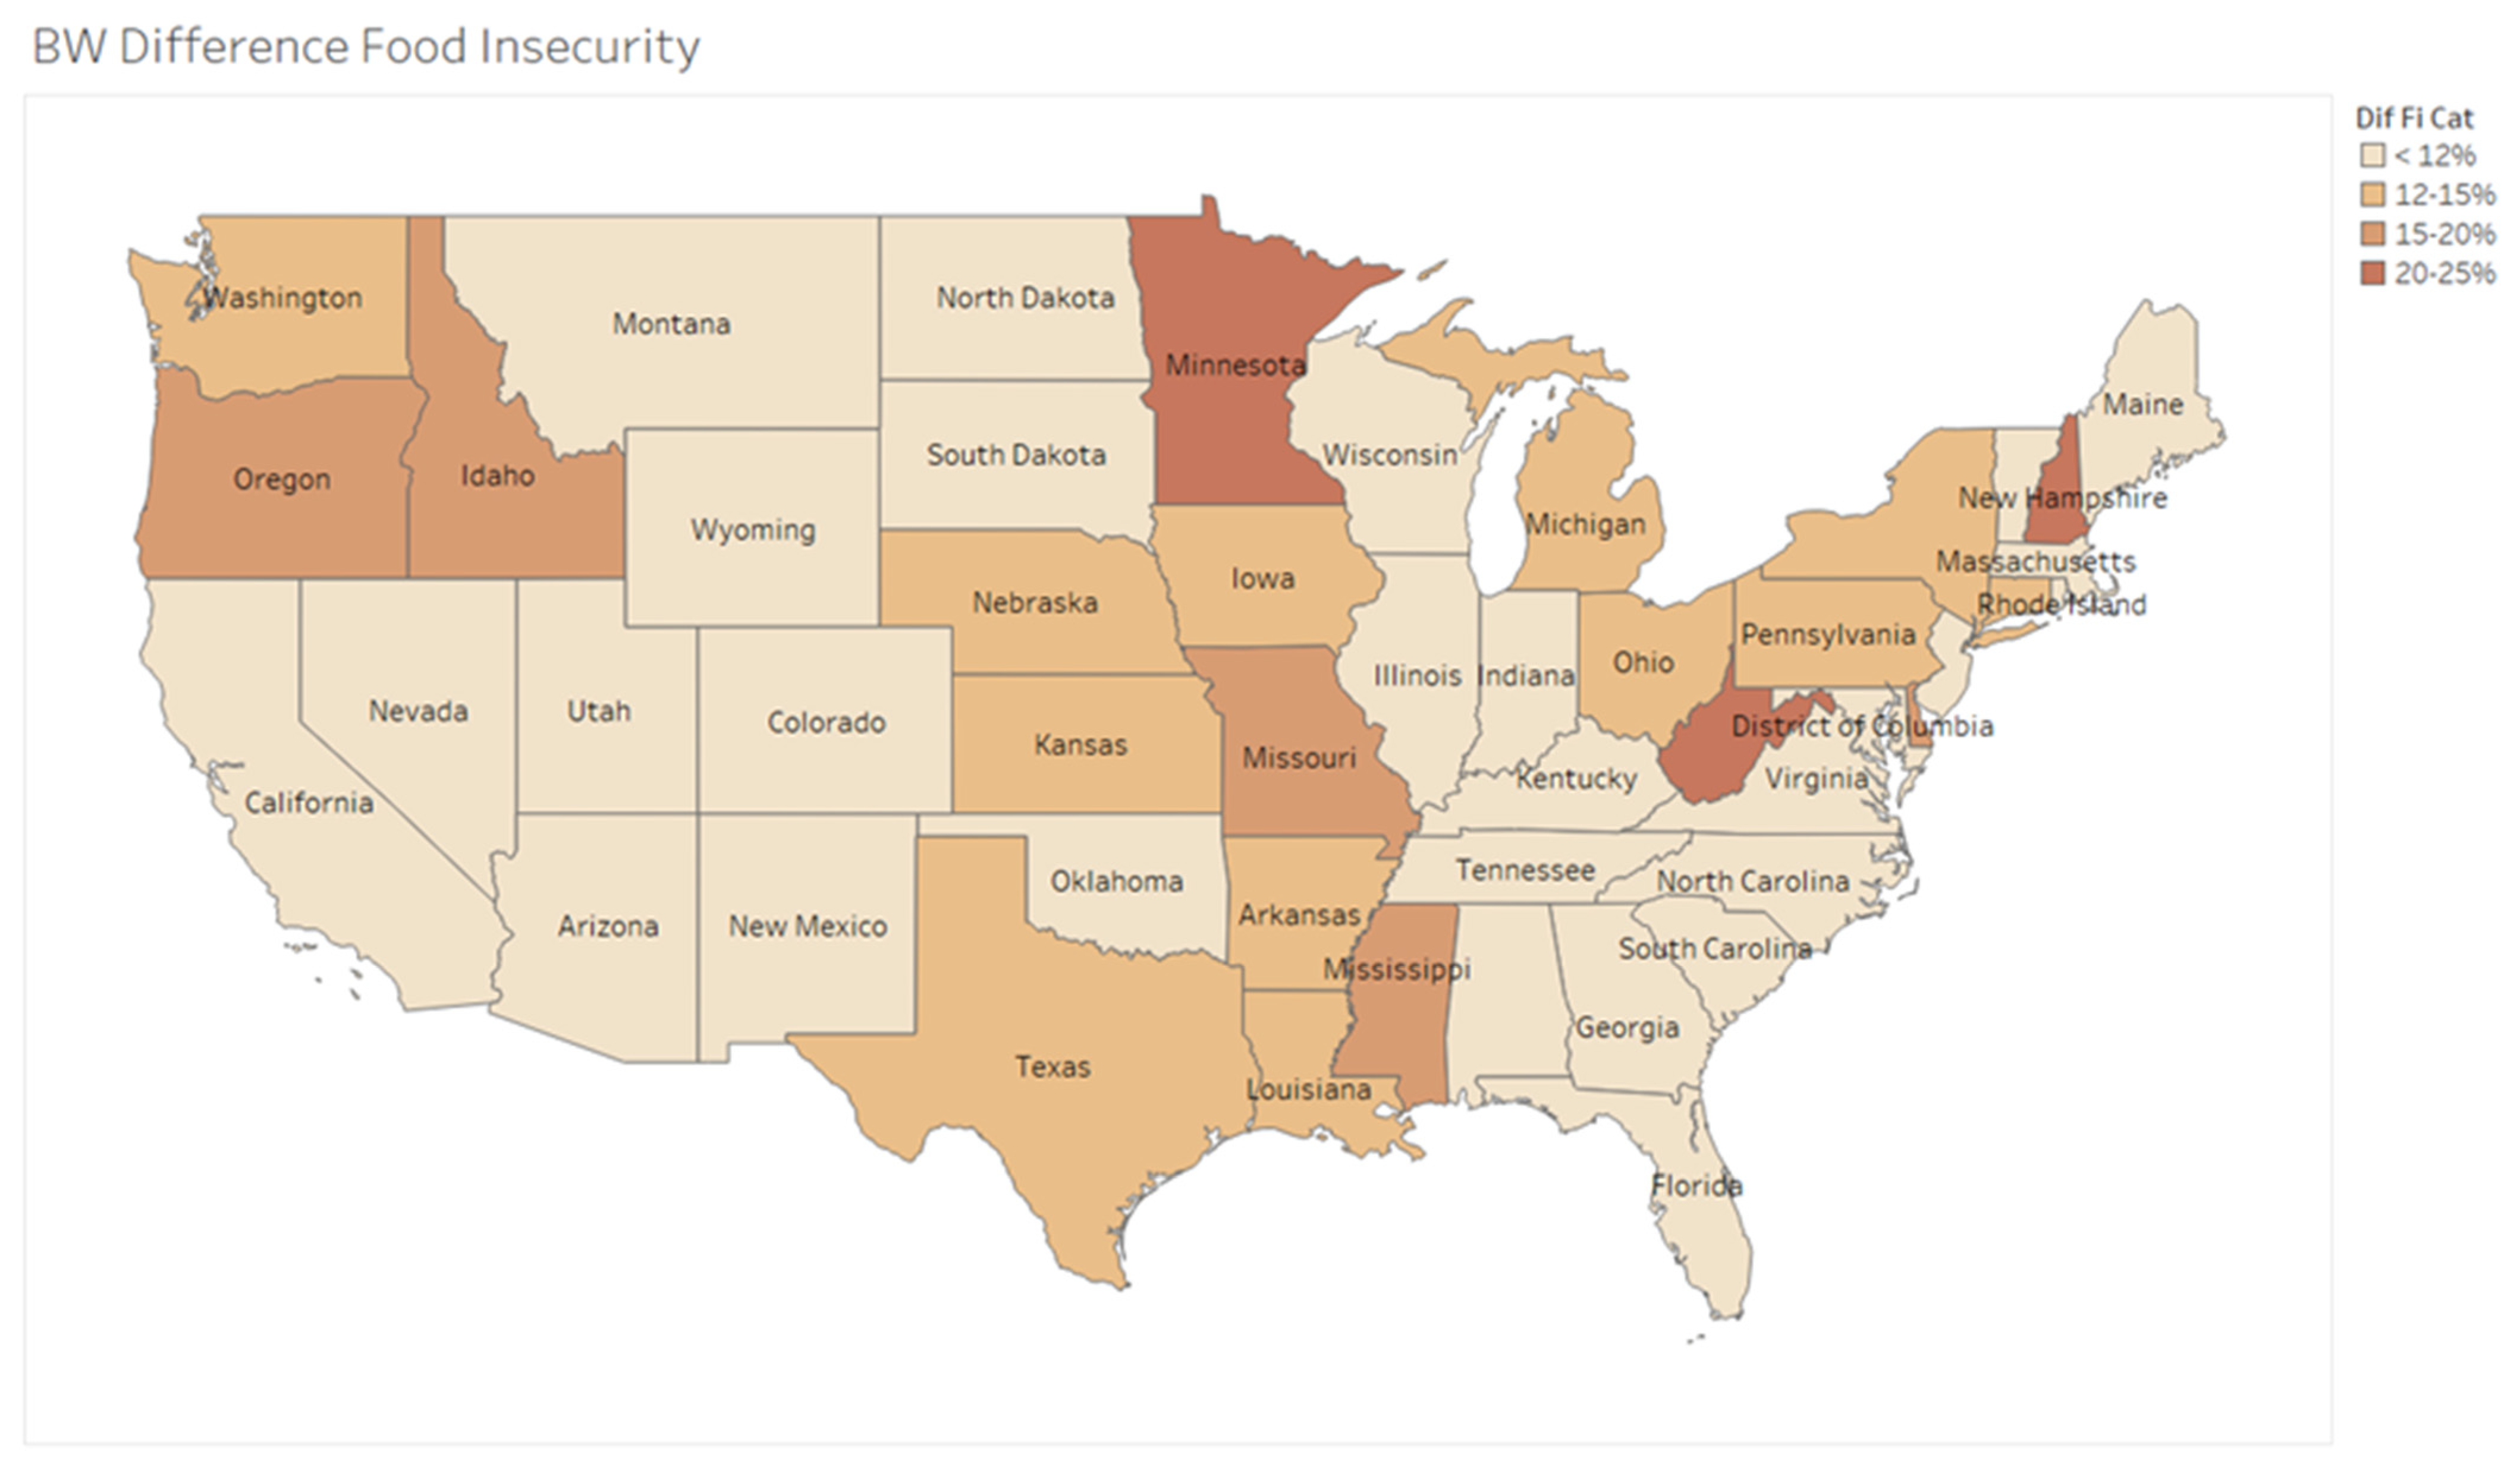
To determine the factors that are significantly related to the relationship between food insecurity and Black–White race, we used multivariate regression models at the state level and county level, respectively. The dependent variable was the Black–White food insecurity gap, which was measured as the difference in food insecurity rates between Blacks and Whites. Socioeconomic predictors of the outcome were differences in unemployment rates, differences in poverty rates, differences in homeownership rates, and differences in median incomes between Blacks and Whites.
To identify socioeconomic factors that are significantly associated with the food insecurity rate among Blacks at the state and county levels, given their social and economic disadvantages and the need for policies to help address the severity of the Black food insecurity rate, multivariate regression models were also conducted at the state level and county level, respectively, with the dependent variable of Black food insecurity rates and the independent variables of Black unemployment rates, Black poverty rates, Black homeownership rates, and Black median incomes.
The regression analyses were performed using Feeding America’s Map the Meal Gap (MMG) 2019 data with 50 states and the District of Columbia and 1675 counties.
= Difference in food insecurity rates between Blacks and Whites
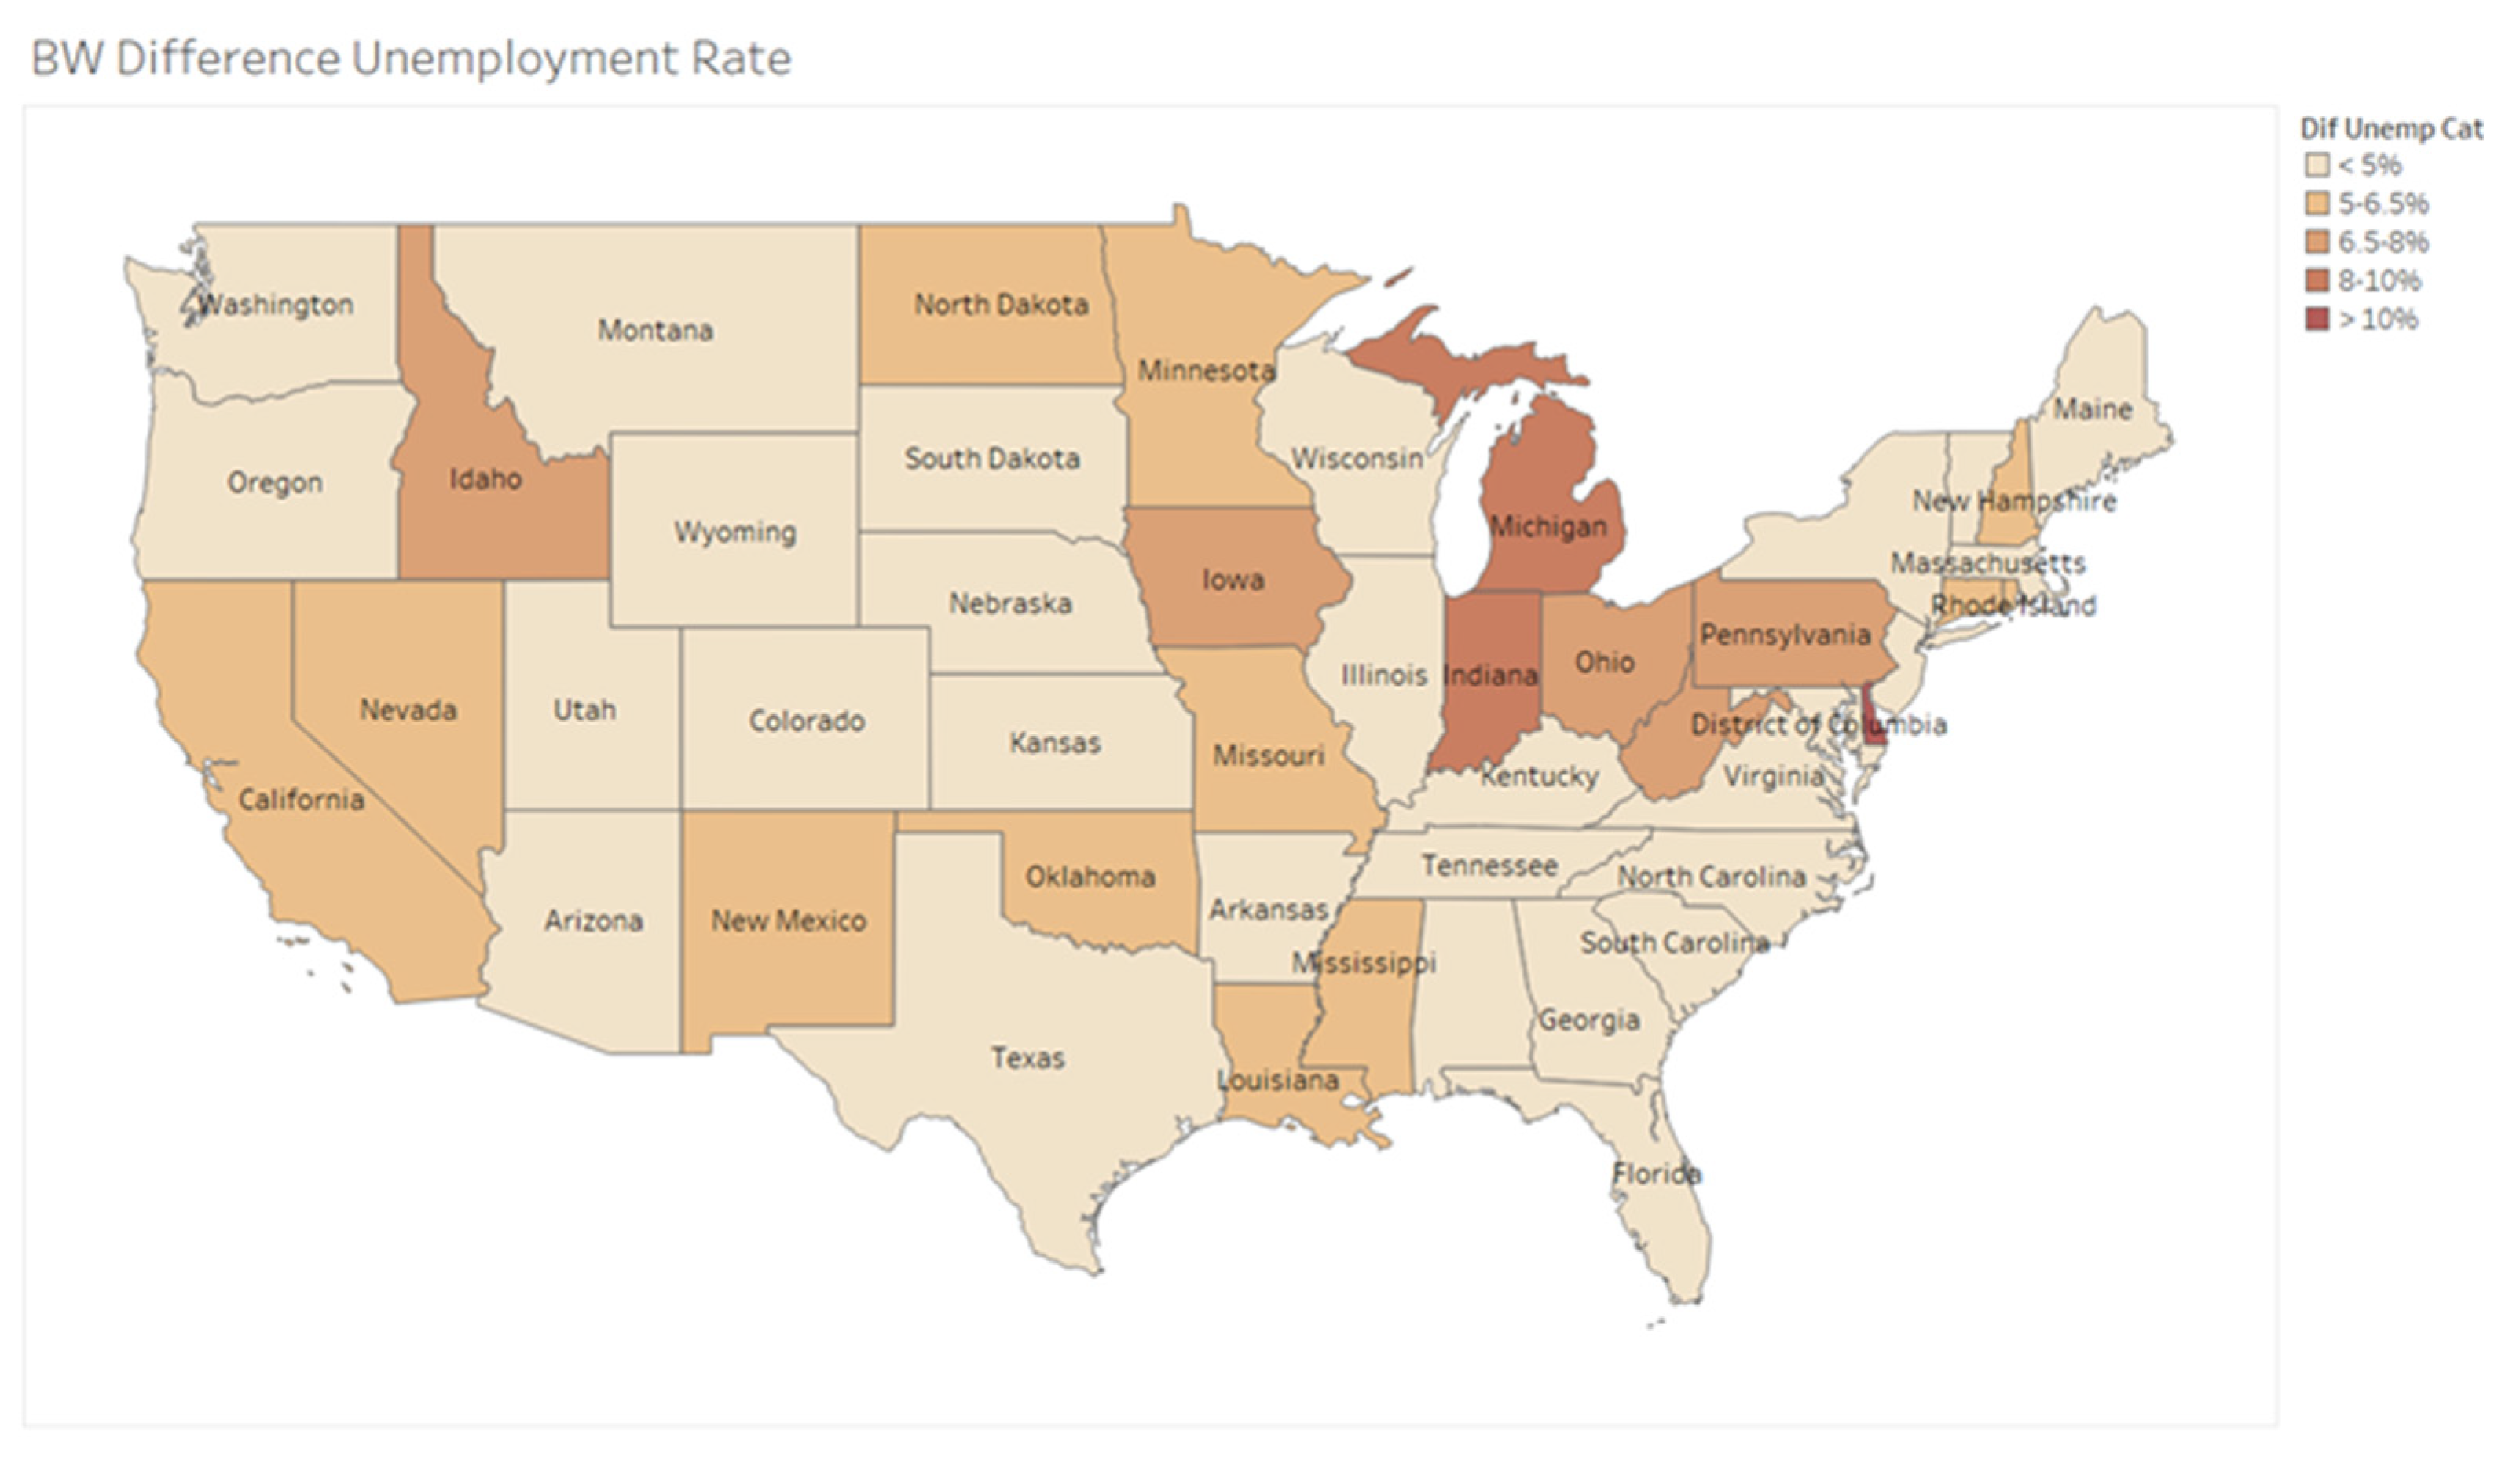
Difference in unemployment rates between Blacks and Whites
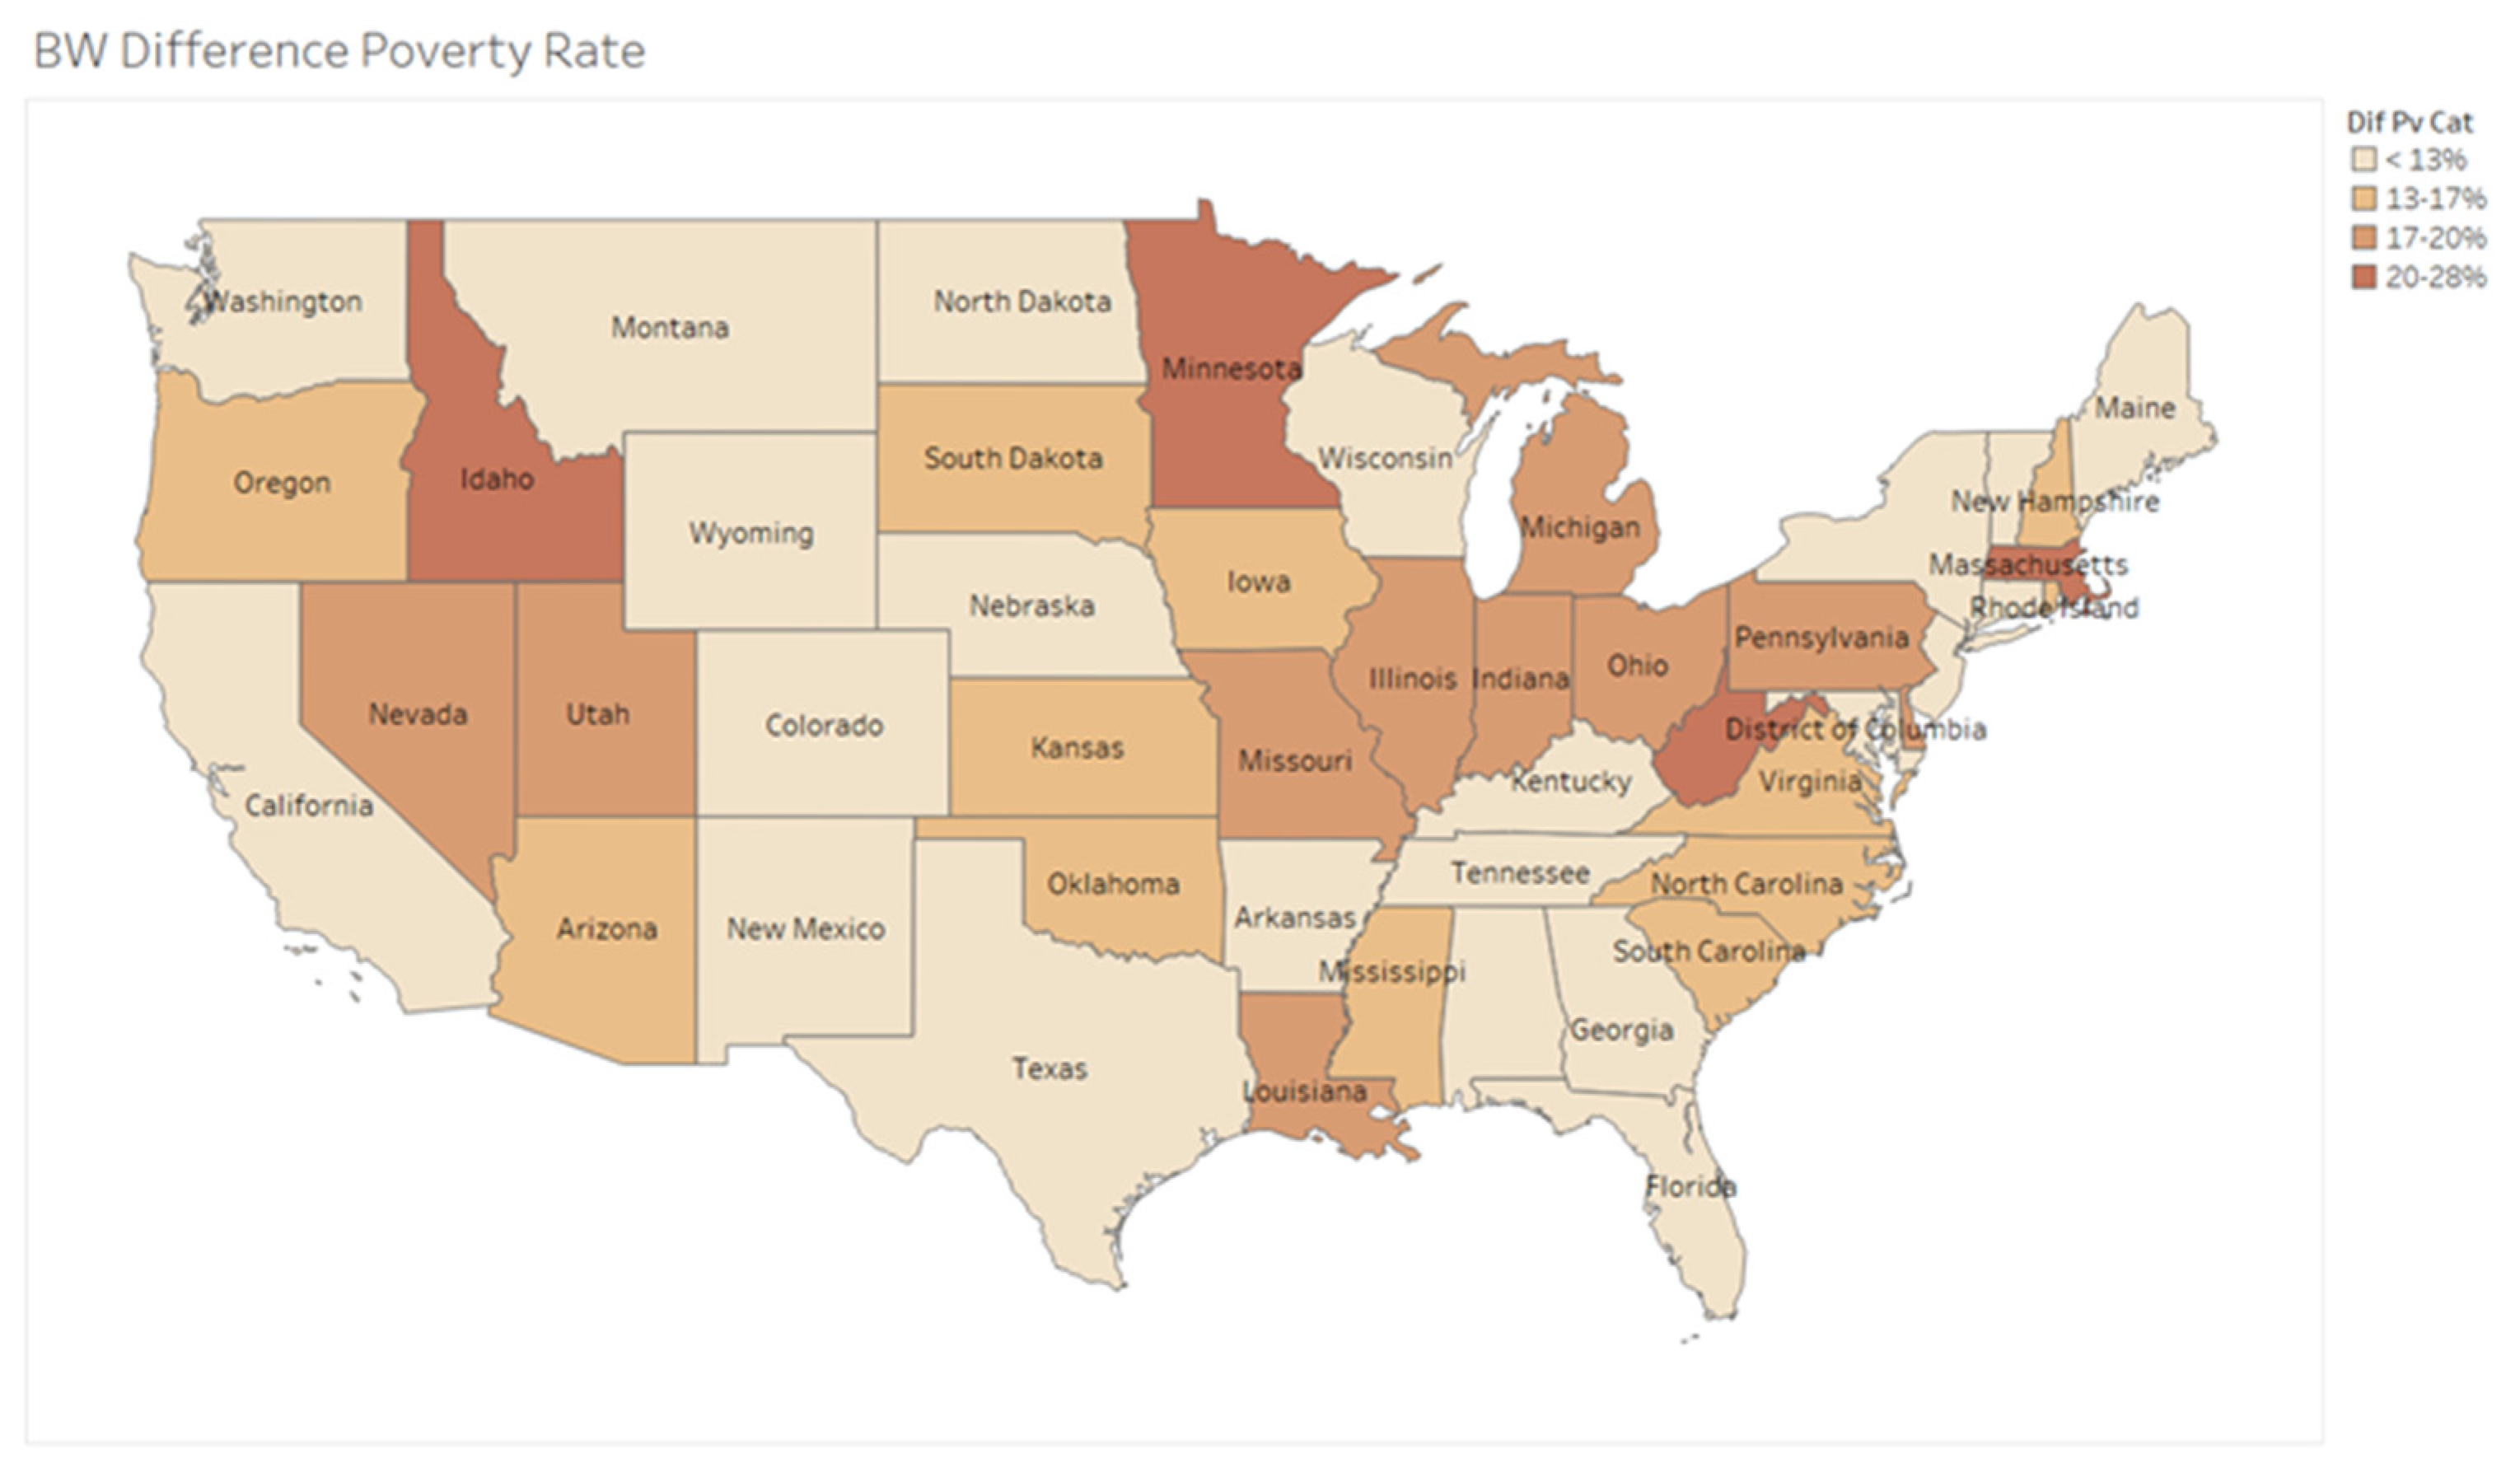
Difference in poverty rates between Blacks and Whites
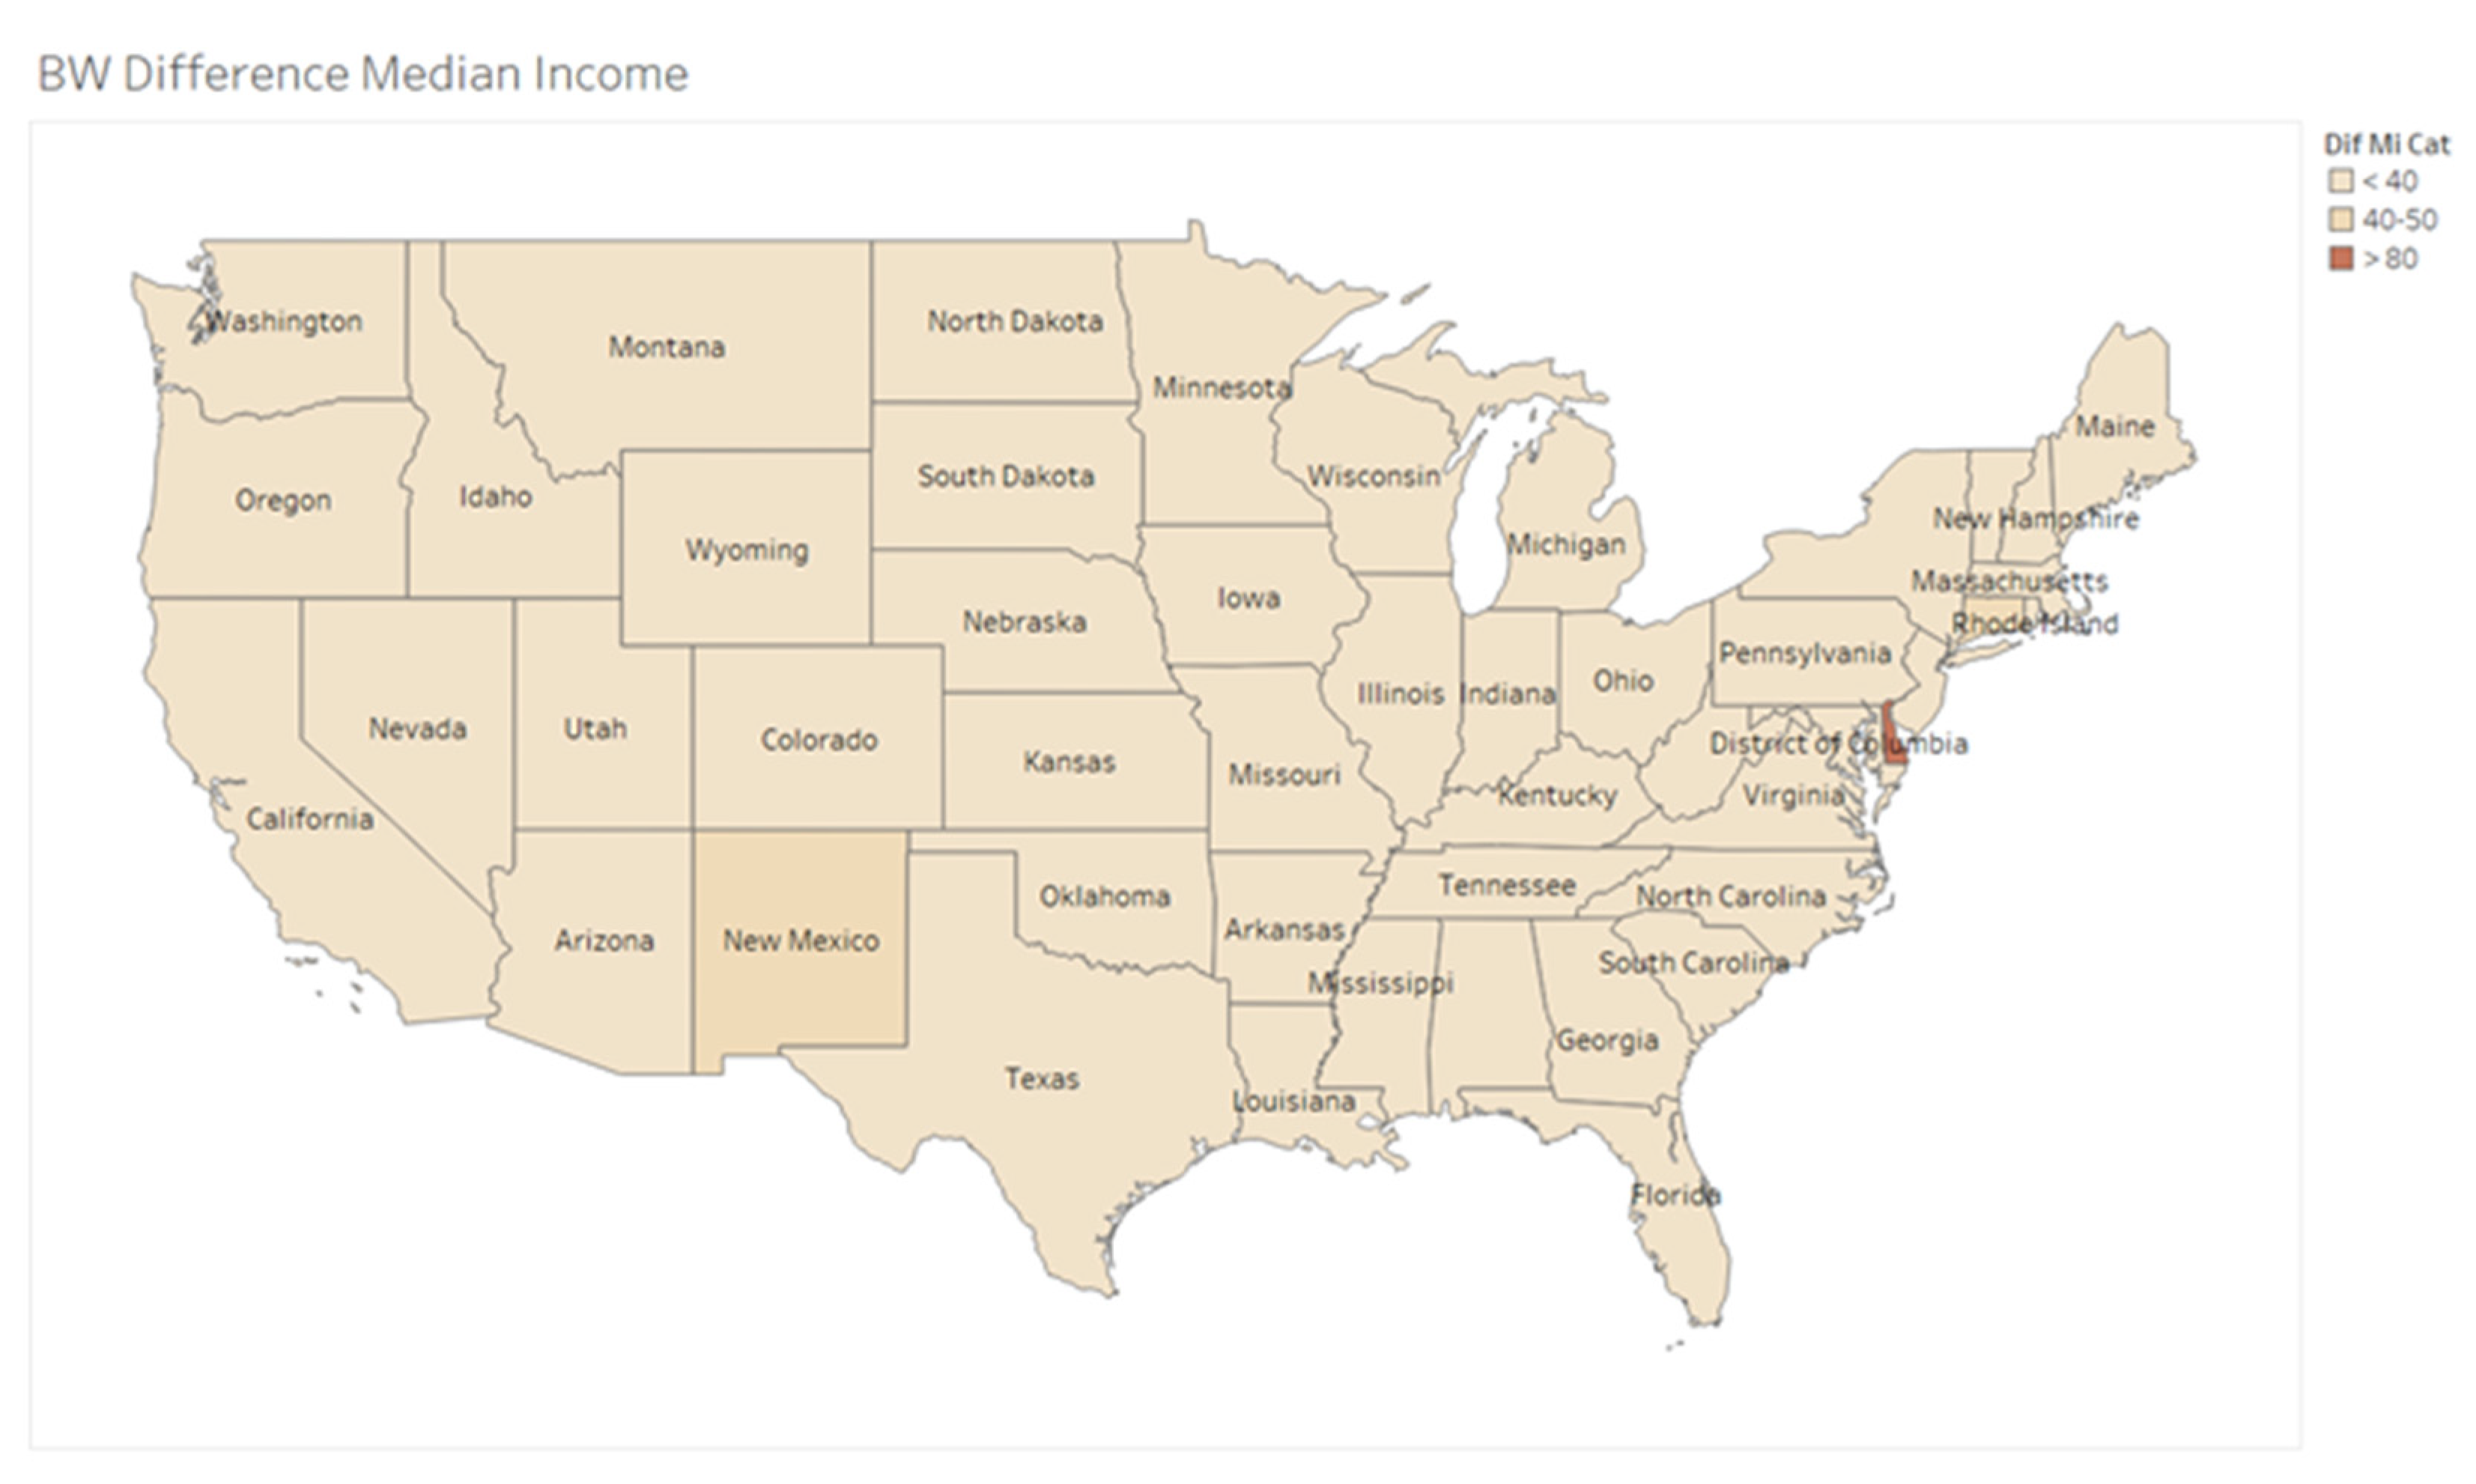
Difference in median incomes between Blacks and Whites
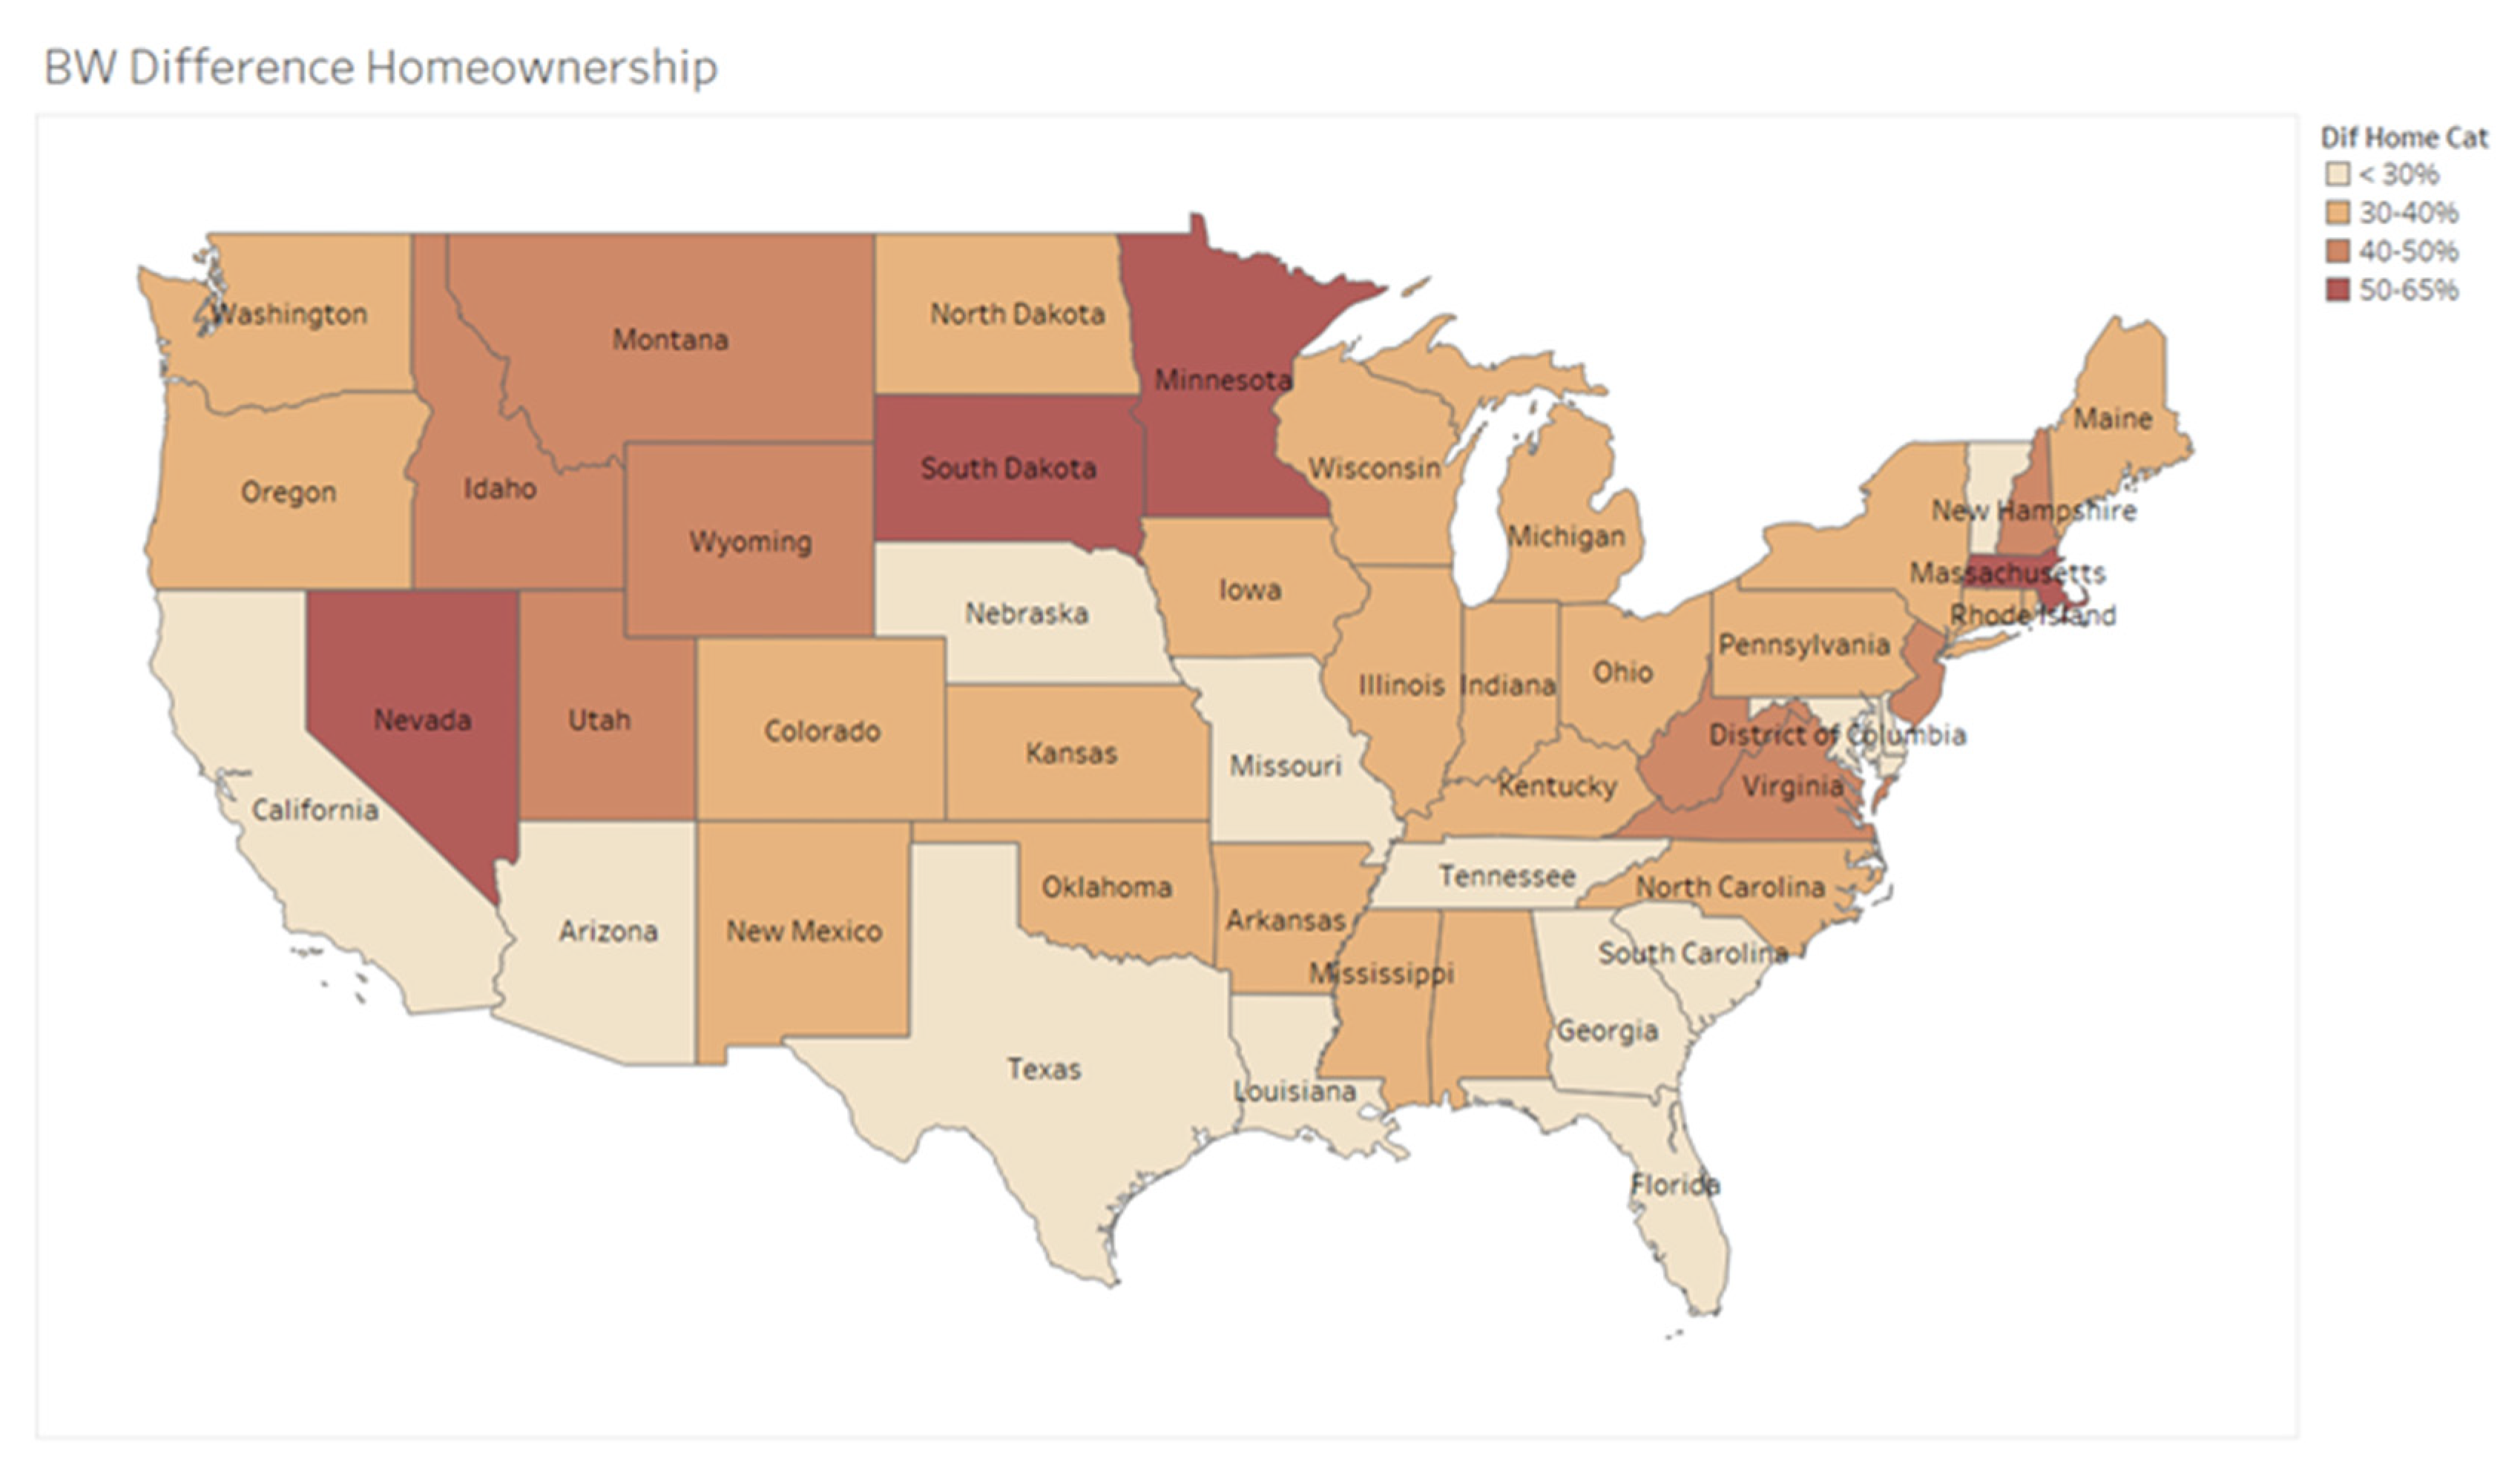
Difference in homeownership rates between Blacks and Whites
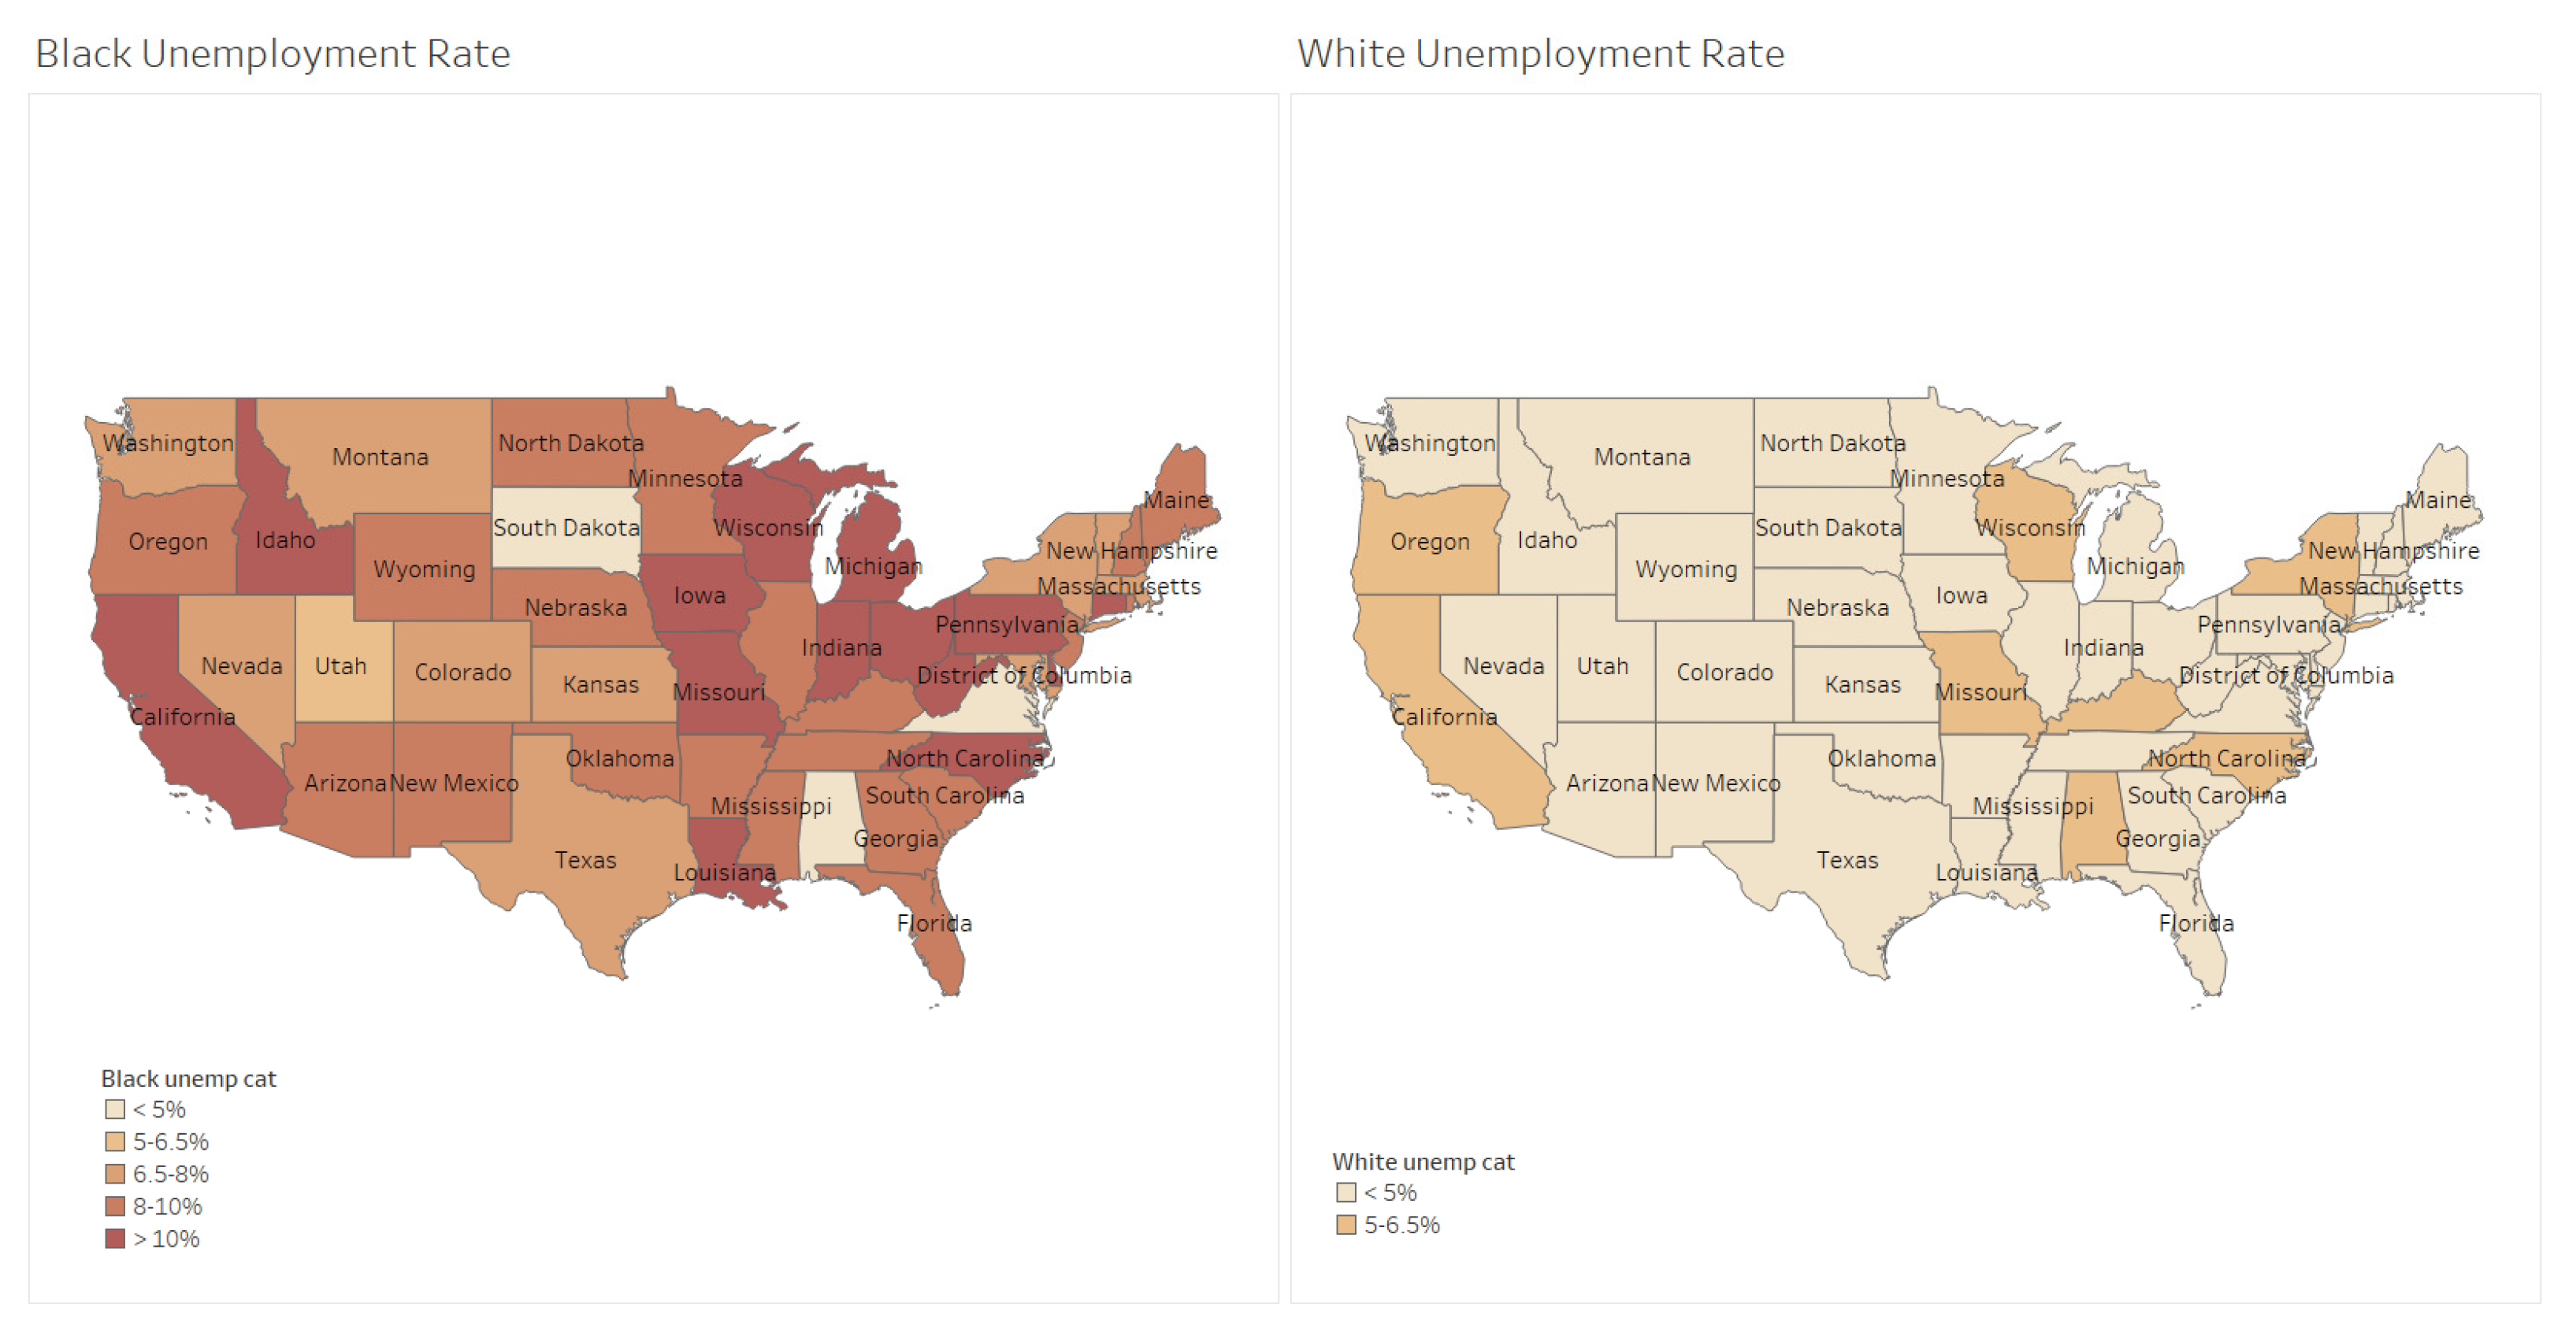
Black unemployment rate
Black poverty rate
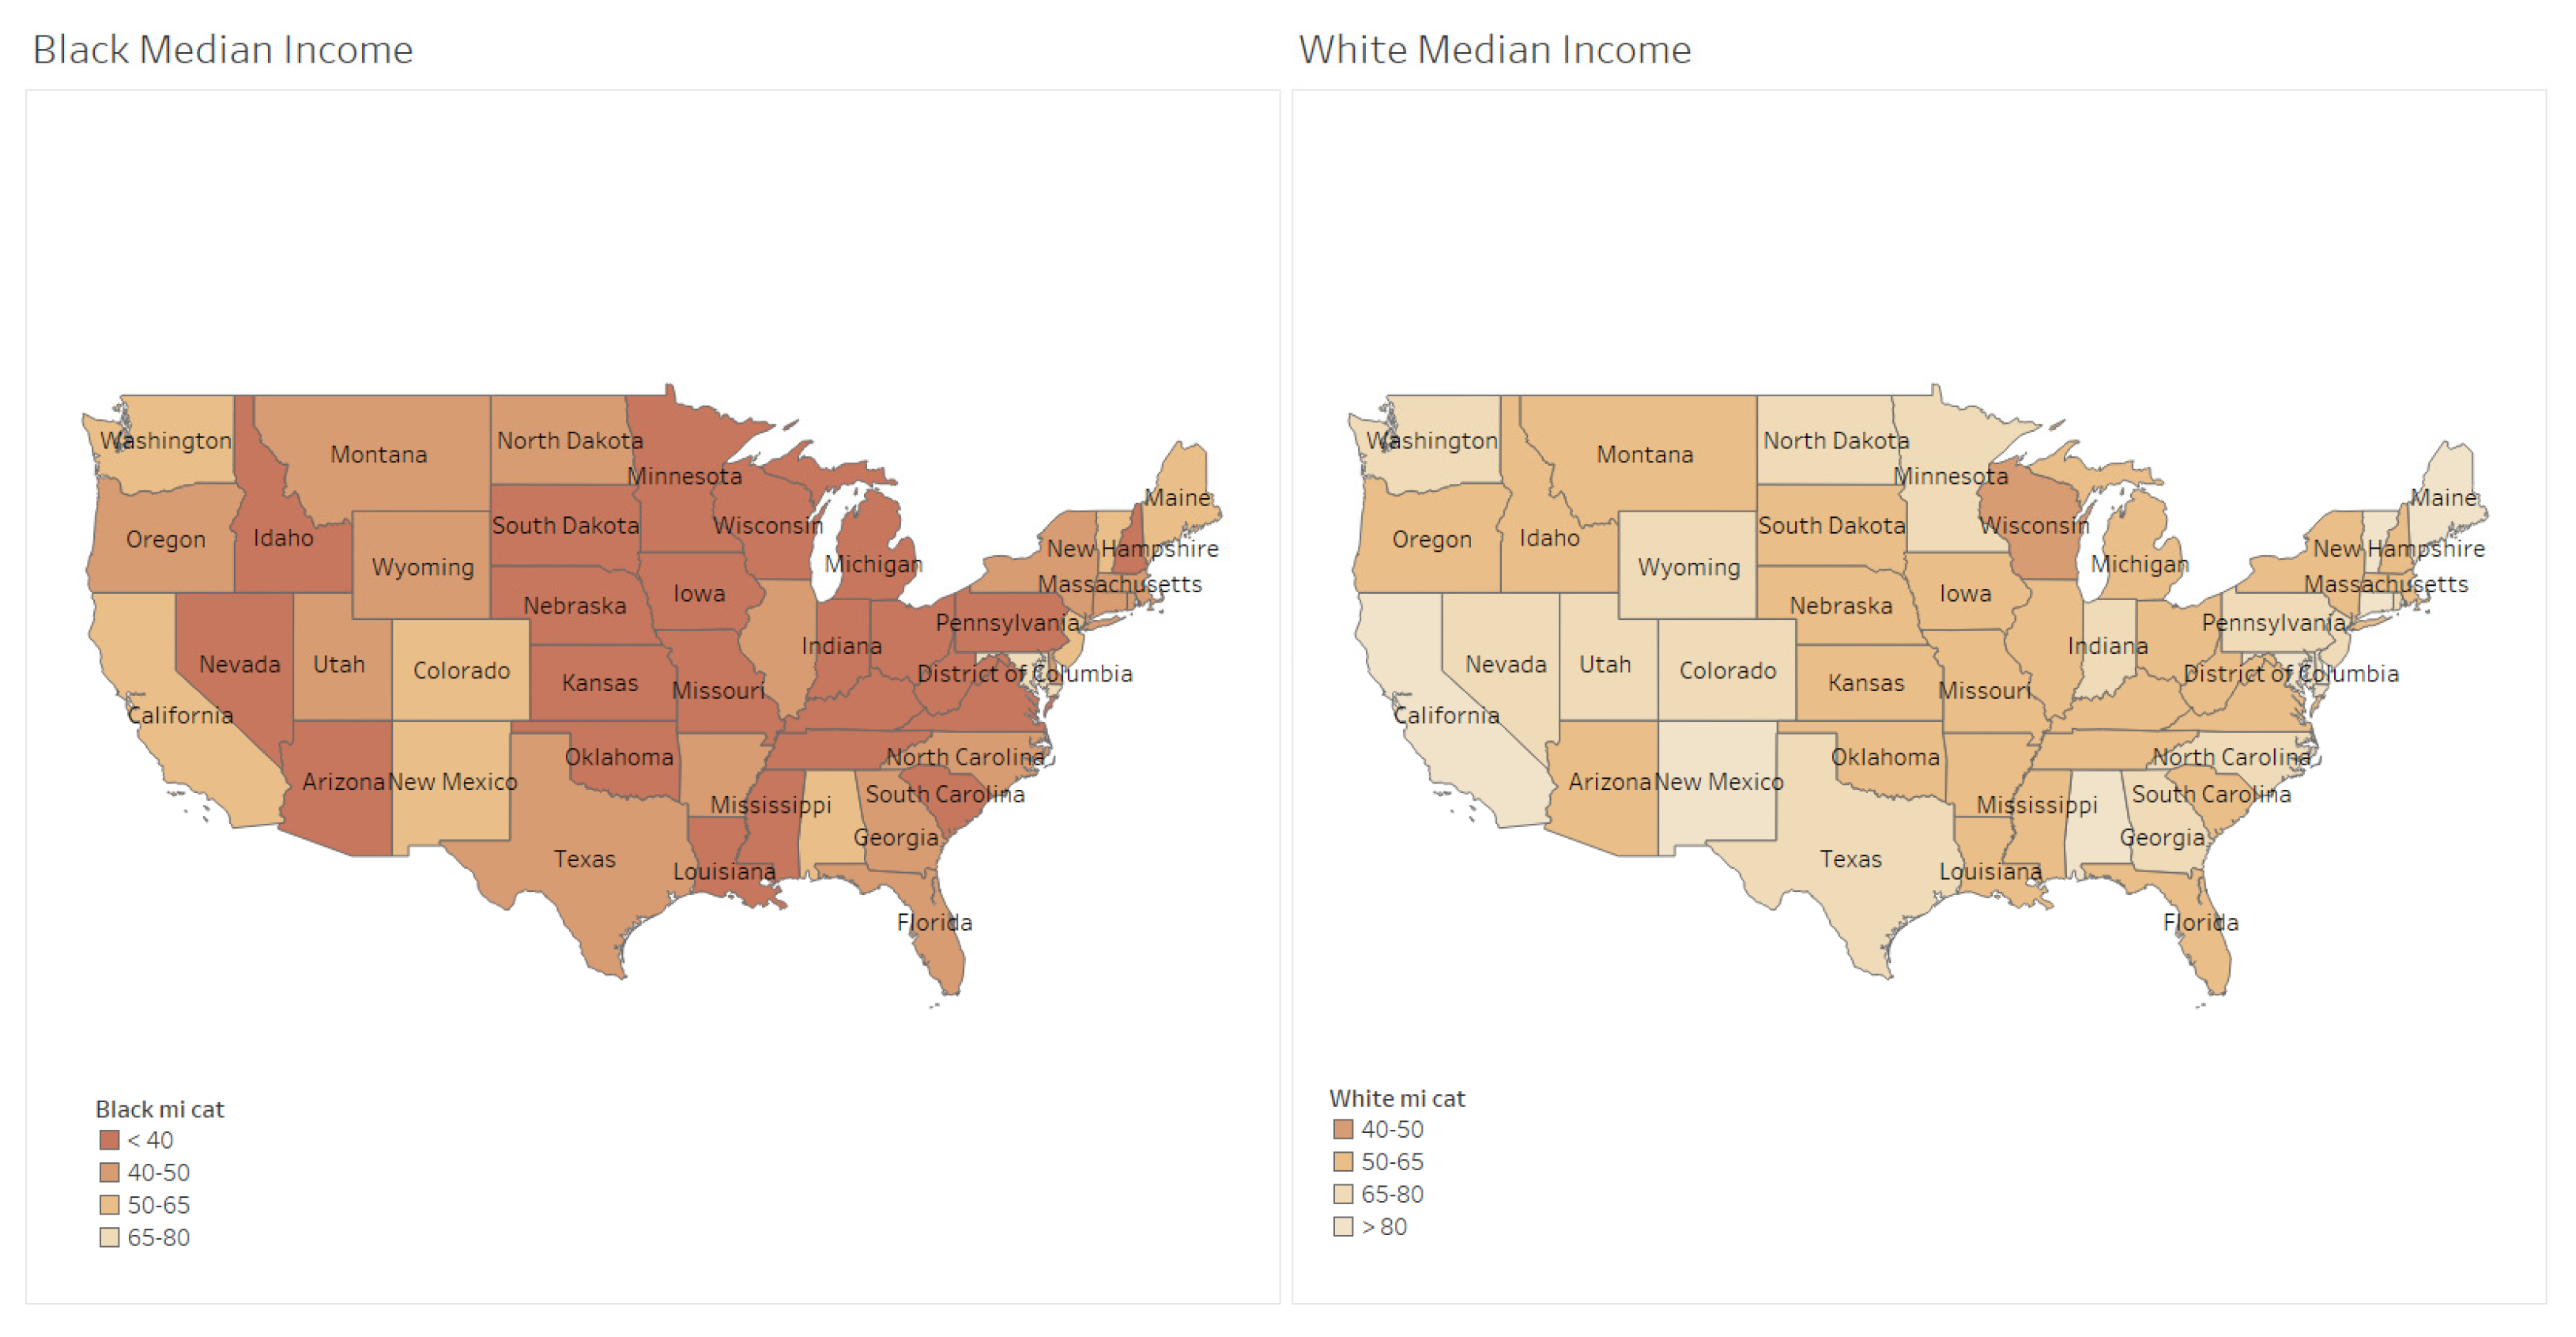
Black median income
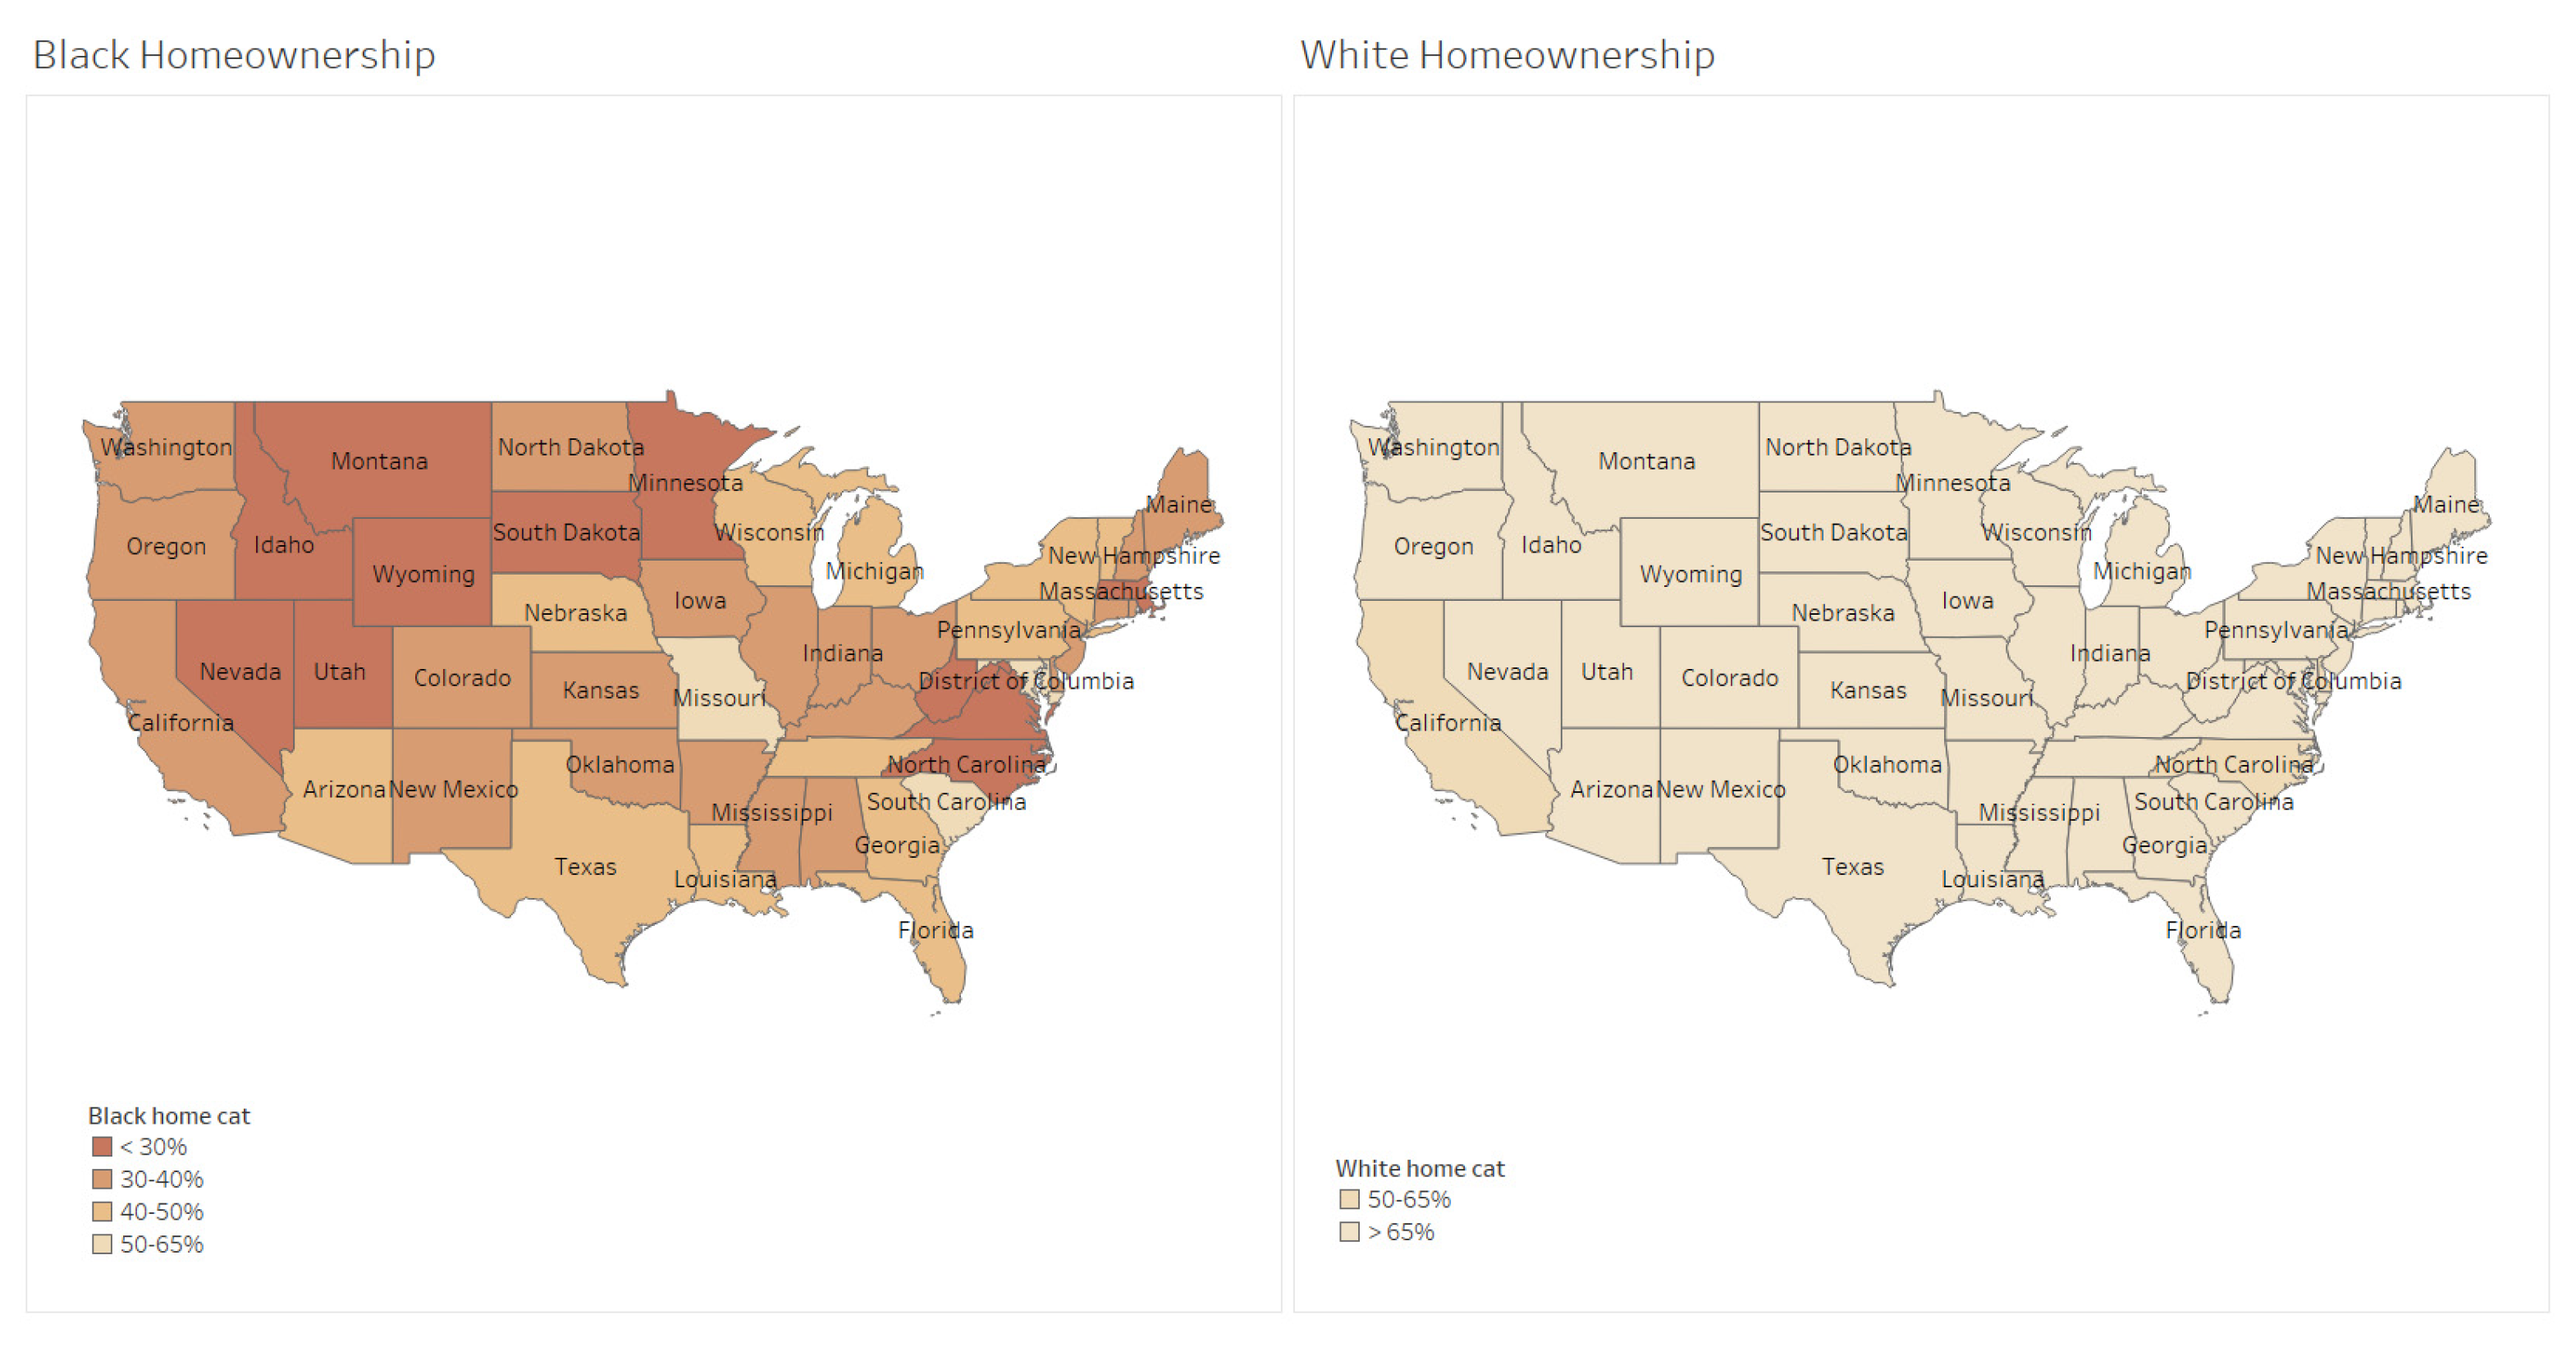
Black homeownership rate
Statistical analyses were performed using STATA statistical software (version 15.1; StataCorp. 2017, Stata statistical software: release 15, College Station, TX, USA: StataCorp LLC.).


