Article

Development of an Encapsulation Method for Trapping the Active Materials from Sour Cherry Biowaste in Alginate Microcapsules

1
Chemical Engineering Department, Faculty of Engineering, Istanbul University—Cerrahpasa, Avcilar, 34320 Istanbul, Turkey
2
Food Engineering Department, Faculty of Engineering, Akdeniz University, 07058 Antalya, Turkey
*
Author to whom correspondence should be addressed.
Foods 2023, 12(1), 130; https://doi.org/10.3390/foods12010130
Submission received: 10 November 2022 / Revised: 20 December 2022 / Accepted: 23 December 2022 / Published: 27 December 2022
(This article belongs to the Special Issue Green Extraction and Valorization of By-Products from Food Processing)

Abstract

:
This study aims to contribute to those valorization approaches for the recovery process of high-value-added substances in environmentally friendly ways. In this study, one of the most consumed juice products was selected for providing waste byproducts (peel). Sour cherry peels were subjected to automatic solvent extraction using a GRAS solvent (aqueous 80% ethanol, v/v). Then, encapsulation for the preservation of the related extract was performed by ionic gelation in alginate beads. The process conditions (gelling medium concentration, wall material concentration, and hardening time) were optimized by a Box–Behnken design (statistical experimental design approach). An almost 80% encapsulation efficiency was achieved under the proposed method (7.8% CaCI2, 1.3% alginate, and 26 min). The inhibition effect of the produced capsules against DPPH (2,2-diphenyl-1-picrylhydrazil) radicals also shows that the current products might represent potential alternative natural antioxidants for food formulations. The morphological properties were also measured.

1. Introduction

The valorization of biowaste derived from agricultural and food processing is a very important study in terms of the circular economy since the related residues possess various beneficial phytochemicals that minimize environmental damage [1]. Sour cherry pomace is a rich source of natural antioxidants [2]. A total of 25% of the total weight remains as residual waste from wine and juice processing [3]. Therefore, an investigation for the recovery of downstream processing is of great value to the production of high-value-added substances. On the other hand, these fine chemicals have been reported to represent alternatives as preservatives in food and cosmetic formulations [4,5,6]. Sour cherry pomace has been known to have a significant number of phenolic substances [7]. The dried extract powder contained 91.29 mg of total phenolic substance per gram of powder as gallic acid based on the report of Çilek et al. [8]. The main phenolic compounds in the extract are anthocyanins, such as cyanidin glycosides [9]. Its antioxidant activity was also comparable to that of butylated hydroxyanisole (one of the most consumed synthetic additives) and ascorbic acid [10]. However, the stability of these compounds should be improved due to the degradation problems when exposed to external influences, such as heat, light, humidity, and the acidity of the medium [11].
Ionic gelation can be seen as an option for an encapsulation method due to its simplicity, efficiency, and low cost [12]. There is no need to use complex systems like freeze-drying methods. Unlike spray drying, there is also no high-temperature application [13]. This is very valuable in terms of preventing the decomposition of the phenolic components, which are especially heat-sensitive components, during processing. In the presence of CaCI2 (multivalent cations, such as Ca++), polysaccharide alginate (sodium alginate) forms crosslinks to produce an edible film around the bioactive core and form a polymer film [14].
Even though there are many studies on the recovery of bioactive substances from sour cherry peels [10,15,16], encapsulation studies for the preservation of the related extract is very scarce. Çilek et al. used a conventional extraction method to extract phenolic compounds from sour cherry peels by using aqueous ethanol [8]. Then, they dried the extract via a freeze-drying method before coating the active material with maltodextrin and gum Arabic. Šaponjac et al. and Petrović et al. applied freeze-drying to encapsulate sour cherry peel extract with whey and soy protein as the wall materials, respectively [7,17]. Furthermore, they applied the encapsulated sour cherry peel extract in cookie formulations, where the functional properties of the food products were enhanced. Luca et al. used gum Arabic and a maltodextrin mixture to trap the phenolics of the sour cherry [18]. They observed that encapsulation resulted in the prevention of active materials from the coating material since it behaved like a barrier. As far as we know, there has been no application of ionic gelation for the encapsulation of active materials in sour cherry peels. Actually, ionic gelation with alginate is a better way to encapsulate phenolic compounds, such as anthocyanins, due to their sensitivity to heat [19]. Depending on our earlier reports [20,21,22], automatic solvent extraction was used as an efficient extraction method for the recovery of active materials from the selected biowaste. There are some process parameters, such as coating material (alginate) and gelling medium (calcium chloride) concentrations, hardening time for the capsules, and the ratio of core materials to wall material in ionic gelation systems. Therefore, the effects of these parameters should be identified, and then the ionic gelation system should be optimized. In this study, the active material concentration was kept constant depending on the preliminary study. The concentrations of alginate and CaCI2 and the hardening time were chosen as the process parameters (factor) affecting the present ionic gelation system. As for the dependent variables, the antioxidant activity of the produced capsules and encapsulation efficiency (EE) with respect to total phenolic content (TPC) was selected. A Box—Behnken-type design under a response surface method (RSM) was employed for the statistical experimental design of the ionic gelation system of the active materials from sour cherry peels into alginate beads. The morphology and shape properties of the developed microbeads were also investigated via a stereo microscope and scanning electron microscopy (SEM) to evaluate the morphology. The alginate beads were also subjected to physicochemical analysis, such as water activity, bulk density, and moisture content.

2. Materials and Methods

2.1. Materials

A commercial juice company (DİMES) located in İzmir (Turkey) supplied the sour cherry samples. The fruit samples were subjected to some physicochemical analyses, such as pH, total soluble solids content (°Brix), and total titratable acidity (g-malic acid/100 g). The total soluble solids content was measured at 20 °C using a digital refractometer (Atago PAL-1 BLT/i, Tokyo, Japan), while pH analyses were performed with a pH meter (Orion 4-Star pH meter, Thermo Scientific, Waltham, MA, USA). Titratable acidity was determined by potentiometric titration with 0.1 N NaOH up to pH 8.1 [23]. The total soluble solids content of the fruits was 13 °Brix. The pH of the samples was 3.2. Total titratable acidity was measured as 1.5 g-malic acid/100 g. The peels of the samples were separated by hand before the fresh peels were used in the extraction.
Folin-Ciocalteu, DPPH (2,2-diphenyl-1-picrylhydrazil), trolox (6-hydroxy-2,5,7,8-tetramethylchroman-2-carboxylic acid), gallic acid, HCl, ethanol, methanol, Na2CO3, sodium alginate, and CaCI2 dihydrate were obtained from Sigma-Aldrich (St. Louis, MO, USA).

2.2. Automatic Solvent Extraction

The extraction unit (Velp Scientifica, Usmate, Italy) was provided by the VELP® society. The extraction process was performed with 80 mL of ethanol: water: 0.1 N HCI mixture (68:20:12, v/v/v). HCI was particularly added into the solvent since acidic solutions prevent the degradation of anthocyanin substances by balancing the anthocyanins in flavylium ion form [24]. The pH of the solution was ~3. The amount of raw material to be extracted was 1 g. Total extraction time was 92 min, including immersion time (20 min), washing time (40 min), recovery time (30 min), and cooling time (2 min) [25]. Briefly, the fresh samples were put in cellulose soxhlet extraction thimbles (33 mm × 80 mm). Then, the thimbles were placed in glass cups containing the solvent. Expectedly, the level of solvent decreased since the remaining was recovered in a collection tank. The extract filtered from the cellulose thimble was not subjected to filtration.

2.3. Encapsulation Method

Alginate-based ionic gelation was used as the encapsulation method. Wall material (alginate) concentration was adjusted to 10 g/L, 15 g/L, and 20 g/L, respectively. On the other hand, the gelling medium (CaCl2) concentration was adjusted to 20 g/L, 85 g/L, and 150 g/L, respectively. Then, the mixture of the core to the wall material (1/2, v/v) was mixed by vortex for 3 min. In total, almost 170 mL of extract and 340 mL of alginate solution were consumed. The mixture was added to the medium (250 mL CaCl2) on a magnetic stirrer. Then, the capsules were left to be mixed in the CaCl2 solution for several time periods (15, 30, and 45 min) at ambient conditions. The agitation of the magnetic stirrer was 275 rpm.

2.4. Shape and Morphology of the Alginate Microcapsules

The morphology of the capsules was performed by using a stereo microscope (Stemi 2000-C, Zeiss, Germany) connected to an AxioCam digital camera. The capsule size was determined by using the Zeiss (Carl Zeiss Microscopy GmbH, Jena, Germany) program. Sphericity factor (SF) and the roundness (Rn) values of the capsules were calculated according to Equations (1) and (2) [26]:
Spherical   factor   SF = d max d min d max + d min
Roundness   Rn = P 2 4 π A
where dmax is the maximum diameter, dmin is the minimum diameter, P is the perimeter, and A is protection area of the capsules.
Scanning electron microscopy (SEM) was used to determine the morphology of the capsules. The capsules were fixed onto the stubs of Zeiss LEO 1430 model SEM device. Coating treatment was applied with a thin layer of gold.

2.5. Physicochemical Analysis of the Alginate Microcapsules

Moisture content of the capsules was determined by drying the samples in an oven maintained at 70 °C for 24 h until a constant weight. Measurement of water activity was carried out by using a water activity meter (Testo 650 Water Activity System, Cole–Parmer, Vernon Hills, IL, USA). Additionally, the bulk density of the microcapsules was calculated by application of weight/volume ratio after approximately 2 g of powder was transferred to the 10 mL graduated cylinder [27].

2.6. Bioactivity Measurements

A total of 100 mg of microcapsules were dissolved in 3 mL of ethanol: acetic acid: water mixture (50:8:42, v/v/v). After mixing the mixture with a vortex for 1 min, the mixture was subjected to an ultrasonic bath at ambient conditions. Using the Folin–Ciocalteau method, 100 µL of the microcapsule mixture was taken into 2000 µL of Folin–Ciocalteau reagent (10%, v/v). After this mixture was kept in the dark for 5 min, 1800 µL of the sodium carbonate solution (7.5%, w/v) was added to the mixture and mixed. After the resulting mixture was kept in the dark for 1 h, the absorbance values were recorded at 765 nm in a UV spectrophotometer (PG Instruments, T60 / Leicestershire and England). Total phenolic content (TPC) was given in mg gallic acid equivalent (mg-GAE) per liter (ppm) [21].
In order to evaluate the efficiency of the microcapsules, the surface phenolic content (SPC) of the microcapsules was also calculated. A total of 100 mg of beads were dissolved in 3 mL ethanol-methanol solution (1:1, v/v) by keeping them in an ultrasonic bath (Protech, Istanbul, Turkey) for 5 min at ambient temperature [28]. The SPC results are also given in ppm units.
In the case of antioxidant activity, in vitro DPPH assay was adopted [28]. A total of 15 mg of microcapsules were dissolved in 3 mL ethanol:acetic acid:water (50:8:42 v/v/v). After mixing the mixture with a vortex for 1 min, the mixture was subjected to an ultrasonic bath at 40 °C. DPPH solution was added into the mixture. Then, the samples were kept in the dark for 1 h. The measurements were read at 517 nm. The results were given in mg trolox equivalent per gram dried microcapsule (mg-TEAC/g-DM).

2.7. Encapsulation Efficiency

Encapsulation efficiency (EE) shows the success of the microencapsulation method with quantitative findings. It is expressed by the following equation:
EE   ( % ) = TPC SPC TPC

2.8. Experimental Design

Response surface approach was utilized to determine the impacts of the ionic gelation factors (A, B, and C) with their interactions (AB, AC, and BC) and quadratic (A2, B2, and C2) terms, as well as performing the modeling and optimization studies. Box–Behnken design was selected as the subtype of the RSM. While encapsulation efficiency (Y1) and antioxidant activity (Y2) were the responses, the CaCI2 concentration (A), alginate concentration (B), and hardening time (C) were ionic-gelation-process parameters. The relationship between A, B, and C was formed to estimate Y1 and Y2. Design-Expert software (12.0.1.0) was used for the application of the RSM. Table 1 demonstrates the process factors, their levels, and the codes for the experimental design of the microencapsulation of active substances in sour cherry peels.

3. Results and Discussions

3.1. Microencapsulation of the Active Substances from the Sour Cherry Peels in the Alginate Microcapsules

Design-Expert software produced 17 experimental values with several combinations of process parameters, depending on the design type (Box–Behnken) of the RSM (Table 2). An encapsulation efficiency of ≈80% was accomplished by the proposed method. On the other hand, the free radical scavenging activity against the DPPH radical varied from 2.50 to 3.26 mg-TEAC/g-DM. Luca et al. reported 86.07–98.29 % EE for the encapsulation of the same extract with a freeze-drying method using different wall materials (gum Arabic and maltodextrin mixture) [29]. When soy protein and whey were used in freeze-drying encapsulation method, the yields of each wall material were 94.9% and 90.1%, respectively [30]. It was also reported that EE with a 1/10 core to wall material changed between 69.38% and 77.83% [8]. Then, EE varied from 78.80% to 92.26% if the ratio was adjusted to 1/20. Oancea et al. encapsulated the sour cherry peel extract in whey proteins isolate with lower yield (almost 70% EE) [31]. Actually, it seems that the yield of the encapsulation depends on many factors such as the encapsulation method, wall material type, and the ratio of active material to wall material. As a simple, efficient and inexpensive method, ionic gelation might be a good option with the proposed yields [12].

3.2. Effects of the Ionic Gelation Parameters

Three-dimensional (3D) visuals can also be used to visually present the effect of the process parameters. These 3D images (Figure 1, Figure 2 and Figure 3) were produced with Design-Expert software. As seen in Figure 1a,b, the EE and antioxidant activity of the microcapsules increased sharply with CaCI2 concentration at first due to the fact that the Ca++ ions are necessary to form the capsules. The strength of the gel is also enhanced by increasing the concentration [32]. However, both of the responses reduced visibly after around a 10% concentration for CaCI2 (Figure 2a,b). A similar tendency of the gelling medium effect was also reported by Yousefi et al. during the encapsulation of Viola odorata Linn. extract by ionic gelation [33]. According to Halder et al. [34], the bivalent Ca⁺⁺ ions of the gelling-medium transferred to the beads, leading to the substitution of the active substance by the Ca⁺⁺ ions. Therefore, the yields of the encapsulation dropped by a higher degree for the CaCI2 concentration. Alginate concentration also favored encapsulation at first. Then, it started to decrease, as seen in Figure 1. This outcome is in agreement with the earlier reports on the alginate-based ionic gelation of several active materials [33,35,36,37]. Zam et al. explained this finding, with the increase in viscosity as the major reason for encapsulation efficiency [35]. Niizawa et al. also observed the same alginate effect on the encapsulation of astaxanthin in alginate microcapsules [38]. This was attributed to the occupation of the free spaces in the capsule, with excess alginate instead of the active material of the extract.
When the time for hardening is considered, EE was not significantly influenced, as seen in Figure 2a and Figure 3a. Additionally, the antioxidant activity of the capsules increased with time until ~30 min, as seen in Figure 2b and Figure 3b. Then, the activity against the free radicals began to drop with time. This is most probably because of the fact that the diffusion of the polar phenolic antioxidants into the polar gelling medium takes place due to the overexposure to the medium [39]. Similar time impacts were also observed during the encapsulation of cumin seed essential oil in alginate beads [27] and the encapsulation of yerba mate extract in alginate/chitosan microcapsules [40], respectively.

3.3. Modeling Study

The Box–Behnken design (as an independent quadratic design approach) was adopted for the present ionic gelation system. Since there are three factors with three levels, the Box–Behnken design was preferred. A total of 17 experimental runs with five replications at the center points (8.5% calcium chloride, 1.5% sodium alginate, and 30 min) were generated by the Design-Expert software. Figure 4 illustrates the classical quadratic designs for the current three factors of EE (Figure 4a) and antioxidant activity (Figure 4b), respectively.
The experimental data were subjected to the given quadratic model (Equation (4)):
Y = β o + i = 1 k β i X i + i = 1 k β i i   X i 2 + i < j β i j X i X j + ε i
Y represents the response variable (EE and antioxidant activity), while k is the number of independent factors (three in this process). βₒ is the constant, whereas βᵢ, βᵢᵢ, and βij are the linear, quadratic, and interaction effects of the factors, respectively.
The derived second order models (depending on Equation (4)) are given by Equations (5) and (6):
Y 1 = 76.76 3.61   A + 5.55   B 5.23   C 0.0488   AB 1.20   AC 1.67   BC 16.54   A 2 5.75   B 2 + 3.50   C 2
Y 2 = 3.13 0.0207   A 0.0404   B 0.0854   C + 0.0892   AB 0.0311   AC 0.1325   BC 0.2025   A 2 0.0603   B 2 0.3135   C 2
ANOVA (analysis of variance) was used to analyze the models statistically. Table 3 and Table 4 are the ANOVA findings with a significance level of 5% for Y1 and Y2, respectively. A model F-value of 24.59 means that the model is significant (Table 3), whereas a second model F-value of 14.67 implies the related model is significant, as seen in Table 4. On the other hand, a p-value < 0.05 denotes the significance of the model terms. In this instance, all the selected parameters and their second-order terms (A, B, C, A², B², and C²) are found to be statistically significant, as seen in Table 3. Table 4 indicates that C, BC, A², and C² are significant at p < 0.05 in the case of Y2. When the other model-fit statistics, such as the F-value, p-value, coefficient of variance (CV), coefficient of determination (R2), adjusted R2, predicted R2, and lack of fit, are considered, both of the models seem satisfactory for the representation of the experimental finding. Lack-of-fit F-values of 0.65 and 0.04 imply the lack of fit values for both responses (Y1 and Y2) are not significant. CV values (4.36% and 2.78%) of less than 10% are desirable since CV represents the dispersion of the data around the mean [41]. So, the smaller the CV, the less variation around the mean. Furthermore, the predicted R² of 0.8065 is in compliance with the adjusted R² of 0.9299 (Table 3), whilst the predicted R² of 0.9020 is in conformity with the adjusted R² of 0.8849 (Table 4). It is desirable that the difference between the predicted R2 and adjusted R2 be less than 0.2.

3.4. Optimization and Validation Studies

An optimization study was performed under the ranges of each process parameter to achieve the maximum EE and antioxidant activity. Table 5 gives the optimum conditions with the maximum yields, with a 0.89 desirability. In order to verify the predicted conditions, experimental studies under the optimum conditions (7.8% CaCI2, 1.3% alginate, and 26 min) were performed. The difference between the actual and predicted EE and antioxidant values (less than 2%) shows the reliability of the outcome of this study. Figure 5a (EE) and Figure 5b (antioxidant activity) also demonstrate the reliability of the produced models when less dispersion around the regression line is considered.

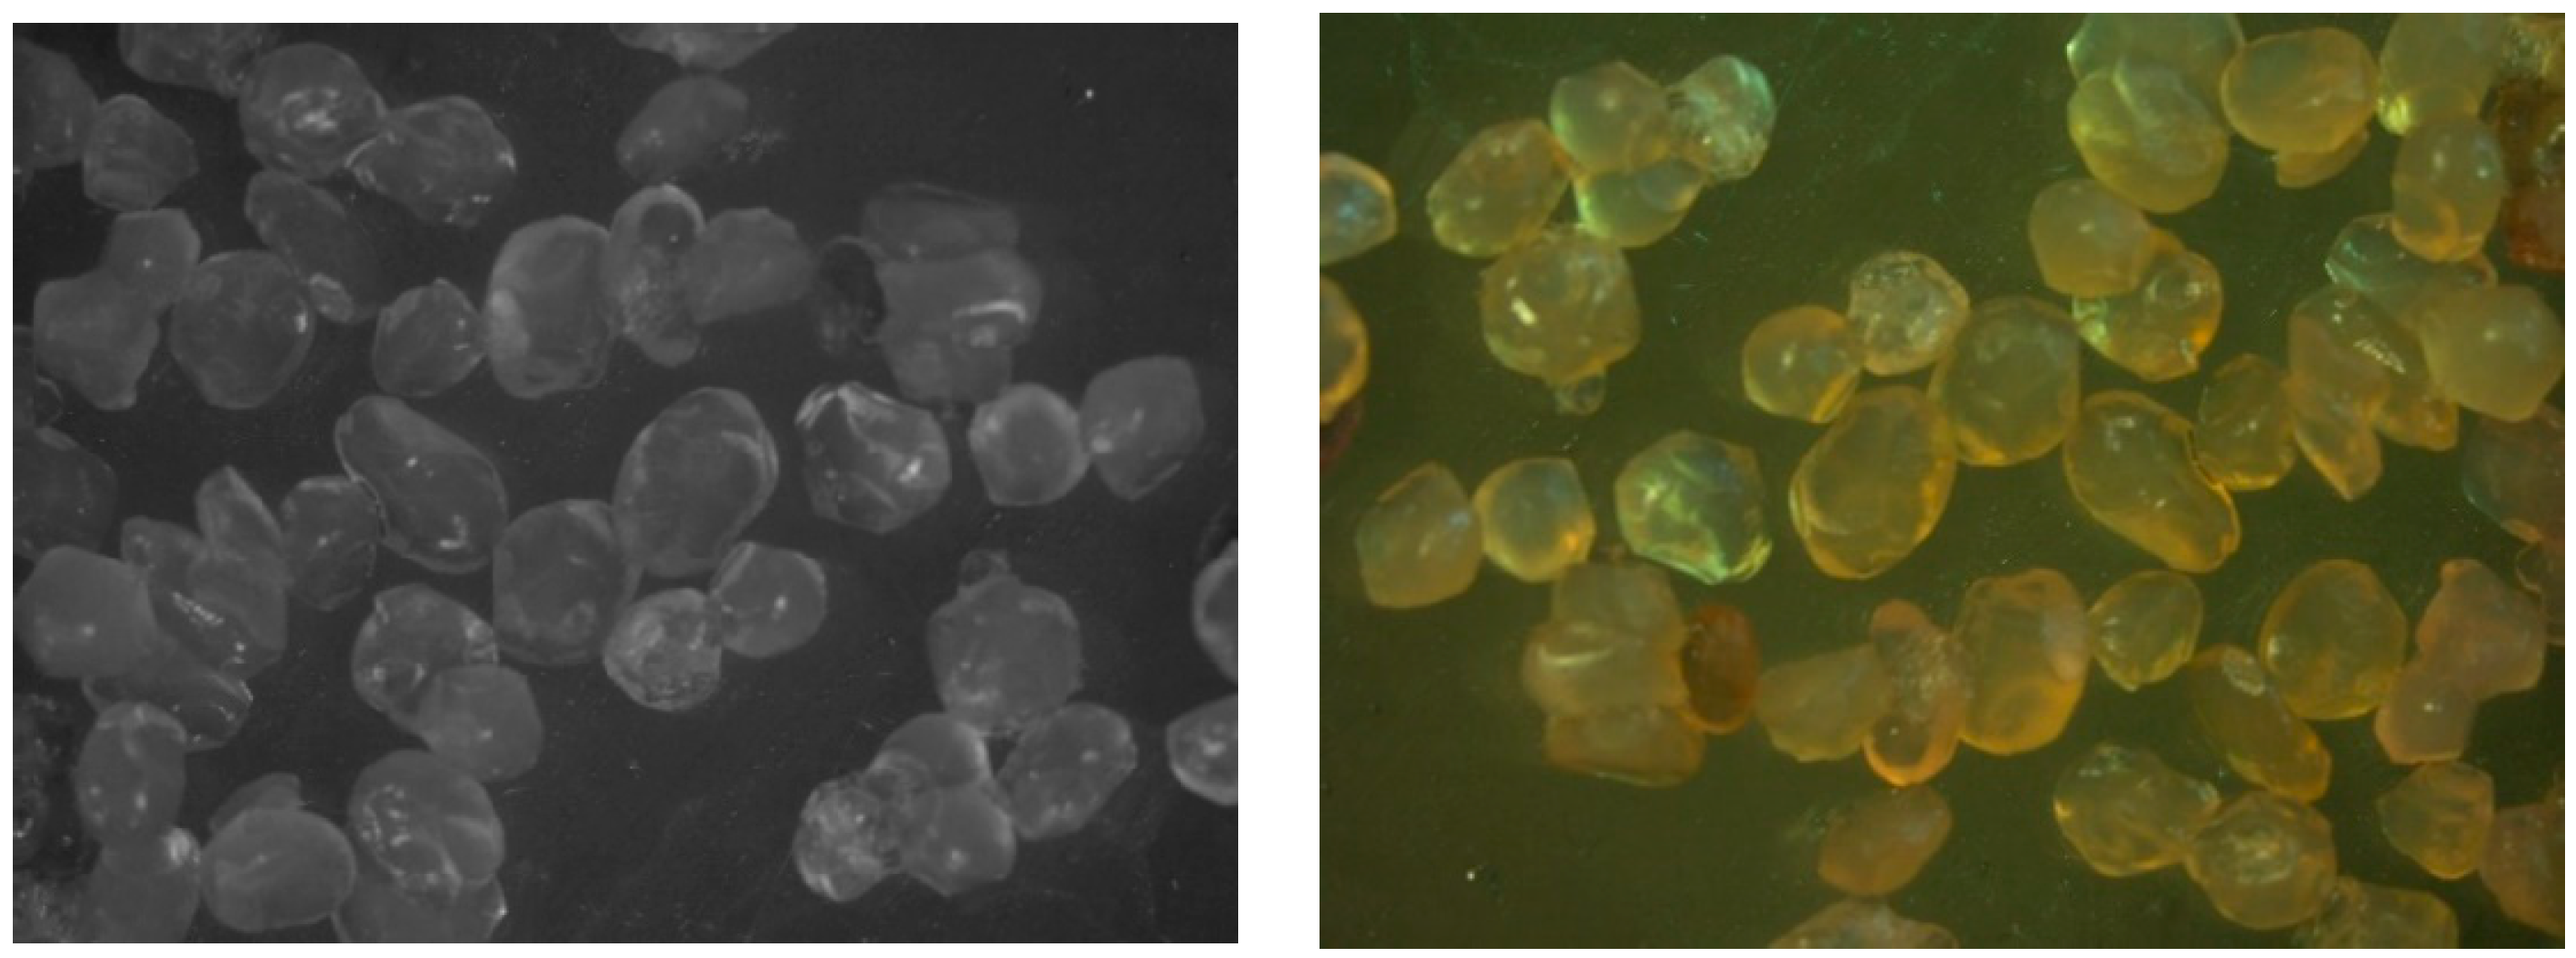
3.5. Morphology and Size of the Alginate Microcapsules

As spherical beads with a uniform size distribution are preferred for the delivery of active substances, the size and shape of the beads represent important parameters for food and pharmaceutical products [42]. The SF value was calculated via the ratio of the minimum capsule diameter to the maximum capsule diameter. This is mostly used for the teardrop and pear-shaped particles. While the SF value calculated by the ratio of the minimum and maximum diameters (to each other) is expected to be close to zero in a perfect sphere, it is also acceptable to be less than 0.05. Frequently, the Rn value indicates the spherical and elliptical characteristics of the particles. Although the Rn and SF values show how perfect the sphericity is, the Rn value is expected to be close to 1, contrary to the previously mentioned SF value [26]. The images of the alginate beads, including those from the sour cherry peel extract, are shown in Figure 6. The SF and Rn values were determined as 0.047 ± 0.017 and 1.126 ± 0.023, respectively. It is possible to say that the capsules are in an acceptable shape depending on the SF and Rn findings.
As seen in Figure 7, the SEM images support the previous size findings. The capsules are smooth and homogeneous because of the bond between the alginate and phenolic substances [43].

3.6. Moisture Content, Water Activity, and Bulk Density of the Alginate Microcapsules

The microcapsules produced under optimum conditions (7.8% CaCI2, 1.3% alginate, and 26 min) were subjected to physicochemical analyses, such as moisture content, water activity, and bulk density. The moisture content and bulk density of the beads were 52.30 ± 3.01% and 0.54 ± 0.07 g/mL, respectively. The water activity of the samples was determined to be 0.684 ± 0.02. Gholamian et al. mentioned that the high water-absorbing capacity of alginate gave rise to the formation of a 3D network with high moisture content [27]. Additionally, the macropores of the alginate matrix caused a low bulk density for the hydrogels. On the other hand, the hydrophilic or lipophilic character of the core material influenced the moisture content and density of the hydrogels.

4. Conclusions

The residuals from one of the most consumed juices were investigated in terms of the valorization of a rich source of natural antioxidants. In order to preserve the active material from many factors, an ionic gelation method was proposed using alginate microcapsules. A Box–Behnken design for the response surface method was adopted to develop a microencapsulation method for trapping the bioactive materials in the extract after the sour cherry peels were subjected to a green, environmentally friendly extraction method (automatic solvent extraction with aqueous ethanol). The optimum conditions (7.8% CaCI2, 1.3% alginate, and 26 min) were verified with a less than 2% error (the difference between the actual and predicted response values). All the fitting statistics (F-value (24.59 and 14.67), p-value (<0.05), lack of fit (>0.05), CV (<10%), R2 (>0.94) adjusted R2 (>0.88), and predicted R2 (>0.80)) denoted the satisfactory model equations for the microencapsulation of sour cherry peel extract in alginate beads. As a result of the increasing importance of functional foods recently, the microencapsulation process has gained more meaning for the food industry. Considering that the current samples have antioxidant activity, these products might find application as a potential food additive. In this way, the physical properties of the related food product might be improved by preventing the possible bitter taste of the extracts from being used directly and the release of undesirable colors into the food. Moreover, the capsules are in an acceptable shape (smooth and homogeneous), considering that regular size dispersion is preferred for the transportation of active substances in food applications.

Author Contributions

İ.T.: Software, Validation, Formal analysis, M.T.: Validation, Formal analysis, S.Ş.: Conceptualization, Methodology, Writing—Reviewing and Editing. All authors have read and agreed to the published version of the manuscript.

Funding

The authors would like to thank Istanbul University-Cerrahpaşa for their support of this Project (Project No: FYO-2022-36093).

Data Availability Statement

Data are accessible on demand from the corresponding author. Code availability (software application or custom code)-Design-Expert software (12.0.1.0).

Conflicts of Interest

The authors declare no conflict of interest.

References

  1. Leichtweis, M.G.; Oliveira, M.B.P.P.; Ferreira, I.C.F.R.; Pereira, C.; Barros, L. Sustainable Recovery of Preservative and Bioactive Compounds from Food Industry Bioresidues. Antioxidants 2021, 10, 1827. [Google Scholar] [CrossRef] [PubMed]
  2. Bruno Romanini, E.; Misturini Rodrigues, L.; Finger, A.; Perez Cantuaria Chierrito, T.; Regina da Silva Scapim, M.; Scaramal Madrona, G. Ultrasound Assisted Extraction of Bioactive Compounds from BRS Violet Grape Pomace Followed by Alginate-Ca2+ Encapsulation. Food Chem. 2021, 338, 128101. [Google Scholar] [CrossRef] [PubMed]
  3. Sirohi, R.; Tarafdar, A.; Singh, S.; Negi, T.; Gaur, V.K.; Gnansounou, E.; Bharathiraja, B. Green Processing and Biotechnological Potential of Grape Pomace: Current Trends and Opportunities for Sustainable Biorefinery. Bioresour. Technol. 2020, 314, 123771. [Google Scholar] [CrossRef] [PubMed]
  4. Mewa-Ngongang, M.; Du Plessis, H.W.; Ntwampe, S.K.O.; Chidi, B.S.; Hutchinson, U.F.; Mekuto, L.; Jolly, N.P. Grape Pomace Extracts as Fermentation Medium for the Production of Potential Biopreservation Compounds. Foods 2019, 8, 51. [Google Scholar] [CrossRef] [PubMed] [Green Version]
  5. Marchiani, R.; Bertolino, M.; Belviso, S.; Giordano, M.; Ghirardello, D.; Torri, L.; Piochi, M.; Zeppa, G. Yogurt Enrichment with Grape Pomace: Effect of Grape Cultivar on Physicochemical, Microbiological and Sensory Properties. J. Food Qual. 2016, 39, 77–89. [Google Scholar] [CrossRef] [Green Version]
  6. Kalli, E.; Lappa, I.; Bouchagier, P.; Tarantilis, P.A.; Skotti, E. Novel Application and Industrial Exploitation of Winery By-Products. Bioresour. Bioprocess. 2018, 5, 46. [Google Scholar] [CrossRef]
  7. Tumbas Šaponjac, V.; Ćetković, G.; Čanadanović-Brunet, J.; Pajin, B.; Djilas, S.; Petrović, J.; Lončarević, I.; Stajčić, S.; Vulić, J. Sour Cherry Pomace Extract Encapsulated in Whey and Soy Proteins: Incorporation in Cookies. Food Chem. 2016, 207, 27–33. [Google Scholar] [CrossRef]
  8. Cilek, B.; Luca, A.; Hasirci, V.; Sahin, S.; Sumnu, G. Microencapsulation of Phenolic Compounds Extracted from Sour Cherry Pomace: Effect of Formulation, Ultrasonication Time and Core to Coating Ratio. Eur. Food Res. Technol. 2012, 235, 587–596. [Google Scholar] [CrossRef]
  9. Kołodziejczyk, K.; Sójka, M.; Abadias, M.; Viñas, I.; Guyot, S.; Baron, A. Polyphenol Composition, Antioxidant Capacity, and Antimicrobial Activity of the Extracts Obtained from Industrial Sour Cherry Pomace. Ind. Crops Prod. 2013, 51, 279–288. [Google Scholar] [CrossRef]
  10. Hosseini, S.; Parastouei, K.; Khodaiyan, F. Simultaneous Extraction Optimization and Characterization of Pectin and Phenolics from Sour Cherry Pomace. Int. J. Biol. Macromol. 2020, 158, 911–921. [Google Scholar] [CrossRef]
  11. Tsali, A.; Goula, A.M. Valorization of Grape Pomace: Encapsulation and Storage Stability of Its Phenolic Extract. Powder Technol. 2018, 340, 194–207. [Google Scholar] [CrossRef]
  12. Liu, Y.; Zhou, Q.; He, Y.-M.; Ma, X.-Y.; Liu, L.-N.; Ke, Y.-J. Optimization of Preparation and Properties of Gardenia Yellow Pigment-Loaded Alginate Beads. Korean J. Chem. Eng. 2021, 38, 1669–1675. [Google Scholar] [CrossRef]
  13. Kurozawa, L.E.; Hubinger, M.D. Hydrophilic Food Compounds Encapsulation by Ionic Gelation. Curr. Opin. Food Sci. 2017, 15, 50–55. [Google Scholar] [CrossRef]
  14. Benavides, S.; Cortés, P.; Parada, J.; Franco, W. Development of Alginate Microspheres Containing Thyme Essential Oil Using Ionic Gelation. Food Chem. 2016, 204, 77–83. [Google Scholar] [CrossRef]
  15. Kurtulbaş, E. Prediction of Mass Transfer and Kinetic Behavior during the Extraction of High Added-Value Products from Sour Cherry (Prunus Cerasus L.) Peels. J. Food Process. Preserv. 2022. [Google Scholar] [CrossRef]
  16. Yılmaz, F.M.; Karaaslan, M.; Vardin, H. Optimization of Extraction Parameters on the Isolation of Phenolic Compounds from Sour Cherry (Prunus Cerasus L.) Pomace. J. Food Sci. Technol. 2015, 52, 2851–2859. [Google Scholar] [CrossRef] [Green Version]
  17. Petrović, J.; Pajin, B.; Lončarević, I.; Šaponjac, V.T.; Nikolić, I.; Ačkar, Đ.; Zarić, D. Encapsulated Sour Cherry Pomace Extract: Effect on the Colour and Rheology of Cookie Dough. Food Sci. Technol. Int. 2018, 25, 130–140. [Google Scholar] [CrossRef]
  18. Luca, A.; Cilek, B.; Hasirci, V.; Sahin, S.; Sumnu, G. Storage and Baking Stability of Encapsulated Sour Cherry Phenolic Compounds Prepared from Micro- and Nano-Suspensions. Food Bioprocess Technol. 2014, 7, 204–211. [Google Scholar] [CrossRef]
  19. Fathordoobady, F.; Jarzębski, M.; Pratap-Singh, A.; Guo, Y.; Abd-Manap, Y. Encapsulation of Betacyanins from the Peel of Red Dragon Fruit (Hylocereus Polyrhizus L.) in Alginate Microbeads. Food Hydrocoll. 2021, 113, 106535. [Google Scholar] [CrossRef]
  20. Şahin, S.; Kurtulbaş, E.; Toprakçı, İ.; Pekel, A.G. A Clean and Green Technology for Oleuropein Rich Extract from Olea Europaea By-Product. Sustain. Chem. Pharm. 2021, 22, 100493. [Google Scholar] [CrossRef]
  21. Toprakçı, G.; Toprakçı, İ.; Şahin, S. Highly Clean Recovery of Natural Antioxidants from Lemon Peels: Lactic Acid-Based Automatic Solvent Extraction. Phytochem. Anal. 2022, 33, 554–563. [Google Scholar] [CrossRef] [PubMed]
  22. Albarri, R.; Şahin, S. A Green Method for the Extraction of Moringa Oleifera Leaves: Evaluation of Several in Vitro Assays for Bioactive Properties. Biomass Convers. Biorefin. 2022. [Google Scholar] [CrossRef]
  23. Wojdyło, A.; Nowicka, P.; Laskowski, P.; Oszmiański, J. Evaluation of Sour Cherry (Prunus Cerasus L.) Fruits for Their Polyphenol Content, Antioxidant Properties, and Nutritional Components. J. Agric. Food Chem. 2014, 62, 12332–12345. [Google Scholar] [CrossRef] [PubMed]
  24. Jaberi, R.; Kaban, G.; Kaya, M. Effects of Some Extraction Parameters on Anthocyanin Content of Barberry (Berberis Vulgaris L.) and Its Antioxidant Activity. Turk. J. Agric. Res. 2022, 9, 41–48. [Google Scholar] [CrossRef]
  25. Toprakçı, İ.; Şahin, S. Encapsulation of Olive Leaf Antioxidants in Microbeads: Application of Alginate and Chitosan as Wall Materials. Sustain. Chem. Pharm. 2022, 27, 100707. [Google Scholar] [CrossRef]
  26. Lee, B.B.; Ravindra, P.; Chan, E.S. Size and Shape of Calcium Alginate Beads Produced by Extrusion Dripping. Chem. Eng. Technol. 2013, 36, 1627–1642. [Google Scholar] [CrossRef]
  27. Gholamian, S.; Nourani, M.; Bakhshi, N. Formation and Characterization of Calcium Alginate Hydrogel Beads Filled with Cumin Seeds Essential Oil. Food Chem. 2021, 338, 128143. [Google Scholar] [CrossRef]
  28. Tolun, A.; Altintas, Z.; Artik, N. Microencapsulation of Grape Polyphenols Using Maltodextrin and Gum Arabic as Two Alternative Coating Materials: Development and Characterization. J. Biotechnol. 2016, 239, 23–33. [Google Scholar] [CrossRef]
  29. Luca, A.; Cilek, B.; Hasirci, V.; Sahin, S.; Sumnu, G. Effect of Degritting of Phenolic Extract from Sour Cherry Pomace on Encapsulation Efficiency-Production of Nano-Suspension. Food Bioprocess Technol. 2013, 6, 2494–2502. [Google Scholar] [CrossRef]
  30. Šaponjac, V.T.; Ćetković, G.; Čanadanović-Brunet, J.; Dilas, S.; Pajin, B.; Petrović, J.; Stajčić, S.; Vulić, J. Encapsulation of Sour Cherry Pomace Extract by Freeze Drying: Characterization and Storage Stability. Acta Chim. Slov. 2017, 64, 283–289. [Google Scholar] [CrossRef]
  31. Oancea, A.M.; Hasan, M.; Vasile, A.M.; Barbu, V.; Enachi, E.; Bahrim, G.; Râpeanu, G.; Silvi, S.; Stănciuc, N. Functional Evaluation of Microencapsulated Anthocyanins from Sour Cherries Skins Extract in Whey Proteins Isolate. LWT 2018, 95, 129–134. [Google Scholar] [CrossRef]
  32. Zam Al, W.; Wissam, Z.; Samer, H. Encapsulation of Flaxseed Oil Extract in Alginate-Salep System by Ionic Gelation. J. Pharm. Sci 2019, 55, 261. [Google Scholar] [CrossRef] [Green Version]
  33. Yousefi, M.; Khanniri, E.; Shadnoush, M.; Khorshidian, N.; Mortazavian, A.M. Development, Characterization and in Vitro Antioxidant Activity of Chitosan-Coated Alginate Microcapsules Entrapping Viola Odorata Linn. Extract. Int. J. Biol. Macromol. 2020, 163, 44–54. [Google Scholar] [CrossRef] [PubMed]
  34. Halder, A.; Maiti, S.; Sa, B. Entrapment Efficiency and Release Characteristics of Polyethyleneimine-Treated or -Untreated Calcium Alginate Beads Loaded with Propranolol–Resin Complex. Int. J. Pharm. 2005, 302, 84–94. [Google Scholar] [CrossRef] [PubMed]
  35. Zam, W.; Bashour, G.; Abdelwahed, W.; Khayata, W. Alginate-Pomegranate Peels’ Polyphenols Beads: Effects of Formulation Parameters on Loading Efficiency. Braz. J. Pharm. Sci. 2014, 50, 741–748. [Google Scholar] [CrossRef] [Green Version]
  36. Moschona, A.; Liakopoulou-Kyriakides, M. Encapsulation of Biological Active Phenolic Compounds Extracted from Wine Wastes in Alginate-Chitosan Microbeads. J. Microencapsul. 2018, 35, 229–240. [Google Scholar] [CrossRef]
  37. Kurtulbaş, E.; Albarri, R.; Torun, M.; Şahin, S. Encapsulation of Moringa Oleifera Leaf Extract in Chitosan-Coated Alginate Microbeads Produced by Ionic Gelation. Food Biosci. 2022, 50, 102158. [Google Scholar] [CrossRef]
  38. Niizawa, I.; Espinaco, B.Y.; Zorrilla, S.E.; Sihufe, G.A. Natural Astaxanthin Encapsulation: Use of Response Surface Methodology for the Design of Alginate Beads. Int. J. Biol. Macromol. 2019, 121, 601–608. [Google Scholar] [CrossRef]
  39. Celli, G.B.; Ghanem, A.; Brooks, M.S.L. Optimized Encapsulation of Anthocyanin-Rich Extract from Haskap Berries (Lonicera Caerulea L.) in Calcium-Alginate Microparticles. J. Berry Res. 2016, 6, 1–11. [Google Scholar] [CrossRef] [Green Version]
  40. Anbinder, P.S.; Deladino, L.; del Navarro, A.S.R.; Amalvy, J.; Martino, M.N. Yerba Mate Extract Encapsulation with Alginate and Chitosan Systems: Interactions between Active Compound Encapsulation Polymers. J. Encapsulation Adsorpt. Sci. 2020, 01, 80–87. [Google Scholar] [CrossRef]
  41. Šumić, Z.; Vakula, A.; Tepić, A.; Čakarević, J.; Vitas, J.; Pavlić, B. Modeling and Optimization of Red Currants Vacuum Drying Process by Response Surface Methodology (RSM). Food Chem. 2016, 203, 465–475. [Google Scholar] [CrossRef] [PubMed]
  42. Arriola, N.D.A.; Chater, P.I.; Wilcox, M.; Lucini, L.; Rocchetti, G.; Dalmina, M.; Pearson, J.P.; de Mello Castanho Amboni, R.D. Encapsulation of Stevia Rebaudiana Bertoni Aqueous Crude Extracts by Ionic Gelation—Effects of Alginate Blends and Gelling Solutions on the Polyphenolic Profile. Food Chem. 2019, 275, 123–134. [Google Scholar] [CrossRef] [PubMed] [Green Version]
  43. Wongverawattanakul, C.; Suklaew, P.; Chusak, C.; Adisakwattana, S.; Thilavech, T. Encapsulation of Mesona Chinensis Benth Extract in Alginate Beads Enhances the Stability and Antioxidant Activity of Polyphenols under Simulated Gastrointestinal Digestion. Foods 2022, 11, 2378. [Google Scholar] [CrossRef] [PubMed]
Figure 1. Effects of calcium chloride concentration to alginate concentration on the (a) encapsulation efficiency and (b) antioxidant activity of the alginate microcapsules containing the active substances from sour cherry peel extract.
Foods 12 00130 g001
Figure 2. Effects of calcium chloride concentration with time on the (a) encapsulation efficiency and (b) antioxidant activity of the alginate microcapsules containing the active substances from sour cherry peel extract.
Foods 12 00130 g002
Figure 3. Effects of alginate concentration with time on the (a) encapsulation efficiency and (b) antioxidant activity of the alginate microcapsules containing active the substances from sour cherry peel extract.
Foods 12 00130 g003
Figure 4. Illustration of Box–Behnken design for the three factors and three levels of the ionic gelation process for response EE (a) and reponse antioxidant activity (b).
Foods 12 00130 g004
Figure 5. Relationship between the actual and predicted data under optimal conditions (7.8% CaCI2, 1.3% alginate, and 26 min) for response EE (a) and reponse antioxidant activity (b).
Foods 12 00130 g005
Figure 6. Microphotograph of the alginate microcapsules.
Foods 12 00130 g006
Figure 7. Scanning electron microscopy images of the alginate microcapsule with a different scale as ×65 (a), ×100 (b) and ×200 (c).
Foods 12 00130 g007
Table 1. Factors for the experimental design of the microencapsulation of the active substances in the sour cherry peels.
Process ParameterUnitSymbolCoded Level
−101
Calcium chloride%, w/vA28.515
Sodium alginate%, w/vB11.52
TimeminC153045
Table 2. Experimental results for the microencapsulation of active substances in sour cherry peels according to Box-Behnken design of RSM.
RunA: Calcium Chloride
(%, w/v)
B: Sodium Alginate
(%, w/v)
C: Time
(min)
TPC
(ppm)
SPC
(ppm)
EE
(%)
Antioxidant Activity
(mg-TEAC/g-DM)
121.5457.93 ± 0.0012.93 ± 0.00163.062.59 ± 0.004
28.5153011.50 ± 0.0022.39 ± 0.00279.193.06 ± 0.001
38.52158.11 ± 0.0011.86 ± 0.00177.092.93 ± 0.001
48.51.53011.14 ± 0.0052.39 ± 0.00378.533.08 ± 0.003
58.51.53010.79 ± 0.0032.21 ± 0.00179.473.26 ± 0.004
621.5157.21 ± 0.0042.04 ± 0.00271.782.70 ± 0.001
78.52456.14 ± 0.0022.21 ± 0.00363.952.50 ± 0.006
822305.61 ± 0.0012.75 ± 0.00150.962.75 ± 0.001
9152304.89 ± 0.0012.75 ± 0.00243.802.91 ± 0.005
108.511513.11 ± 0.0042.39 ± 0.00481.742.75 ± 0.005
11151.5454.36 ± 0.0012.04 ± 0.00353.282.46 ± 0.006
128.51.53010.61 ± 0.0062.75 ± 0.00274.073.02 ± 0.001
131513011.68 ± 0.0014.89 ± 0.00158.102.80 ± 0.001
148.51.53011.32 ± 0.0063.11 ± 0.00272.563.22 ± 0.004
158.514511.86 ± 0.0042.93 ± 0.00175.302.85 ± 0.004
16213010.43 ± 0.0043.64 ± 0.00665.073.00 ± 0.001
17151.5158.82 ± 0.0052.93 ± 0.00166.802.70 ± 0.003
Data are given as the arithmetic mean of the three replicates.
Table 3. ANOVA test for encapsulation efficiency.
SourceSum of SquaresdfMean SquareF-Valuep-Value
Model1944.669216.0724.590.0002significant
A-Calcium chloride104.321104.3211.870.0108
B-Sodium alginate246.651246.6528.070.0011
C-Time218.651218.6524.890.0016
AB0.009510.00950.00110.9746
AC5.7715.770.65670.4444
BC11.21111.211.280.2959
1151.4711151.47131.06<0.0001
139.001139.0015.820.0053
51.72151.725.890.0457
Residual61.5078.79
Lack of Fit20.2336.740.65340.6215not significant
Pure Error41.27410.32
Cor Total2006.1616
C.V.: 4.36%R2 = 0.9693Adjusted R2 = 0.9299Predicted R2 = 0.8065
Table 4. ANOVA test for antioxidant activity.
SourceSum of
Squares
dfMean SquareF-Valuep-Value
Model0.830590.092314.670.0009significant
A-Calcium chloride0.003410.00340.54620.4839
B-Sodium alginate0.013010.01302.070.1931
C-Time0.058310.05839.280.0187
AB0.031810.03185.060.0593
AC0.003910.00390.61370.4591
BC0.070310.070311.170.0124
0.172610.172627.450.0012
0.015310.01532.440.1624
0.413710.413765.79<0.0001
Residual0.044070.0063
Lack of Fit0.001230.00040.03640.9893not significant
Pure Error0.042940.0107
Cor Total0.874616
C.V.: 2.78%R2 = 0.9497Adjusted R2 = 0.8849Predicted R2 = 0.9020
Table 5. Optimum conditions (desirability = 0.89) with the maximum predicted and experimental yields.
A
(%, w/v)
B
(%, w/v)
C
(min)
ResponsePredictedExperimentalError (%)
7.8361.33226.304EE79.50778.1251.74
antioxidant activity3.1283.0791.57
Disclaimer/Publisher’s Note: The statements, opinions and data contained in all publications are solely those of the individual author(s) and contributor(s) and not of MDPI and/or the editor(s). MDPI and/or the editor(s) disclaim responsibility for any injury to people or property resulting from any ideas, methods, instructions or products referred to in the content.

