
Fast Chromatographic Determination of Free Amino Acids in Bee Pollen
 , , ,
, , ,
Abstract
:
1. Introduction
2. Materials and Methods
2.1. Chemical and Materials
2.2. Standards
2.3. Sample Procurement and Treatment
2.3.1. Samples
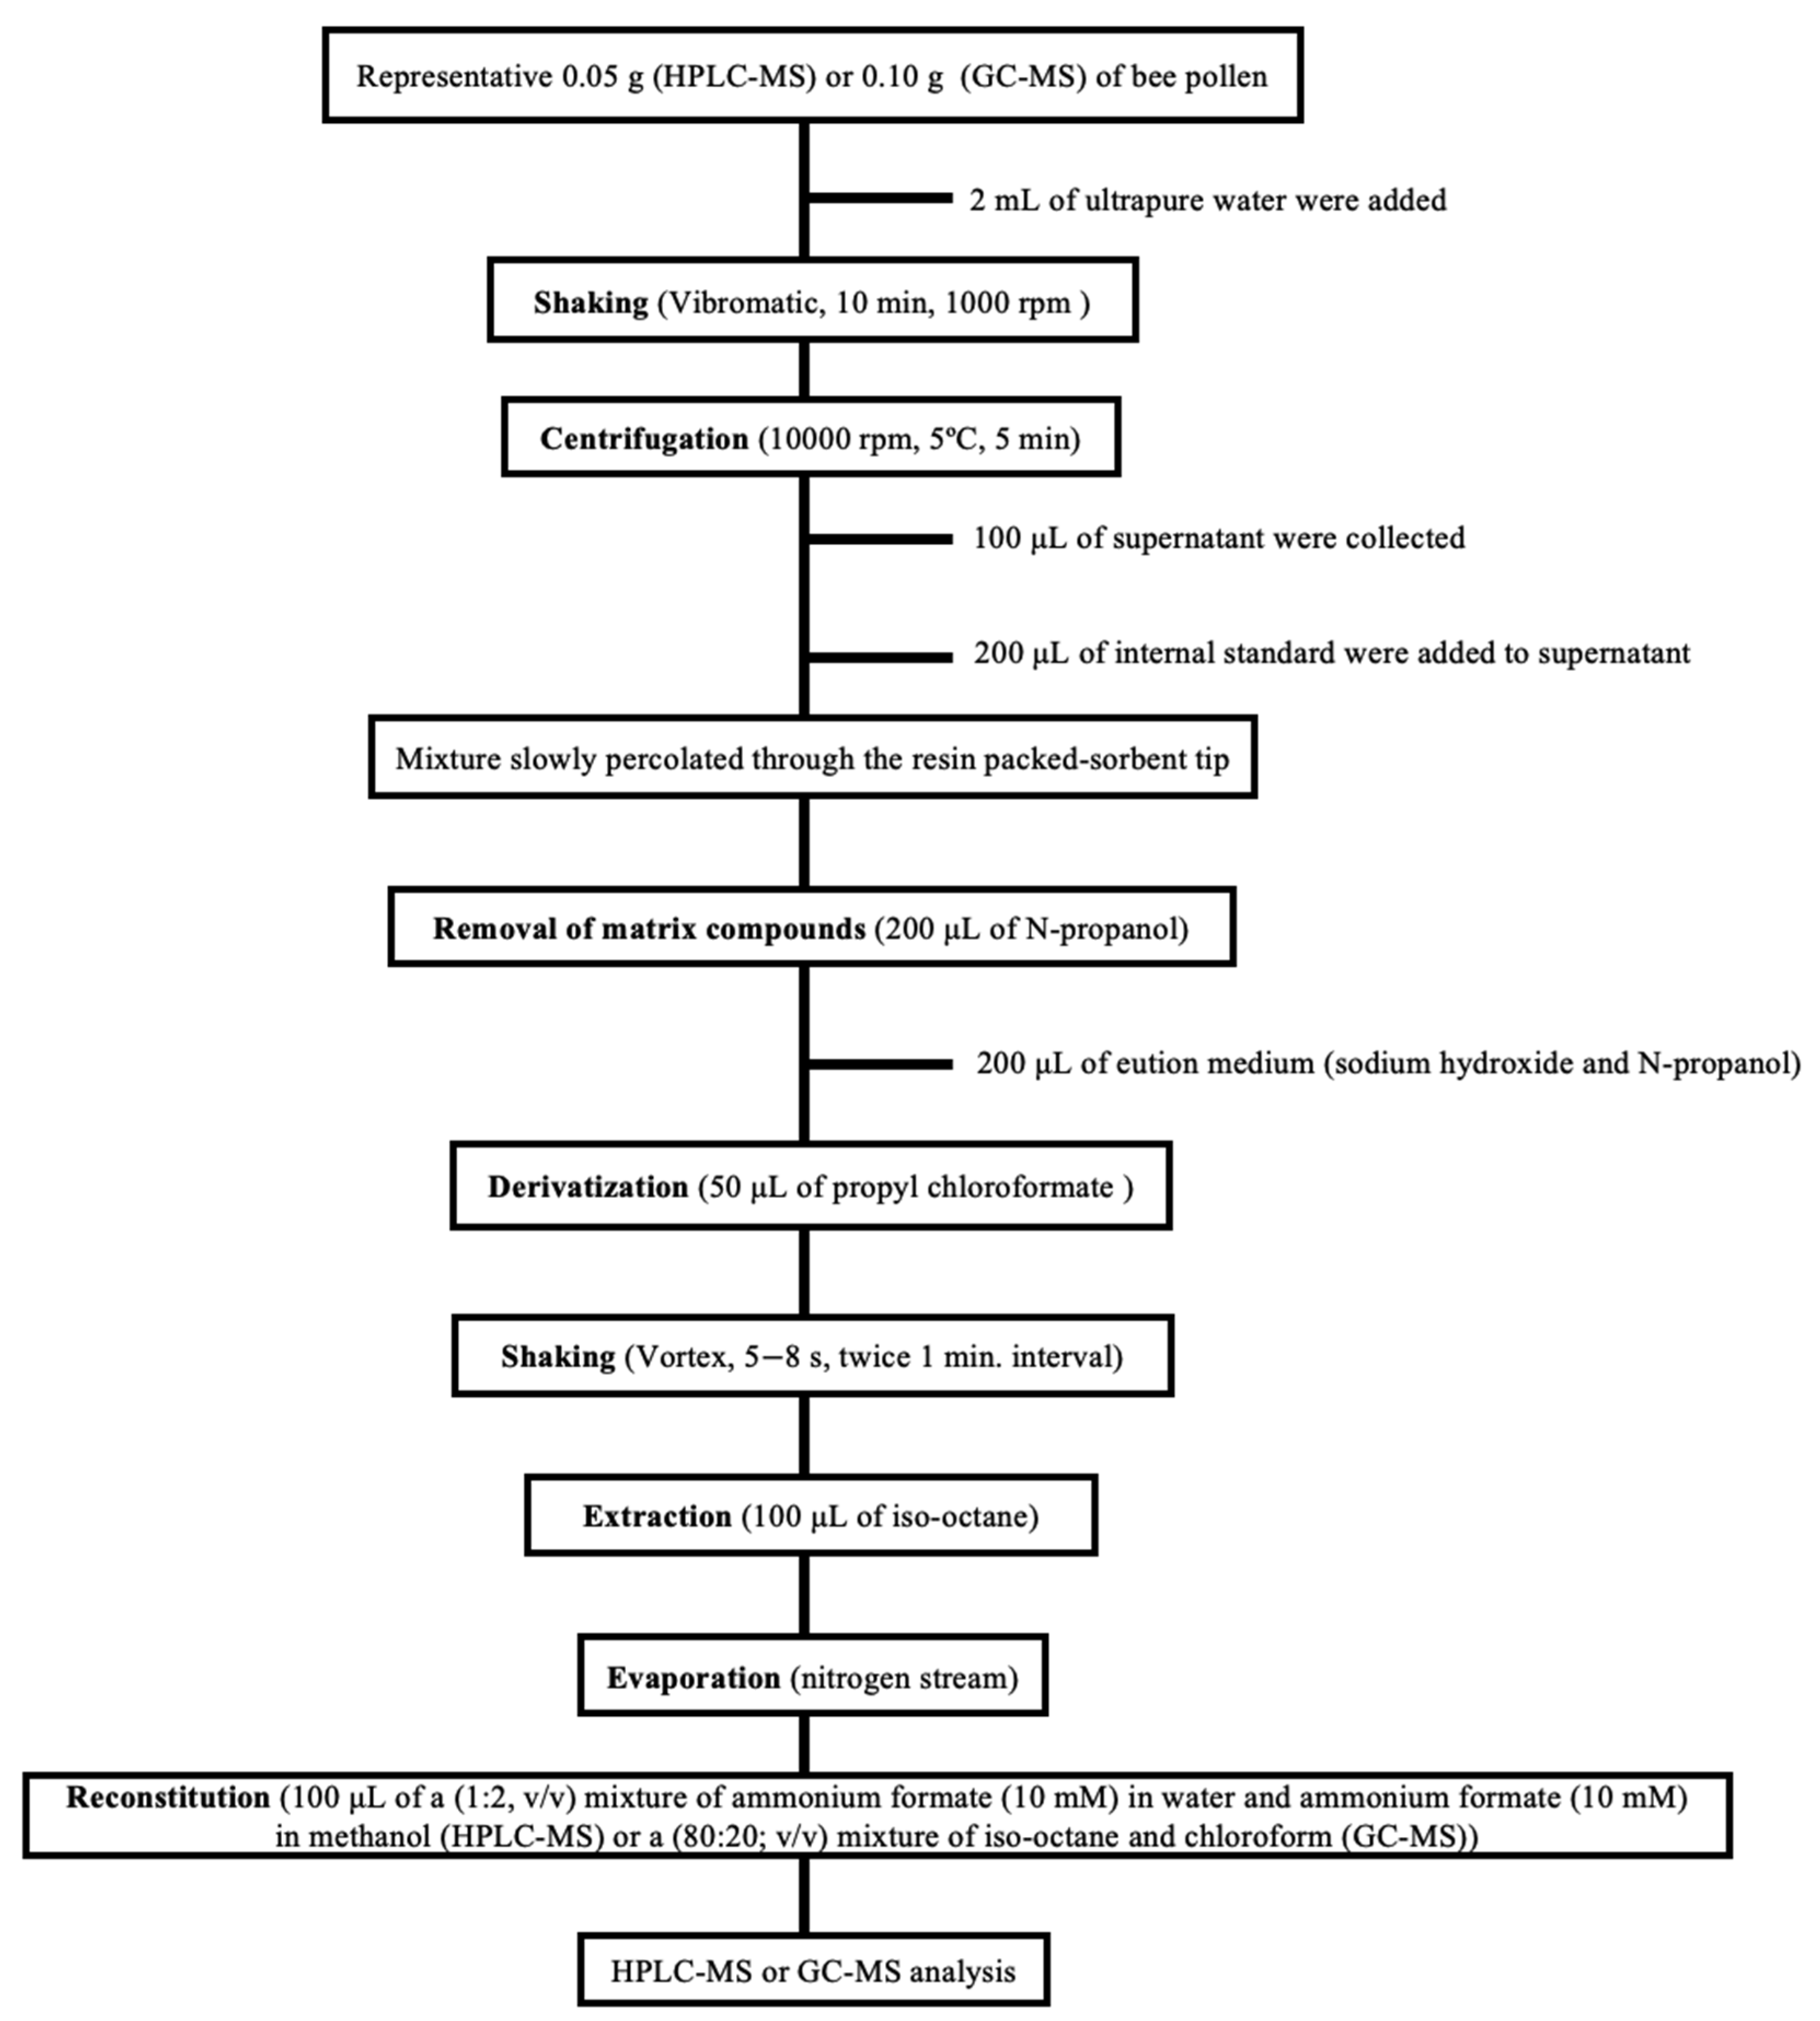
2.3.2. Sample Treatment
2.4. Chromatographic Systems
2.4.1. GC-MS Conditions
2.4.2. HPLC-MS Conditions
2.5. Statistical Analysis
3. Results and Discussion
3.1. Chromatographic Methods
3.1.1. Optimization of the Methods
3.1.2. Analytical Performance of the Methods
3.1.3. Comparison of the Methods
3.2. Analysis of Bee Pollen Samples
3.2.1. Free Amino Acid Content
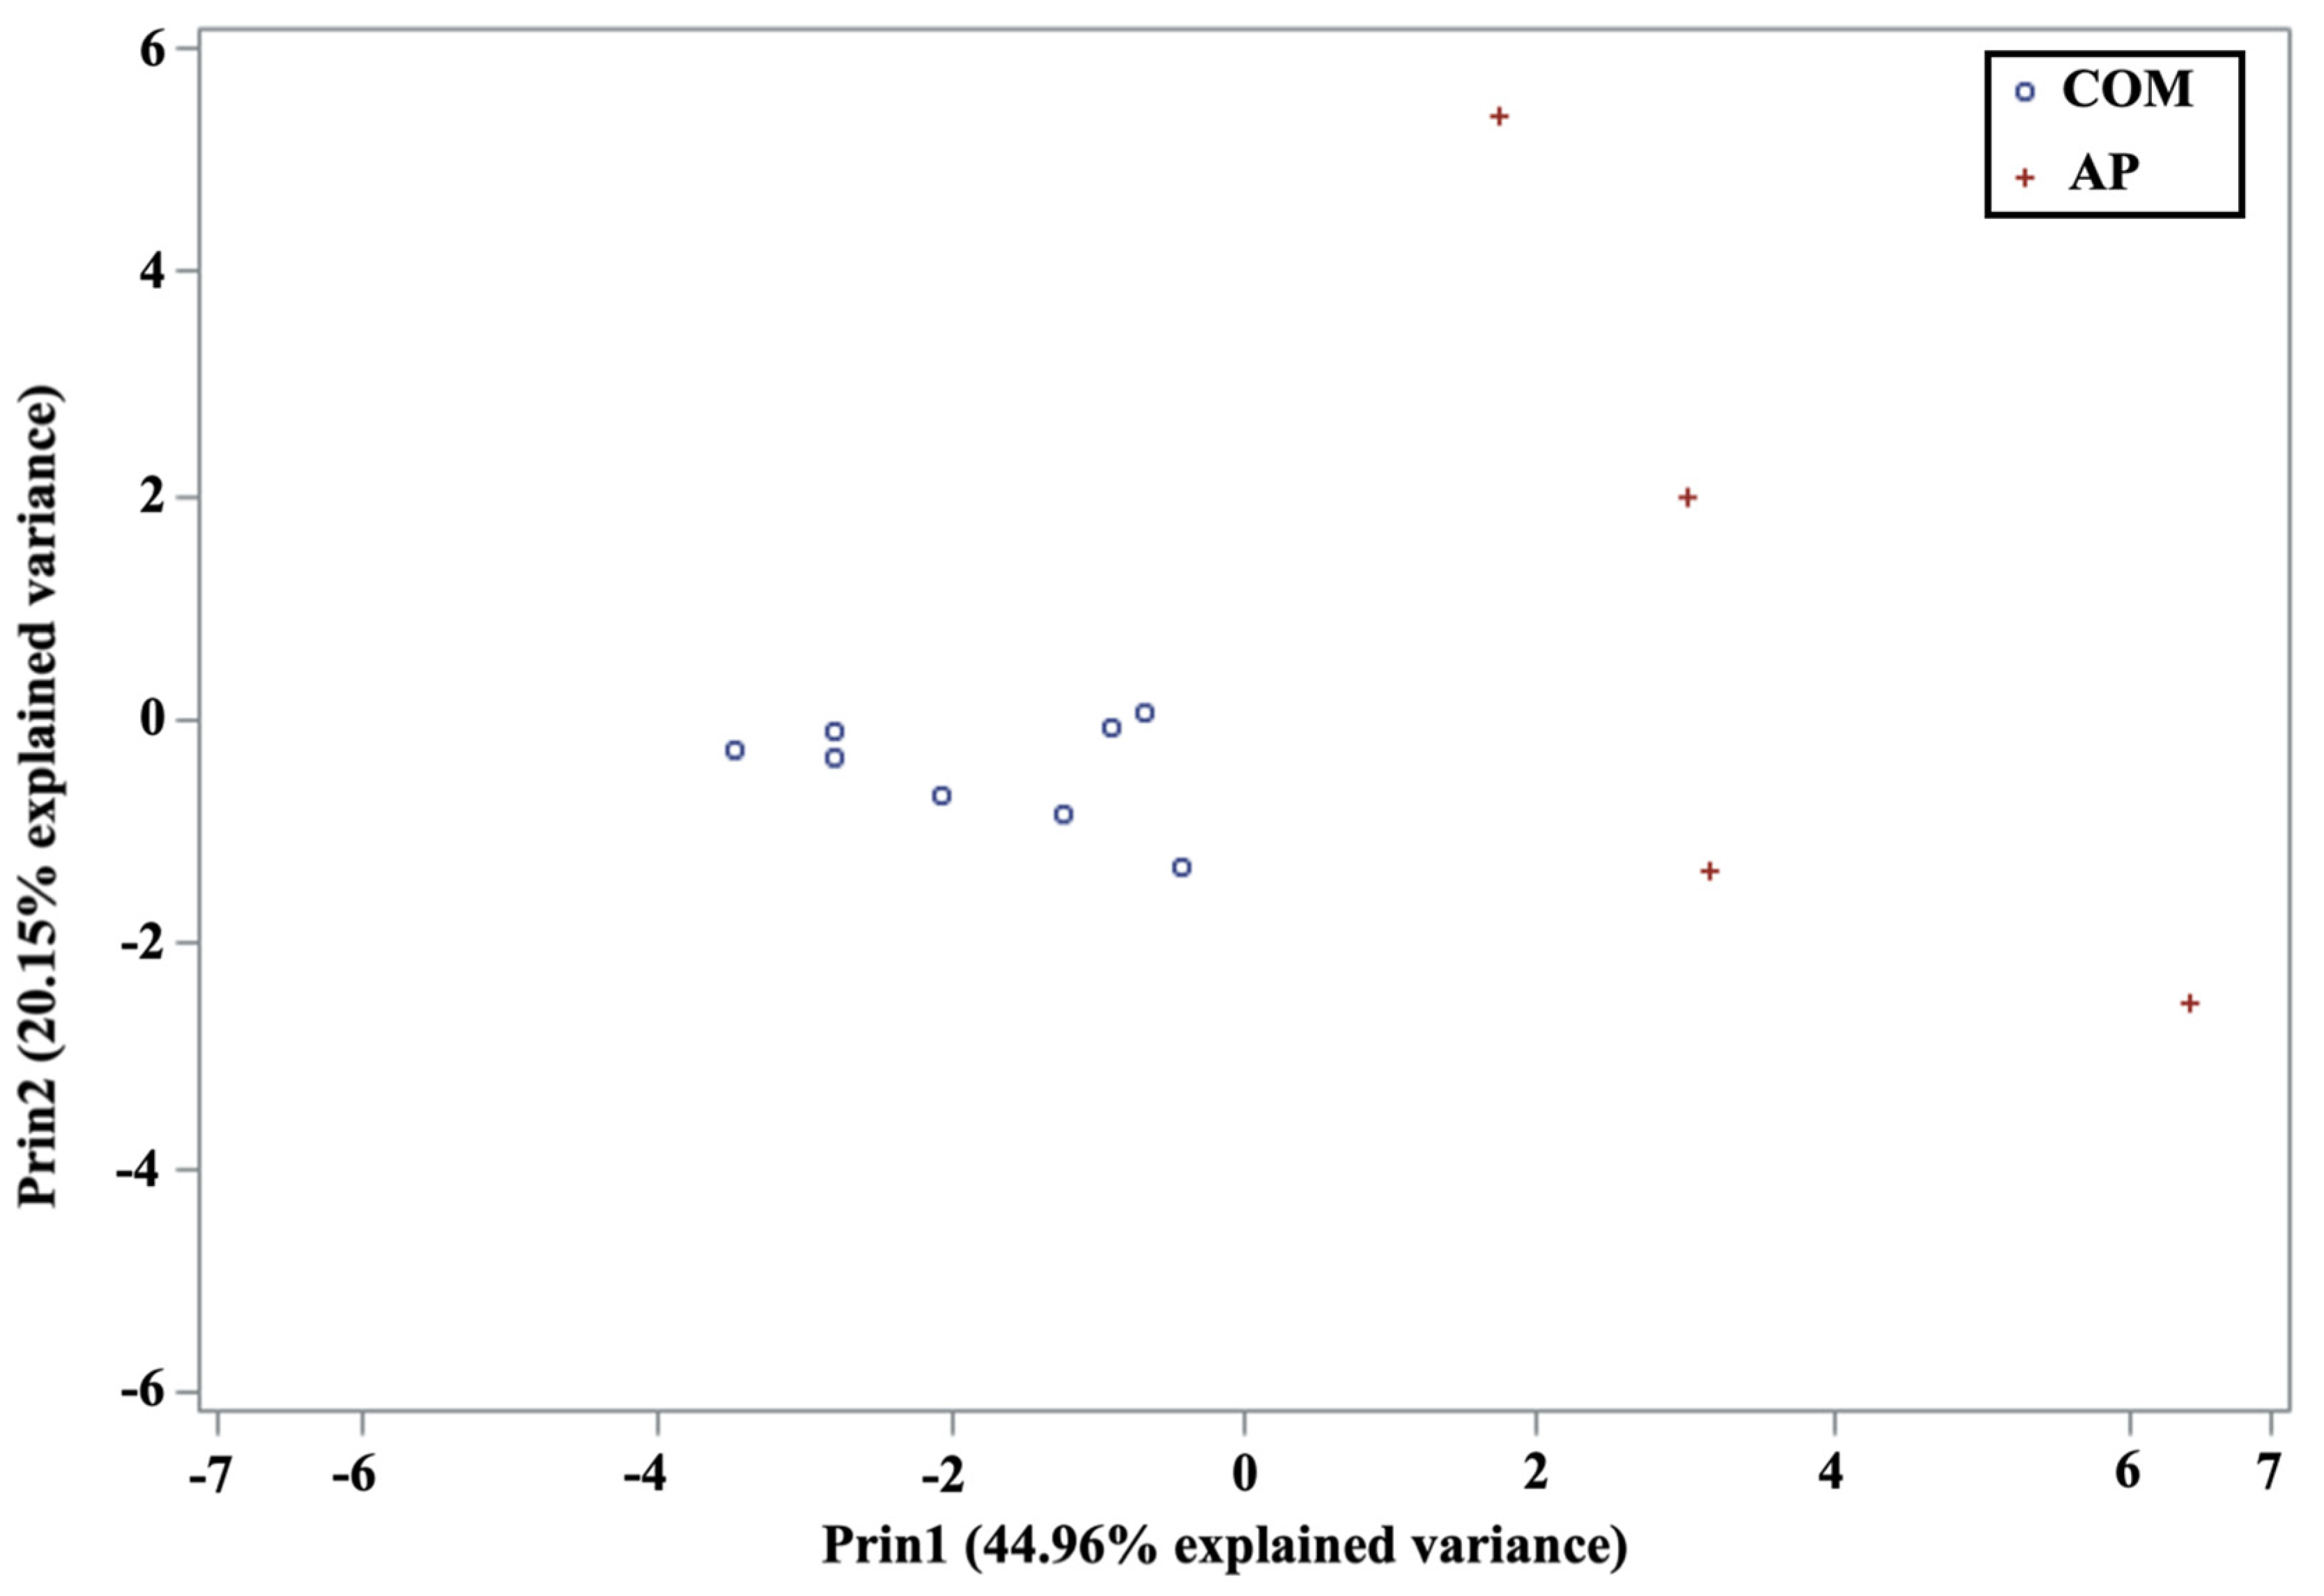
3.2.2. Statistical Analysis
4. Conclusions
Supplementary Materials
Author Contributions
Funding
Institutional Review Board Statement
Data Availability Statement
Acknowledgments
Conflicts of Interest
References
- Luo, X.; Dong, Y.; Gu, C.; Zhang, X.; Ma, H. Processing Techsnologies for bee products: An overview of recent developments and perspectives. Front. Nutr. 2021, 8, 727181. [Google Scholar] [CrossRef]
- Ares, A.M.; Valverde, S.; Bernal, J.L.; Nozal, M.J. Extraction and determination of bioactive compounds from bee pollen. J. Pharm. Biomed. Anal. 2018, 147, 110–124. [Google Scholar] [CrossRef]
- Gonçalves, A.C.; Lahlou, R.A.; Alves, G.; Garcia-Viguera, C.; Moreno, D.A.; Silva, L.R. Potential Activity of Abrantes Pollen Extract: Biochemical and Cellular Model Studies. Foods 2021, 10, 2804. [Google Scholar] [CrossRef]
- Lu, P.; Takiguchi, S.; Honda, Y.; Lu, Y.; Mitsui, T.; Kato, S.; Kodera, R.; Furihata, K.; Zhang, M.; Okamoto, K.; et al. NMR and HPLC profiling of bee pollen products from different countries. Food Chem. Mol. Sci. 2022, 5, 100119. [Google Scholar] [CrossRef]
- Ares, A.M.; Toribio, L.; Tapia, J.A.; González-Porto, A.V.; Higes, M.; Martín-Hernández, R.; Bernal, J. Differentiation of bee pollen samples according to the apiary of origin and harvesting period based on their amino acid content. Food Biosci. 2022, 50, 102092. [Google Scholar] [CrossRef]
- Conte, G.; Benelli, G.; Serra, A.; Signorini, F.; Bientinesi, M.; Nicolella, C.; Mele, M.; Canale, A. Lipid characterization of chestnut and willow honeybee-collected pollen: Impact of freeze-drying and microwave-assisted drying. J. Food Compos. Anal. 2017, 55, 12–19. [Google Scholar] [CrossRef]
- Wang, Z.; Ren, P.; Wu, Y.; He, Q. Recent advances in analytical techniques for the detection of adulteration and authenticity of bee products—A review. Food Addit. Contam. Part A 2021, 38, 533–549. [Google Scholar] [CrossRef]
- Trifković, J.; Andric, F.; Ristivojević, P.; Guzelmeric, E.; Yesilada, E. Analytical Methods in Tracing Honey Authenticity. J. AOAC Int. 2017, 100, 827–839. [Google Scholar] [CrossRef]
- Hsu, P.-S.; Wu, T.-H.; Huang, M.-Y.; Wang, D.-Y.; Wu, M.-C. Nutritive Value of 11 Bee Pollen Samples from Major Floral Sources in Taiwan. Foods 2021, 10, 2229. [Google Scholar] [CrossRef]
- Gardana, C.; Del Bo’, C.; Quicazán, M.C.; Corrrea, A.R.; Simonetti, P. Nutrients, phytochemicals and botanical origin of commercial bee pollen from different geographical areas. J. Food Compos. Anal. 2018, 73, 29–38. [Google Scholar] [CrossRef]
- Prđun, S.; Svečnjak, L.; Valentić, M.; Marijanović, Z.; Jerković, I. Characterization of bee pollen: Physico-chemical properties, headspace composition and FTIR spectral profiles. Foods 2021, 10, 2103. [Google Scholar] [CrossRef] [PubMed]
- Taha, E.-K. Chemical Composition and Amounts of Mineral Elements in Honeybee-Collected Pollen in Relation to Botanical Origin. J. Apic. Sci. 2015, 59, 75–81. [Google Scholar] [CrossRef]
- Kaškonienė, V.; Ruočkuvienė, G.; Kaškonas, P.; Akuneca, I.; Maruška, A. Chemometric analysis of bee pollen based on volatile and phenolic compound compositions and antioxidant properties. Food Anal. Methods 2015, 8, 1150–1163. [Google Scholar] [CrossRef]
- Zhou, J.; Qi, Y.; Ritho, J.; Zhang, Y.; Zheng, X.; Wu, L.; Li, Y.; Sun, L. Flavonoid glycosides as floral origin markers to discriminate of unifloral bee pollen by LC-MS/MS. Food Control 2015, 57, 54–61. [Google Scholar] [CrossRef]
- Ares, A.M.; Tapia, J.A.; González-Porto, A.V.; Higes, M.; Martín-Hernández, R.; Bernal, J. Glucosinolates as markers of the origin and harvesting period for discrimination of bee pollen by UPLC-MS/MS. Foods 2022, 11, 1446. [Google Scholar] [CrossRef] [PubMed]
- Ares, A.M.; Martin, M.T.; Tapia, J.A.; González-Porto, A.V.; Higes, M.; Martín-Hernández, R.; Bernal, J. Differentiation of bee pollen samples according to the betaines and other quaternary ammonium related compounds by using a canonical discriminant analysis. Food Res. Int. 2022, 160, 111698. [Google Scholar] [CrossRef]
- Themelis, T.; Gotti, R.; Orlandini, S.; Gatti, R. Quantitative amino acids profileof monofloral bee pollens by microwave hydrolysis and fluorimetric high performance liquid chromatography. J. Pharm. Biomed. Anal. 2019, 173, 144–153. [Google Scholar] [CrossRef]
- Oroian, M.; Dranca, F.; Ursachi, F. Characterization of Romanian bee pollen—an important nutritional source. Foods 2022, 11, 2633. [Google Scholar] [CrossRef]
- Nikkeshi, A.; Kuramitsu, K.; Yokoi, T.; Yamaji, K. Simple methods of analyzing proteins and amino acids in small pollen samples. J. Apic. Res. 2021, 61, 107–113. [Google Scholar] [CrossRef]
- Axelrod, K.; Samburova, V.; Khlystov, A.Y. Relative abundance of saccharides, free amino acids, and other compounds in specific pollen species for source profiling of atmospheric aerosol. Sci. Total Environ. 2021, 799, 149254. [Google Scholar] [CrossRef]
- Yang, K.; Wu, D.; Ye, X.; Liu, D.; Chen, J.; Sun, P. Characterization of chemical composition of bee pollen in China. J. Agric. Food Chem. 2013, 61, 708–718. [Google Scholar] [CrossRef] [PubMed]
- Bayram, N.E.; Gercek, Y.C.; Çelik, S.; Mayda, N.; Kostić, A.; Dramićanin, A.M.; Özkök, A. Phenolic and free amino acid profiles of bee bread and bee pollen with the same botanical origin—similarities and differences. Arab. J. Chem. 2021, 14, 103004. [Google Scholar] [CrossRef]
- Badawy, A.B. The EZ:Faast Family of Amino Acid Analysis Kits: Application of the GC-FID Kit for Rapid Determination of Plasma Tryptophan and Other Amino Acids. In Amino Acid Analysis: Methods and Protocols, 2nd ed.; Alterman, M.A., Ed.; Humana Press: Totowa, NJ, USA, 2019; pp. 119–130. [Google Scholar]
- Azevedo, M.S.; Seraglio, S.K.T.; Rocha, G.; Balderas, C.B.; Piovezan, M.; Gonzaga, L.V.; Falkenberg, D.D.B.; Fett, R.; de Oliveira, M.A.L.; Costa, A.C.O. Free amino acid determination by GC-MS combined with a chemometric approach for geographical classification of bracatinga honeydew honey (Mimosa scabrella Bentham). Food Control. 2017, 78, 383–392. [Google Scholar] [CrossRef]
- Jolliffe, I.T.; Cadima, J. Principal component analysis: A review and recent developments. Philos. Trans. R. Soc. A Math. Phys. Eng. Sci. 2016, 374, 20150202. [Google Scholar] [CrossRef] [Green Version]
- Ares, A.M.; Martín, M.T.; Toribio, L.; Bernal, J. Determination of Free Amino Acids in Bee Pollen by Liquid Chromatography with Fluorescence Detection. Food Anal. Methods 2022, 15, 2172–2180. [Google Scholar] [CrossRef]
- EURACHEM Guide: The Fitness for Purpose of Analytical Methods—A Laboratory Guide to Method Validation and Related Topics. 2014. Available online: https://www.eurachem.org/images/stories/Guides/pdf/MV_guide_2nd_ed_EN.pdf (accessed on 7 December 2022).
- Korus, A. Amino Acid retention and protein quality in dried kale (Brassica oleracea L. var. acephala). J. Food Process. Preserv. 2014, 38, 676–683. [Google Scholar] [CrossRef]
- De Arruda, V.A.S.; Pereira, A.A.S.; Estevinho, L.M.; de Almeida-Muradian, L.B. Presence and stability of B complex vitamins in bee pollen using different storage conditions. Food Chem. Toxicol. 2013, 51, 143–148. [Google Scholar] [CrossRef]
- Muniategui, S.; Sancho, M.T.; Huidobro, J.F.; Simal, J. Evaluation of freshness of commercial bee-collected pollen. Rev. Agroquím. Tecnol. Aliment. 1991, 31, 265–271. [Google Scholar]


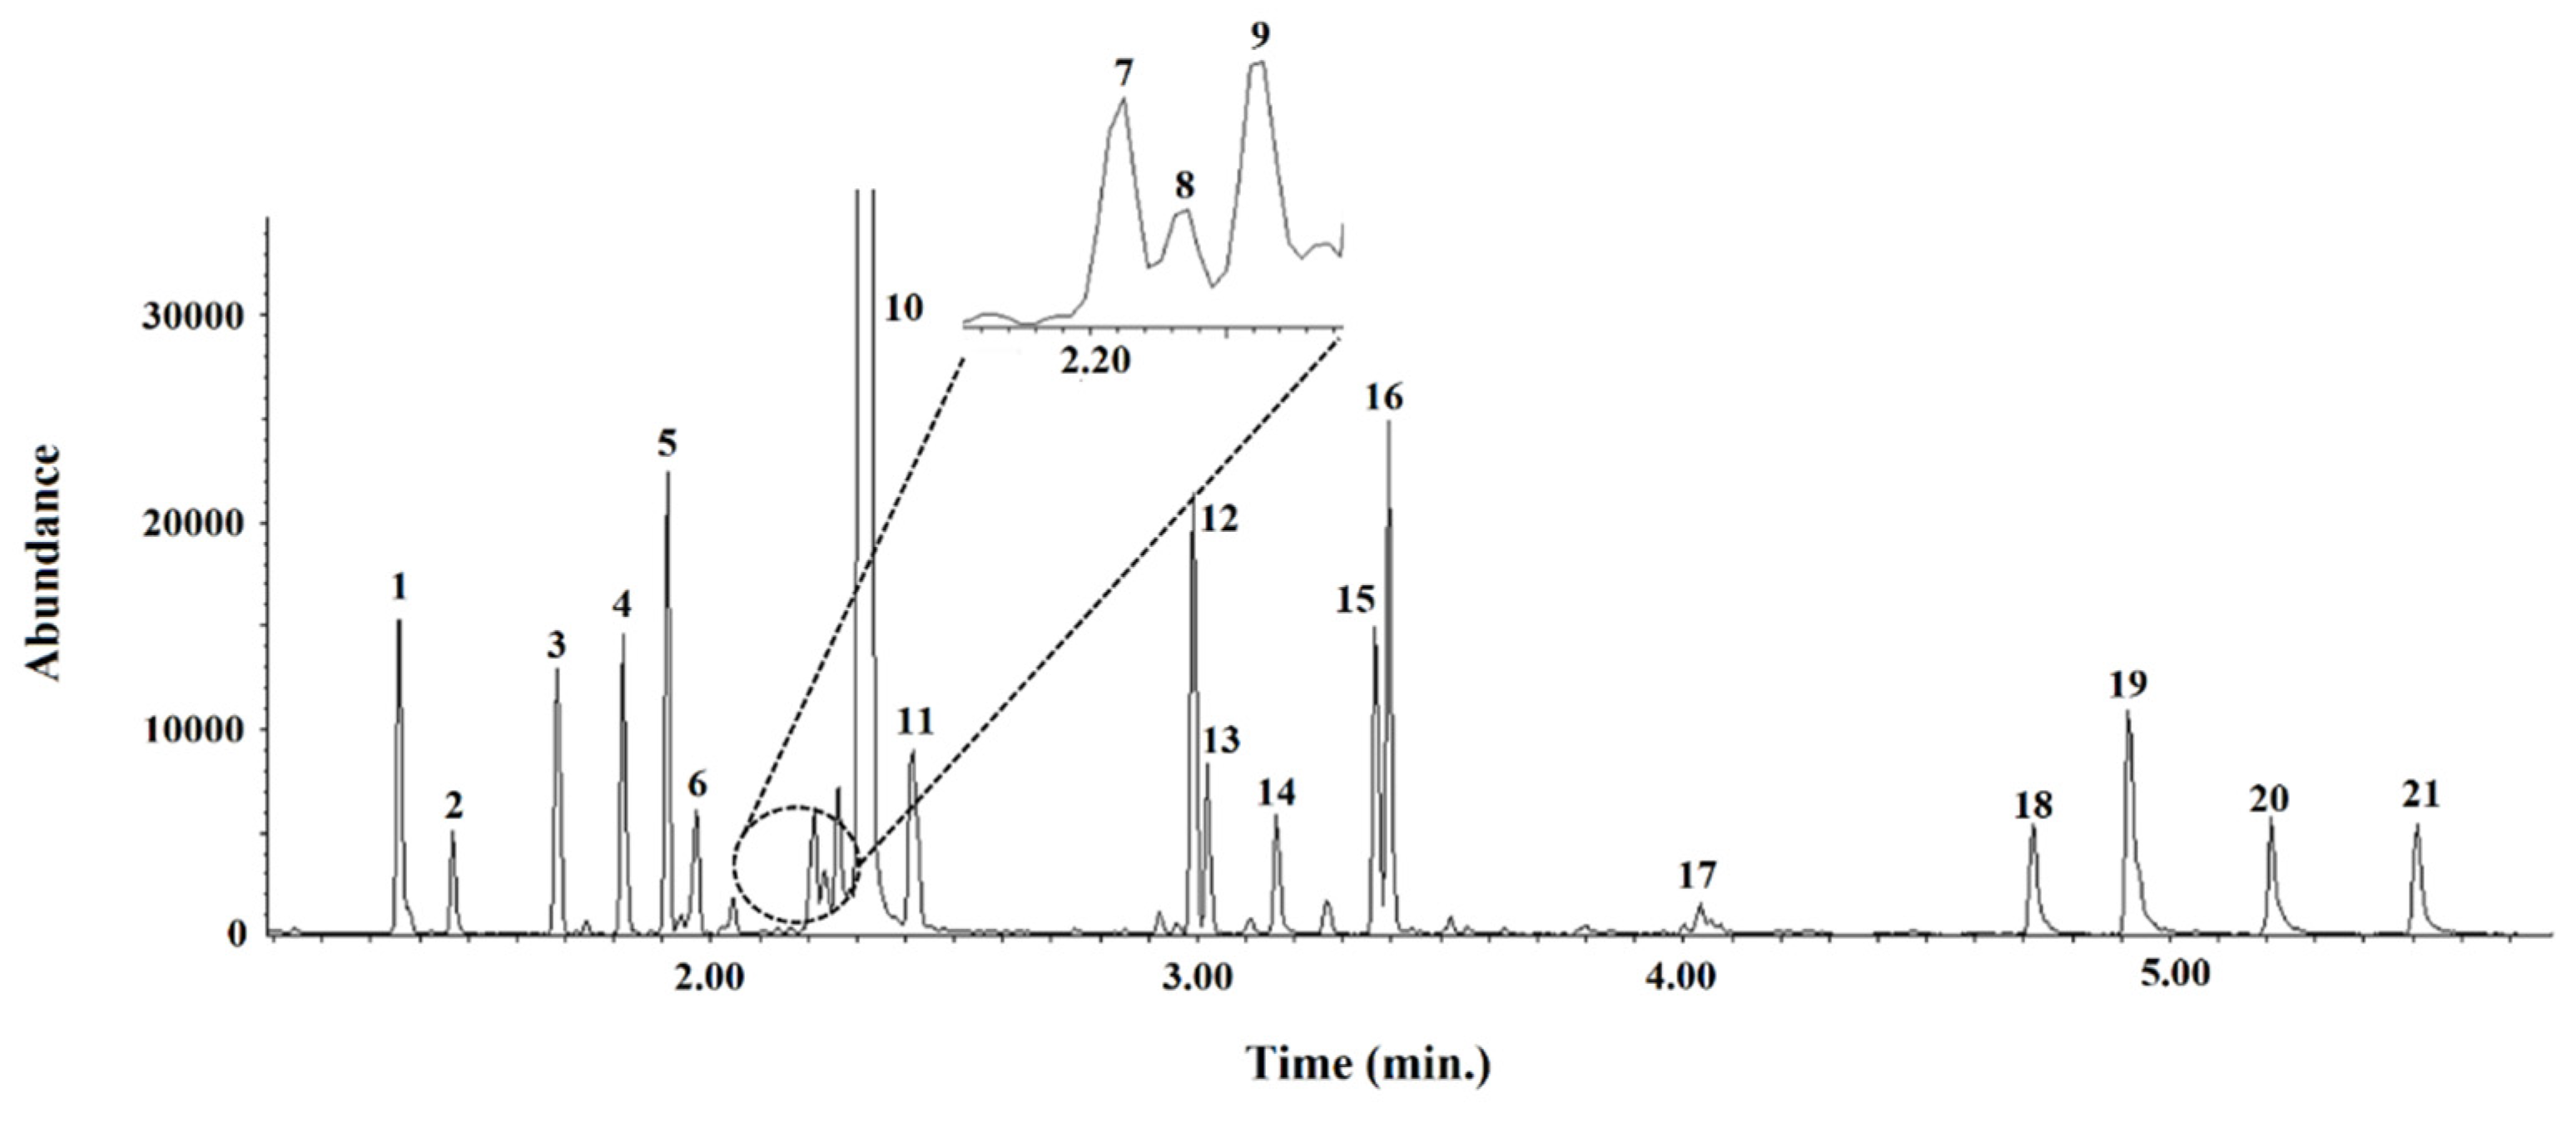
| Amino Acid (Abbreviation) | Retention Time (min) | Ions (m/z) | LOQ (mg/kg) |
|---|---|---|---|
| Alanine (ALA) | 1.36 | 130 Q,C, 158 C, 88 C | 5 |
| Glycine (GLY) | 1.47 | 116 Q,C, 162 C, 102 C | 7 |
| Valine (VAL) | 1.69 | 158 Q,C, 116 C, 72 C | 4 |
| Norvaline (NVAL; IS) | 1.82 | 158 Q,C, 116 C, 72 C | NE |
| Leucine (LEU) | 1.92 | 172 Q,C, 130 C, 86 C | 3 |
| Isoleucine (ILE) | 1.98 | 172 Q,C, 130 C, 101 C | 5 |
| Threonine (THR) | 2.21 | 101 Q,C, 160 C, 74 C | 7 |
| γ-Amino-n-butyric acid (GABA) | 2.23 | 144 Q,C, 172 C, 130 C | 18 |
| Serine (SER) | 2.26 | 146 Q,C, 203 C, 60 C | 8 |
| Proline (PRO) | 2.33 | 156 Q,C, 243 C, 70 C | 15 |
| Asparagine (ASN) | 2.42 | 69 Q,C, 155 C, 141 C | 75 |
| Aspartic acid (ASP) | 3.00 | 216 Q,C, 130 C, 88 C | 5 |
| Methionine (MET) | 3.03 | 101 Q,C, 277 C, 203 C | 5 |
| Hydroxyproline (HYP) | 3.17 | 172 Q,C, 86 C, 68 C | 15 |
| Glutamic acid (GLU) | 3.37 | 230 Q,C, 170 C, 84 C | 25 |
| Phenylalanine (PHE) | 3.40 | 148 Q,C, 206 C, 190 C | 3 |
| Glutamine (GLN) | 4.08 | 84 Q,C, 187 C, 112 C | 11 |
| Lysine (LYS) | 4.73 | 170 Q,C, 153 C, 128 C | 4 |
| Histidine (HIS) | 4.92 | 81 Q,C, 282 C, 168 C | 40 |
| Tyrosine (TYR) | 5.22 | 107 Q,C, 206 C, 164 C | 3 |
| Tryptophan (TRP) | 5.52 | 130 Q,C, 332 C, 229 C | 19 |
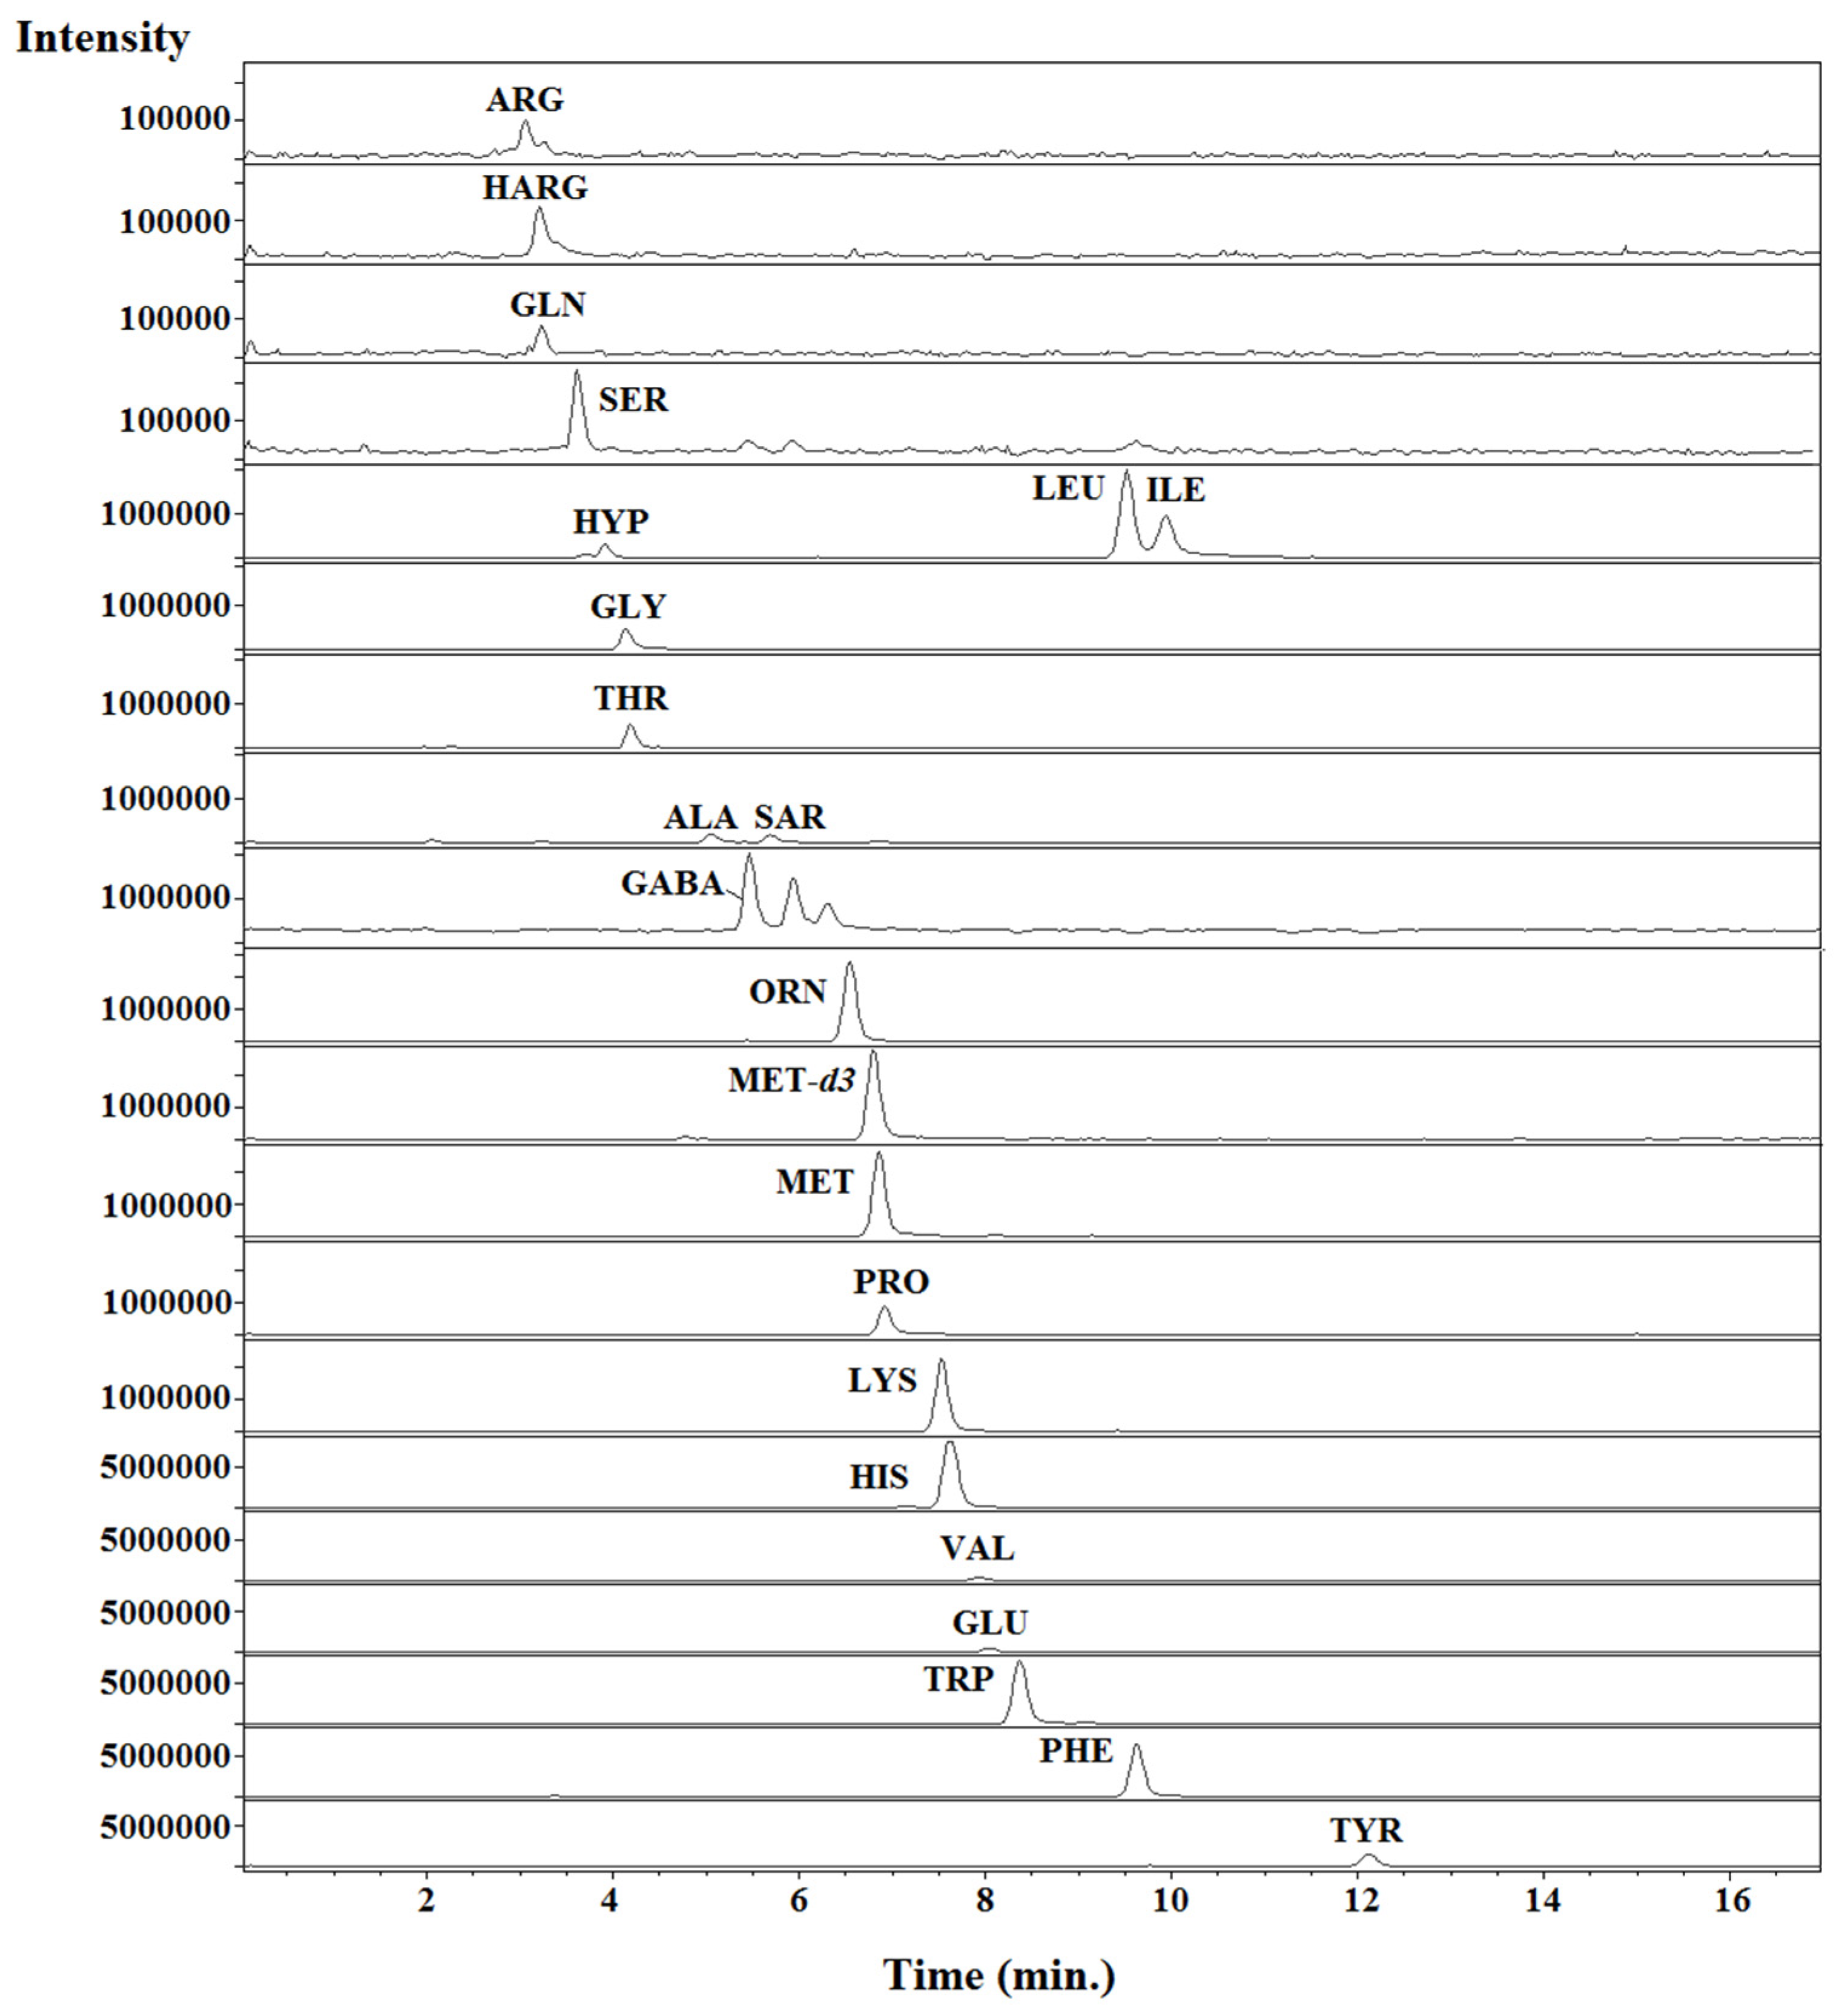
| Amino Acid (Abbreviation) | Retention Time (min) | Ions (m/z) | LOQ (mg/kg) |
|---|---|---|---|
| Arginine (ARG) | 3.09 | 303 Q,C, 70 C, 156 C | 270 |
| Homoarginine (HARG; IS) | 3.25 | 317 Q,C, 128 C, 84 C | NE |
| Glutamine (GLN) | 3.22 | 275 Q,C, 172 C, 84 C | 130 |
| Serine (SER) | 3.60 | 234 Q,C, 174 C, 146 C | 20 |
| Asparagine (ASN) | 3.72 | 243 Q,C, 157 C, 115 C | 210 |
| Hydroxyproline (HYP) | 3.90 | 260 Q,C, 172 C, 157 C | 160 |
| Glycine (GLY) | 4.10 | 204 Q,C, 248 C, 144 C | 40 |
| Threonine (THR) | 4.20 | 248 Q,C, 188 C, 160 C | 100 |
| Alanine (ALA) | 5.07 | 218 Q,C, 158 C, 130 C | 9 |
| γ-Amino-n-butyric acid (GABA) | 5.49 | 232 Q,C, 172 C, 130 C | 10 |
| Sarcosine (SAR) | 5.70 | 218 Q,C, 158 C, 88 C | 40 |
| Ornithine (ORN) | 6.50 | 347 Q,C, 287 C, 156 C | 15 |
| Methionine-d3 (MET-d3; IS) | 6.80 | 281 Q,C, 221 C, 193 C | NE |
| Methionine (MET) | 6.88 | 278 Q,C, 218 C, 190 C | 50 |
| Proline (PRO) | 6.95 | 244 Q,C, 184 C, 156 C | 8 |
| Lysine (LYS) | 7.55 | 361 Q,C, 301 C, 170 C | 65 |
| Aspartic acid (ASP) | 7.57 | 304 Q,C, 216 C, 130 C | 35 |
| Histidine (HIS) | 7.60 | 370 Q,C, 196 C, 110 C | 17 |
| Valine (VAL) | 7.96 | 246 Q,C, 158 C, 116 C | 80 |
| Glutamic acid (GLU) | 8.06 | 318 Q,C, 258 C, 172 C | 16 |
| Tryptophan (TRP) | 8.46 | 333 Q,C, 273 C, 245 C | 20 |
| Leucine (LEU) | 9.50 | 260 Q,C, 172 C, 74 C | 16 |
| Phenylalanine (PHE) | 9.68 | 294 Q,C, 206 C, 120 C | 45 |
| Isoleucine (ILE) | 9.95 | 260 Q,C, 172 C, 74 C | 96 |
| Tyrosine (TYR) | 12.25 | 396 Q,C, 308 C, 136 C | 48 |
| GC-MS Parameter | Final Setting |
|---|---|
| Programmed temperature conditions | from 110 °C to 320 °C (0 min), at 30 °C/min |
| Carrier gas | Helium |
| Flow-rate (mL/min) | 1.1 |
| Injector temperature | 250 |
| Injection volume (L) | 2 |
| Injection mode | Splitless |
| MS operating mode | Electron impact |
| Scan range (m/z) | 50–450 |
| MS temperatures | ion source 240 °C, quadrupole 180 °C, and auxiliary 310 °C |
| HPLC-MS parameter | Final setting |
| Gradient elution mode | Ammonium formate (10 mM) in water (A) and ammonium formate (10 mM) in methanol (B): (i) 0.00 min (A:B, 32:68, v/v); (ii) 13.00 min (A:B, 17:83, v/v); (iii) 13.01 min (A:B, 32:68, v/v); (iv) 17.00 min (A:B, 32:68, v/v) |
| Flow-rate (mL/min) | 0.5 |
| Injection volume ((L) | 5 |
| Temperature (°C) | 35 |
| MS Ionization source | ESI |
| Scan range (m/z) | 60–600 |
| Capillary voltage (V) | 3500 |
| Fragmentor voltage (V) | 60 |
| Drying gas (N2) flow (L/min) | 8 |
| Drying gas (N2) temperature (°C) | 325 |
| Nebulizer gas pressure (psi) | 40 |
| Amino Acid | GC-MS | HPLC-MS | ||||
|---|---|---|---|---|---|---|
| SCI (SS) | SCI (MMS) | ME * | SCI (SS) | SCI (MMS) | ME * | |
| ALA | 0.073–0.078 | 0.058–0.078 | −11 | 0.005–0.008 | 0.020–0.047 | 80 |
| ARG | NE | NE | NE | 0.001–0.015 | 0.002–0.017 | 16 |
| ASN | 0.024–0.028 | 0.019–0.025 | −18 | 0.001–0.003 | 0.001–0.003 | 4 |
| ASP | 0.039–0.044 | 0.042–0.045 | 5 | 0.023–0.032 | 0.021–0.032 | 4 |
| GABA | 0.003–0.004 | 0.002–0.004 | −16 | 0.001–0.009 | 0.001–0.011 | 16 |
| GLN | 0.008–0.011 | 0.017–0.020 | 48 | 0.001–0.019 | 0.001–0.024 | 19 |
| GLU | 0.006–0.010 | 0.006–0.012 | 11 | 0.001–0.021 | 0.001–0.025 | 16 |
| GLY | 0.048–0.064 | 0.048–0.059 | −4 | 0.006–0.011 | 0.012–0.036 | 64 |
| HIS | 0.006–0.007 | 0.007–0.010 | 23 | 0.071–0.087 | 0.061–0.069 | −22 |
| HYP | 0.043–0.047 | 0.037–0.044 | −11 | 0.001–0.004 | 0.001–0.005 | 16 |
| ILE | 0.016–0.023 | 0.011–0.014 | −56 | 0.035–0.038 | 0.018–0.019 | −97 |
| LEU | 0.059–0.073 | 0.034–0.041 | −76 | 0.077–0.079 | 0.055–0.069 | −26 |
| LYS | 0.010–0.023 | 0.024–0.026 | 34 | 0.001–0.024 | 0.041–0.046 | 71 |
| MET | 0.017–0.019 | 0.014–0.018 | −12 | 0.027–0.040 | 0.024–0.027 | −31 |
| ORN | NE | NE | NE | 0.002–0.022 | 0.053–0.093 | 84 |
| PHE | 0.006–0.007 | 0.019–0.026 | 71 | 0.025–0.036 | 0.029–0.037 | 9 |
| PRO | 0.063–0.068 | 0.012–0.043 | −138 | 0.095–0.110 | 0.075–0.090 | −24 |
| SAR | NE | NE | NE | 0.024–0.029 | 0.030–0.045 | 29 |
| SER | 0.015–0.020 | 0.014–0.016 | −16 | 0.002–0.003 | 0.006–0.011 | 70 |
| THR | 0.033–0.039 | 0.033–0.036 | −4 | 0.005–0.017 | 0.004–0.015 | −15 |
| TRP | 0.081–0.090 | 0.086–0.111 | 12 | 0.003–0.018 | 0.038–0.052 | 77 |
| TYR | 0.005–0.006 | 0.045–0.062 | 88 | 0.003–0.020 | 0.011–0.015 | −11 |
| VAL | 0.033–0.040 | 0.029–0.040 | −6 | 0.085–0.145 | 0.025–0.033 | −290 |
| Amino Acid | GC-MS | HPLC-MS |
|---|---|---|
| Number of amino acids identified | 20 | 23 |
| Chromatographic run time (min) | 7 | 21 * |
| Overall method time (min) | 30 | 50 * |
| Limit of quantification range (mg/kg) | 3–75 | 8–270 |
| Number of amino acids with significant matrix effect | 8 | 13 |
| Amino Acid | C1 | C2 | C3 | C4 | C5 | C6 | C7 | C8 |
|---|---|---|---|---|---|---|---|---|
| ALA | 86 | 131 | 334 | 250 | 249 | 348 | 119 | 136 |
| GLY | 20 | 50 | 25 | 16 | 30 | 27 | 12 | 14 |
| VAL | 45 | 82 | 102 | 83 | 107 | 92 | 59 | 62 |
| LEU | ND | 77 | 74 | 52 | 61 | 72 | 4 | 8 |
| ILE | 28 | 58 | 90 | 67 | 90 | 86 | 38 | 41 |
| THR | 23 | 141 | 52 | 36 | 51 | 47 | 26 | 28 |
| GABA | 70 | 421 | 420 | 226 | 635 | 339 | 76 | 75 |
| SER | 75 | 2200 | 159 | 113 | 170 | 125 | 81 | 84 |
| PRO | 3446 | 2197 | 4187 | 3873 | 3499 | 4577 | 2937 | 3214 |
| ASN | 270 | 162 | 698 | 303 | 1042 | 403 | 483 | 471 |
| ASP | 178 | 115 | 281 | 219 | 281 | 239 | 273 | 200 |
| MET | <LOQ | 98 | 10 | 15 | 10 | 10 | <LOQ | <LOQ |
| HYP | 140 | 194 | 234 | 192 | 458 | 187 | 155 | 170 |
| GLU | 167 | 122 | 381 | 316 | 483 | 249 | 353 | 365 |
| PHE | ND | 48 | 44 | 18 | 28 | 42 | ND | ND |
| GLN | 23 | 92 | 55 | 31 | 39 | 58 | 26 | 26 |
| LYS | 28 | 117 | 75 | 47 | 94 | 70 | 30 | 32 |
| HIS | ND | 103 | 363 | <LOQ | 73 | 304 | < ND | ND |
| TYR | 4 | 92 | 28 | 28 | 62 | 29 | 4 | 10 |
| TRP | 78 | 152 | 173 | 91 | 71 | 1175 | 56 | 60 |
| TOTAL | 4681 | 6652 | 7785 | 5976 | 7533 | 8479 | 4732 | 4996 |
| Amino Acid | A1 | A2 | A3 | A4 |
|---|---|---|---|---|
| ALA | 370 | 454 | 314 | 241 |
| GLY | 64 | 69 | 39 | 44 |
| VAL | 307 | 208 | 95 | 193 |
| LEU | 215 | 175 | 22 | 38 |
| ILE | 643 | 223 | 65 | 125 |
| THR | 182 | 99 | 45 | 96 |
| GABA | 683 | 1190 | 805 | 2025 |
| SER | 648 | 268 | 235 | 471 |
| PRO | 974 | 2250 | 1917 | 2878 |
| ASN | 1201 | 643 | 2609 | 4913 |
| ASP | 446 | 279 | 833 | 454 |
| MET | 15 | 11 | 10 | 14 |
| HYP | 120 | 108 | 404 | 202 |
| GLU | 1985 | 744 | 365 | 405 |
| PHE | 27 | 19 | 168 | 28 |
| GLN | 217 | 179 | 99 | 412 |
| LYS | 302 | 221 | 245 | 205 |
| HIS | 228 | 258 | 1808 | 633 |
| TYR | 30 | 28 | <LOQ | 22 |
| TRP | 294 | 163 | 29 | 44 |
| TOTAL | 8951 | 7589 | 10,107 | 13,443 |
Publisher’s Note: MDPI stays neutral with regard to jurisdictional claims in published maps and institutional affiliations. |
© 2022 by the authors. Licensee MDPI, Basel, Switzerland. This article is an open access article distributed under the terms and conditions of the Creative Commons Attribution (CC BY) license (https://creativecommons.org/licenses/by/4.0/).
Share and Cite
Martín-Gómez, B.; Salahange, L.; Tapia, J.A.; Martín, M.T.; Ares, A.M.; Bernal, J. Fast Chromatographic Determination of Free Amino Acids in Bee Pollen. Foods 2022, 11, 4013. https://doi.org/10.3390/foods11244013
Martín-Gómez B, Salahange L, Tapia JA, Martín MT, Ares AM, Bernal J. Fast Chromatographic Determination of Free Amino Acids in Bee Pollen. Foods. 2022; 11(24):4013. https://doi.org/10.3390/foods11244013
Chicago/Turabian StyleMartín-Gómez, Beatriz, Laura Salahange, Jesús A. Tapia, María T. Martín, Ana M. Ares, and José Bernal. 2022. "Fast Chromatographic Determination of Free Amino Acids in Bee Pollen" Foods 11, no. 24: 4013. https://doi.org/10.3390/foods11244013