
Characterization of Tenebrio molitor Larvae Protein Preparations Obtained by Different Extraction Approaches


Abstract
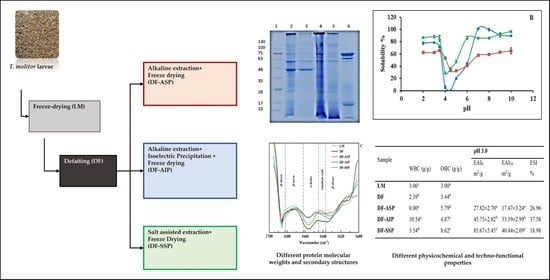
:
1. Introduction
2. Materials and Methods
2.1. Materials
2.2. Defatting
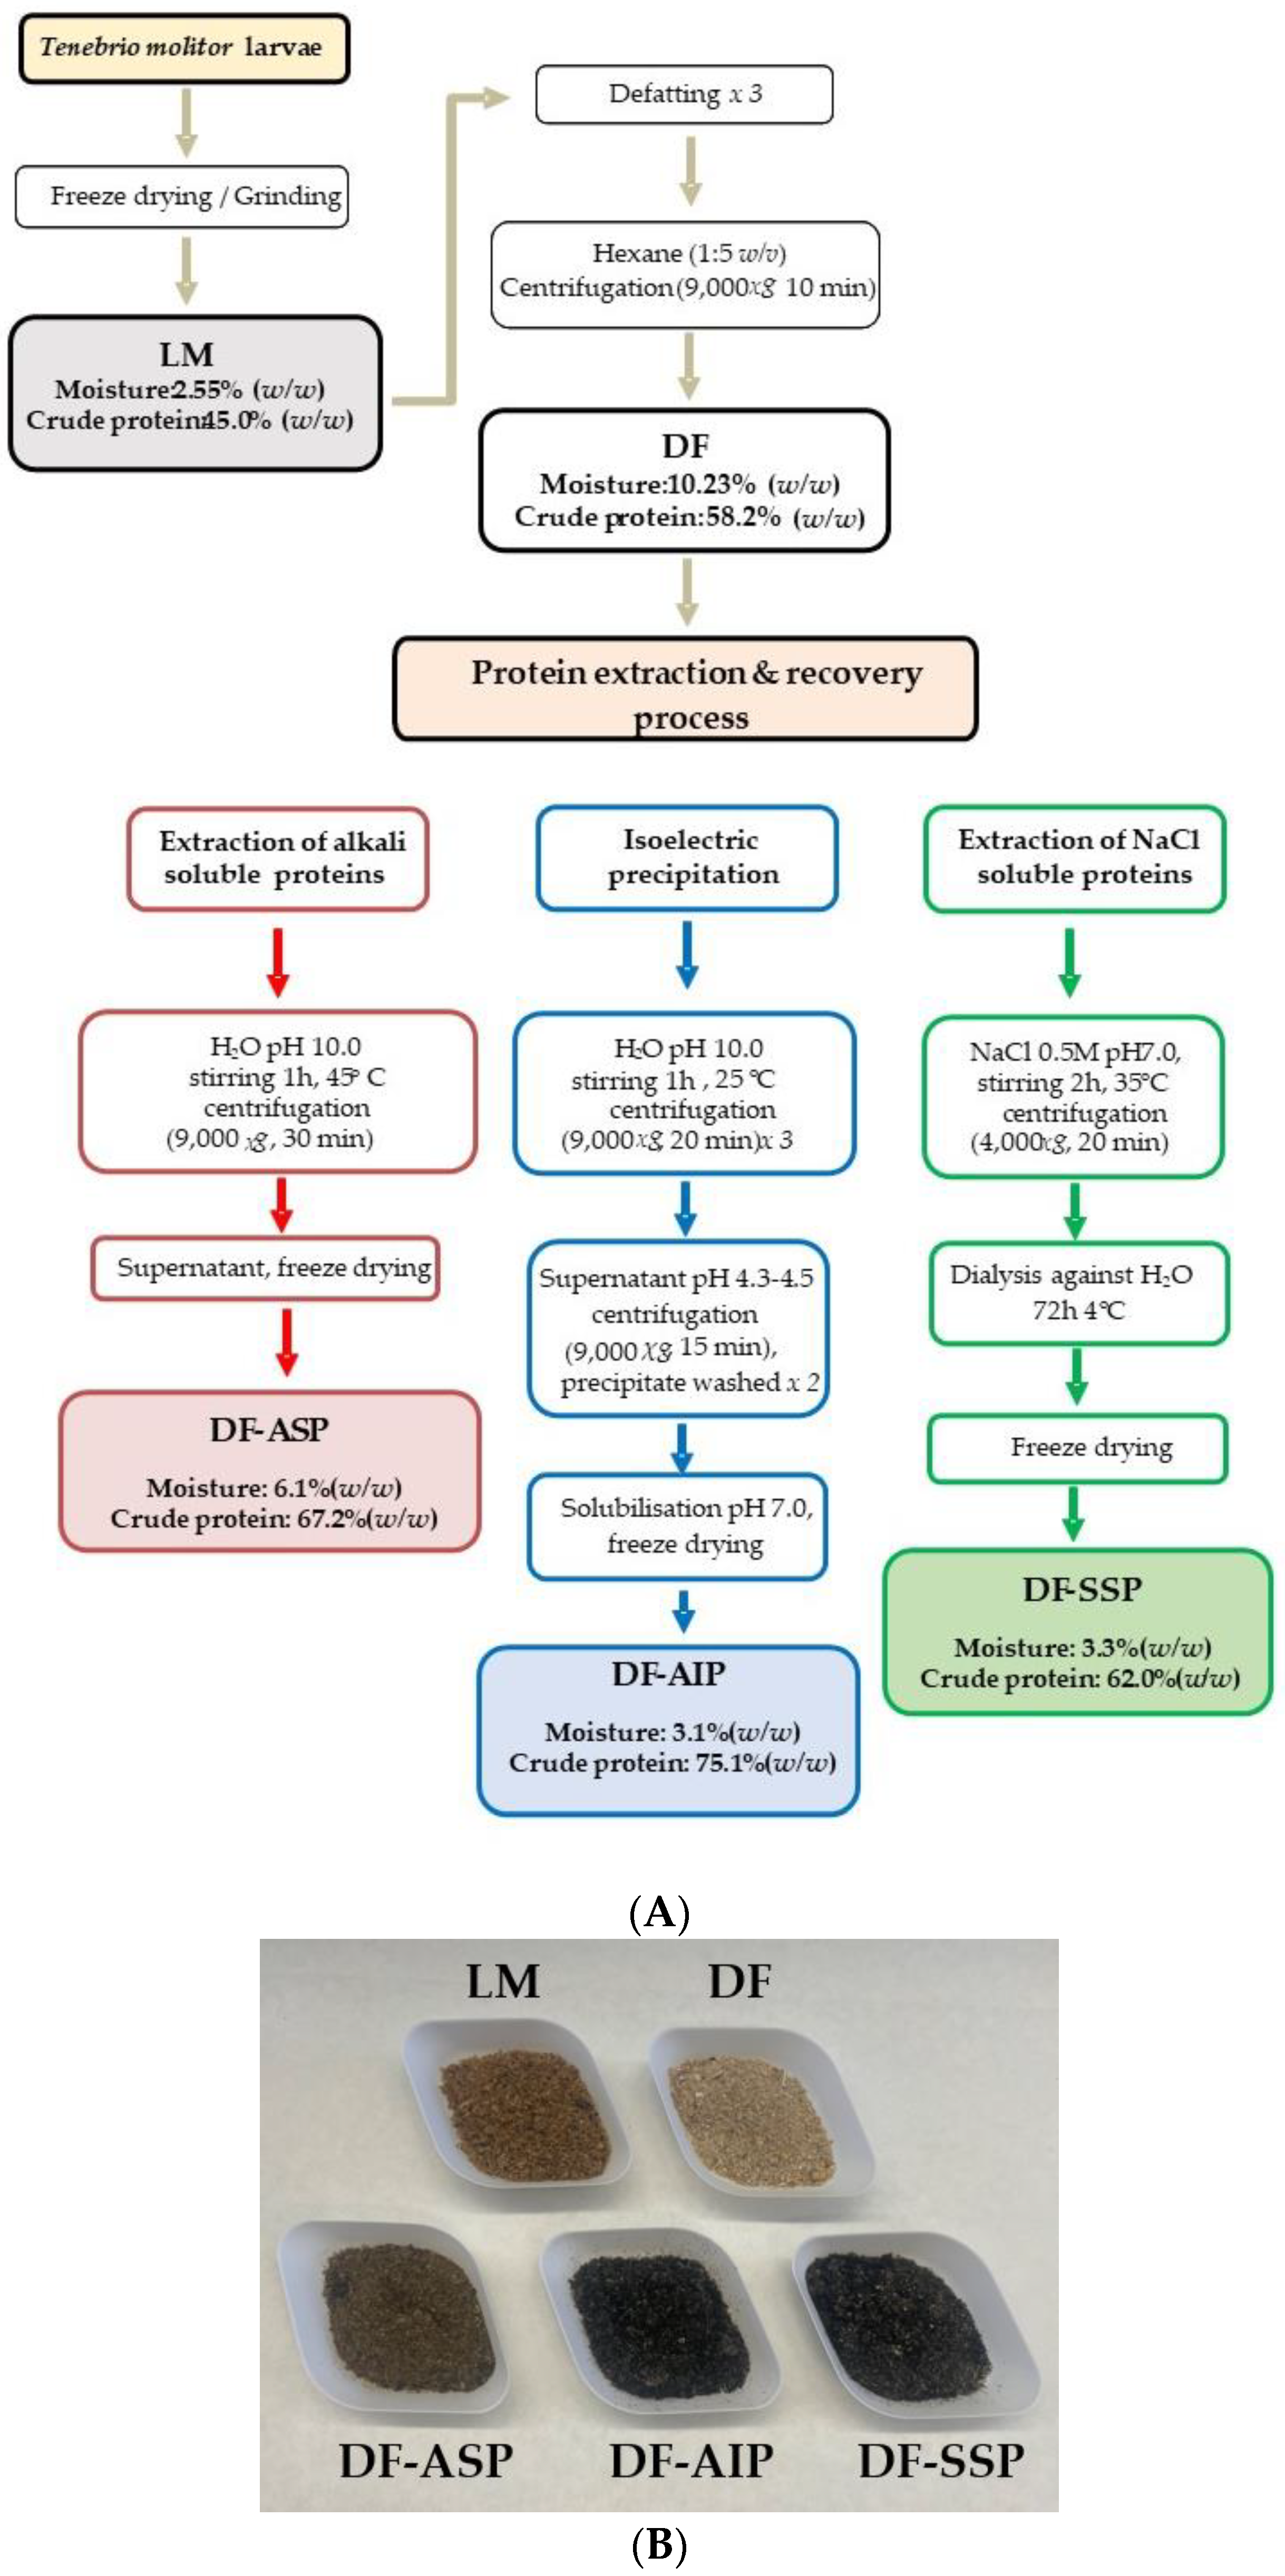
2.3. Protein Extraction and Recovery Process
2.3.1. Extraction of Alkali Soluble Proteins
2.3.2. Isoelectric Precipitation of Alkali Extracted Proteins
2.3.3. Extraction of NaCl Soluble Proteins
2.4. Characterization of Raw Materials and Protein Preparations
Proximate Composition Analysis of the Raw Material
2.5. Molecular Weight Determination by Polyacrylamide Gel Electrophoresis
2.6. Fourier Transform Infrared (FTIR) Spectra Analysis
2.7. Protein Solubility
2.8. ζ-Potential
2.9. Surface Activity
2.10. Water and Oil Binding Capacity
2.11. Emulsion Activity and Stability
2.12. Statistical Analysis
3. Results and Discussion
3.1. Chemical Composition
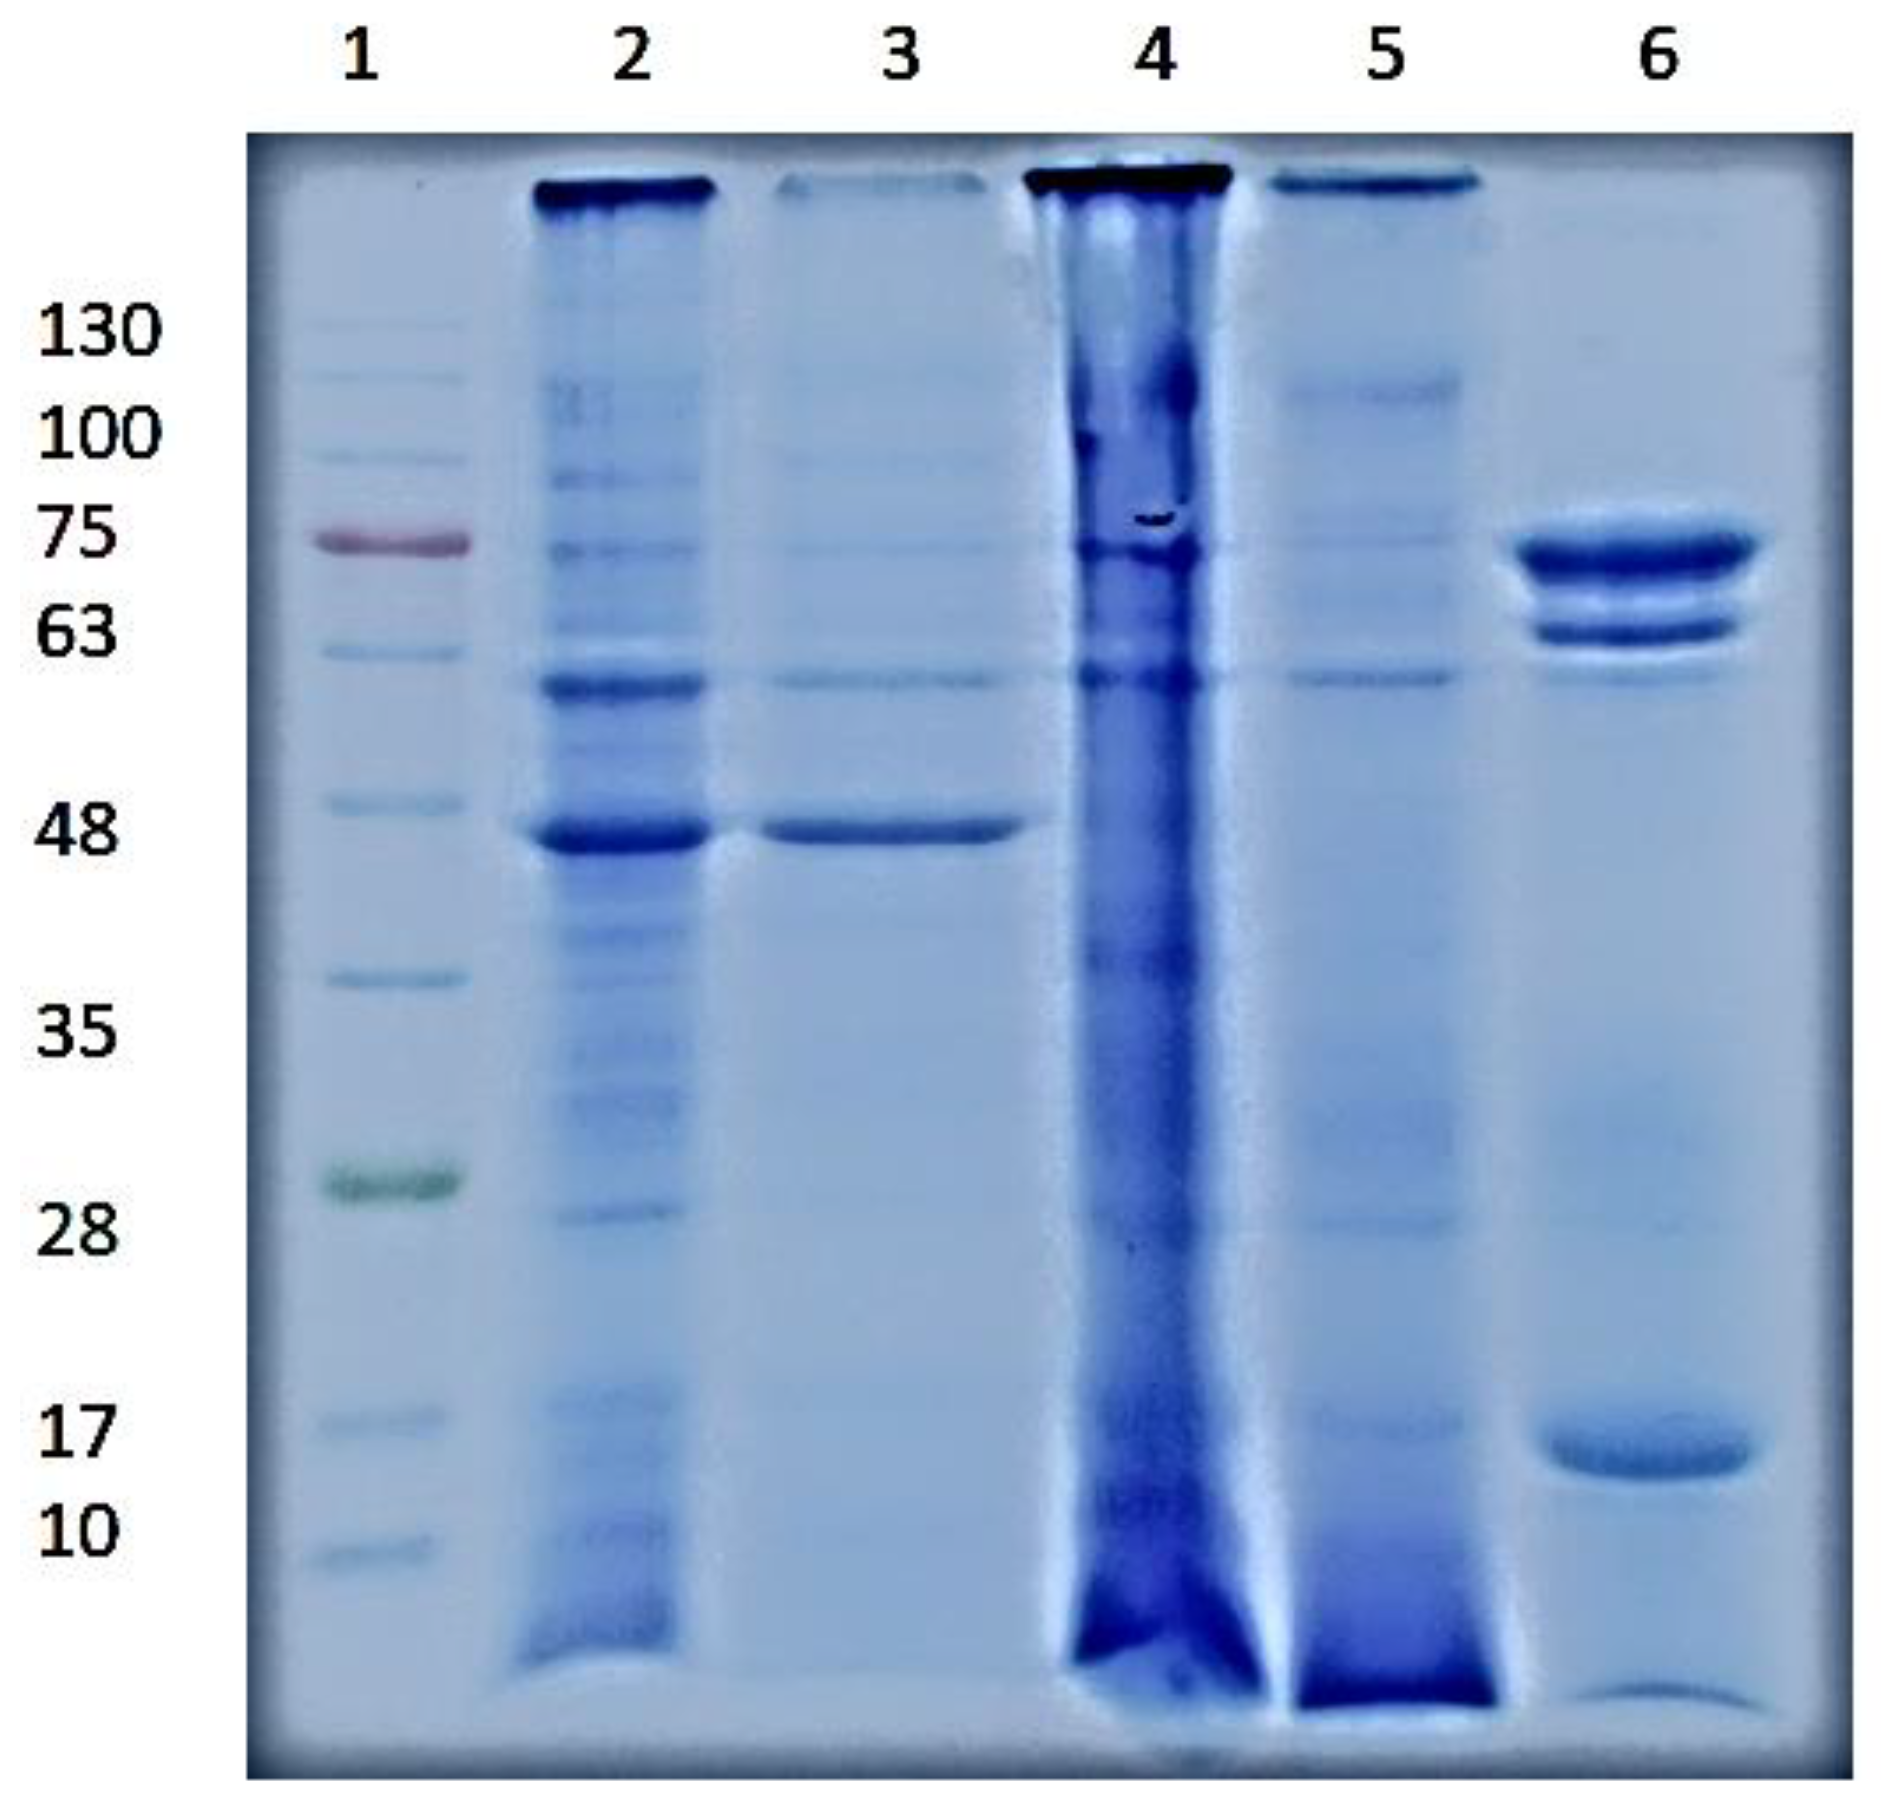
3.2. SDS-PAGΕ Electrophoresis
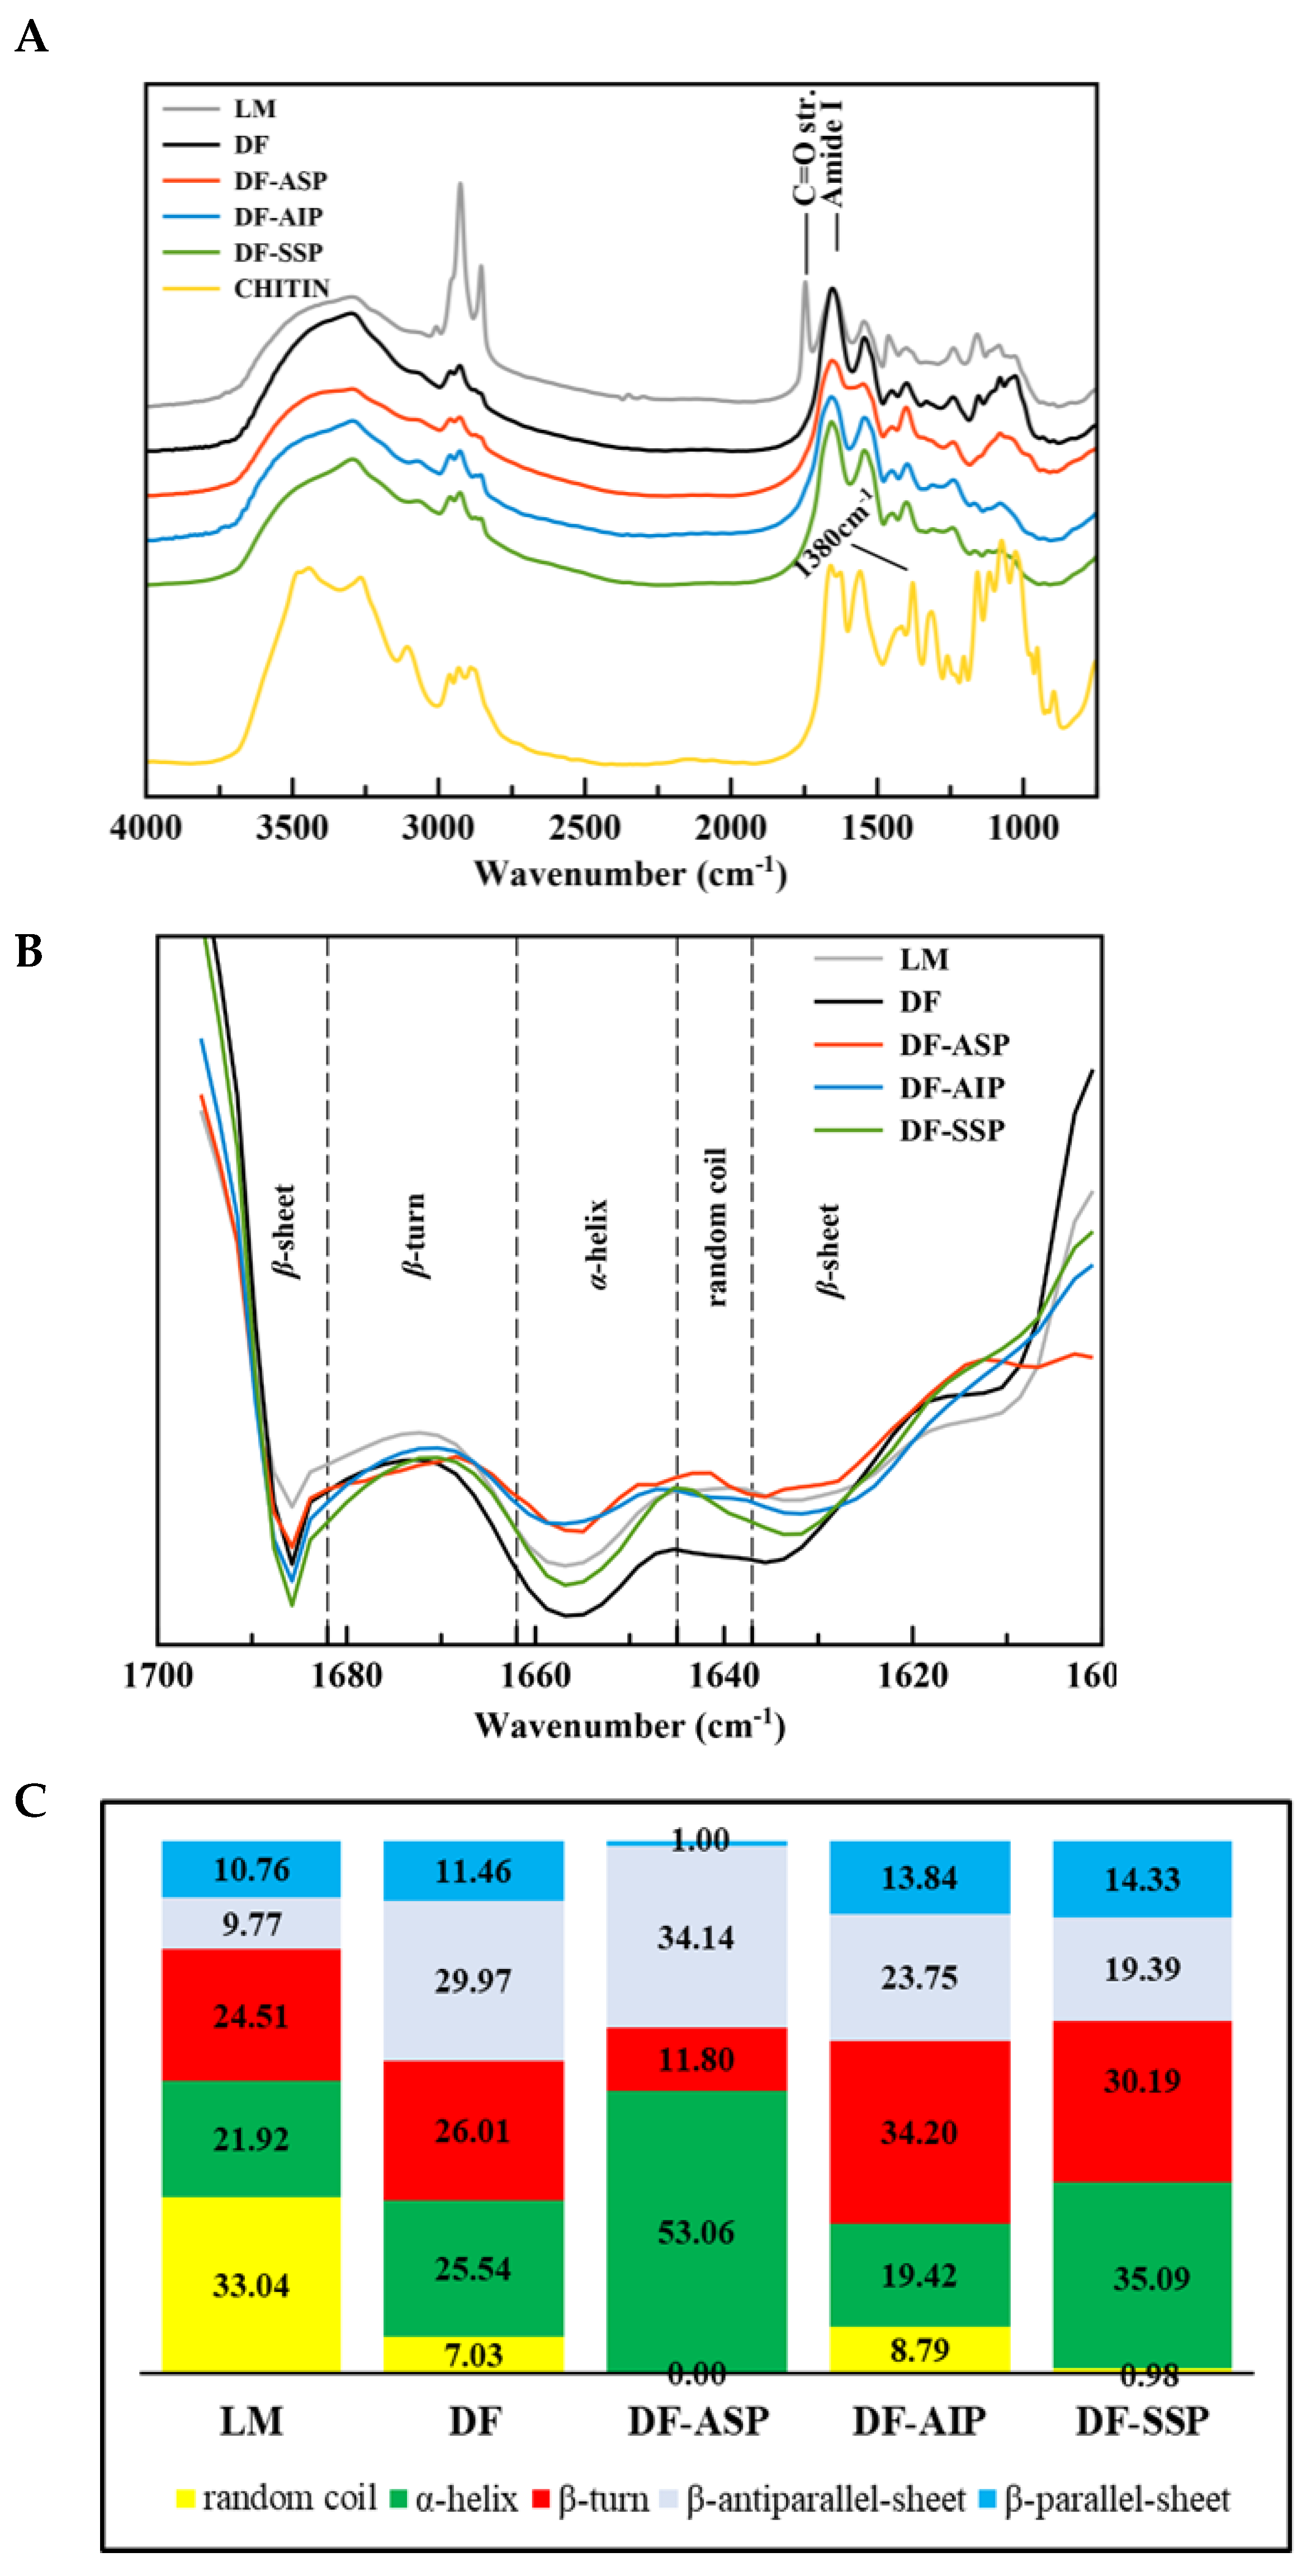
3.3. FT-IR Spectroscopy
Protein Secondary Structure
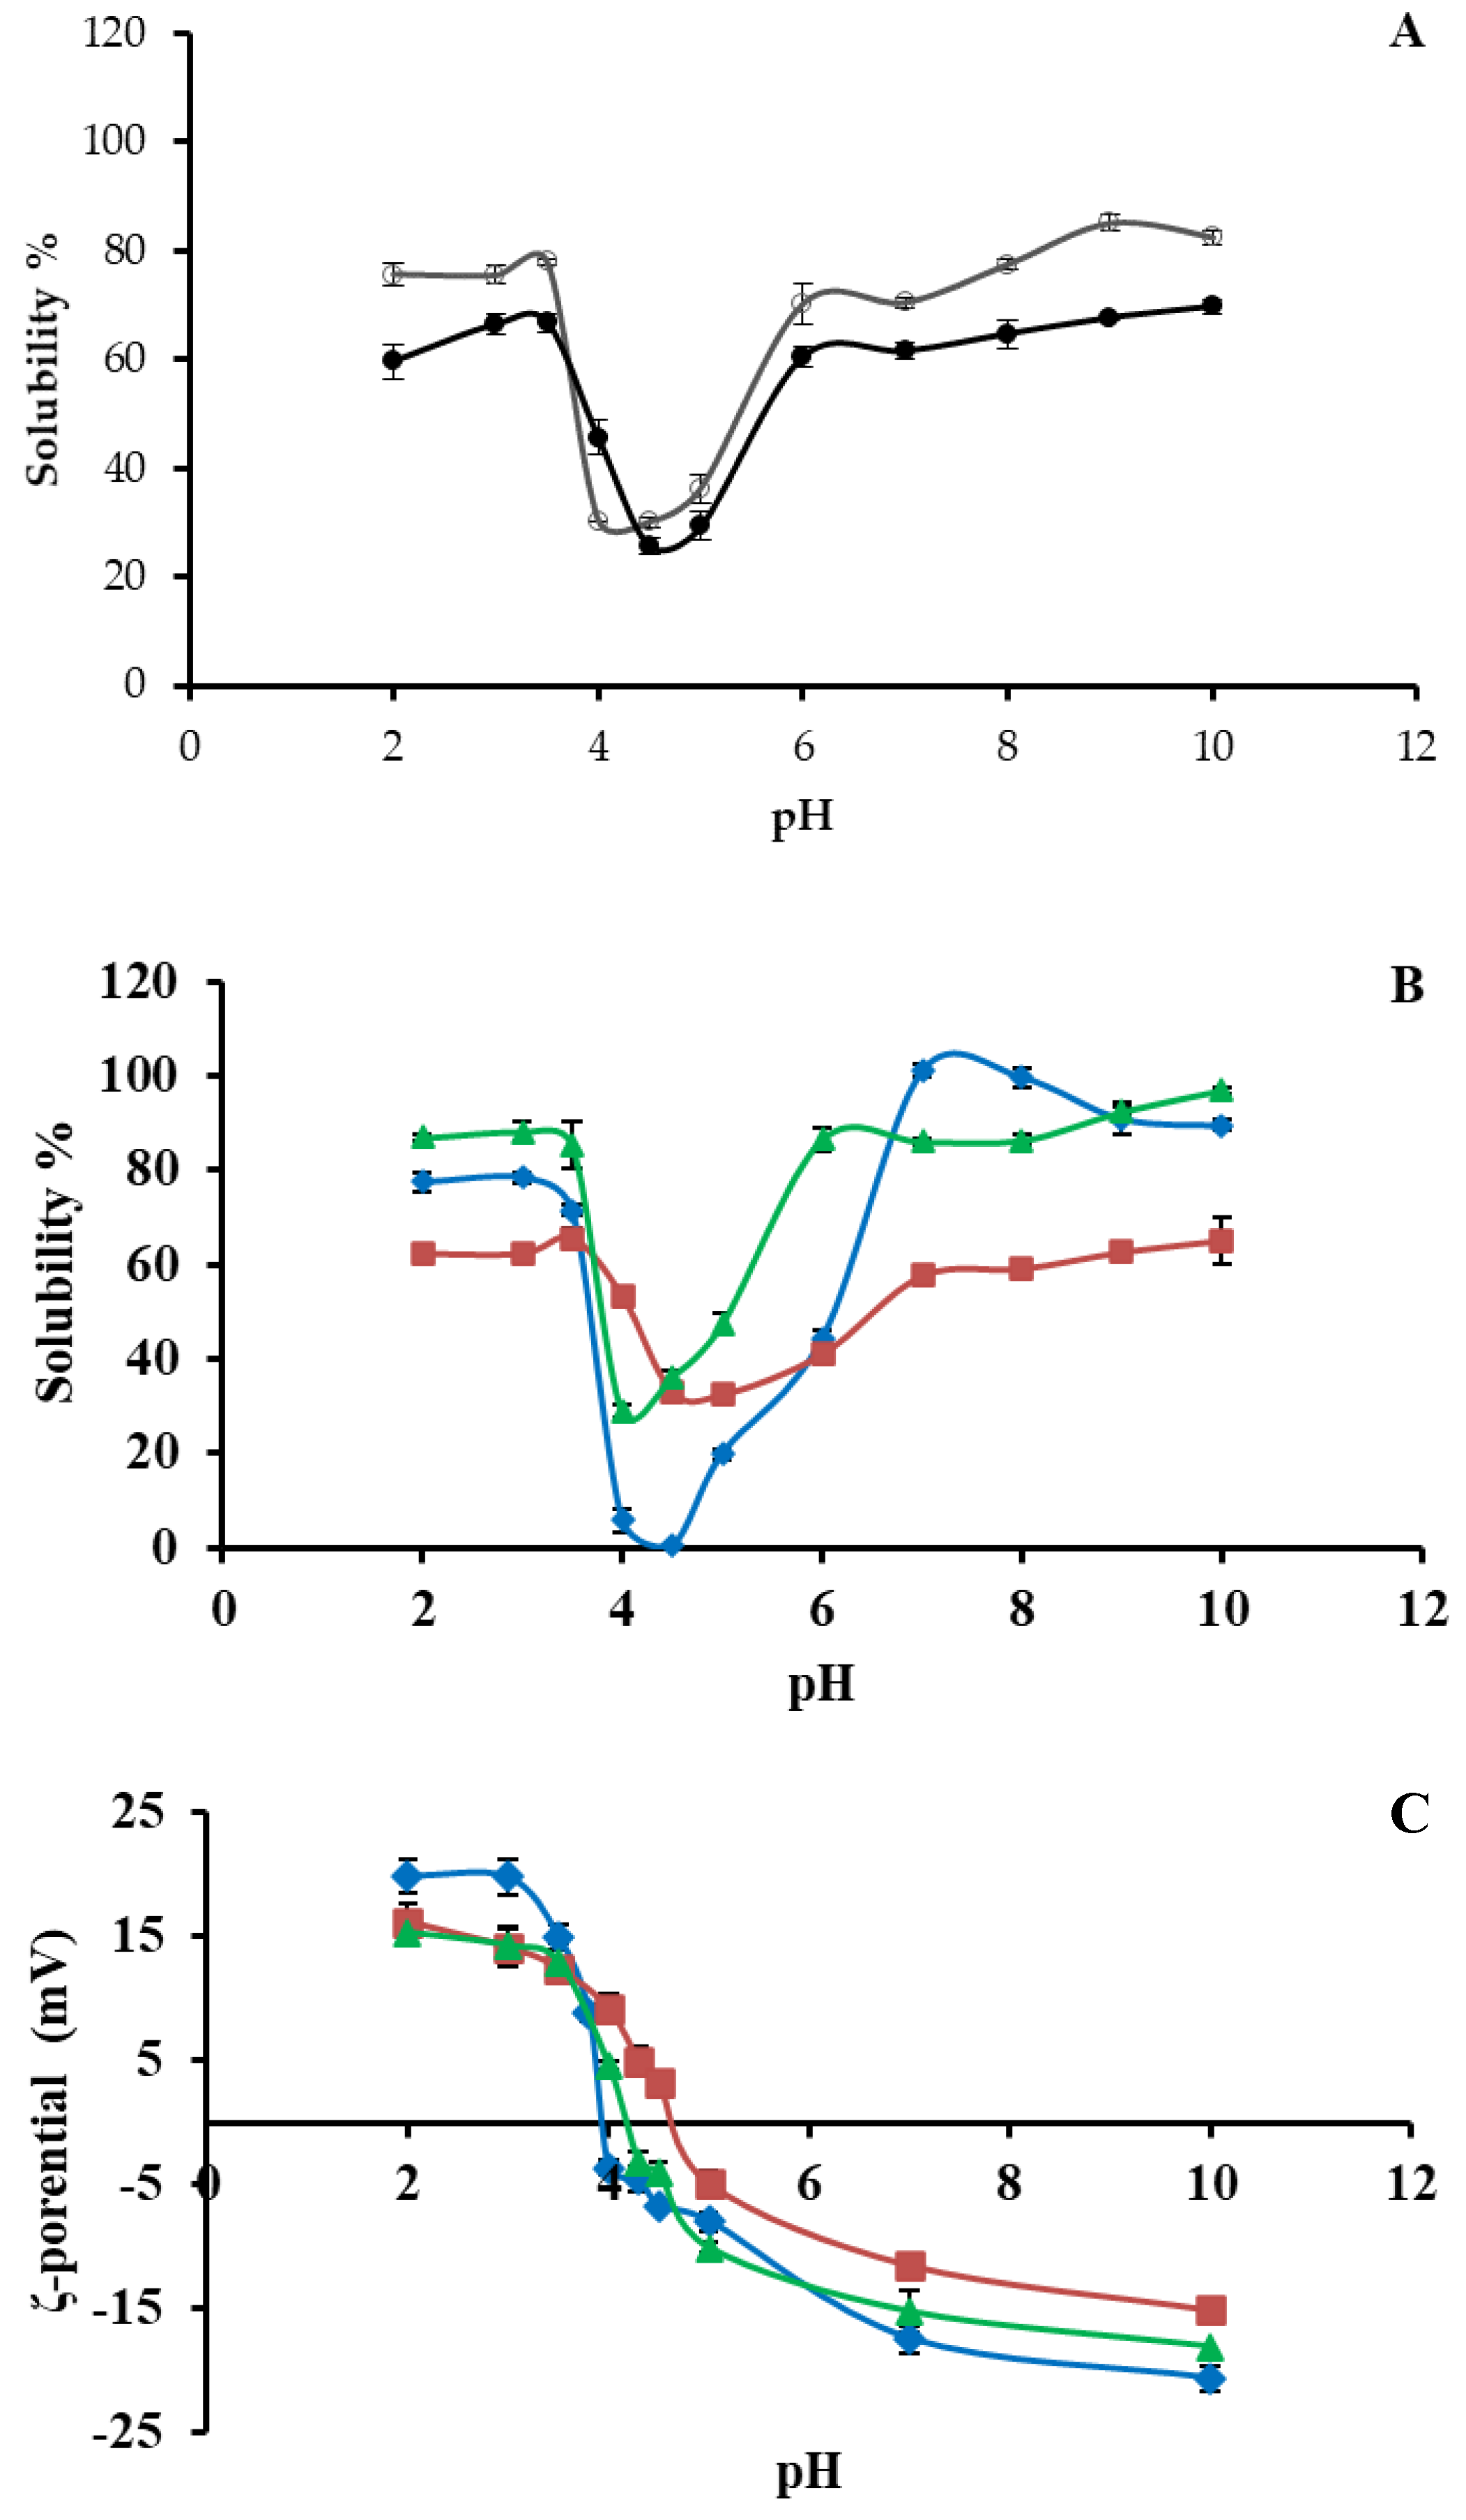
3.4. Protein Solubility at Different pH Values
3.5. ζ-Potential at Different pH Values
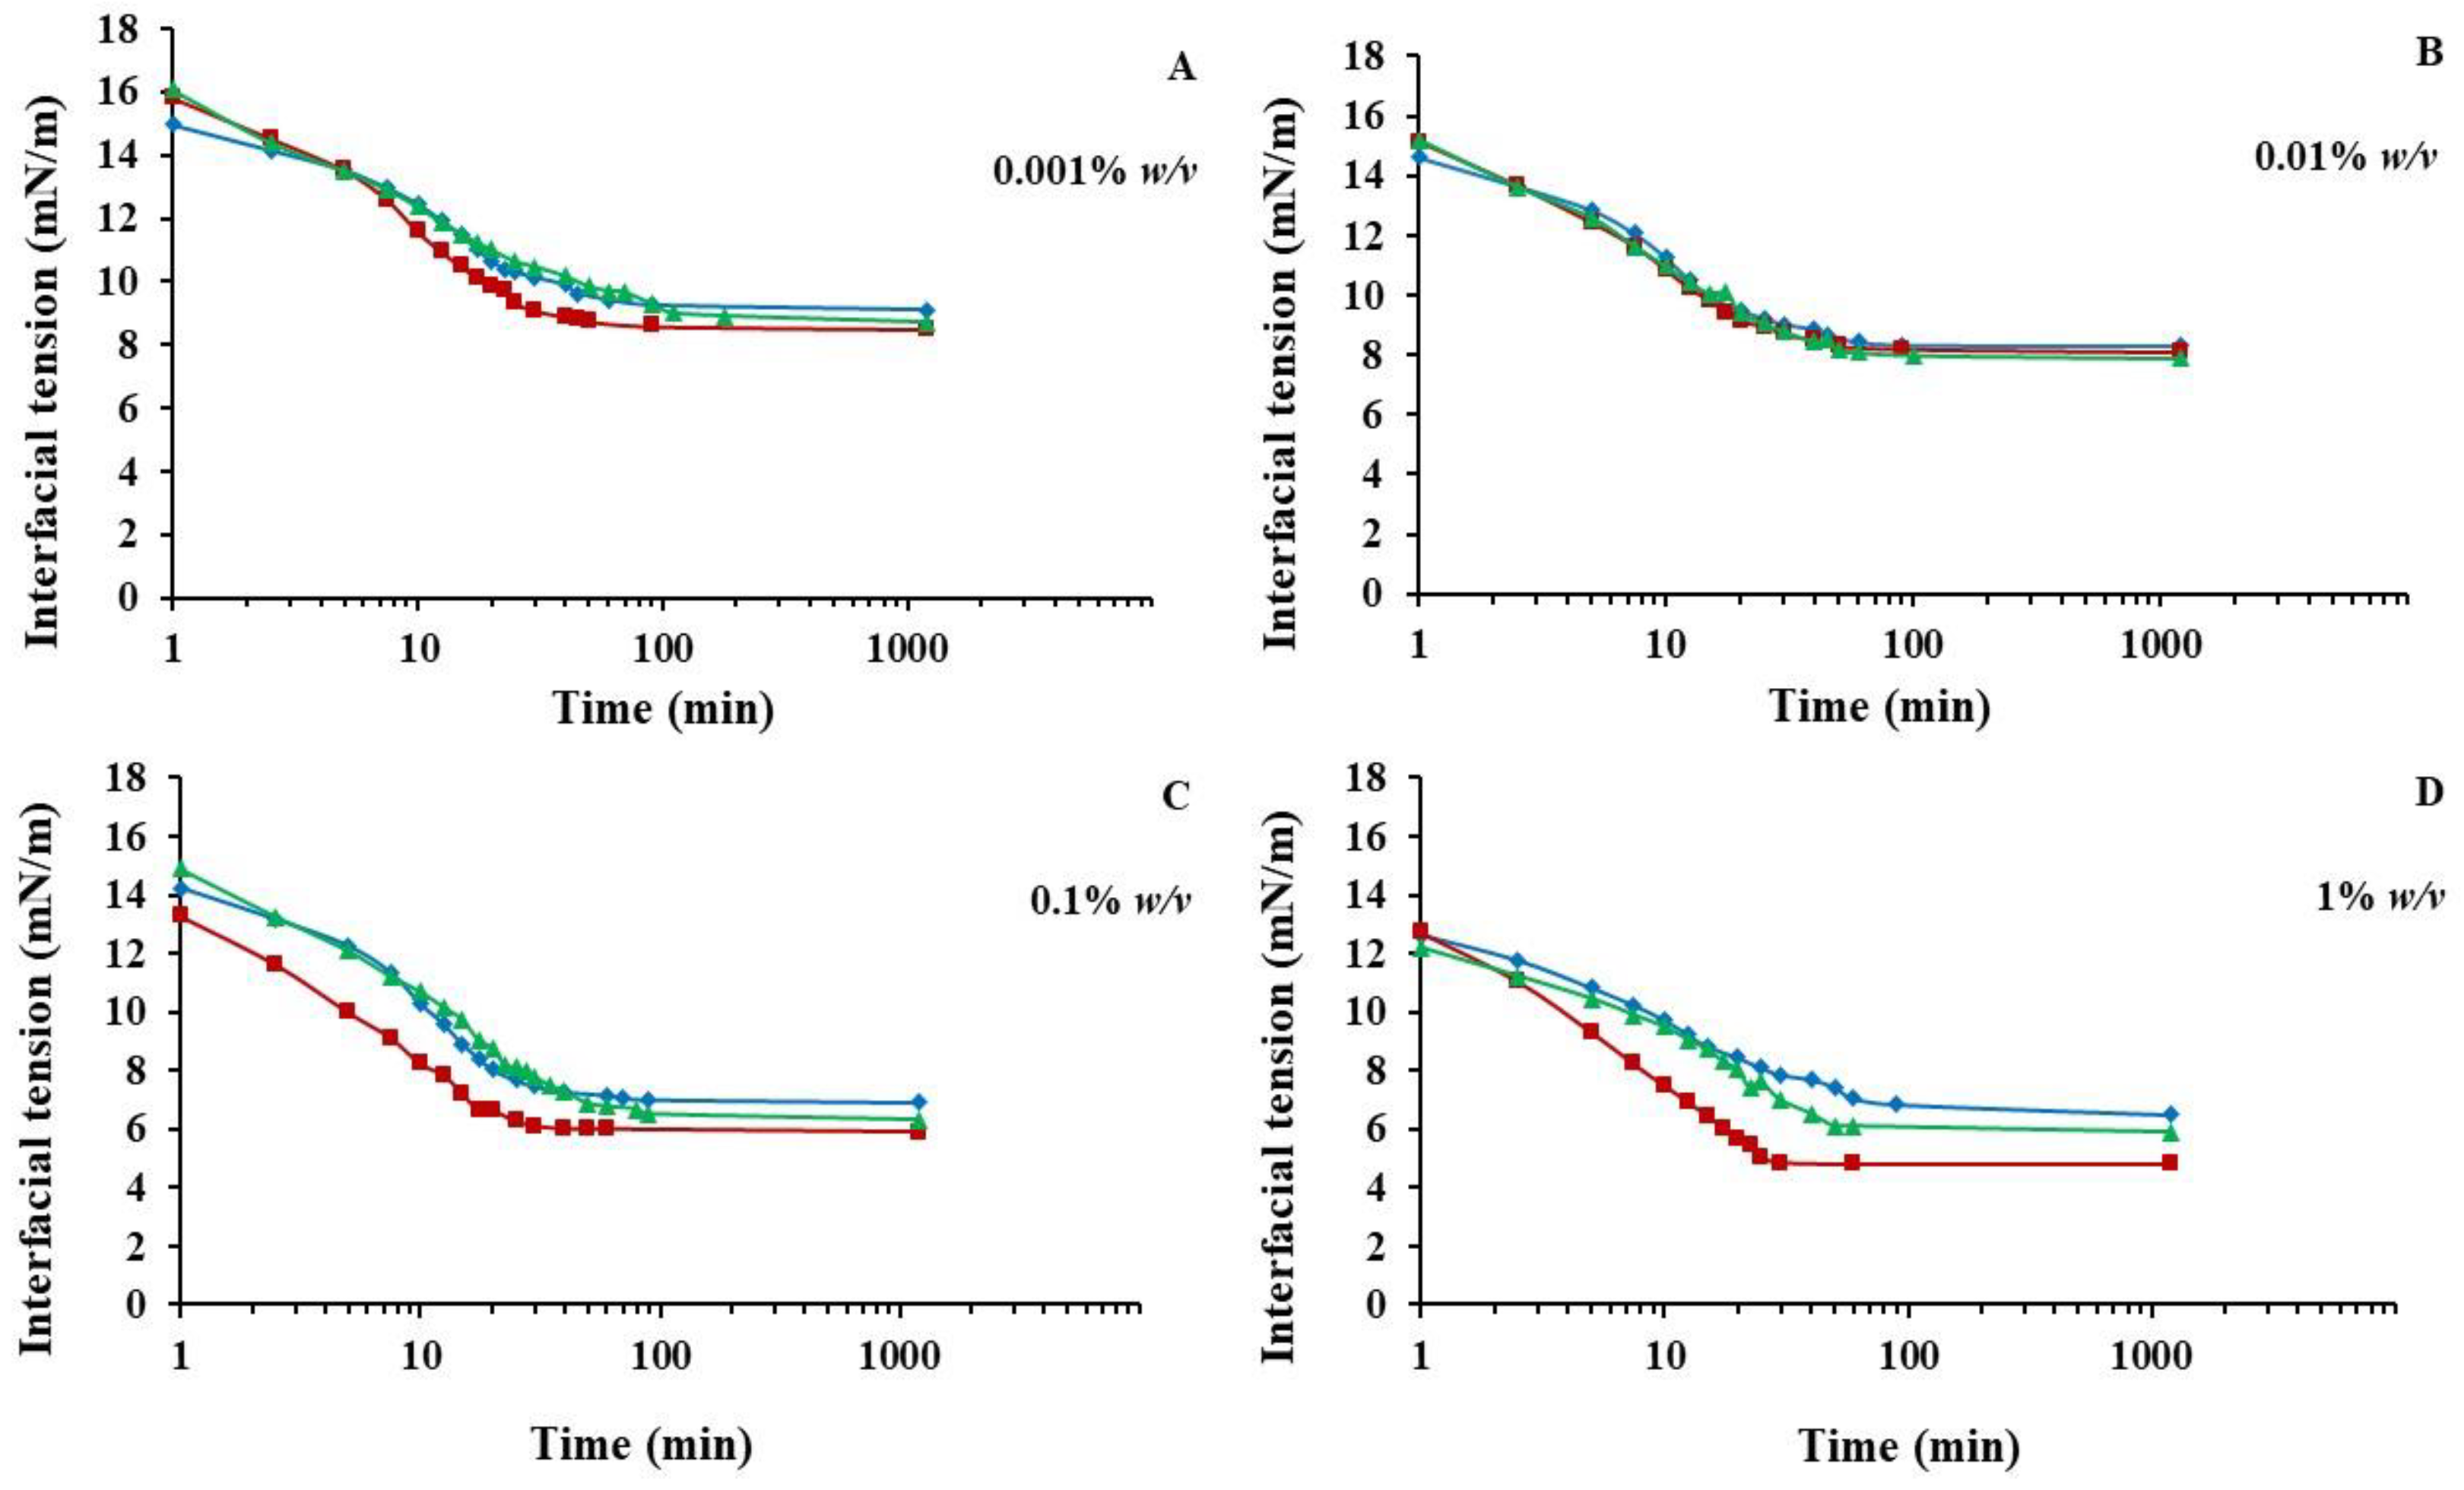
3.6. Surface Activity at Oil/Water Interfaces
3.7. Water/oil Binding and Emulsifying Capacity
4. Conclusions
Supplementary Materials
Author Contributions
Funding
Institutional Review Board Statement
Informed Consent Statement
Data Availability Statement
Acknowledgments
Conflicts of Interest
References
- van Huis, A.; Van Itterbeeck, J.; Klunder, H.; Mertens, E.; Halloran, A.; Vantomme, P. Edible Insects: Future Prospects for Food and Feed Security; FAO Forestry Paper No. 171; Food and Agriculture Organization of the United Nations: Rome, Italy, 2013; Available online: http://www.fao.org/3/i3253e/i3253e.pdf (accessed on 18 November 2022).
- Hartmann, C.; Shi, J.; Giusto, A.; Siegrist, M. The psychology of eating insects: A cross-cultural comparison between Germany and China. Food Qual. Prefer. 2015, 44, 148–156. [Google Scholar] [CrossRef]
- Brohm, D.; Domurath, N. The Sustainability Trend. In Consumer Trends and New Product Opportunities in the Food Sector; Grunert, K.G., Ed.; Wageningen Academic Publishers: Wageningen, The Netherlands, 2017; pp. 33–42. [Google Scholar] [CrossRef]
- European Parliament and Council. Regulation (EU) 2015/2283 of the European Parliament and of the Council of 25 November 2015 on novel foods, amending Regulation (EU) No 1169/2011 of the European Parliament and of the Council and repealing Regulation (EC) No 258/97 of the European Parliament and of the Council and Commission Regulation (EC) No 1852/2001. Off. J. Eur. Union 2015, L327, 1–22. Available online: https://eur-lex.europa.eu/legalcontent/EN/TXT/PDF/?uri=OJ:L:2015:327:FULL&from=EN (accessed on 18 November 2022).
- EFSA. Safety of dried yellow mealworm (Tenebrio molitor larva) as a novel food pursuant to Regulation (EU) 2015/2283. EFSA J. 2021, 19, 6343. [Google Scholar] [CrossRef]
- EFSA. Safety of frozen and dried formulations from whole yellow mealworm (Tenebrio molitor larva) as a novel food pursuant to Regulation (EU) 2015/2283. EFSA J. 2021, 19, 6778. [Google Scholar] [CrossRef]
- European Commission. Regulation (EU) 2021/882 of 1 June 2021 authorising the placing on the market of dried Tenebrio molitor larva as a novel food under Regulation (EU) 2015/2283 of the European Parliament and of the Council and amending Commission Implementing Regulation (EU) 2017/2470. Off. J. Eur. Union 2021, L194/16, 1–6. Available online: https://eur-lex.europa.eu/legal-content/EN/TXT/PDF/?uri=CELEX:32021R0882&from=EN (accessed on 18 November 2022).
- European Commission. Regulation (EU) 2021/1372 of 17 August 2021 amending Annex IV to Regulation (EC) No 999/2001 of the European Parliament and of the Council as regards the prohibition to feed non-ruminant farmed animals, other than fur animals, with protein derived from animals. Off. J. Eur. Union 2021, L295/1, 1–17. Available online: https://eur-lex.europa.eu/legal-content/EN/TXT/PDF/?uri=CELEX:32021R1372&from=EN (accessed on 18 November 2022).
- Gkinali, A.A.; Matsakidou, A.; Vasileiou, E.; Paraskevopoulou, A. Potentiality of Tenebrio molitor larva-based ingredients for the food industry: A review. Trends Food Sci. Technol. 2022, 119, 495–507. [Google Scholar] [CrossRef]
- Gere, A.; Székely, G.; Kovács, S.; Kókai, Z.; Sipos, L. Readiness to adopt insects in Hungary: A case study. Food Qual. Prefer. 2017, 9, 81–86. [Google Scholar] [CrossRef]
- Bußler, S.; Rumpold, B.A.; Jander, E.; Rawel, H.M.; Schlüter, O.K. Recovery and techno-functionality of flours and proteins from two edible insect species: Meal worm (Tenebrio molitor) and black soldier fly (Hermetia illucens) larvae. Heliyon 2016, 2, e00218. [Google Scholar] [CrossRef]
- Yi, L.; Lakemond, C.M.M.; Sagis, L.M.C.; Eisner-Schadler, V.; van Huis, A.; Boekel, M.A.J.S.V. Extraction and characterisation of protein fractions from five insect species. Food Chem. 2013, 141, 3341–3348. [Google Scholar] [CrossRef] [PubMed]
- Azagoh, C.; Ducept, F.; Garcia, R.; Rakotozafy, L.; Cuvelier, M.E.; Keller, S.; Lewandowski, R.; Mezdour, S. Extraction and physicochemical characterization of Tenebrio molitor proteins. Food Res. Int. 2016, 88, 24–31. [Google Scholar] [CrossRef] [PubMed]
- Santhosh, R.; Yadav, B.K.; Rawson, A. Optimization of protein extraction from yellow mealworm larvae. Int. J. Chem. Stud. 2019, 7, 4577–4582. [Google Scholar]
- Zhao, X.; Vázquez-Gutiérrez, J.L.; Johansson, D.P.; Landberg, R.; Langton, M. Yellow mealworm protein for food purposes-Extraction and functional properties. PLoS ONE 2016, 11, e0147791. [Google Scholar] [CrossRef]
- Pissia, M.A.; Matsakidou, A.; Paraskevopoulou, A.; Kiosseoglou, V. Structural characteristics and physicochemical properties of freeze-dried snail meat. LWT–Food Sci. Technol. 2022, 155, 112980. [Google Scholar] [CrossRef]
- AOAC. Official methods of Analysis, 19th ed.; Association of Official Analytical Chemists: Washington, DC, USA, 2012. [Google Scholar]
- Janssen, R.H.; Vincken, J.P.; Van Den Broek, L.A.M.; Fogliano, V.; Lakemond, C.M.M. Nitrogen-to-protein conversion factors for three edible insects: Tenebrio molitor, Alphitobius diaperinus, and Hermetia illucens. J. Agric. Food Chem. 2017, 65, 2275–2278. [Google Scholar] [CrossRef] [PubMed]
- González, C.M.; Garzón, R.; Rosell, C.M. Insects as ingredients for bakery goods. A comparison study of H. illucens, A. domestica and T. molitor flours. Innov. Food Sci. Emerg. Technol. 2019, 51, 205–210. [Google Scholar] [CrossRef]
- Zakidou, P.; Paraskevopoulou, A. Aqueous sesame seed extracts: Study of their foaming potential for the preparation of cappuccino-type coffee beverages. LWT–Food Sci. Technol. 2021, 135, 110258. [Google Scholar] [CrossRef]
- Manousi, N.; Zachariadis, G.A. Development and application of an ICP-AES method for the determination of nutrient and toxic elements in savory snack products after autoclave dissolution. Separations 2020, 7, 66. [Google Scholar] [CrossRef]
- Laemmli, U.K. Cleavage of Structural Proteins during the Assembly of the Head of Bacteriophage T4. Nature 1970, 227, 680–685. [Google Scholar] [CrossRef] [PubMed]
- Chen, X.; Zhou, R.; Xu, X.; Zhou, G.; Liu, D. Structural modification by high-pressure homogenization for improved functional properties of freeze-dried myofibrillar proteins powder. Food Res. Int. 2017, 100, 193–200. [Google Scholar] [CrossRef] [PubMed]
- Xia, S.; Xue, Y.; Xue, C.; Jiang, X.; Li, J. Structural and rheological properties of meat analogues from Haematococcus pluvialis residue-pea protein by high moisture extrusion. LWT–Food Sci. Technol. 2022, 154, 112756. [Google Scholar] [CrossRef]
- Lowry, O.H.; Rosebrough, N.J.; Farr, A.L.; Randall, R.J. Protein measurement with the Folin phenol reagent. J. Biol. Chem. 1951, 193, 265–275. [Google Scholar] [CrossRef] [PubMed]
- Papalamprou, E.M.; Doxastakis, G.I.; Kiosseoglou, V. Chickpea protein isolates obtained by wet extraction as emulsifying agents. Sci. Food Agric. 2009, 90, 304–313. [Google Scholar] [CrossRef] [PubMed]
- Pearce, K.N.; Kinsella, J.E. Emulsifying properties of proteins: Evaluation of a turbidimetric technique. J. Agric. Food Chem. 1978, 26, 3, 716–723. [Google Scholar] [CrossRef]
- European Commission. Regulation (EC) 1881/2006 of 19 December 2006 setting maximum levels for certain contaminants in foodstuffs (Text with EEA relevance). Off. J. Eur. Union 2006, L364, 5–24. Available online: https://eur-lex.europa.eu/legal-content/EN/ALL/?uri=CELEX%3A32006R1881 (accessed on 18 November 2022).
- Kim, T.K.; Yong, H.I.; Chun, H.H.; Lee, M.A.; Kim, Y.B.; Choi, Y.S. Changes of amino acid composition and protein technical functionality of edible insects by extracting steps. J. Asia-Pac. Entomol. 2020, 23, 298–305. [Google Scholar] [CrossRef]
- Rinaudo, M. Chitin and chitosan: Properties and applications. Prog. Polym. Sci. 2006, 31, 603–632. [Google Scholar] [CrossRef]
- Kong, J.; Yu, S. Fourier Transform Infrared Spectroscopic analysis of protein secondary structures. Acta Biochim. Biophys. Sin. 2007, 39, 549–559. [Google Scholar] [CrossRef] [PubMed] [Green Version]
- Matsakidou, A.; Papadopoulou, D.; Nenadis, N.; Tsimidou, M.Z. Getting inside on virgin olive oil (VOO) photooxidation kinetics through combined generalized 2D correlation analysis and moving window 2D correlation analysis of ATR-FTIR spectra. Talanta 2021, 215, 120917. [Google Scholar] [CrossRef] [PubMed]
- Trung, T.S.; Tram, L.H.; Tan, N.V.; Hoa, N.V.; Minh, N.C.; Loc, P.T.; Stevens, W.F. Improved method for production of chitin and chitosan from shrimp shells. Carbohydr. Res. 2020, 489, 107913. [Google Scholar] [CrossRef] [PubMed]
- Tan, L.; Hong, P.; Yang, P.; Zhou, C.; Xiao, D.; Zhong, T. Correlation between the water solubility and secondary structure of tilapia-soybean protein co-precipitates. Molecules 2019, 24, 4337. [Google Scholar] [CrossRef] [PubMed] [Green Version]
- Carbonaro, M.; Maselli, P.; Nucara, A. Relationship between digestibility and secondary structure of raw and thermally treated legume proteins: A Fourier transform infrared (FT-IR) spectroscopic study. Amino Acids 2012, 43, 911–921. [Google Scholar] [CrossRef] [PubMed]
- Zhai, J.I.; Day, L.; Aguilar, M.I.; Wooster, T.J. Protein folding at emulsion oil/water interfaces. Curr. Opin. Colloid Interface Sci. 2013, 18, 257–271. [Google Scholar] [CrossRef]
- Jiang, Y.; Zhu, Y.; Zheng, Y.; Liu, Z.; Zhong, Y.; Deng, Y.; Zhao, Y. Effects of salting-in/out-assisted extractions on structural, physicochemical and functional properties of Tenebrio molitor larvae protein isolates. Food Chem. 2021, 338, 128158. [Google Scholar] [CrossRef] [PubMed]
- Borremans, A.; Bußler, S.; Sagu, S.T.; Rawel, H.; Schlüter, O.K.; Van Leen, C. Effect of blanching plus fermentation on selected functional properties of mealworm (Tenebrio molitor) powders. Foods 2020, 9, 917. [Google Scholar] [CrossRef] [PubMed]
- Paraskevopoulou, A.; Kiosseoglou, V.; Pegiadou, S. Interfacial behavior of egg yolk with reduced cholesterol content. J. Agric. Food Chem. 1997, 45, 3717–3722. [Google Scholar] [CrossRef]
- Liu, H.; Wang, B.; Barrow, C.J.; Adhikari, B. Relating the variation of secondary structure of gelatin at fish oil–water interface to adsorption kinetics, dynamic interfacial tension and emulsion stability. Food Chem. 2014, 143, 484–491. [Google Scholar] [CrossRef] [PubMed]
- Joshi, M.; Adhikari, B.; Aldred, P.; Panozzo, J.F.; Kasapis, S.; Barrow, C.J. Interfacial and emulsifying properties of lentil protein isolate. Food Chem. 2012, 134, 1343–1353. [Google Scholar] [CrossRef] [PubMed] [Green Version]
- Aryee, A.N.A.; Agyei, D.; Udenigwe, C.C. 2-Impact of processing on the chemistry and functionality of food proteins. In Proteins in Food Processing; Yada, R.Y., Ed.; Woodhead Publishing: Sawston, UK, 2018; pp. 27–45. [Google Scholar] [CrossRef]
- Zielińska, E.; Karaś, M.; Baraniak, B. Comparison of functional properties of edible insects and protein preparations thereof. LWT–Food Sci. Technol. 2018, 91, 168–174. [Google Scholar] [CrossRef]
- Ge, J.; Sun, C.X.; Mata, A.; Corke, H.; Gan, R.Y.; Fang, Y. Physicochemical and pH-dependent functional properties of proteins isolated from eight traditional Chinese beans. Food Hydrocoll. 2021, 112, 106288. [Google Scholar] [CrossRef]
- Stone, A.K.; Karalash, A.; Tyler, R.T.; Warkentin, T.D.; Nickerson, M.T. Functional attributes of pea protein isolates prepared using different extraction methods and cultivars. Food Res. Int. 2015, 76, 31–38. [Google Scholar] [CrossRef]
- Haque, M.A.; Timilsena, Y.P.; Adhikari, B. Food Proteins, Structure, and Function. In Reference Module in Food Science; Elsevier: Amsterdam, The Netherlands, 2016. [Google Scholar] [CrossRef]
- Boye, J.I.; Aksay, S.; Roufik, S.; Ribéreau, S.; Mondor, M.; Farnworth, E.; Rajamohamed, S.H. Comparison of the functional properties of pea, chickpea and lentil protein concentrates processed using ultrafiltration and isoelectric precipitation techniques. Food Res. Int. 2010, 43, 537–546. [Google Scholar] [CrossRef]
- Chee, K.L.; Ling, H.K.; Ayob, M.K. Optimization of trypsin-assisted extraction, physico-chemical characterization, nutritional qualities and functionalities of palm kernel cake protein. LWT–Food Sci. Technol. 2012, 46, 419–427. [Google Scholar] [CrossRef]


| Sample | Moisture (% w/w) | Protein Content 2 (% w/w d.b.) | Non-Protein Matter Content 3 (% w/w d.b.) |
|---|---|---|---|
| LM | 2.55 ± 0.08 a | 45.0 ± 0.64 a | 42.45 |
| DF | 10.23 ± 0.24 d | 58.2 ± 1.19 d | 47.97 |
| DF-ASP | 6.10 ± 0.14 c | 67.2 ± 0.72 c (62.5 ± 4.23) c | 61.10 |
| DF-AΙP | 3.08 ± 0.03 b | 75.1 ± 0.16 e (32 ± 0.36) b | 72.02 |
| DF-SSP | 3.27 ± 0.29 b | 62.0 ± 0.80 b (12.5 ± 2.98) a | 58.73 |
| Sample | pH 3.0 | pH 7.0 | ||||||
|---|---|---|---|---|---|---|---|---|
| WBC (g/g) | OBC (g/g) | EAI0 m2/g | EAI10 m2/g | ESI % | EAI0 m2/g | EAI10 m2/g | ESI % | |
| LM | 3.06 c | 3.00 a | ||||||
| DF | 2.39 b | 3.44 b | ||||||
| DF-ASP | 0.00 a | 5.79 d | 27.82 ± 2.70 a | 17.47 ± 3.24 a | 26.96 | 147.82 ± 6.03 b | 33.84 ± 0.21 a | 14.58 |
| DF-AΙP | 10.54 e | 4.87 c | 45.75 ± 2.82 b | 33.59 ± 2.99 b | 37.58 | 112.02 ± 3.55 a | 35.19 ± 2.23 a | 12.99 |
| DF-SSP | 3.54 d | 8.62 e | 85.67 ± 5.45 c | 40.44 ± 2.09 c | 18.98 | 145.37 ± 1.57 b | 42.31 ± 2.56 b | 14.11 |
Publisher’s Note: MDPI stays neutral with regard to jurisdictional claims in published maps and institutional affiliations. |
© 2022 by the authors. Licensee MDPI, Basel, Switzerland. This article is an open access article distributed under the terms and conditions of the Creative Commons Attribution (CC BY) license (https://creativecommons.org/licenses/by/4.0/).
Share and Cite
Gkinali, A.-A.; Matsakidou, A.; Paraskevopoulou, A. Characterization of Tenebrio molitor Larvae Protein Preparations Obtained by Different Extraction Approaches. Foods 2022, 11, 3852. https://doi.org/10.3390/foods11233852
Gkinali A-A, Matsakidou A, Paraskevopoulou A. Characterization of Tenebrio molitor Larvae Protein Preparations Obtained by Different Extraction Approaches. Foods. 2022; 11(23):3852. https://doi.org/10.3390/foods11233852
Chicago/Turabian StyleGkinali, Alkmini-Anna, Anthia Matsakidou, and Adamantini Paraskevopoulou. 2022. "Characterization of Tenebrio molitor Larvae Protein Preparations Obtained by Different Extraction Approaches" Foods 11, no. 23: 3852. https://doi.org/10.3390/foods11233852