
Modification of Biotesting-Based Fermented Dairy Product Design for Curd and Curd Products
 , ,
, ,
Abstract
:
1. Introduction
- non-toxic: more than 100%;
- weakly toxic: 50–100%;
- toxic: less than 50%.
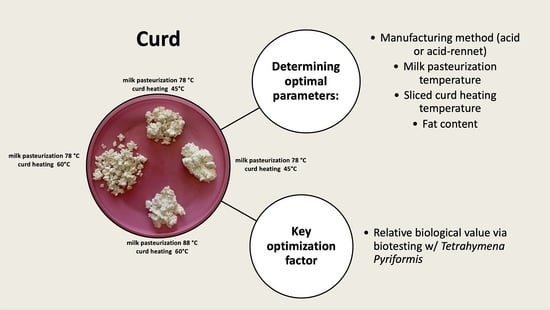
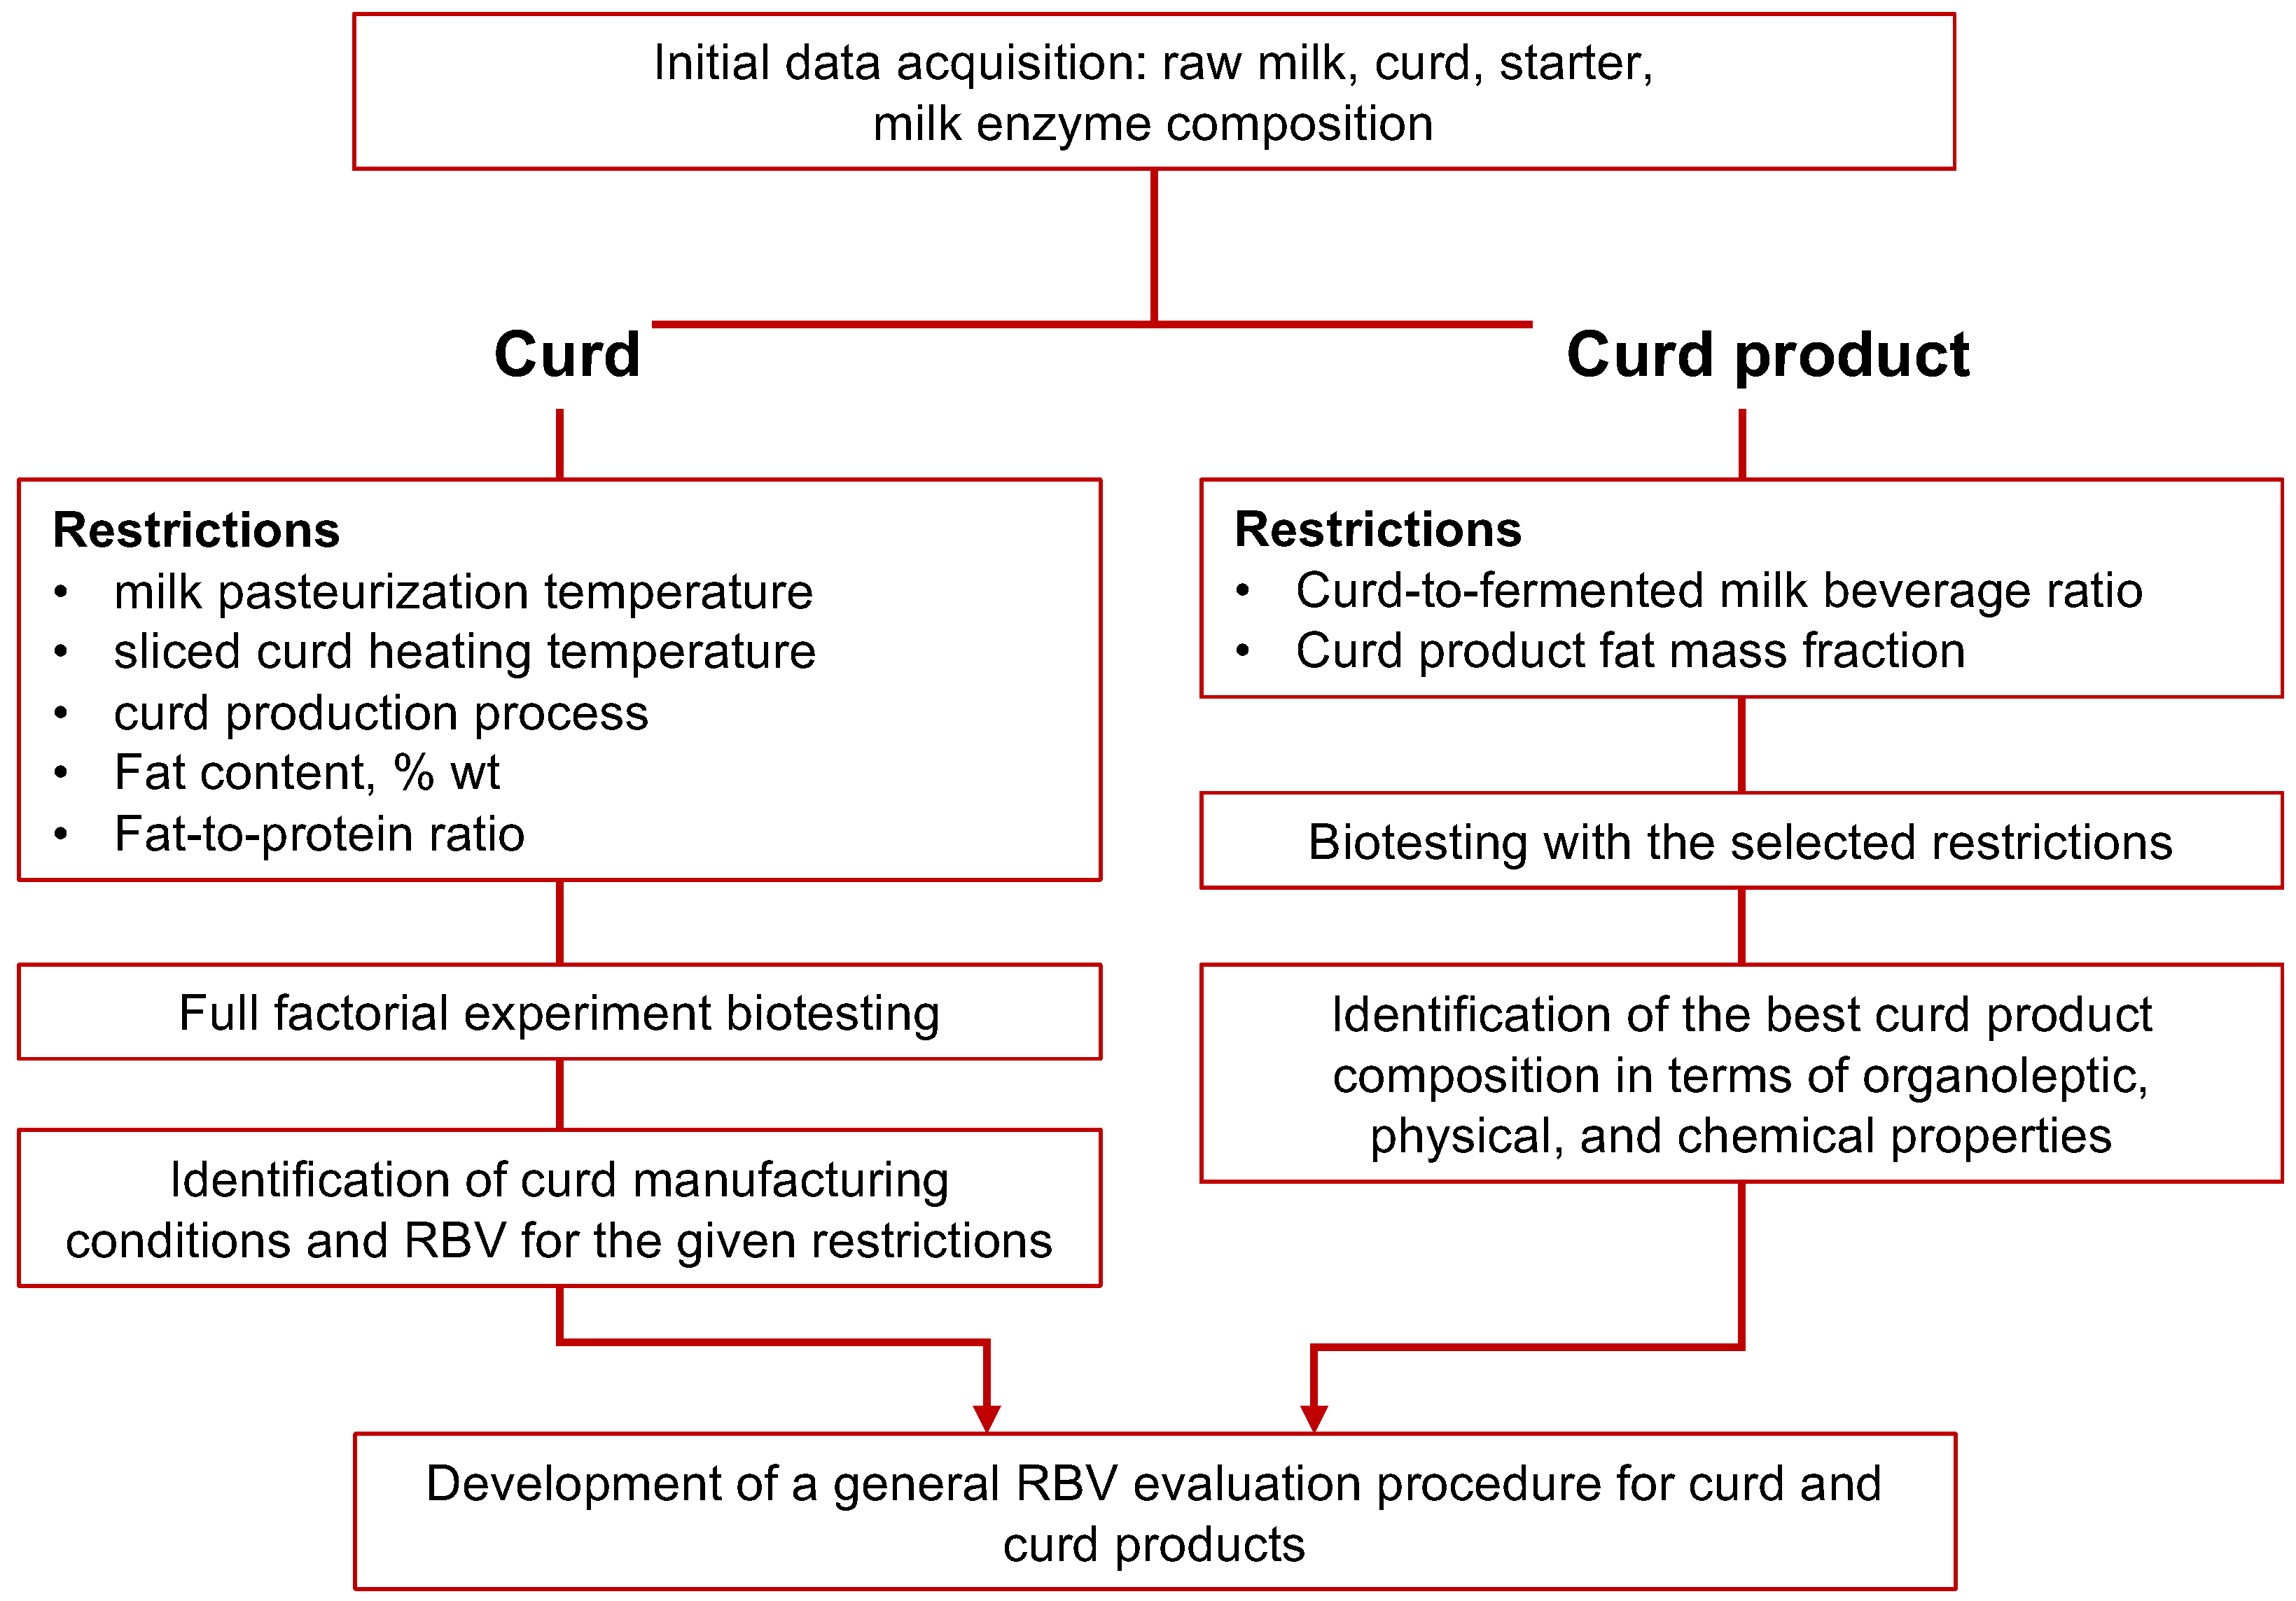
2. Materials and Methods
2.1. Curd Manufacturing
- There is no curd heating step for whey separation;
- The starter culture and calcium chloride enzyme rennet (enzyme composition: chymosin 70%, beef pepsin 30%) are also added.
2.2. Assessment of Physical, Chemical, and Rheology Properties
2.3. Express Biotesting of Curd Relative Biological Value
2.4. Curd Product Components Selection
2.5. Statistical Analysis
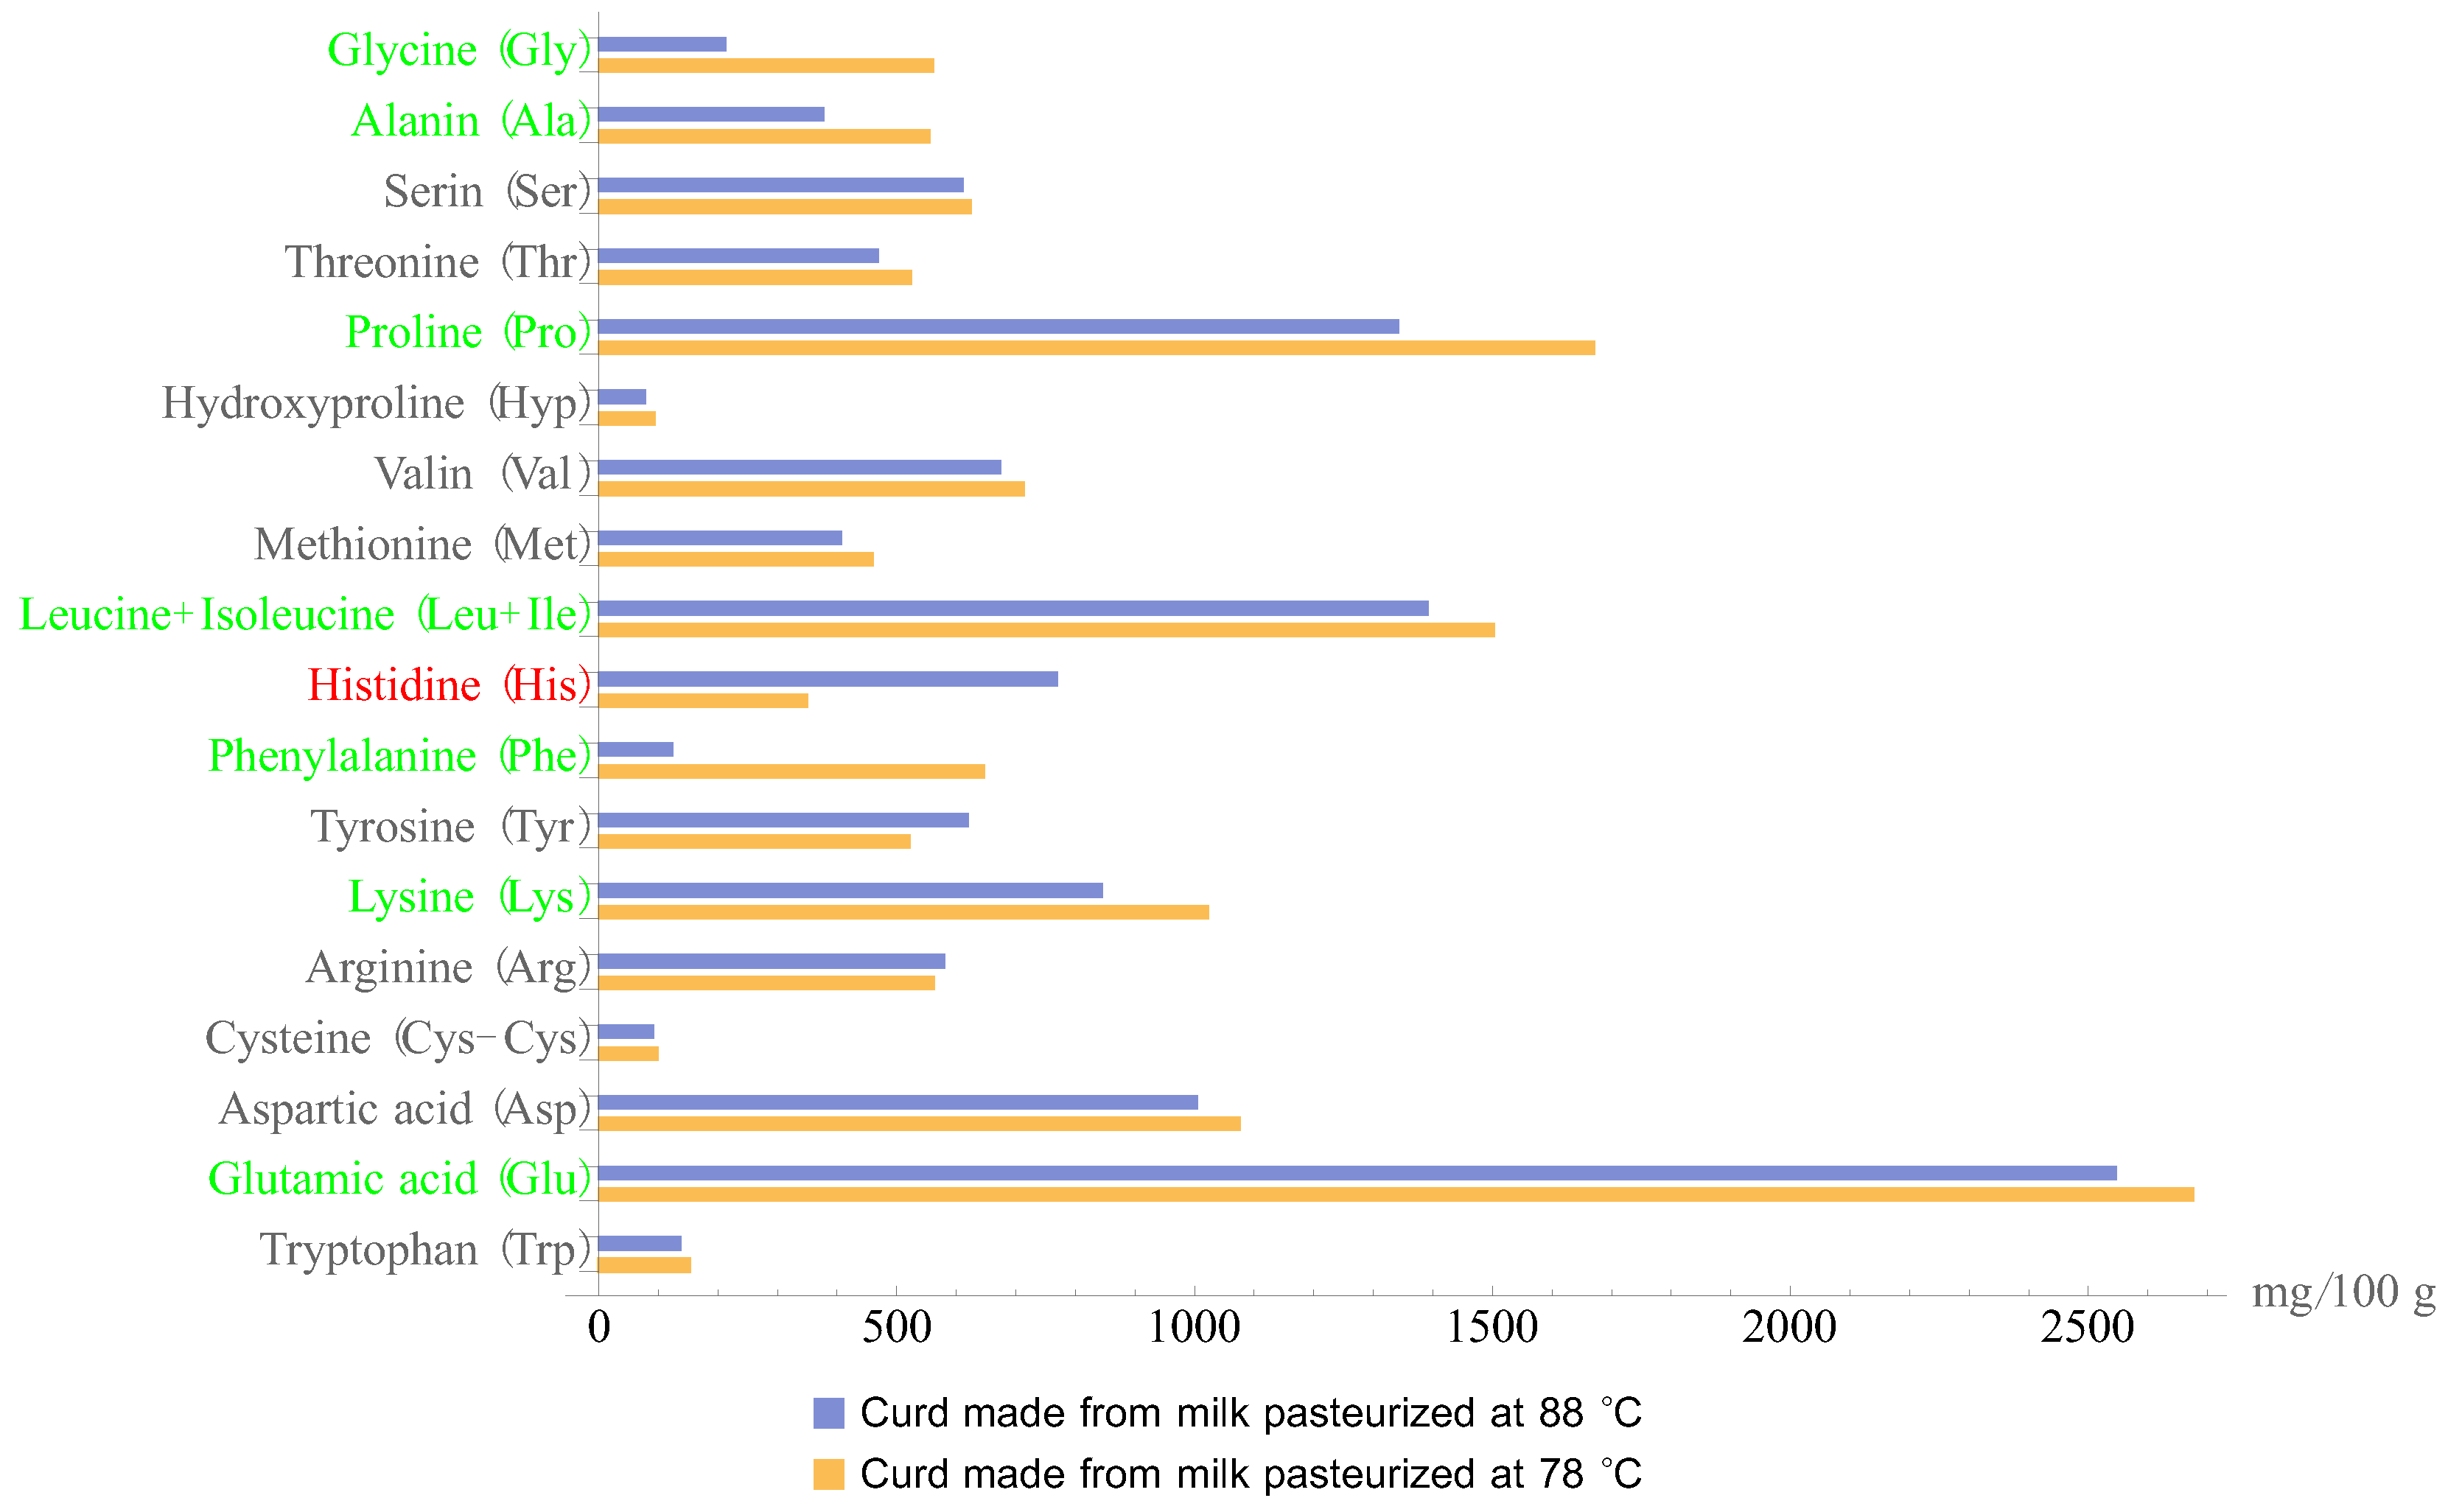
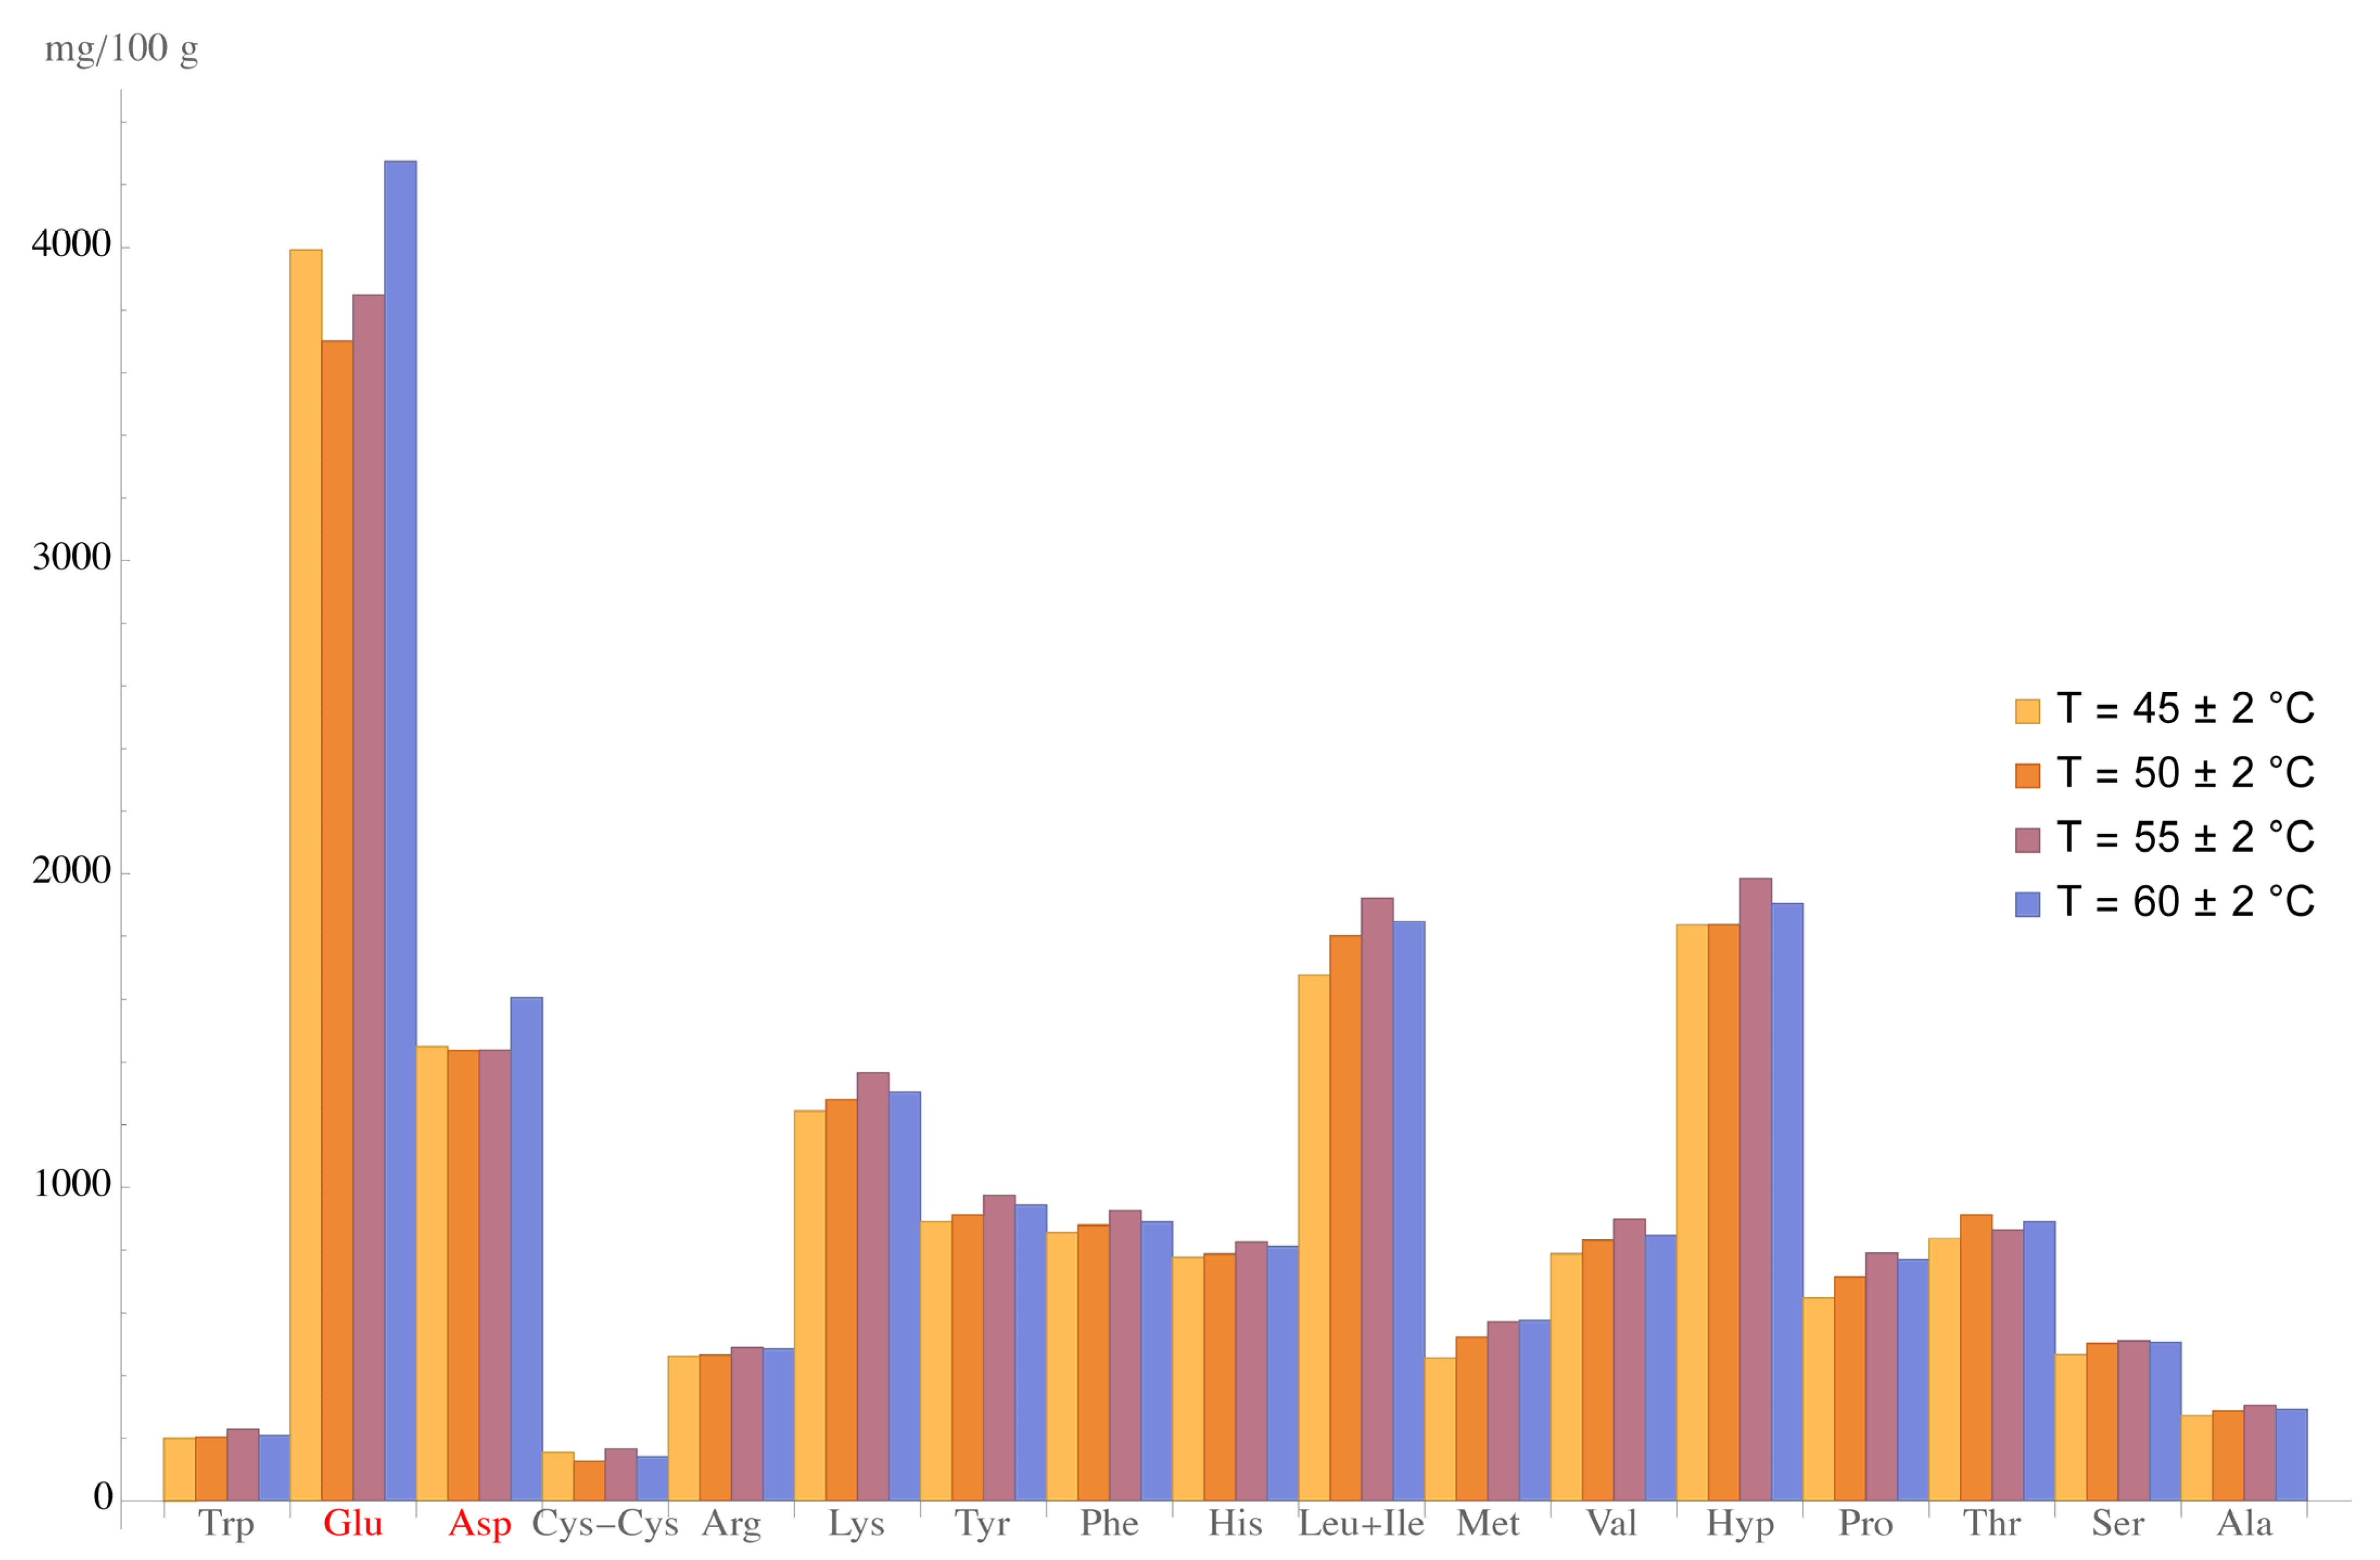
3. Results
3.1. Curd
3.2. Curd Product
4. Discussion
5. Conclusions
Author Contributions
Funding
Data Availability Statement
Conflicts of Interest
References
- Turovskaya, S.N.; Galstyan, A.G.; Petrov, A.N. Scientific and practical potential of dairy products for special purposes. Proceedings of the National Academy of Sciences of the Republic of Kazakhstan. Ser. Geol. Tech. Sci. 2018, 6, 16–22. [Google Scholar] [CrossRef]
- Agarkova, E.Y.; Kruchinin, A.G.; Ryazantseva, K.A. Modern Technological Approaches to the Enrichment of Dairy Products. In Innovative Technologies for the Enrichment of Dairy Products (Theory and Practice); Frontera: Moscow, Russia, 2016; pp. 110–142. [Google Scholar]
- Pryanichnikova, N.S.; Makeeva, I.A.; Fedotova, O.B. Methodological approaches to the selection and use of non-traditional functional ingredients in technologies for the enrichment of dairy products. In Innovative Technologies of Dairy Products Enrichment (Theory and Practice); Frontera: Moscow, Russia, 2016; pp. 173–241. [Google Scholar]
- Khurshudyan, S.A.; Pryanichnikova, N.S.; Ryabova, A.E. Food quality and safety. Transform. Concepts. Food Ind. 2022, 6, 8–10. [Google Scholar] [CrossRef]
- Yurova, E.A.; Kobzeva, T.V.; Filchakova, S.A. Standardization of measurement methods for the quality and safety of milk and its processed products. Milk Process. 2019, 241, 6–11. [Google Scholar] [CrossRef]
- Tutelyan, V.A.; Vyalkov, A.I.; Razumov, A.N.; Mikhailov, V.I.; Moskalenko, K.A.; Odinets, A.G.; Snezhneva, V.G.; Sergeev, V.N. Scientific Foundations of Healthy Nutrition; Publishing House “Panorama”: Moscow, Russia, 2010; p. 816. [Google Scholar]
- Pokrovsky, A.A. The Development of New Products of Increased Biological Value Is the Most Important Task of Nutrition Science: A Textbook; Medicine: Moscow, Russia, 1981; pp. 14–20. [Google Scholar]
- Council of Europe. European Convention for the Protection of Vertebrates Strasbourg Animals Used for Experiments or Other Scientific Purposes; Council of Europe: Strasbourg, France, 1986. [Google Scholar]
- Evans, E.; Carruthers, S. Comparisons of methods used for estimating the growth of Tetrahymena pyriformis. J. Sci. Food Agr. 1978, 29, 703–707. [Google Scholar] [CrossRef]
- Lisitskaya, T.B. Biotesting Using Infusoria Diss; Doctor of Biological Sciences: Saint Petersburg, Russia, 2007. [Google Scholar]
- Dolgov, V.A. Methodological Aspects and Practical Application of Accelerated Biological Assessment of Feed, Animal Products and Other Objects of Veterinary-Sanitary and Environmental Control. Ph.D. Thesis, Moscow State Technological University Stankin, Moscow, Russia, 1992; p. 320. [Google Scholar]
- Bondaruk, A.M.; Tsygankov, V.G.; Zhurikhina, L.N.; Fedorovich, S.V.; Gulin, V.V. Assessment of the biological value and harmlessness of food products in order to develop rations for tourist and recreational activities. Proc. BSTU 2016, 1, 225–230. [Google Scholar]
- Ziganshina, G.A.; Badanova, E.G.; Garipova, E.R.; Azizova, A.I.; Shcherbakova, Y.V.; Akhmadullina, F.Y. The method of biotesting is an alternative method for assessing changes in the quality of milk during its heat treatment. Butl. Messages 2015, 3, 156–159. [Google Scholar]
- Karpova, M.V.; Frolova, O.A. The use of Tetrahymena pyriformis to assess the relative biological value and toxicity of milk. Materials of the All-Russian XIII Congress of Nutritionists and Nutritionists with international participation. Pers. Diet. Present Future 2011, 1, 46–47. [Google Scholar]
- Butko, M.P.; Gerasimov, A.S.; Poskonnaya, T.F. Veterinary and Sanitary Requirements for Ensuring the Safety of Meat and Meat Products Production; Scientific Library: Moscow, Russia, 2017. [Google Scholar]
- Butko, M.P.; Popov, P.A.; Lavina, S.A. Biological value and toxico-biological indicators of pig slaughter products in echinococcosis and alveococcosis. Probl. Vet. Sanit. Hyg. Ecol. 2019, 32, 364–369. [Google Scholar]
- Popov, P.A.; Osipova, I.S. Determination of biological value and toxico-biological indicators of slaughter products in fascioliasis. Bull. Bashkir State Agrar. Univ. 2019, 52, 91–93. [Google Scholar]
- Butko, M.P.; Popov, P.A.; Lemyaseva, S.V. Falsification of animal products. Probl. Vet. Sanit. Hyg. Ecol. 2017, 23, 17–23. [Google Scholar]
- Butko, M.P.; Popov, P.A.; Lemyaseva, S.V. Animal growth stimulators and their application in animal husbandry. Probl. Vet. Sanit. Hyg. Ecol. 2017, 24, 14–20. [Google Scholar]
- Schlimme, W.; Marchiani, M.; Hanselmann, K.; Jenni, B. BACTOX, a rapid bioassay that uses protozoa to assess the toxicity of bacteria. Appl. Environ. Microbiol. 1999, 65, 2754–2757. [Google Scholar] [CrossRef] [PubMed] [Green Version]
- Zou, X.Y.; Xu, B.; Yu, C.P.; Zhang, H.W. Combined toxicity of ferroferric oxide nanoparticles and arsenic to the ciliated protozoa Tetrahymena pyriformis. Aquat. Toxicol. 2013, 134–135, 66–73. [Google Scholar] [CrossRef]
- Hajdu, C.; Gruiz, K.; Fenyvesi, É.; Nagy, Z.M. Application of cyclodextrins in environmental bioassays for soil. J. Incl. Phenom. Macrocycl. Chem. 2011, 70, 307–313. [Google Scholar] [CrossRef]
- Chaudhry, R.; Shakoori, A.R. Characterization of copper resistant ciliates: Potential candidates for consortia of organisms used in bioremediation of wastewater. Afr. J. Biotechnol. 2011, 10, 9101–9113. [Google Scholar]
- Bogdan, A.S.; Bondaruk, A.M.; Zhurikhina, L.N. The biological value of food grains of wheat, rye and barley according to the results of the evaluation of Tetrahymena pyriformis. Health Env. 2010, 16, 3–9. [Google Scholar]
- Bogdan, A.S.; Bondaruk, A.M.; Tsygankov, V.G. Methodological approaches to the assessment of the biological value and harmlessness of food products on Tetrahymena pyriformis. In Health and Environment: Collection of Scientific Works; Kosyachenko, G.E., Ed.; Ministry of Health, Hygiene Center: Minsk, Belarus, 2013; Volume 22, pp. 247–251. [Google Scholar]
- Zhurikhina, L.N.; Bondaruk, A.M.; Osipova, T.S. Determination of the biological value of enzymatic hydrolysate of cow’s milk whey proteins on Tetrahymena pyriformis. Health Environ. 2015, 1, 202–209. [Google Scholar]
- Levchuk, T.V.; Chesnokova, N.Y.; Levochkina, L.V. Investigation of safety and relative biological value of beverages based on Manchurian nut pericarp extract. Tech. Technol. Food Prod. 2016, 40, 96–102. [Google Scholar]
- Shulgin, Y.P.; Blinov, Y.G.; Shulgina, L.V. Biological express assessment of muscle tissue of hydrobionts using Tetrahymena pyriformis. Proc. TINRO Pac. Fish. Res. Cent. 2004, 136, 294–303. [Google Scholar]
- Zobkova, Z.S.; Zenina, D.V.; Fursova, T.P. Criteria for assessing the safety of dairy products with transglutaminase. Dairy Ind. 2015, 3, 48–51. [Google Scholar]
- Zobkova, Z.S.; Lazareva, E.G.; Semipyatniy, V.K. Methodological Approach to Designing Fermented Dairy Products with Optimal Biological Value. Foods 2022, 68, 114. [Google Scholar] [CrossRef]
- Zobkova, Z.S. Methodological aspects of designing whole-milk products with increased relative biological value. Food Ind. 2022, 3, 68–71. [Google Scholar]
- Drake, S.L.; Lopetcharat, K.; Drake, M.A. Comparison of Two Methods to Explore Consumer Preferences for Cottage Cheese. J. Dairy Sci. 2009, 12, 5883–5997. [Google Scholar] [CrossRef] [PubMed] [Green Version]
- Riaz, M.N.; Rokey, G.J. Impact of particle size and other ingredients on extruded foods and feeds. In Extrusion Problems Solved; Woodhead Publishing: Cambridge, UK, 2012; pp. 55–63. [Google Scholar]
- Vlodavets, I.N. Physicochemical mechanics. Russ. J. Phys. Chem. A 1999, 73, 1559–1566. Available online: https://www.scopus.com/record/display.uri?eid=2-s2.0-0033211838&origin=inward&txGid=f14c653f3e1422e39537533d8a91e32d (accessed on 7 September 2022).
- Kruchinin, A.G.; Turovskaya, S.N.; Illarionova, E.E.; Bigaeva, A.V. Comparative evaluation of milk protein coagulants of various origin. News of higher educational institutions. Food Technol. 2021, 379, 6–11. [Google Scholar] [CrossRef]
- Williams, K.; Sanders, T. The relationship between health and consumption of protein, carbohydrates and fat; Nutrition Issues. Vopr. Pitan. 2000, 69, 54–57. [Google Scholar]


| Property | Value |
|---|---|
| Appearance and texture | Soft, slightly spreadable, or crumbly texture, with or without perceptible milk protein particles. |
| Taste and flavor | Pure, fermented milk, no other flavors or odors. |
| Color | White and creamy, consistent. |
| Types of Curd by Fat Content | ||||
|---|---|---|---|---|
| Fat Content, %, Not Less | Fat-Free | 5.0 | 9.0 | 18.0 |
| Moisture mass fraction, %, max | 80.0 | 75.0 | 73.0 | 65.0 |
| Protein mass fraction, %,not less | 18.0 | 16.0 | 16.0 | 14.0 |
| Acidity, °T, not more | 240 | 230 | 220 | 210 |
| Phosphatase or peroxidase | Absent | |||
| Skim Milk Pasteurization Temperature, °C | Protein, wt. % | Moisture, wt.% | RBV, % |
|---|---|---|---|
| 78.0 ± 2.0 | 17.12 ± 0.28 a | 78.5 ± 5.5 | 100.0 a |
| 88.0 ± 2.0 | 16.58 ± 0.21 b | 79.5 ± 5.8 | 66.4 ± 4.6 b |
| Curd Heating Temp. of the Fat-Free Curd | Protein, wt.% | Moisture, wt.% | RBV, % |
|---|---|---|---|
| 45 ± 2 °C | 16.87 ± 0.17 a | 79.5 ± 3.5 | 100.0 a |
| 50 ± 2 °C | 17.43 ± 0.21 b | 78.5 ± 4.7 | 80.5 ± 5.6 b |
| 55 ± 2 °C | 18.15 ± 0.33 c | 78.1 ± 5.3 | 45 ± 3.15 c |
| 60 ± 2 °C | 18.23 ± 0.27 c | 78.0 ± 5.6 | 44.1 ± 3.1 c |
| Sample | Protein, wt.% | Moisture, wt. % | Penetration Depth, m | Ultimate Shear Stress Θₒ, Pa | RBV, % |
|---|---|---|---|---|---|
| Fat-free (acid curd) | 18.11 ± 0.9 | 72.0 ± 3.7 | 0.034 ± 0.002 | 4147.06 ± 207.35 | 100.0 a |
| Fat-free (fermented curd) | 17.47 ± 0.8 | 72.7 ± 5.3 | 0.035 ± 0.002 | 4028.06 ± 201.4 | 64.7 b |
| Sample | Protein, wt.% | Moisture, wt.% | RBV, % |
|---|---|---|---|
| Non-fat (0.5 wt.% fat) (Reference) (acid curd) | 18.89 ± 1.32 | 72.5 ± 5.07 | 100.0 a |
| 5 wt.% fat curd (acid curd) | 16.07 ± 1.12 | 72.0 ± 5.04 | 125.0 ± 8.75 b |
| 9 wt.% fat curd (acid curd) | 15.47 ± 1.01 | 70.0 ± 4.9 | 126.0 ± 8.82 b |
| 18 wt.% fat curd (fermented curd) | 14.26 ± 0.98 | 56.0 ± 3.94 | 150.0 ± 10.5 c |
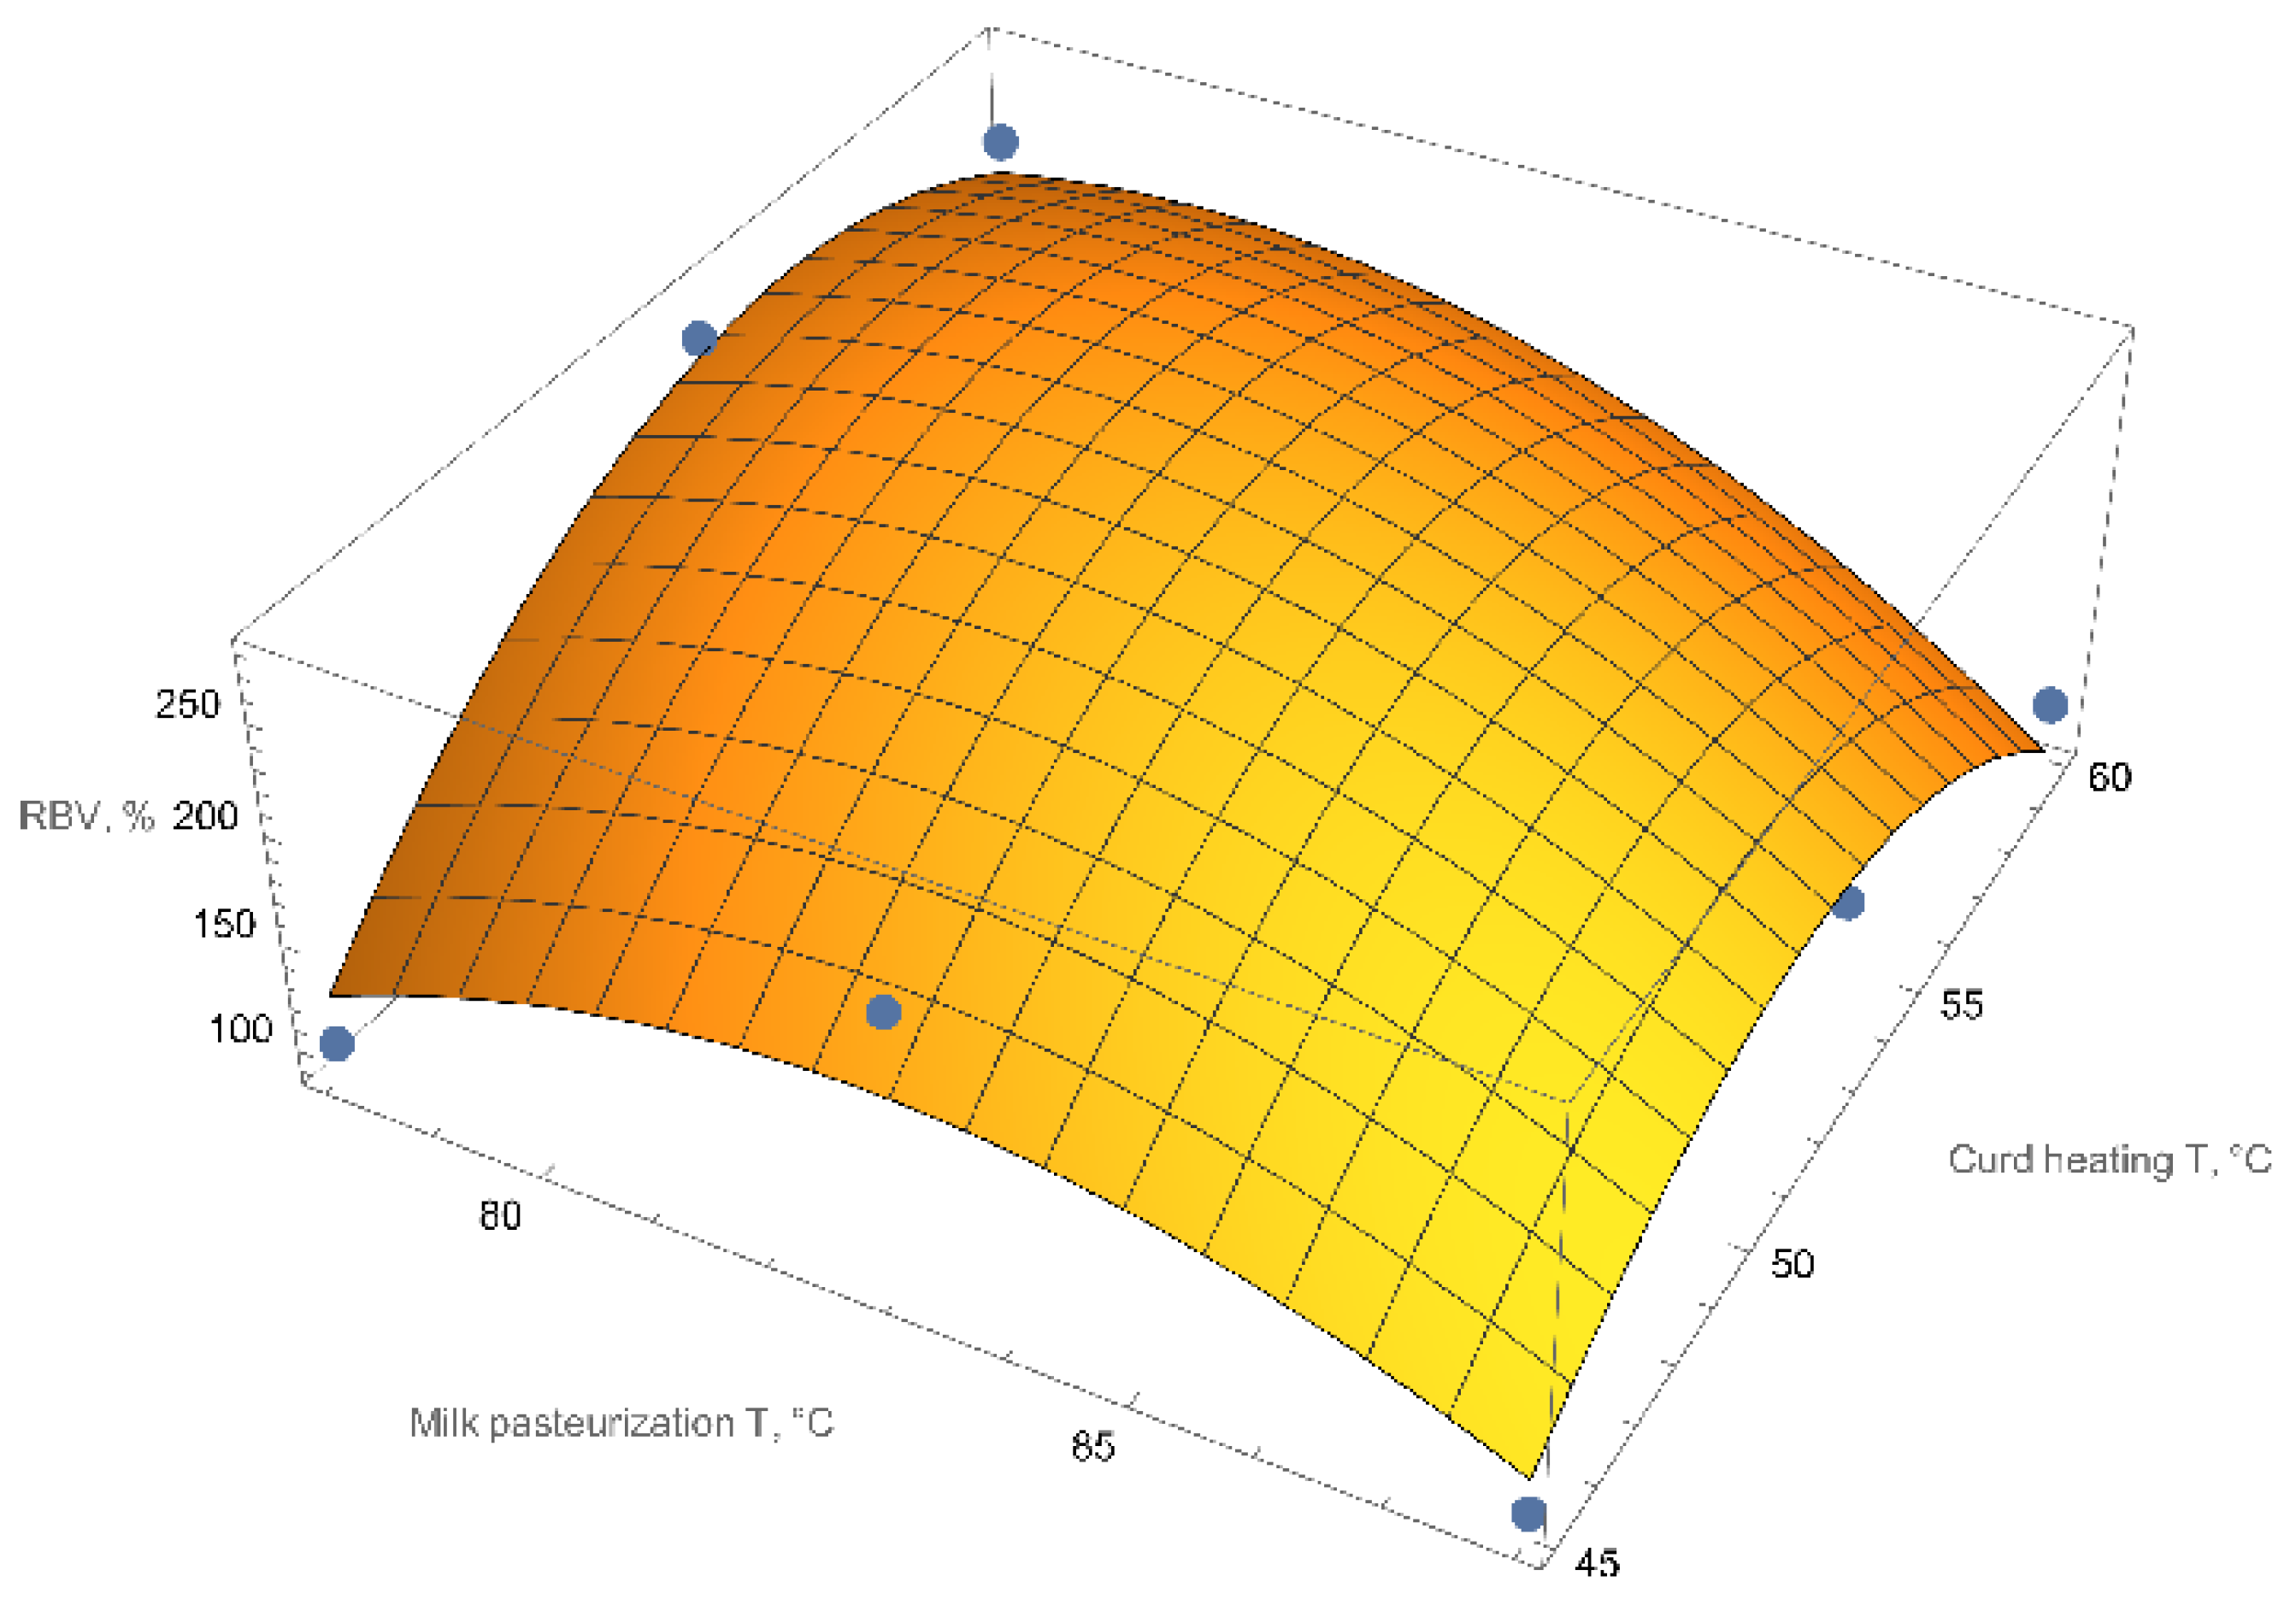
| Test No. | Milk Pasteurization T, °C | Curd Heating T, °C | RBV, % |
|---|---|---|---|
| 1 | 88 ± 2 | 60 ± 2 | 111 ± 5.5 |
| 2 | 88 ± 2 | 45 ± 2 | 95.5 ± 4.7 |
| 3 | 78 ± 2 | 60 ± 2 | 239 ± 11.9 |
| 4 | 78 ± 2 | 45 ± 2 | 100 ± 7.5 |
| 5 | 83 ± 2 | 60 ± 2 | 175 ± 8.75 |
| 6 | 83 ± 2 | 45 ± 2 | 213 ± 10.65 |
| 7 | 88 ± 2 | 53 ± 2 | 170 ± 8.5 |
| 8 | 78 ± 2 | 53 ± 2 | 264 ± 13.2 |
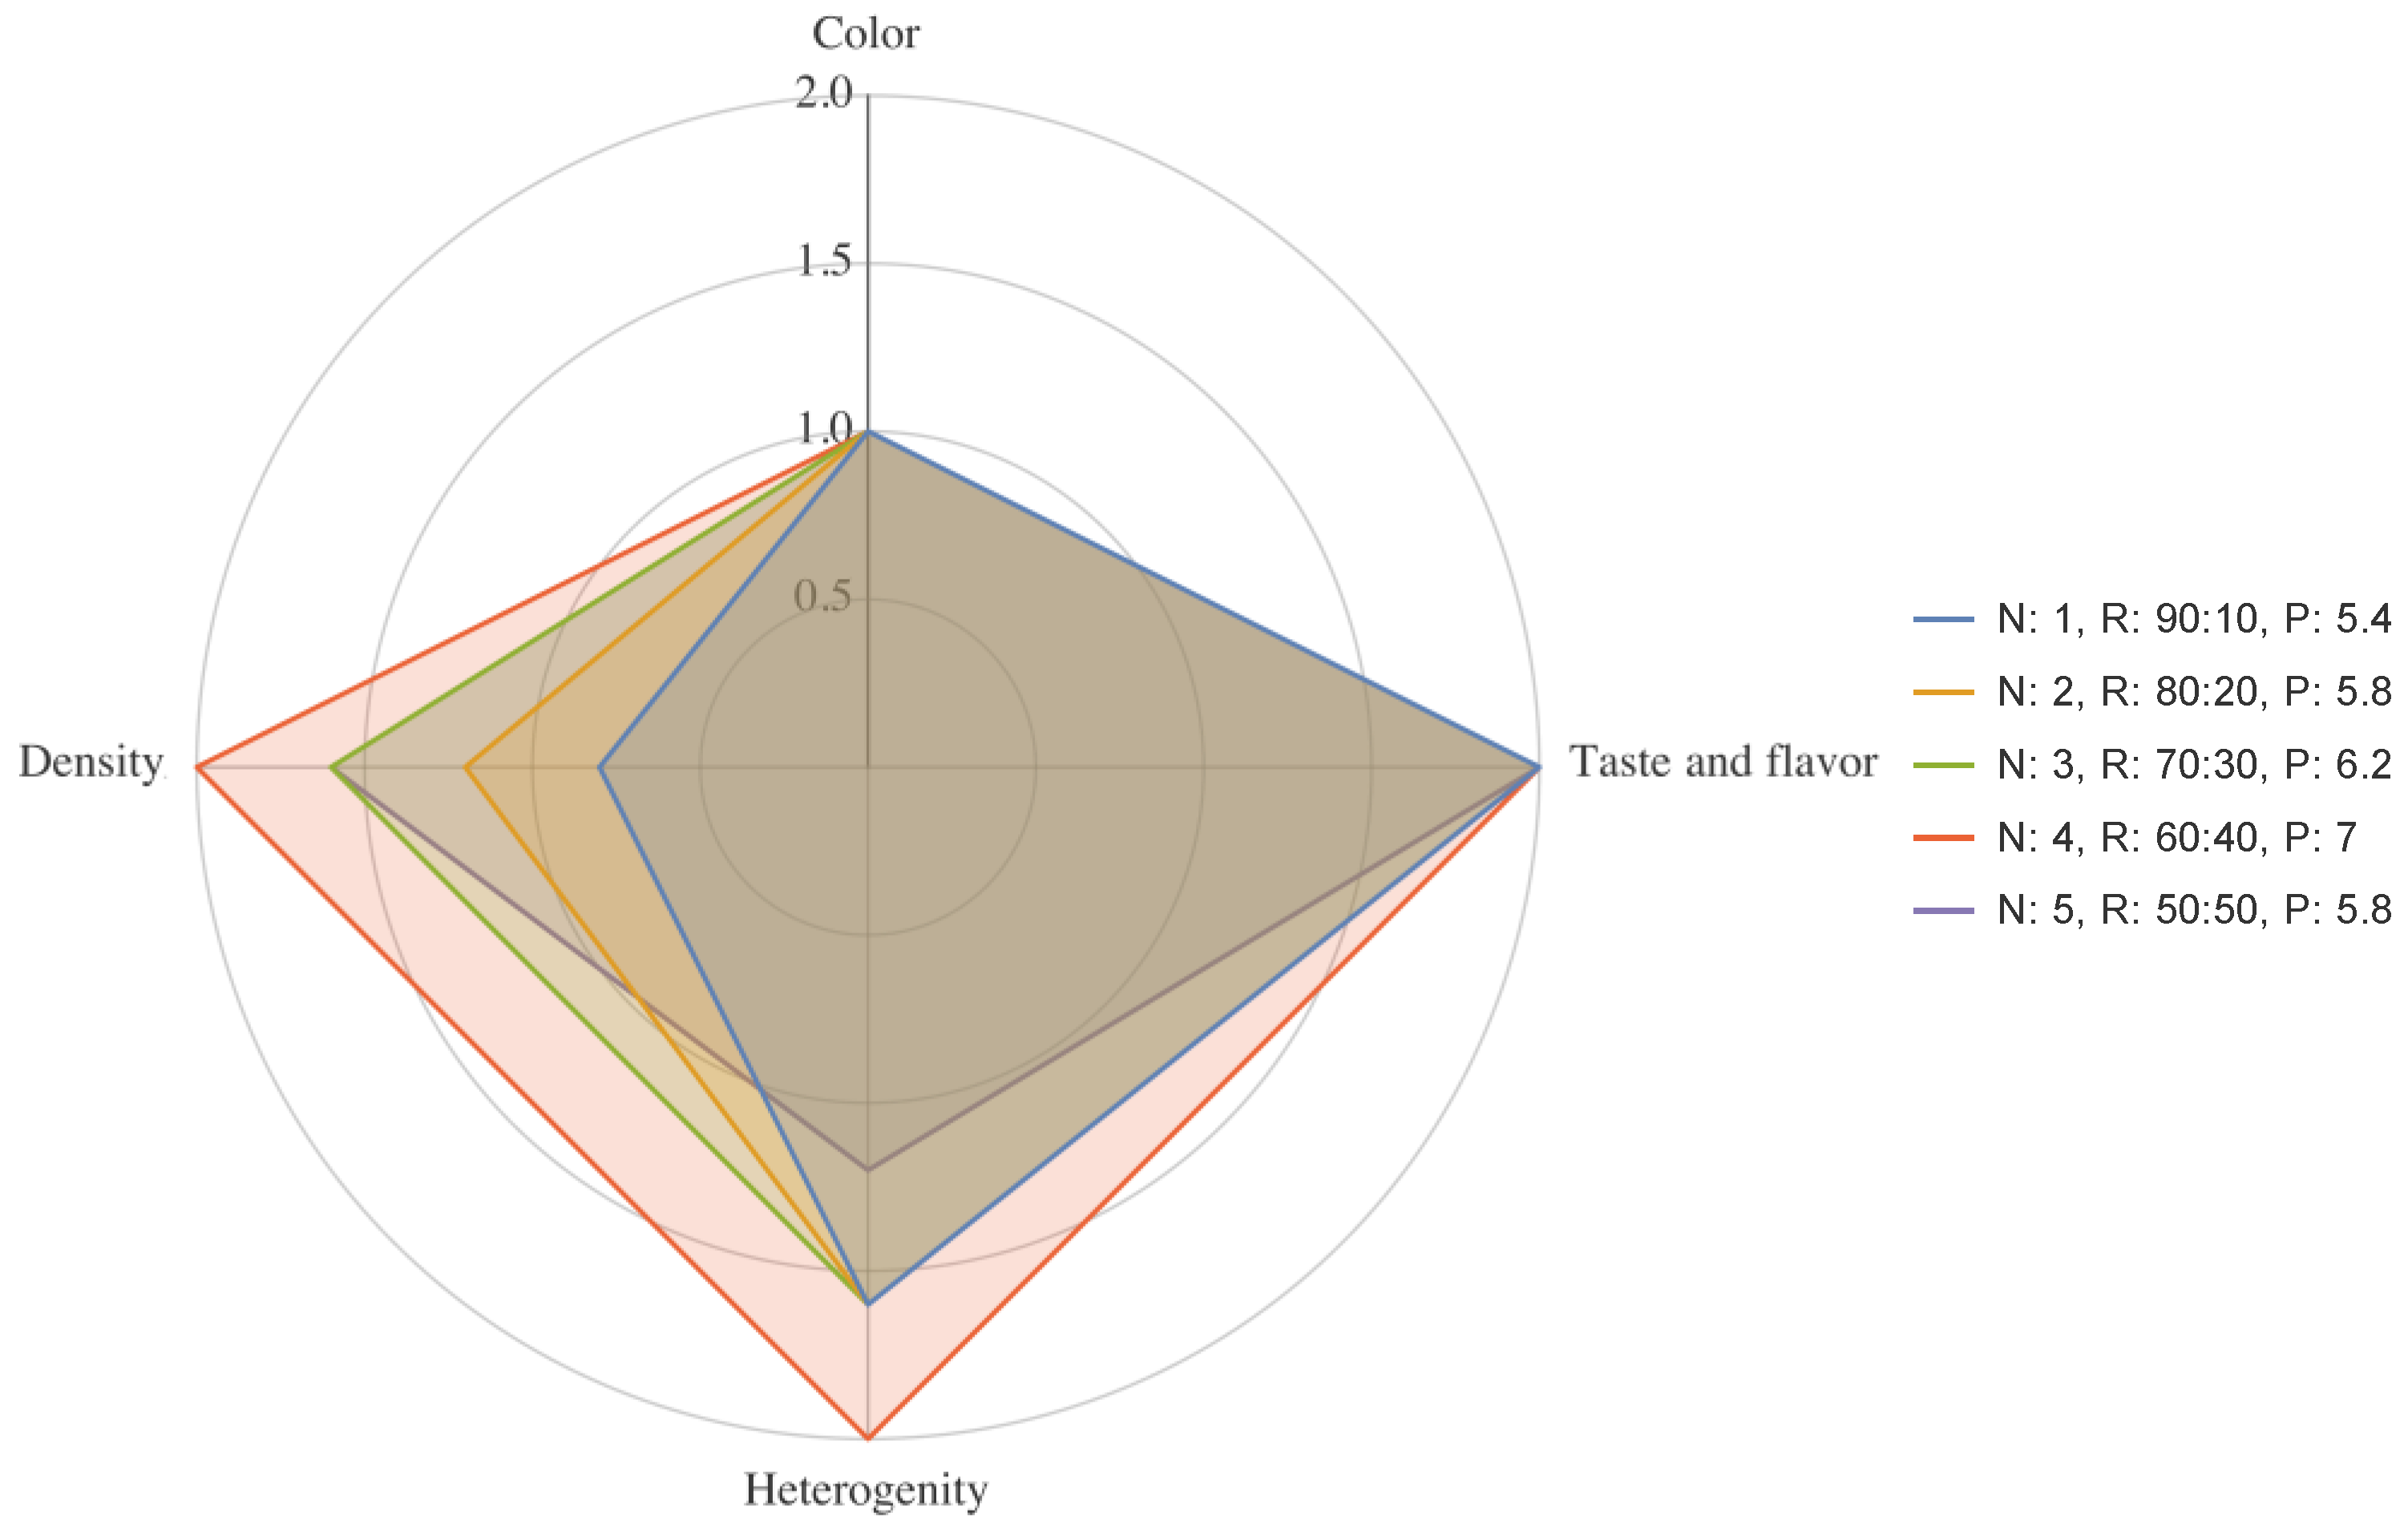
| Sample No. | Fat-Free Acid Curd | Fermented Dairy Beverage | RBV, % |
|---|---|---|---|
| No. 1 | 90 | 10 | 100 ± 3.35 a |
| No. 2 | 80 | 20 | 105 ± 5.35 a |
| No. 3 | 70 | 30 | 91 ± 4.45 a |
| No. 4 | 60 | 40 | 142 ± 9.1 b |
| No. 5 | 50 | 50 | 131 ± 7.55 b |
| Property | Points to Subtract (from Max Score of 5) | ||
|---|---|---|---|
| 1. Color (weight: 0.2) | Specific, milky-white or cream-colored, no defects | 0 | |
| Non-specific tone | not pronounced | 1 | |
| weak | 2 | ||
| clear | 3 | ||
| pronounced | 4 | ||
| Non-specific color | 5 | ||
| 2. Taste, flavor (weight: 0.4) | Fermented milk taste and flavor, expressed, pure | 0 | |
| Fermented milk, not pronounced, flat taste | 1 | ||
| Excessively acid taste and flavor | 2 | ||
| Off-flavor | weak | 2 | |
| clear | 3 | ||
| pronounced | 4 | ||
| Non-specific taste | 5 | ||
| 3. Texture, appearance (weight: 0.4) | Homogeneous, without defects | 0 | |
| Homogeneity deviations | slightly non-homogeneous | 1 | |
| lumpy, friable, insignificant whey separation | 2 | ||
| non-homogeneous, crumbly | 3 | ||
| non-homogeneous, pronounced protein particles and syneresis | 4 | ||
| Significantly non-homogeneous | 5 | ||
| Paste-like, spreadable, soft, moderately dense | 0 | ||
| Density deviations | soft, insufficient or excessive density, too viscous | 1 | |
| insufficient or excessive density | 2 | ||
| liquid or very viscous, very dense | 3 | ||
| liquid, stratified, coarse | 4 | ||
| Mushy | 5 | ||
| Group Number | Fat wt.% | Protein, wt.% | Moisture, wt.% | RBV, % |
|---|---|---|---|---|
| 1 | 0.08 | 12.0 ± 0.8 | 84.42 ± 5.9 | 100.0 ± 5.6 a |
| 2 | 3.0 ± 0.2 | 10.8 ± 0.7 | 82.72 ± 5.8 | 121.8 ± 7.51 b |
| 3 | 5.4 ± 0.4 | 10.6 ± 0.7 | 80.32 ± 5.6 | 94.5 ± 4.32 a |
| 4 | 10.8 ± 0.7 | 9.6 ± 0.6 | 75.64 ± 5.3 | 63.6 ± 2.52 c |
| Group Number | Moisture Holding Capacity, % | Relative Penetration, m | Ultimate Shear Stress Θₒ, Pa | Sample No. |
|---|---|---|---|---|
| 1 | 86.88 ± 6.08 | 0.0180 | 573.17 ± 40.12 | 1 |
| 2 | 80.8 ± 5.65 | 0.0172 | 507.19 ± 35.49 | 2 |
| 3 | 79.1 ± 5.53 | 0.0167 | 476.35 ± 32.71 | 3 |
| 4 | 74.0 ± 5.18 | 0.0157 | 435.18 ± 30.46 | 4 |
Publisher’s Note: MDPI stays neutral with regard to jurisdictional claims in published maps and institutional affiliations. |
© 2022 by the authors. Licensee MDPI, Basel, Switzerland. This article is an open access article distributed under the terms and conditions of the Creative Commons Attribution (CC BY) license (https://creativecommons.org/licenses/by/4.0/).
Share and Cite
Zobkova, Z.S.; Yurova, E.A.; Semipyatniy, V.K.; Lazareva, E.G.; Zenina, D.V.; Shelaginova, I.R. Modification of Biotesting-Based Fermented Dairy Product Design for Curd and Curd Products. Foods 2022, 11, 3166. https://doi.org/10.3390/foods11203166
Zobkova ZS, Yurova EA, Semipyatniy VK, Lazareva EG, Zenina DV, Shelaginova IR. Modification of Biotesting-Based Fermented Dairy Product Design for Curd and Curd Products. Foods. 2022; 11(20):3166. https://doi.org/10.3390/foods11203166
Chicago/Turabian StyleZobkova, Zinaida S., Elena A. Yurova, Vladislav K. Semipyatniy, Ekaterina G. Lazareva, Daria V. Zenina, and Irina R. Shelaginova. 2022. "Modification of Biotesting-Based Fermented Dairy Product Design for Curd and Curd Products" Foods 11, no. 20: 3166. https://doi.org/10.3390/foods11203166