Article

Comparative Profiling of Hot and Cold Brew Coffee Flavor Using Chromatographic and Sensory Approaches

1
National Engineering Research Center for Fruit and Vegetable Processing, Key Laboratory of Fruit and Vegetable Processing, Beijing Key Laboratory for Food Non-thermal Processing, Ministry of Agriculture and Rural Affairs, College of Food Science and Nutritional Engineering, China Agricultural University, Beijing 100083, China
2
Institute of Quality Standard & Testing Technology for Agro-Products, Chinese Academy of Agricultural Sciences, Key Laboratory of Agro-food Safety and Quality, Ministry of Agriculture and Rural Affairs, Beijing 100081, China
*
Author to whom correspondence should be addressed.
Foods 2022, 11(19), 2968; https://doi.org/10.3390/foods11192968
Submission received: 17 August 2022 / Revised: 15 September 2022 / Accepted: 15 September 2022 / Published: 22 September 2022

Abstract

:
Coffee brewing is a complex process from roasted coffee bean to beverage, playing an important role in coffee flavor quality. In this study, the effects of hot and cold brewing on the flavor profile of coffee were comprehensively investigated on the basis of chromatographic and sensory approaches. By applying gas chromatography–mass spectrometry and odor activity value calculation, most pyrazines showed higher contribution to the aroma profile of cold brew coffee over hot brew coffee. Using liquid chromatography, 18 differential non-volatiles were identified, most of which possessed lower levels in cold brew coffee than hot brew coffee. The sensory evaluation found higher fruitiness and lower bitterness and astringent notes in cold brew coffee than hot brew coffee, which was attributed by linalool, furfural acetate, and quercetin-3-O-(6″-O-p-coumaroyl) galactoside. This work suggested coffee brewing significantly affected its flavor profile and sensory properties.

1. Introduction

Coffee (Coffea sp.) is the second most globally traded commodity after petroleum [1] and accounts for broad market and high economic values. It is estimated that the worldwide production of coffee increased to 9.9 million tons in 2019 [2]. Coffee is popular among consumers due to its pleasant flavor profile. The flavor quality of coffee is principally determined by chemical components including volatile compounds, which contribute to the aroma properties, and non-volatile compounds to the taste. These flavor compounds can be significantly affected by many complex factors, such as processing method, roasting degree, and brewing method, which all consequently affect the consumer choice [3].
In recent years, the brewing process, as the final step closest to coffee consumption, is increasingly attracting the interest of food manufacturers. Extraction parameters play key roles in coffee sensory quality and flavor perception, such as the ground coffee particle size, extraction time, pressure, and temperature [4]. On the basis of the brewing temperature [5], it can be divided into classical hot brew coffee and novel cold brew coffee (≤25 °C). As reported by most sensory studies, cold brew coffee has been considered as fruity, floral, and sweet [5,6], while hot brew coffee possesses signature roasted and smoky-like smells [7].
Generally, the high temperature increases the kinetic energy of water molecules, which favor the leaching out of chemical compounds from the coffee powders. Meanwhile, the high temperature can affect the release of volatile compounds in coffee, thereby altering the sensory perception [8]. With advanced analytical techniques, chromatography–mass spectrometry was applied to compare the differences of physiochemical compounds between hot and cold brew coffee. In a comparative study on the volatiles in cold and hot brew Arabica coffee from Colombia with the medium roasting degree [9], it was reported that cold brew coffee with immersion extraction had a higher abundance in total furans and pyrazines than hot brew coffee by the French press method. As for non-volatiles, our previous study reported that the contents of physiologically functional norhorman and harman were richer in hot brew coffee with pour-over and boiled methods than cold brew coffee using liquid chromatography quadrupole time-of-flight mass spectrometry [10]. Interestingly, the hot brew coffee exhibited significantly higher bitterness and astringency over cold brew coffee [11], but no significant difference was detected in the quantities of a few common compounds associated with coffee bitterness, such as total caffeoylquinic acids, caffeine, and trigonelline [11,12]. Yet, a significant difference was frequently reported in previous sensory studies [4,5], especially in the flavor perception, between hot and cold brew coffee. Until now, very limited knowledge is available on the compounds that are responsible for the differential sensory profile between hot and cold brew coffee. Moreover, the coffee preparation in most studies referred to homemade process without standardization after coffee extraction, which would be of little help in understanding the coffee flavor for industrial processing. Therefore, a comprehensive analysis is needed.
The objective of this study was to compare the aroma-active compounds in hot and cold brew coffee by gas chromatography–mass spectrometry (GC-MS) and odor activity value calculation, to differentiate non-volatile compounds including organic acid, sugar, and phenolic compounds using the liquid chromatography with pulsed amperometric or mass detector and multivariate statistical analysis. Lastly, the sensory triangle test and quantitative descriptive analysis (QDA) of hot and cold brew coffee were conducted to tentatively figure out potential correlations between differential flavor compounds and sensory attributes of hot and cold brew coffee prepared on the basis of industrial processing.

2. Materials and Methods

2.1. Materials and Chemicals

The same commercial batch of medium-dark roasted Arabica coffee beans (Pacific, Shanghai, China) blended from Costa Rica, Colombia, and Indonesia were selected for coffee brewing, which were purchased from the local market in January 2020 in Beijing city. A total of 2.0 kg of coffee beans were fully mixed right before coffee preparation.
High-performance liquid chromatography (HPLC) grade of acetonitrile and methanol were purchased from Thermo-Fisher (Waltham, MA, USA). Formic acid, quinic acid, shikimic acid, malic acid, citric acid, tartaric acid, and oxalic acid were of HPLC grade and purchased from Sigma-Aldrich (St. Louis, MO, USA). HPLC grade of glucose, sucrose, fructose, maltose, arabinose, and galactose were from Sinopharm Chemical Reagent Co., Ltd. (Beijing, China). The 3-octanone standard was from TCI Chemical Industry (Tokyo, Japan). Other reagents used were of analytical grade and bought from Sinopharm Chemical Reagent Co., Ltd. (Beijing, China).

2.2. Coffee Preparation

Coffee beans were grounded by the semi-automatic grinder (E10, HERO, Beijing, China) and sieved to obtain 30-mesh to 60-mesh coffee powders for hot and cold brew coffee preparation. On the basis of previous studies with some modifications [13,14], a coffee machine (NC-F400, Panasonic, Tokyo, Japan) was used for hot brewing with a water-to-powder ratio of 10:1 (w/w). Briefly, 60 g of coffee powders were placed on a coffee filter paper (No. 4, Melitta, Germany) after 600 g of purified water was added into the machine. The water was heated to brew coffee with the outlet coffee extract temperature at 80 ± 3 °C, with the brewing time of approximately 6 min. For cold brew coffee, 60 g of coffee powders were placed into a 300-mesh filter bag and let soak in 600 g of purified drinkable water in a glass jar at room temperature (20 ± 3 °C) for 8 h, with the jar lid closed. Additional 120 g purified drinkable water was applied to rinse coffee powders and the rinsed liquid was collected into the jar and mixed with previous obtained cold brew coffee. The liquid in the jar was filtered through a coffee filter paper before sending for stock. Referring to industrial processing, hot and cold brew coffee were diluted to standardize to 2% total dissolved solids (TDS) for sensory and subsequential instrumental analysis, which was consistent with previous studies [6,12]. Hot and cold brew coffee preparation was performed in three replicates for each independent experiment.

2.3. Volatile Compound Analysis

2.3.1. Extraction of Volatile Compounds

Hot and cold brew coffee samples were sent to GC-MS to determine the volatile compounds. The extraction of volatile compounds in coffee was conducted using solid phase microextraction (SPME) as described by Pan et al. [15], with slight modifications. Coffee (4 mL) was transferred into a 20 mL headspace bottle containing 2.5 g NaCl and 50 μL of 3-octanone (8.2 mg/L in methanol, as internal standard). The bottle was sealed by PTFE-silicone septum and equilibrated at 60 °C for 10 min with agitation. Next, a 50/30 μm divinylbenzene/carboxenTM/polydimethylsiloxane SPME fiber was exposed to the headspace of the coffee for 45 min at the same temperature without stirring. Finally, the fiber was obtained and introduced into the gas chromatography injector at 250 °C for 5 min.

2.3.2. Gas Chromatography–Mass Spectrometry

GC-MS analysis was carried out according to the method described by Heo et al. [14] using an Agilent 7890 gas chromatography system (Agilent Technologies, Santa Clara, CA, USA) equipped with an Agilent 5975C series mass spectrometer. The volatile compounds were isolated with HP-INNOWAX (30 m × 0.25 mm i.d. × 0.25 μm; Agilent Technologies) fused silica capillary columns. The carrier gas was helium at a rate of 1 mL/min constant flow. The oven temperature was held at 40 °C for 10 min, ramped at the rate of 8 °C/min to 180 °C, followed by ramping to 280 °C at the rate of 10 °C/min for 10 min. Mass spectrometry was carried out at an electron impact mode of 70 eV with a scan range of m/z 33–550. The volatile compounds were identified on the basis of the matching of the mass spectra with those in the standard NIST10 database. The quantification of volatile compounds was performed using peak areas normalized with 3-octanone added to each sample as an internal standard.

2.3.3. Identification of Aroma-Active Compounds

Odor activity value (OAV) was the ratio of concentration to odor threshold [16]. In most cases, the OAV value > 1 means the compound contributes to the overall coffee aroma profile.

2.4. Non-Volatile Compound Measurement

2.4.1. Organic Acid and Sugar Profile Analysis

Coffee samples of 5 mL were centrifuged at 9000× g for 5 min, and the supernatant was collected for chromatographic analysis. According to previous reports [17,18] with some modification, the supernatant was passed through a 0.22 μm filter membrane before being injected into a Diane ICS-3000 ion chromatography coupled with a pulsed amperometric detector for analysis.
Acid chromatographic separation was achieved using the ion chromatography column (Dionex IonPacTM AS11-HC, 4 × 250 mm), with 20 μL injection volume and 0.60 mL/min flow rate, at 65 °C. Sulfuric acid solution (0.005 mol/L) was set to the eluent. External Standard solutions were applied for qualitative and quantitative analysis, which were quinic acid, shikimic acid, malic acid, tartaric acid, oxalic acid, and citric acid.
Sugar chromatographic separation was conducted by the ion chromatography column (Dionex CarboPacTM PA20, 3 × 150 mm, pre-PA20, 3 × 30 mm guard column), with the 30 °C column temperature. The solvent system was water (eluent A) and 200 mmol/L NaOH solution (eluent B): 0–20 min, 95% A; 20–30 min, 80% A; 30–40 min, 0% A; 40–50 min, 95% A. The flow rate was 0.4 mL/min, and the injection volume was 20 μL. Arabinose, galactose, glucose, sucrose, fructose, and maltose external standard solutions were also applied. Retention times of the external standard solution were used for qualitative analysis, and peak areas were used for quantitative analysis.

2.4.2. Ultra-Performance Liquid Chromatography–Tandem Mass Spectrometry (UPLC-MS/MS)

The extract was vortexed for 5 min, 500 μL coffee was added to 500 μL of 70% methanol solution, and then the extract was vortexed for 15 min. Following centrifugation at 12,000× g for 3 min, the extract was filtered through a 0.22 μm filter (SCAA-104; ANPEL, Shanghai, China) before analysis by UPLC-MS/MS.
According to Li et al. [19], with slight modification, non-volatile analysis of hot and cold brew coffee was carried out on a UPLC-MS/MS system consisting of a Nexera X2 UPLC system (Shimadzu, Kyoto, Japan), connected to a 4500 QTRAP mass system (Applied Biosystems, Waltham, MA) equipped with an electrospray ion source (ESI). The SB-C18 column (2.1 × 100 mm, 1.8 μm; Agilent Technologies, Santa Clara, CA, USA) was used for the chromatographic separation at 40 °C. The binary mobile phase consisted of water with 0.1% formic acid (eluent A) and acetonitrile with 0.1% formic acid (eluent B). The flow rate was 0.35 mL/min, and the gradient elution was carried out as follows: 0–9.00 min, 5−95% B; 9.00–10.00 min, 95% B; 10.00–11.10 min, 95−5% B; 11.10–14.00 min, 5% B. Samples (4 μL) were eluted at 0.45 mL/min.
Linear ion trap and triple quadrupole scans were performed using a triple quadrupole–linear ion trap (QTRAP) mass spectrometer (AB4500 QTRAP UPLC/MS/MS System). Sequence analyses were carried out in positive ion mode (ion spray voltage of 5500 V) and negative ion mode (ion spray voltage of −4500 V) with an ion source temperature of 550 °C. The pressures of the ion source gases I and II and the curtain gas were set at 345, 414, and 172 kPa, respectively. Instrument tuning and mass calibration were performed with 10 and 100 μmol/L polypropylene glycol solutions in triple quadrupole and linear ion trap modes, respectively. The data were collected at a scan range of m/z 100−1200.
The triple quadrupole scans were performed as multiple reaction monitoring (MRM) mode with the pressure of the collision gas (nitrogen) set to medium. The declustering potential and collision energy were selected for the individual MRM transitions and were then further optimized. A specific set of MRM transitions were monitored for each period according to the compounds eluted within this period.

2.5. Color Analysis

Colors of the hot and cold brew coffee were measured using a spectrophotometer (Hunterlab ColorQuest XE) at the transmission mode, D65 illuminant, 0.375 inch observation aperture, and 10° observation angle. A cuvette with a light path of 5 mm was applied in this study. The L*a*b* values of hot and cold brew coffee samples were determined after calibration. L* represents lightness, and a* and b* are chromaticity indexes. The total color difference (ΔE) of the two coffee was calculated via
Δ E = ( L * cold   L * hot ) 2 + ( a * cold a * hot ) 2 + ( b * cold b * hot ) 2

2.6. Sensory Evaluation

All sensory evaluation was conducted at room temperature. Coffee samples were brought out from the refrigerator and let set at room temperature until 20 ± 3 °C for panel tasting.

2.6.1. Sensory Triangle Test

A total of 48 university students were recruited (age 19–22, 18 males and 30 females) for the sensory triangle test. According to ISO [20], three randomly coded hot and cold brew coffee samples were presented to the sensory panelist, two of which were the same and the other was different. The sensory panel was asked to select the sample different from the others. The test was carried out under red illuminant in order to avoid the interference of the coffee color difference.

2.6.2. Sensory Quantitative Descriptive Analysis

The descriptive sensory panel consisted of 7 university students (age 19–22, 2 males and 5 females) with regular coffee consumption at least 3 years. All panelists previously participated in at least 3 rounds of training on the identification and differentiation of the basic sensory attributes in coffee. To train panelists to understand sensory attributes of coffee, description vocabulary and their intensity scoring standards of coffee sensory evaluation were as shown in Table S1 [5,21]. After training, intensities of sensory attributes in hot and cold brew coffee were evaluated by the panel. Consistent with other sensory quantitative descriptive analysis [22], the panel was asked to evaluate coffee visual appearance and gave a score for color under the natural lighting condition, then took a deep smell of the coffee to evaluate the intensity of aroma before drinking it to evaluate its taste. The sensory description vocabulary of coffee included dark-colored, nutty aroma, coffee aroma, fruity aroma, sweetness, sourness, bitterness, and astringency, with the intensity score ranging 1–5 points.

2.7. Data Processing and Multivariate Statistical Analysis

Data were reported as mean ± standard deviation. Student’s t-tests were performed using SPSS Statistics 26 (IBM, Armonk, NY, USA) at a 95% significant level.
The LC-MS/MS raw data signals were processed by Analyst 1.6.3 software (AB Sciex, Framingham, MA, USA). Principal component analysis (PCA), hierarchical cluster analysis (HCA), and orthogonal partial least-squares discriminant analysis (OPLS-DA) were carried out by the R software package (www.r-project.org) to visualize the differences between hot and cold brew coffee. Heatmap analysis and cluster analysis of non-volatiles were performed using R on the basis of their signal abundances in hot and cold coffee.

3. Results and Discussion

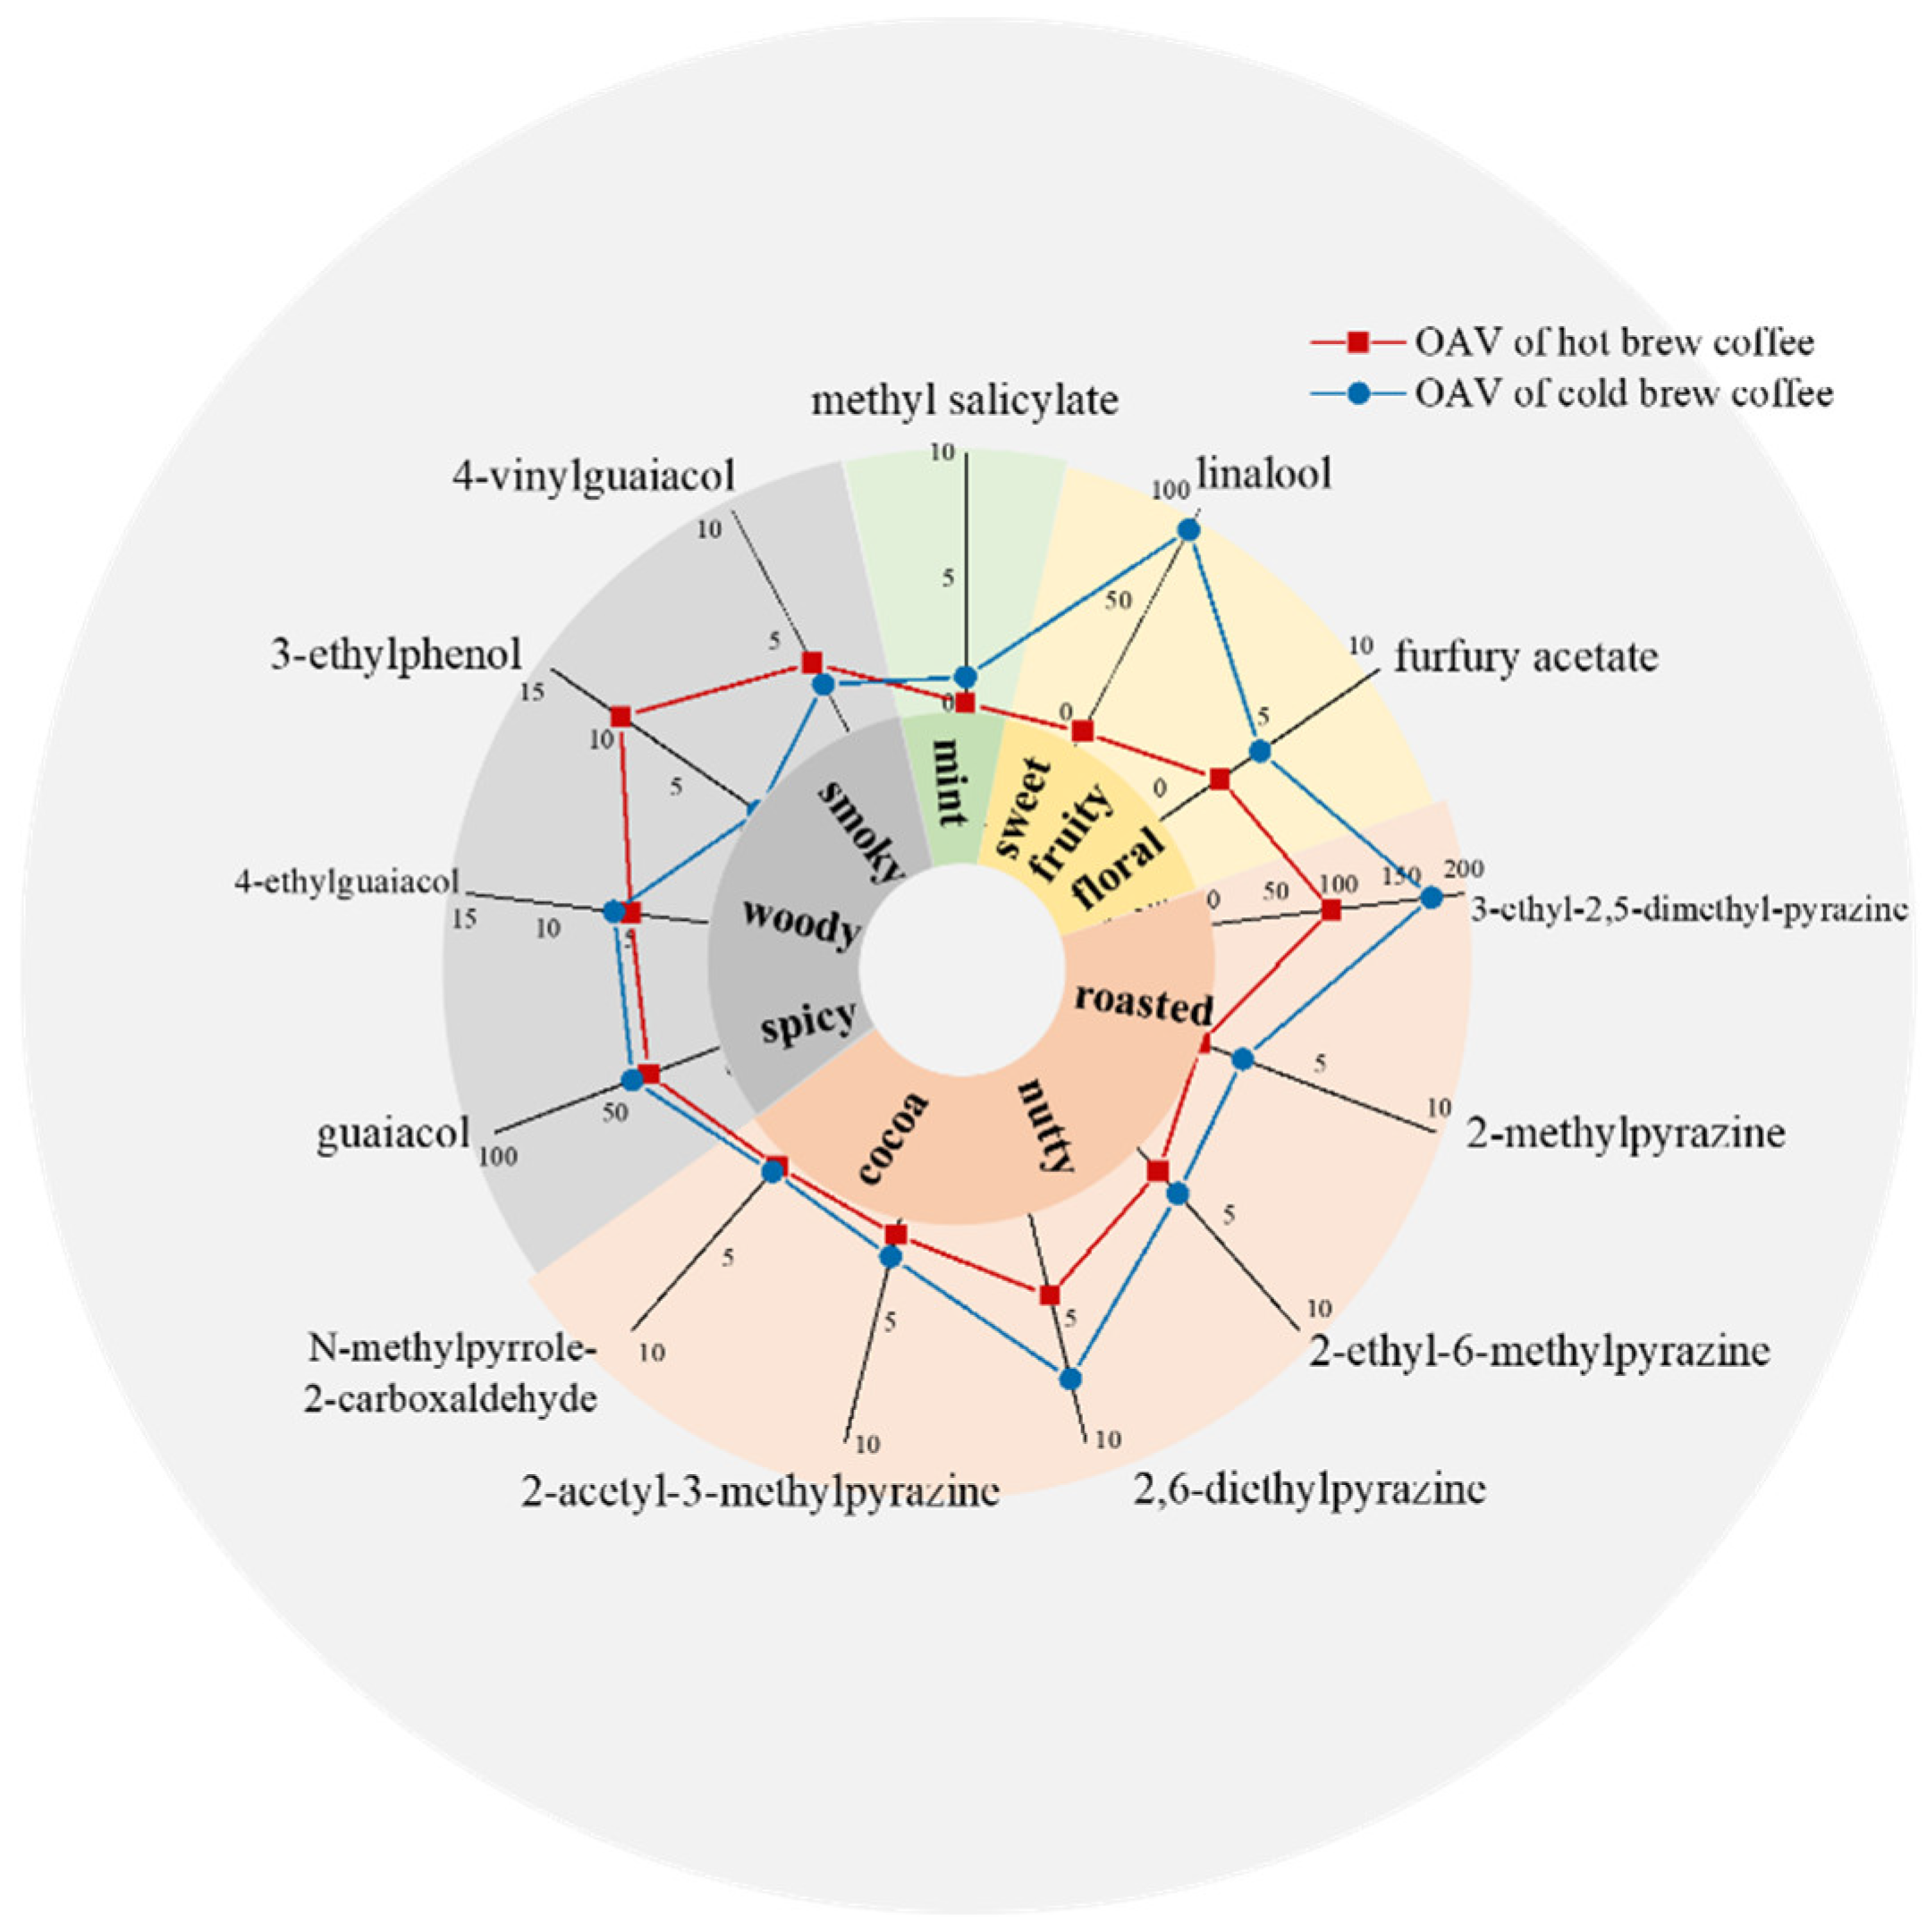
3.1. Volatile Compound Profile

As shown in Table 1, a total of 40 volatile compounds were identified, including 12 pyrazines, 9 phenols, 7 furans, 4 aldehydes, 3 ketones, and others. To further evaluate the potency of aroma compounds to the flavor profile, OAV was determined, as shown in Table 1. As shown in Figure 1, concentrations of 13 volatiles in coffee exceeded their respective threshold value, and thus these compounds with OAV > 1 have high chances of being the major aroma contributors to coffee. Among them, 11 aroma-active compounds have been identified in previous research on coffee brewed with French press, coffee machine, and in ready-to-drink coffee [23,24].
Pyrazines and furans were reported as the largest shares of volatiles in coffee [25], mainly formed by the Maillard reaction during coffee bean roasting [3]. As key contributors to coffee aroma, OAVs of total pyrazines accounted for over 60% of 13 aroma-active compounds, whose contribution in cold brew coffee was almost as twice as that of in hot brew coffee (Table 1), among which, 2-methylpyrazine was only detected in cold brew coffee, requiring further study to be clarified. Although abundant in coffee, furans made limited contributions to coffee aroma, due to relatively high recognition thresholds of furans [3]. Only the furfuryl acetate was identified as aroma-active furan (Figure 1), with higher OAV of 4.23 in cold brew coffee than in hot brew coffee. Generally, the high temperature increased the saturated vapor pressure, thereby adding the losses of volatile compounds [26]. It can be used to explain higher contents of pyrazine and furan compounds in cold brew coffee, which was consistent with previous studies [9]. Moreover, 4-ethylguaiacol, 3-ethylphenol, 4-vinylguaiacol, and guaiacol, as common phenolic volatiles identified as aroma-active compounds of coffee, were produced from the degradation of chlorogenic acids during green coffee bean roasting [3]. Different phenolic volatile change tends were observed between hot and cold brew coffee, which could be explained in that brewing methods could affect concentrations of these compounds through both the extraction temperature and time.
Among aroma-active compounds, linalool and methyl salicylate were only detected in cold brew coffee, and the content of N-methylpyrrole-2-carboxaldehyde in cold brew coffee was significantly higher than hot brew (Table 1). During the fermentation process of green coffee beans, linalool and methyl salicylate can be produced by various microorganisms [27], which can still keep in detectable concentrations after coffee bean roasting [28]. As an endogenous component in coffee, however, N-methylpyrrole-2-carboxaldehyde was potentially hazardous, which needs to be avoided during coffee preparation [29].

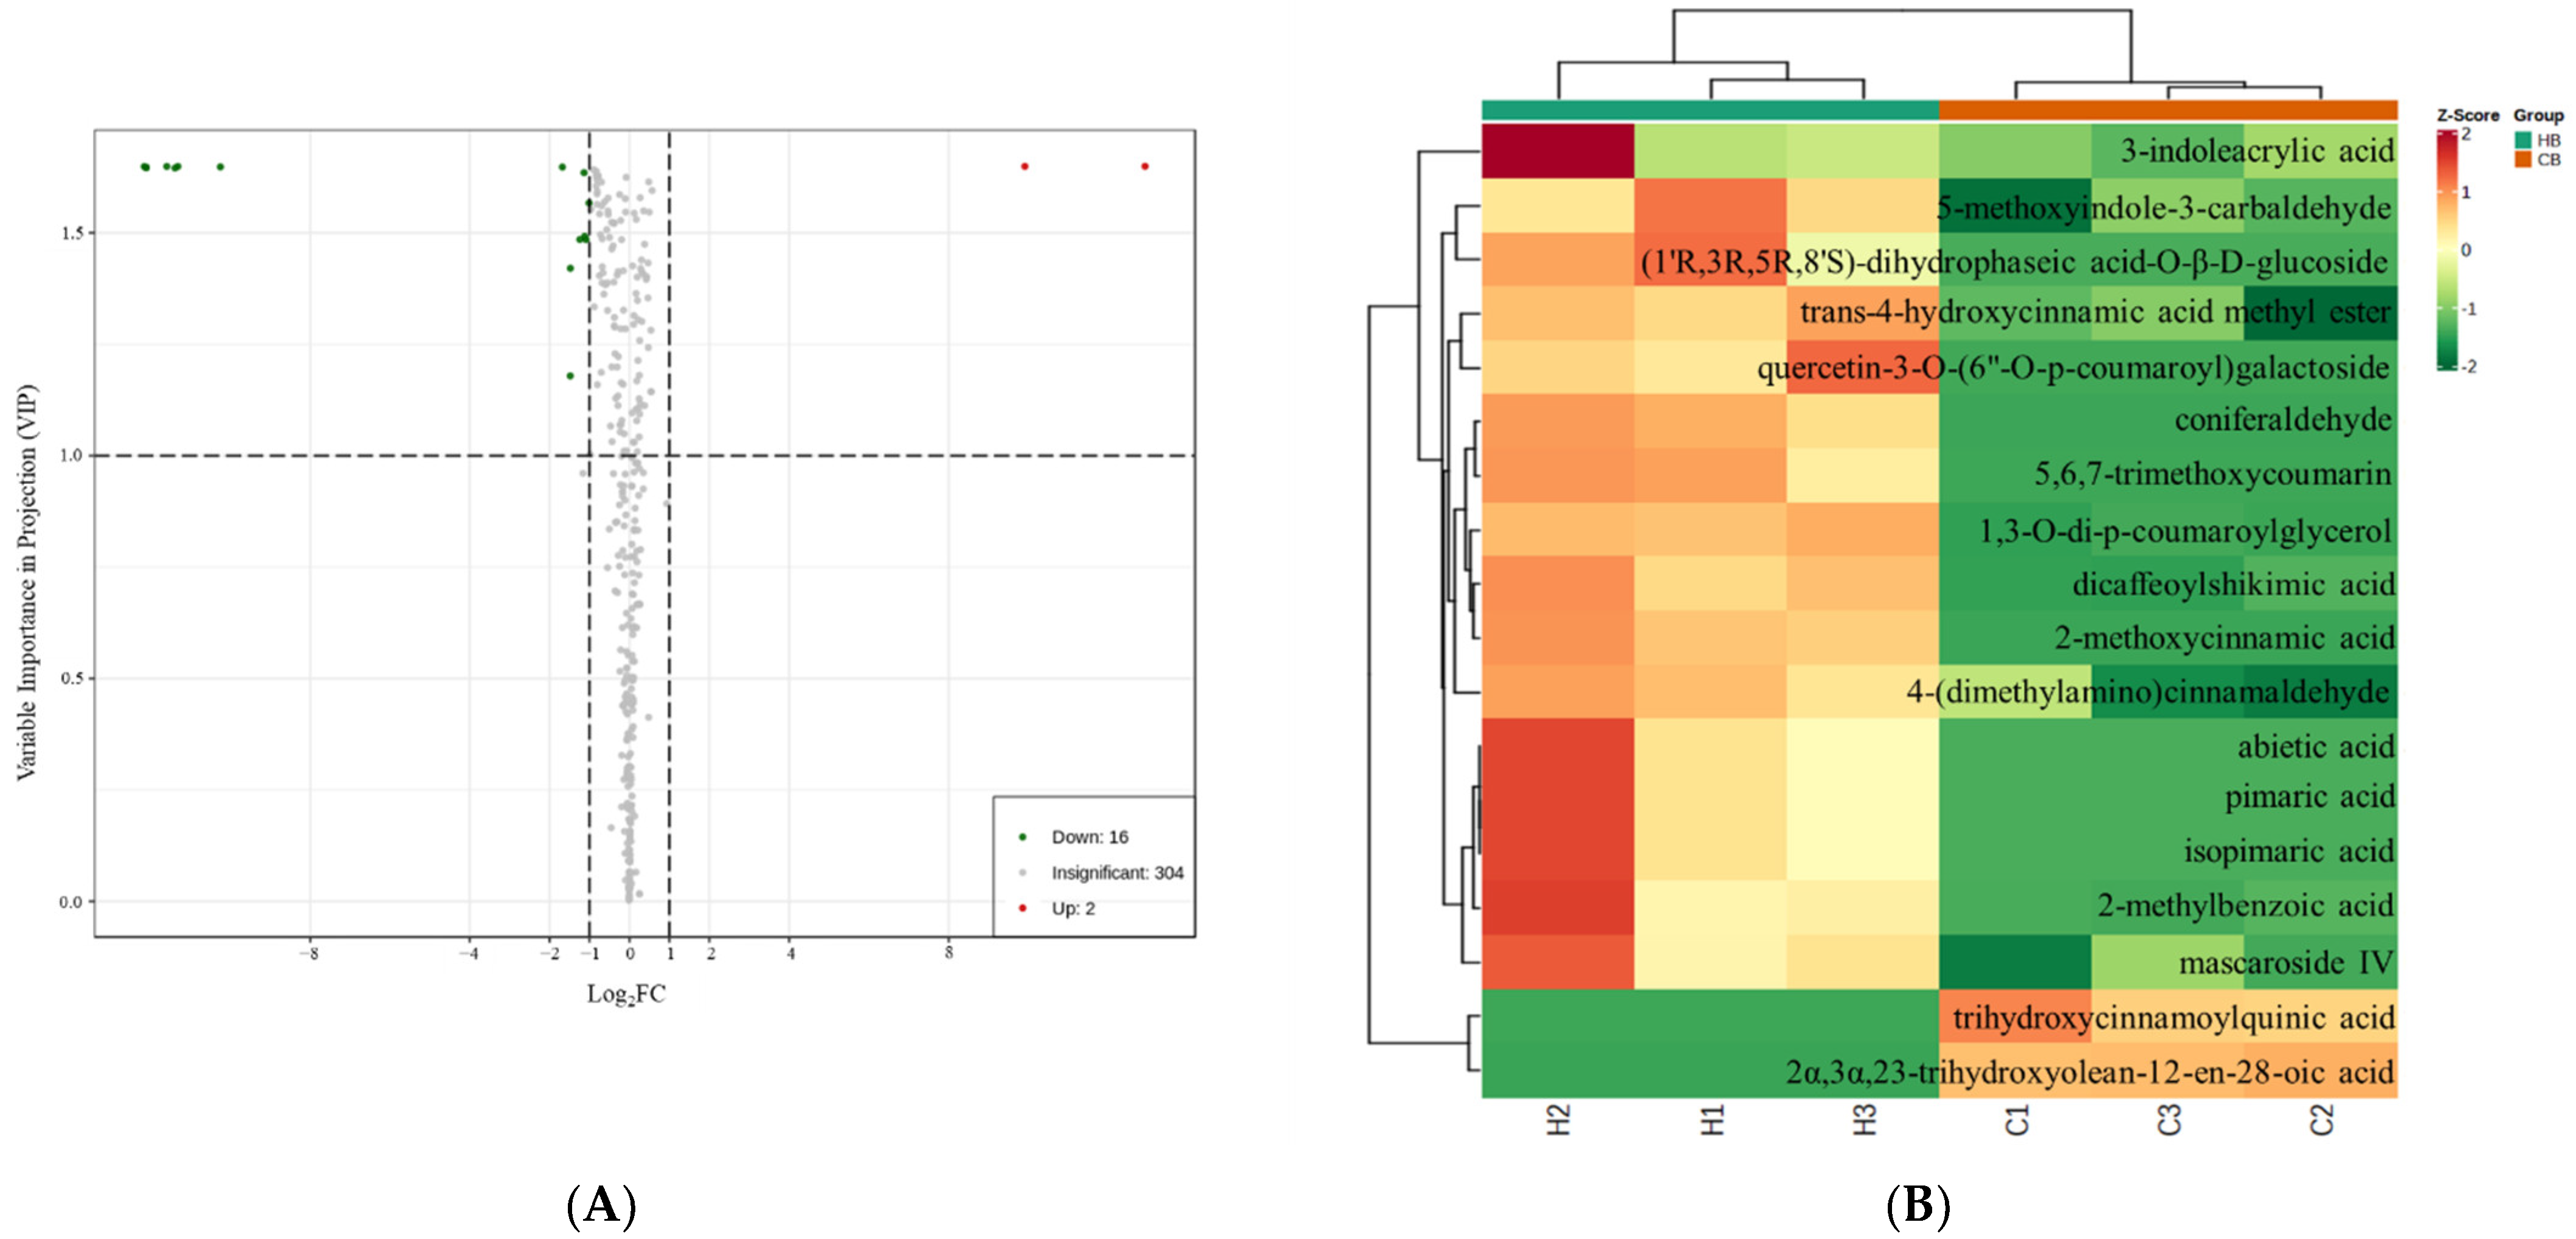
3.2. Differential Non-Volatiles Identified in Hot and Cold Brew Coffee

Sugars and organic acids were basic taste compounds in coffee. As shown in Table 2, sucrose had the largest share of the sugar content, with 15.37 ± 0.86 μg/mL and 14.26 ± 0.72 μg/mL in hot and cold brew coffee, respectively. Consistent with other research, sucrose accounted for the majority of the coffee sweet non-volatiles in coffee beans [41]. Chen and Ho [42] reported that monosaccharides were involved in the Maillard reaction for flavor generation during coffee bean roasting, which might lead to much lower contents of fructose and glucose in coffee. As for the organic acid profile in coffee, no significant difference was observed in most organic acids (Table 2). In a word, a few differences were detected in the sugar and organic acid profiles between hot and cold brew coffee. Moreover, Casas et al. [43] reported that levels of overall amino acids dropped to about 1% of green coffee beans after roasting, which made limited contribution to non-volatile profile of coffee.
Therefore, UPLC-MS/MS was applied to clarify the difference of phenolic acids, alkaloids, and flavonoids between hot and cold brew coffee. Our results showed a total of 322 non-volatiles were identified in hot and cold brew coffee. As shown in Figure S1, hot and cold brew coffee could be distinguished. Moreover, the mix samples (quality controls, QC) were clustered in the center of the PCA score plot, which indicated that the instrument exhibited high stability during data acquisition. Differential non-volatiles were identified by a variable importance in projection score of ≥ 1 and a fold change score of ≥ 2 or ≤ 0.5, which are visually shown in Figure 2A and Table 3. Hot and cold brew coffee were discriminated by 18 differential non-volatiles, including 8 phenolic acids, 5 terpenoids, 3 alkaloids, 1 flavonoid, and 1 coumarin. As shown in Figure 2B, 16 differential non-volatiles showed higher abundance in hot brew coffee, which could be explained in that higher brewing temperature flavored the kinetic energy of water molecules. Due to increased mobility and higher physical forces, non-volatiles were leached out more efficiently from the coffee bed [8].
As essential bioactive compounds in coffee [3], the abundance of 3-caffeoylquinic acid, 4-caffeoylquinic acid, 5-caffeoylquinic acid, caffeine, and trigonelline was shown to be comparable in hot and cold brew coffee (Figure 2A), which was in agreement with previous studies [13,16]. Cordoba et al. [4] reported that over 80% of soluble materials were found to be extracted after 5 min of hot filter brewing. As for cold brew coffee, concentrations of 3-caffeoylquinic acid and caffeine were described to be stable after 400 min [13]. Therefore, it may indicate that in our study, with either high-temperature-short-time or low-temperature-long-time brewing methods, the extraction of caffeine, trigonelline, and caffeoylquinic acids in hot and cold brew coffee might have reached equilibrium due to relatively high solubility in water.

3.3. Color Analysis

The L*a*b* values of hot brew coffee were L* = 29.76 ± 1.70, a* = 23.21 ± 0.61, and b* = 38.57 ± 2.43, while the color of cold brew coffee was L* = 38.79 ± 0.78, a* = 19.14 ± 0.91, and b* = 50.19 ± 3.95. The total color difference value ΔE = 15.27 suggested that the visual appearance of hot and cold brew coffee prepared from the identical coffee beans could be easily distinguished, which was consistent with our sensory quantitative descriptive study (Table 4). To be more specific, hot brew coffee presented darker lightness and redder tone, while cold brew coffee appeared lighter and yellower, which was also observed in medium-roasted coffee brews originating from El Salvador [45]. However, different trends in color changes may be shown in brews from different coffee bean origins, despite similar roasting levels.
The brown color of coffee is related to melanoidins, a class of high-molecular-weight products originating from the Maillard reaction [46]. Melanoidin compounds are more available for extraction with higher temperatures, likely due to the increase in the temperature-dependent solubility [12]. Therefore, hot brewing might make it easier for melanoidin extraction, which contributes to the darker color.

3.4. Sensory Evaluation and Differential Flavor Markers

In the sensory triangle test, a total of 25 panelists correctly identified the coffee sample that was different from others, which was greater than the critical value of 23 (α = 0.05), indicating the significant sensory difference between hot and cold brew coffee could be perceived. To further clarify differential sensory attributes between hot and cold brew coffee, results of the coffee sensory QDA are shown in Table 4.
Hot brew coffee appeared darker and tasted bitterer and more astringent over cold brew coffee (Table 4), consistent with prevoius studies [11]. Phenolic acids, alkaloids, and flavonoids were reported as main contributors to the bitterness and astringency of coffee [3]. Dicaffeoylshikimic acid, 2-methoxycinnamic acid, and thihydroxycinnamoylquinic acid, as identified phenolic acids in this study (Figure 2B), might be used to explain the difference of bitter and astringent attributes between hot and cold brew coffee. Moreover, as one of the flavonol-3-glycosides, quercetin-3-O-(6″-O-p-coumaroyl) galactoside was identified to be the differential non-volatile compound with a higher abundance found in hot brew coffee. Flavonol-3-glycosides were reported to induce a velvety and mouth-coating sensation with low thresholds, which contributed to astringency in tea and red wine [47,48], although without bitterness on their own, flavonol-3-glycosides were found to amply the bitter taste of caffeine in tea [47]. Therefore, further study is needed to confirm the contribution of quercetin-3-O-(6″-O-p-coumaroyl) galactoside to the bitter and astringent tastes in coffee (Figure 2B). In addition to non-volatile compounds, 4-ethylphenol and 4-ethylguaiacol were reported to increase the intensity and persistence of astringency of the flavanol solutions in the wine system [49]. Therefore, volatile contents might also need to be considered when concerning the bitter and astringent perception of coffee (Table 1).
As shown in Table 4, cold brew coffee showed higher fruitiness and sweetness intensity. Coniferaldehyde, as an identified key non-volatile in hot brew coffee, was reported to attenuate the fruity perception in red wine, even with concentrations lower than the threshold [50]. It implied that the fruity sensation in hot brew coffee might be decreased by the presence of coniferaldehy (Figure 2B). Sweet and fruity perception of coffee was not only determined by non-volatile but also volatile compounds in foods. Linalool as an aroma-active compound with sweet and fruity notes [51], showing a higher level in cold brew coffee compared with hot brew coffee (Table 1). Interestingly, Barba et al. [52] have reported that linalool in fruit could significantly improve the sweet flavor perception of fruit juice. Hence, a similar result could be found in the presence of furfuryl acetate with the sweet smell in coffee [24]. Moreover, Yu et al. [53] reported that benzaldehyde and furfural increased the intensity of sweet aroma perception in Huangjiu even with OAVs < 1. Thus, higher contents of benzaldehyde, furfural, linalool, and furfuryl acetate might also enhance the sweet and fruity perception in cold brew coffee (Table 1). However, contributions of these differential flavor compounds would need further verification on the basis of more extensive investigations on larger scale of hot and cold brew coffee production, involving more general coffee consumers.

4. Conclusions

In conclusion, the effects of hot and cold brewing on the flavor profile of coffee appeared significantly different, with 13 aroma-active compounds and 18 differential non-volatiles identified using chromatography–mass spectrometry and multivariate statistical analysis. Hot brew coffee was more closely associated with differential non-volatiles, while cold brew coffee was more associated with aroma-active compounds. A higher abundance of quercetin-3-O-(6″-O-p-coumaroyl) galactoside might be correlated with stronger bitterness and astringency in hot brew coffee, whereas higher OAVs of aroma-active furfural acetate and linalool led to the fruitier and sweeter flavor in cold brew coffee. These findings provide an insightful understanding of the coffee flavor control based on the sensory perception due to brewing methods during coffee industrial processing.

Supplementary Materials

The following are available online at https://www.mdpi.com/article/10.3390/foods11192968/s1, Figure S1: Principal component analysis (PCA) of the overall non-volatiles in hot and cold brew coffee using ultra-performance liquid chromatography–tandem mass spectrometry (UPLC-MS/MS). HB: hot brew coffee; CB: cold brew coffee; QC: quality controls. Table S1: Hot and cold brew coffee sensory attributes and their 5-point scale reference for panel training.

Author Contributions

Conceptualization, F.L.; investigation, Y.C., M.G. and M.W.; data curation, Y.C., Z.X. and X.P.; supervision, F.L., Z.X. and J.W.; writing—original draft, Y.C.; writing—review and editing, X.P. and F.L. All authors contributed to and have approved the final manuscript.

Funding

This research received no external funding.

Institutional Review Board Statement

The study was conducted in accordance with the Declaration of Helsinki, and approved by the China Agricultural University Institutional Review Board for Human Research (protocol code CAUHR-20220904 and date of approval 2022.1.21).

Informed Consent Statement

Informed consent was obtained from all subjects involved in the study.

Data Availability Statement

Data is contained within the article or Supplementary Material.

Acknowledgments

This research was supported by the 2115 Talent Development Program of China Agricultural University.

Conflicts of Interest

The authors declare no conflict of interest.

References

  1. Pham, Y.; Reardon-Smith, K.; Mushtaq, S.; Cockfield, G. The impact of climate change and variability on coffee production: A systematic review. Clim. Change 2019, 156, 609–630. [Google Scholar] [CrossRef]
  2. International Coffee Organization. Historical Data on the Global Coffee Trade. Available online: http://www.ico.org/new_historical.asp?section=Statistics (accessed on 14 February 2022).
  3. Sunarharum, W.B.; Williams, D.J.; Smyth, H.E. Complexity of coffee flavor: A compositional and sensory perspective. Food Res. Int. 2014, 62, 315–325. [Google Scholar] [CrossRef]
  4. Cordoba, N.; Fernandez-Alduenda, M.; Moreno, F.L.; Ruiz, Y. Coffee extraction: A review of parameters and their influence on the physicochemical characteristics and flavour of coffee brews. Trends Food Sci. Technol. 2020, 96, 45–60. [Google Scholar] [CrossRef]
  5. McCain-Keefer, H.R.; Meals, S.; Drake, M.A. The sensory properties and consumer acceptance of cold brew coffee. J. Sens. Stud. 2020, 35, e12604. [Google Scholar] [CrossRef]
  6. Batali, M.E.; Lim, L.X.; Liang, J.; Yeager, S.E.; Thompson, A.N.; Han, J.; Ristenpart, W.D.; Guinard, J. Sensory analysis of full immersion coffee: Cold brew is more floral, and less bitter, sour, and rubbery than hot brew. Foods 2022, 11, 2440. [Google Scholar] [CrossRef]
  7. Gloess, A.N.; Schönbächler, B.; Klopprogge, B.; D’Ambrosio, L.; Chatelain, K.; Bongartz, A.; Strittmatter, A.; Rast, M.; Yeretzian, C. Comparison of nine common coffee extraction methods: Instrumental and sensory analysis. Eur. Food Res. Technol. 2013, 236, 607–627. [Google Scholar] [CrossRef]
  8. Mestdagh, F.; Glabasnia, A.; Giuliano, P. The Brew-Extracting for Excellence. In The Craft and Science of Coffee; Folmer, B., Ed.; Academic Press: London, United Kingdom, 2017; pp. 355–380. [Google Scholar]
  9. Córdoba, N.; Moreno, F.L.; Osorio, C.; Velásquez, S.; Ruiz, Y. Chemical and sensory evaluation of cold brew coffees using different roasting profiles and brewing methods. Food Res. Int. 2021, 141, 110141. [Google Scholar] [CrossRef]
  10. Xu, L.; Lao, F.; Xu, Z.; Wang, X.; Chen, F.; Liao, X.; Chen, A.; Yang, S. Use of liquid chromatography quadrupole time-of-flight mass spectrometry and metabolomic approach to discriminate coffee brewed by different methods. Food Chem. 2019, 286, 106–112. [Google Scholar] [CrossRef]
  11. Córdoba, N.; Moreno, F.L.; Osorio, C.; Velásquez, S.; Fernandez-Alduenda, M.; Ruiz-Pardo, Y. Specialty and regular coffee bean quality for cold and hot brewing: Evaluation of sensory profile and physicochemical characteristics. LWT 2021, 145, 111363. [Google Scholar] [CrossRef]
  12. Rao, N.Z.; Fuller, M.; Grim, M.D. Physiochemical characteristics of hot and cold brew coffee chemistry: The effects of roast level and brewing temperature on compound extraction. Foods 2020, 9, 902. [Google Scholar] [CrossRef]
  13. Fuller, M.; Rao, N.Z. The Effect of Time, Roasting Temperature, and Grind Size on Caffeine and Chlorogenic Acid Concentrations in Cold Brew Coffee. Sci. Rep. 2017, 7, 17979. [Google Scholar] [CrossRef] [PubMed]
  14. Heo, J.; Adhikari, K.; Choi, K.S.; Lee, J. Analysis of Caffeine, Chlorogenic Acid, Trigonelline, and Volatile Compounds in Cold Brew Coffee Using High-Performance Liquid Chromatography and Solid-Phase Microextraction—Gas Chromatography-Mass Spectrometry. Foods 2020, 9, 1746. [Google Scholar] [CrossRef] [PubMed]
  15. Pan, X.; Wu, J.; Zhang, W.; Liu, J.; Yang, X.; Liao, X.; Hu, X.; Lao, F. Effects of sugar matrices on the release of key aroma compounds in fresh and high hydrostatic pressure processed Tainong mango juices. Food Chem. 2021, 338, 128117. [Google Scholar] [CrossRef] [PubMed]
  16. Czerny, M.; Grosch, W. Potent odorants of raw Arabica coffee. Their changes during roasting. J. Agric. Food Chem. 2000, 48, 868–872. [Google Scholar] [CrossRef]
  17. Wang, B.; Wang, X.; Bei, J.; Xu, L.; Zhang, X.; Xu, Z. Development and Validation of an Analytical Method for the Quantification of Arabinose, Galactose, Glucose, Sucrose, Fructose, and Maltose in Fruits, Vegetables, and Their Products. Food Anal. Methods 2021, 14, 1227–1238. [Google Scholar] [CrossRef]
  18. Hou, H.; Chen, Q.; Bi, J.; Bhandari, B.; Wu, X.; Jin, X.; Shi, Y.; Qiao, Y.; Gou, M.; Shi, J. Glass transition and crystallization of solid model system of jujube slice as influenced by sugars and organic acids. Food Chem. 2021, 359, 129935. [Google Scholar] [CrossRef]
  19. Li, J.; Zhao, W.; Pan, X.; Lao, F.; Liao, X.; Shi, Y.; Wu, J. Improvement of antioxidant properties of jujube puree by biotransformation of polyphenols via Streptococcus thermophilus fermentation. Food Chem. X 2022, 13, 100214. [Google Scholar] [CrossRef]
  20. ISO 4120:2004; Sensory Analysis-Methodology-Triangle Test. International Organization For Standardization: Geneva, Switzerland, 2004.
  21. Chambers, E.; Sanchez, K.; Phan, U.X.T.; Miller, R.; Civille, G.V.; Di Donfrancesco, B. Development of a “Living” Lexicon for Descriptive Sensory Analysis of Brewed Coffee. J. Sens. Stud. 2016, 31, 465–480. [Google Scholar] [CrossRef]
  22. Stone, H.; Sidel, J.; Oliver, S.; Woolsey, A.; Singleton, R.C. Sensory Evaluation by Quantitative Descriptive Analysis. Food Technol. 1974, 28, 24–34. [Google Scholar]
  23. Piccino, S.; Boulanger, R.; Descroix, F.; Sing, A.S.C. Aromatic composition and potent odorants of the “specialty coffee” brew “Bourbon Pointu” correlated to its three trade classifications. Food Res. Int. 2014, 61, 264–271. [Google Scholar] [CrossRef]
  24. Amanpour, A.; Selli, S. Differentiation of Volatile Profiles and Odor Activity Values of Turkish Coffee and French Press Coffee. J. Food Process. Preserv. 2016, 40, 1116–1124. [Google Scholar] [CrossRef]
  25. Caporaso, N.; Genovese, A.; Canela, M.D.; Civitella, A.; Sacchi, R. Neapolitan Coffee Brew Chemical Analysis in Comparison to Espresso, Moka and American Brews; Elsevier: Amsterdam, The Netherlands, 2014; Volume 61. [Google Scholar]
  26. López, J.A.S.; Wellinger, M.; Gloess, A.N.; Zimmermann, R.; Yeretzian, C. Extraction kinetics of coffee aroma compounds using a semi-automatic machine: On-line analysis by PTR-ToF-MS. Int. J. Mass Spectrom. 2016, 401, 22–30. [Google Scholar] [CrossRef]
  27. Lee, L.W.; Tay, G.Y.; Cheong, M.W.; Curran, P.; Yu, B.; Liu, S.Q. Modulation of the volatile and non-volatile profiles of coffee fermented with Yarrowia lipolytica: I. Green coffee. LWT Food Sci. Technol. 2017, 77, 225–232. [Google Scholar] [CrossRef]
  28. De Melo Pereira, G.V.; de Carvalho Neto, D.P.; Magalhães Júnior, A.I.; Vásquez, Z.S.; Medeiros, A.B.P.; Vandenberghe, L.P.S.; Soccol, C.R. Exploring the impacts of postharvest processing on the aroma formation of coffee beans—A review. Food Chem. 2019, 272, 441–452. [Google Scholar] [CrossRef] [PubMed]
  29. Wang, Y.; Liu, T.; Chen, F.; Wang, X.; Zhang, F. Determination of exogenous prohibited flavour compounds added in coffee using gas chromatography triple quadrupole tandem massspectrometry and gas chromatography/combustion/isotope ratio mass spectrometry. Food Addit. Contam. Part A Chem. Anal. Control. Expo. Risk Assess. 2020, 37, 2011–2022. [Google Scholar] [CrossRef]
  30. The Good Scents Company Search Page. Available online: http://www.thegoodscentscompany.com/search2.html (accessed on 27 January 2022).
  31. Caporaso, N.; Whitworth, M.B.; Cui, C.; Fisk, I.D. Variability of single bean coffee volatile compounds of Arabica and robusta roasted coffees analysed by SPME-GC-MS. Food Res. Int. 2018, 108, 628–640. [Google Scholar] [CrossRef]
  32. Van Gemert, L.J. Thresholds Odour: Compilations of Odour Threshold Values in Air, Water and Other Media, 2nd ed.; Oliemans Punter & Partners BV: Zeist, The Netherlands, 2011. [Google Scholar]
  33. Matsui, T.; Guth, H.; Grosch, W. A comparative study of potent odorants in peanut, hazelnut, and pumpkin seed oils on the basis of aroma extract dilution analysis (AEDA) and gas chromatography-olfactometry of headspace samples (GCOH). Lipid-Fett. 1998, 100, 51–56. [Google Scholar] [CrossRef]
  34. Czerny, M.; Christlbauer, M.; Christlbauer, M.; Fischer, A.; Granvogl, M.; Hammer, M.; Hartl, C.; Hernandez, N.M.; Schieberle, P. Re-investigation on odour thresholds of key food aroma compounds and development of an aroma language based on odour qualities of defined aqueous odorant solutions. Eur. Food Res. Technol. 2008, 228, 265–273. [Google Scholar] [CrossRef]
  35. Liu, J.; Wan, P.; Xie, C.; Chen, D.W. Key aroma-active compounds in brown sugar and their influence on sweetness. Food Chem. 2021, 345, 128826. [Google Scholar] [CrossRef]
  36. Liu, Y.; Song, H.L.; Luo, H. Correlation between the key aroma compounds and gDNA copies of Bacillus during fermentation and maturation of natto. Food Res. Int. 2018, 112, 175–183. [Google Scholar] [CrossRef]
  37. Al-Dalali, S.; Zheng, F.; Sun, B.; Chen, F.; Wang, P.; Wang, W. Determination of the aroma changes of Zhengrong vinegar during different processing steps by SPME–GC–MS and GC-O. J. Food Meas. Charact. 2020, 14, 535–547. [Google Scholar] [CrossRef]
  38. Kang, D.E.; Lee, H.U.; Davaatseren, M.; Chung, M.S. Comparison of acrylamide and furan concentrations, antioxidant activities, and volatile profiles in cold or hot brew coffees. Food Sci. Biotechnol. 2020, 29, 141–148. [Google Scholar] [CrossRef]
  39. Pu, D.; Zhang, Y.; Zhang, H.; Sun, B.; Ren, F.; Chen, H.; Tang, Y. Characterization of the key aroma compounds in traditional Hunan smoke-cured pork leg (Larou, THSL) by aroma extract dilution analysis (AEDA), odor activity value (OAV), and sensory evaluation experiments. Foods 2020, 9, 413. [Google Scholar] [CrossRef] [PubMed]
  40. Malfondet, N.; Gourrat, K.; Brunerie, P.; Le Quéré, J.L. Aroma characterization of freshly-distilled French brandies; their specificity and variability within a limited geographic area. Flavour Fragr. J. 2016, 31, 361–376. [Google Scholar] [CrossRef]
  41. Aquino, F.J.T.; Augusti, R.; de Alves, J.O.; Diniz, M.E.R.; Morais, S.A.L.; Alves, B.H.P.; Nascimento, E.A.; Sabino, A.A. Direct infusion electrospray ionization mass spectrometry applied to the detection of forgeries: Roasted coffees adulterated with their husks. Microchem. J. 2014, 117, 127–132. [Google Scholar] [CrossRef]
  42. Dos Santos, F.K.F.; de Almeida Cavalcante, S.F.; Rezende, C.M.; Veiga-Junior, V.F. Extraction and enrichment of furanoid glycosylated diterpenes present in green coffee beans: New methodology in the QuEChERS concept. J. Food Compos. Anal. 2021, 104, 104142. [Google Scholar] [CrossRef]
  43. Farrell, T.L.; Gomez-Juaristi, M.; Poquet, L.; Redeuil, K.; Nagy, K.; Renouf, M.; Williamson, G. Absorption of dimethoxycinnamic acid derivatives in vitro and pharmacokinetic profile in human plasma following coffee consumption. Mol. Nutr. Food Res. 2012, 56, 1413–1423. [Google Scholar] [CrossRef]
  44. Li, Z.; Zhang, C.; Zhang, Y.; Zeng, W.; Igor, C. Coffee cell walls-composition, influence on cup quality and opportunities for coffee improvements. Food Qual. Saf. 2021, 5, fyab012. [Google Scholar] [CrossRef]
  45. Yeager, S.E.; Batali, M.E.; Lim, L.X.; Liang, J.; Han, J.; Thompson, A.N.; Guinard, J.; Ristenpart, W.D. Roast level and brew temperature significantly affect the color of brewed coffee. J. Food Sci. 2022, 87, 1837–1850. [Google Scholar] [CrossRef]
  46. Bartel, C.; Mesias, M.; Morales, F.J. Investigation on the extractability of melanoidins in portioned espresso coffee. Food Res. Int. 2015, 67, 356–365. [Google Scholar] [CrossRef]
  47. Scharbert, S.; Hofmann, T. Molecular definition of black tea taste by means of quantitative studies, taste reconstitution, and omission experiments. J. Agric. Food Chem. 2005, 53, 5377–5384. [Google Scholar] [CrossRef] [PubMed]
  48. Sáenz-Navajas, M.P.; Avizcuri, J.M.; Ferreira, V.; Fernández-Zurbano, P. Insights on the chemical basis of the astringency of Spanish red wines. Food Chem. 2012, 134, 1484–1493. [Google Scholar] [CrossRef] [PubMed]
  49. Ferrer-Gallego, R.; Hernández-Hierro, J.M.; Rivas-Gonzalo, J.C.; Escribano-Bailón, M.T. Sensory evaluation of bitterness and astringency sub-qualities of wine phenolic compounds: Synergistic effect and modulation by aromas. Food Res. Int. 2014, 62, 1100–1107. [Google Scholar] [CrossRef]
  50. Cameleyre, M.; Lytra, G.; Schütte, L.; Vicard, J.C.; Barbe, J.C. Oak Wood Volatiles Impact on Red Wine Fruity Aroma Perception in Various Matrices. J. Agric. Food Chem. 2020, 68, 13319–13330. [Google Scholar] [CrossRef] [PubMed]
  51. Steinhaus, M.; Schieberle, P. Comparison of the most odor-active compounds in fresh and dried hop cones (Humulus lupulus L. variety spalter select) based on GC-olfactometry and odor dilution techniques. J. Agric. Food Chem. 2000, 48, 1776–1783. [Google Scholar] [CrossRef]
  52. Barba, C.; Beno, N.; Guichard, E.; Thomas-Danguin, T. Selecting odorant compounds to enhance sweet flavor perception by gas chromatography/olfactometry-associated taste (GC/O-AT). Food Chem. 2018, 257, 172–181. [Google Scholar] [CrossRef]
  53. Yu, H.Y.; Xie, T.; Xie, J.; Chen, C.; Ai, L.Z.; Tian, H.X. Aroma perceptual interactions of benzaldehyde, furfural, and vanillin and their effects on the descriptor intensities of Huangjiu. Food Res. Int. 2020, 129, 108808. [Google Scholar] [CrossRef]
Figure 1. Aroma-active compounds identified using OAV > 1 in hot and cold brew coffee.
Foods 11 02968 g001
Figure 2. Volcano plot (A) and hierarchical cluster analysis (B) of differential non-volatiles identified between hot and cold brew coffee. (A) Red dots represent differential compounds of which the abundance was upregulated; green dots represent differential compounds of which the abundance was downregulated; and gray dots represent compounds with insignificant differences. If the abscissas had large absolute values, the FC values were also observed to be large. (B) Red represents a relatively high content of the compound, whereas green represents a relatively low content. HB: hot brew coffee; CB: cold brew coffee.
Foods 11 02968 g002
Table 1. Volatile compounds identified in hot and cold brew coffee using head space solid phase microextraction coupled with gas chromatography–mass spectrometry (HS-SPME-GC-MS).
Volatile CompoundsCASOdor 1Threshold
(μg/L) 2
Concentration (μg/L) 3OAV 4
Hot Brew
Coffee
Cold Brew
Coffee
Hot Brew
Coffee
Cold Brew
Coffee
Pyrazine
2-Methylpyrazine109-08-0nutty, cocoa, roasted [30]60 [31]n.d.107.07 ± 4.88 1.78
2,5-Dimethyl pyrazine123-32-0cocoa, roasted, nuts [30]2600 [31]32.06 ± 1.5845.45 ± 3.15 *
2,6-Dimethyl pyrazine108-50-9cocoa, roasted, nuts [30]3100 [31]33.95 ± 1.4549.45 ± 3.35 *
Ethylpyrazine13925-00-3peanut, butter, musty [30]6000 [31]31.96 ± 2.1248.64 ± 3.38 *
2-Ethyl-6-methylpyrazine13925-03-6roasted, potato, roasted [30]30 [31]47.17 ± 1.5981.76 ± 4.24 *1.572.73
2-Ethyl-5-methylpyrazine13360-64-0coffee, bean, nutty [30]100 [31]41.07 ± 1.5568.02 ± 3.73 *
2,6-Diethylpyrazine13067-27-1nutty, hazelnut [30]6 [32]23.94 ± 0.9944.47 ± 2.39 *3.997.41
3-Ethyl-2,5-dimethyl-pyrazine13360-65-1potato, cocoa, roasted [30]1 [31]92.91 ± 4.89173.09 ± 9.21 *92.91173.09
2-Ethenyl-6-methylpyrazine13925-09-2hazelnut [30]-13.79 ± 1.0522.22 ± 1.01 *
3,5-Diethyl-2-methyl-pyrazine18138-05-1nutty, meaty, vegetable [30]-n.d.82.51 ± 7.18
2-Methyl-5-[(E)-1-propenyl]pyrazine18217-82-8sweet, earthy [33]-n.d.11.97 ± 0.61
2-Acetyl-3-methylpyrazine23787-80-6nutty, flesh, roasted [30]20 [31]30.15 ± 0.8348.10 ± 4.45 *1.512.40
Phenol
Guaiacol90-05-1phenolic, smoke, spice [24]1.6 [31]55.37 ± 1.5266.34 ± 5.9034.6141.46
Phenol108-95-2phenolic, plastic rubber [30]2400 [23]49.29 ± 4.7844.17 ± 2.59
4-Ethylguaiacol2785-89-9spicy, smoky, bacon [24]16 [34]81.78 ± 4.3697.56 ± 3.95 *5.116.10
3,4-Dimethylphenol95-65-8ink, hay [30]1200 [32]8.57 ± 0.76n.d.
m-cresol108-39-4medicinal, woody, leather [30]31 [32]14.97 ± 1.3918.20 ± 1.03
1-Hydroxy-2,3-dimethylbenzene526-75-0phenolic, chemical, musty [30]500 [32]4.86 ± 0.20n.d.
3-Ethylphenol620-17-7leather, ink [34]1.7 [32]16.97 ± 0.60n.d.9.98
4-Vinylguaiacol7786-61-0dry woody, clove, amber [24]19 [34]59.02 ± 4.04*40.63 ± 2.143.112.14
2,4-di-tert-Butylphenol96-76-4phenol [34]500 [32]27.17 ± 5.2314.31 ± 3.52
Furan
Furfural98-01-1sweet, woody, almond [30]3000 [31]134.23 ± 1.55200.20 ± 13.44 *
2-Acetylfuran1192-62-7sweet, balsam, almond [30]10000 [31]43.33 ± 2.3054.65 ± 5.03 *
Furfuryl acetate623-17-6sweet, fruity, banana [30]100 [31]228.24 ± 5.61422.76 ± 19.97 *2.284.23
5-Methyl furfural620-02-0spice, caramel, maple [30]6000 [3]204.70 ± 3.26268.20 ± 18.65 *
2-Furanmethanol98-00-0sweet, creamy, vanilla [35]2000 [32]242.91 ± 6.06317.66 ± 17.00 *
1-Furfurylpyrrole1438-94-4plastic, green, waxy [30]100 [32]70.77 ± 1.1183.27 ± 10.07
2,3-Dihydrobenzofuran496-16-2floral [36]-5.05 ± 0.46n.d.
Aldehyde
Benzaldehyde100-52-7sweet, bitter, almond [30]350 [32]29.01 ± 1.4944.22 ± 3.53 *
N-Methylpyrrole-2-carboxaldehyde1192-58-1roasted, nutty [30]37 [32]46.82 ± 0.3258.00 ± 4.11 *1.271.57
2-Phenyl-2-butenal4411-89-6sweet, narcissus, cortex [30]883.8 [37]8.60 ± 0.3411.07 ± 2.28
1H-Pyrrole-2-carboxaldehyde1003-29-8musty, beefy, coffee [30]65000 [32]19.72 ± 0.7725.84 ± 2.07 *
Ketone
Maltol118-71-8sweet, caramel, cotton candy [38]5800 [23]29.79 ± 1.1043.62 ± 0.84 *
3-Ethyl-2-hydroxy-2-cyclopenten-1-one21835-01-8sweet, caramel, maple [30]53.35 [39]10.99 ± 1.0715.92 ± 1.27 *
4-Hydroxy-3-methylacetophenone876-02-8meidical, smoky [40]-10.37 ± 1.1515.48 ± 0.45 *
Others
Methyl salicylate119-36-8wintergreen, mint [30]40 [32]n.d.41.64 ± 9.20 1.04
3,4-Dimethoxystyrene6380-23-0green, floral, weedy [30]-12.07 ± 0.5914.35 ± 0.57 *
1-(1H-pyrrol-2-yl)-Ethanone1072-83-9musty, nut skin, maraschino [30]170000 [32]44.15 ± 2.5456.17 ± 8.66
1-Acetyl-1,4-dihydropyridine67402-83-9--10.85 ± 0.16n.d.
Indole120-72-9animal, floral, moth ball [30]40 [32]5.20 ± 0.07n.d.
1 Odor description found in the literature; minus sign (-) indicates the odor description was not available in the literature. 2 Odor thresholds in water taken from the literature; minus sign (-) indicates the threshold was not available in the literature. 3 Values are given as means ± standard deviation (n = 3 independent measurements). * in the same row means significant difference at p < 0.05. n.d. means not detected due to the concentration of the given compound being below the detection limit. 4 OAV, odor activity value. Only OAV values greater than 1 are presented.
Table 2. Sugar and organic acid compounds identified in hot and cold brew coffee.
Non-Volatile
Compound
Hot Brew Coffee
(μg/mL)
Cold Brew Coffee
(μg/mL)
Sugar
Sucrose15.37 ± 0.86 *14.26 ± 0.72
Maltose2.73 ± 0.43 *2.30 ± 0.14
Galactose2.44 ± 0.232.68 ± 0.10 *
Arabinose1.87 ± 0.102.14 ± 0.10 *
Glucose0.87 ± 0.171.22 ± 0.09 *
Fructose0.60 ± 0.210.61 ± 0.08
Total23.29 ± 1.3222.60 ± 0.93
Organic acid
Quinic acid696.82 ± 7.84696.19 ± 12.52
Shikimic acid33.19 ± 3.6228.57 ± 0.43
Malic acid145.17 ± 7.33160.37 ± 7.09
Tartaric acid1.14 ± 0.071.21 ± 0.02
Oxalic acid53.68 ± 0.4054.36 ± 1.16
Citric acid347.05 ± 15.60382.12 ± 5.17 *
Total1277.06 ± 22.211322.81 ± 22.07
Values are given as means ± standard deviation (n = 3 independent measurements). * in the same row means significant difference at p < 0.05.
Table 3. Differential non-volatiles identified in hot and cold brew coffee using ultra-performance liquid chromatography–tandem mass spectrometry (UPLC-MS/MS) with the VIP 1 ≥ 1 and the fold change score of ≥ 2 or ≤ 0.5.
Differential CompoundsCAS 2FormulaMolecular Weight (Da)Ionization ModelPrecursor Ions (Da)Product Ions (Da)VIPFoldChangeIdentification in References 3
1,3-O-di-p-Coumaroyl glycerol-C21H20O7384.12[M-H]-383.12163.041.650.31-
trans-4-Hydroxycinnamic acid methyl ester19367-38-5C10H10O3178.06[M-H]-177.00145.001.490.46-
Dicaffeoylshikimic acid-C25H22O11498.12[M + H]+499.13163.041.630.45[41]
Pimaric acid127-27-5C20H30O2302.22[M-H]301.22301.221.650.00023-
Isopimaric acid5835-26-7C20H30O2302.22[M-H]301.22301.221.650.00023-
Abietic acid514-10-3C20H30O2302.22[M-H]301.22301.221.650.00023-
Quercetin-3-O-(6″-O-p-coumaroyl) galactoside-C30H26O14610.13[M + H]+611.14147.041.650.00039-
4-(Dimethylamino)cinnamaldehyde6203-18-5C11H13NO175.10[M + H]+176.11146.101.420.36-
5,6,7-Trimethoxycoumarin55085-47-7C12H12O5236.07[M + H]+237.07176.041.650.00082-
5-Methoxyindole-3-carbaldehyde10601-19-1C10H9NO2175.06[M + H]+176.1091.201.480.42-
Mascaroside IV2214215-15-1C37H46O14714.29[M + H]+715.29207.071.480.47[42]
2-Methoxycinnamic acid6099-03-2C10H10O3178.06[M-H]177.06133.071.650.00032[43]
Coniferaldehyde20649-42-7C10H10O3178.06[M + H]+179.0791.001.650.00022[44]
2-Methylbenzoic acid118-90-1C8H8O2136.05[M-H]135.0591.051.570.50-
3-Indoleacrylic acid1204-06-4C11H9NO2187.06[M + H]+188.07118.071.180.36-
2α,3α,23-Trihydroxyolean-12-en-28-oic acid-C30H48O5488.35[M-H]-487.34487.341.657724.93-
(1’R,3R,5R,8’S)-Dihydrophaseic acid-O-β-D-glucoside-C21H32O10444.20[M-H]443.19161.041.650.00037-
Trihydroxycinnamoylquinic acid-C16H20O10372.11[M-H]371.10249.061.65958.27-
1 VIP, variable importance in projection. 2 Minus sign (-) indicates the CAS was not available in the literature. 3 Minus sign (-) indicates the compound was not reported in coffee before in the literature.
Table 4. Sensory quantitative descriptive analysis for hot and cold brew coffee.
Sensory AttributeHot Brew CoffeeCold Brew Coffee
Color4.29 ± 0.76 *3.29 ± 0.49
Nutty2.86 ± 1.072.29 ± 0.49
Coffee3.14 ± 0.692.86 ± 0.90
Fruity2.00 ± 1.153.14 ± 0.69 *
Sweet0.71 ± 0.491.71 ± 0.95 *
Sour2.86 ± 0.903.29 ± 0.95
Bitter4.14 ± 0.69 *2.43 ± 0.53
Astringent2.86 ± 0.90 *2.00 ± 0.82
Sensory intensity values are given as means ± standard deviation (n = 7 sensory panelists). * in the same row means significant difference at p < 0.05.
Publisher’s Note: MDPI stays neutral with regard to jurisdictional claims in published maps and institutional affiliations.

