
Evaluation of Mutton Adulteration under the Effect of Mutton Flavour Essence Using Hyperspectral Imaging Combined with Machine Learning and Sparrow Search Algorithm

Abstract
:1. Introduction
2. Materials and Methods
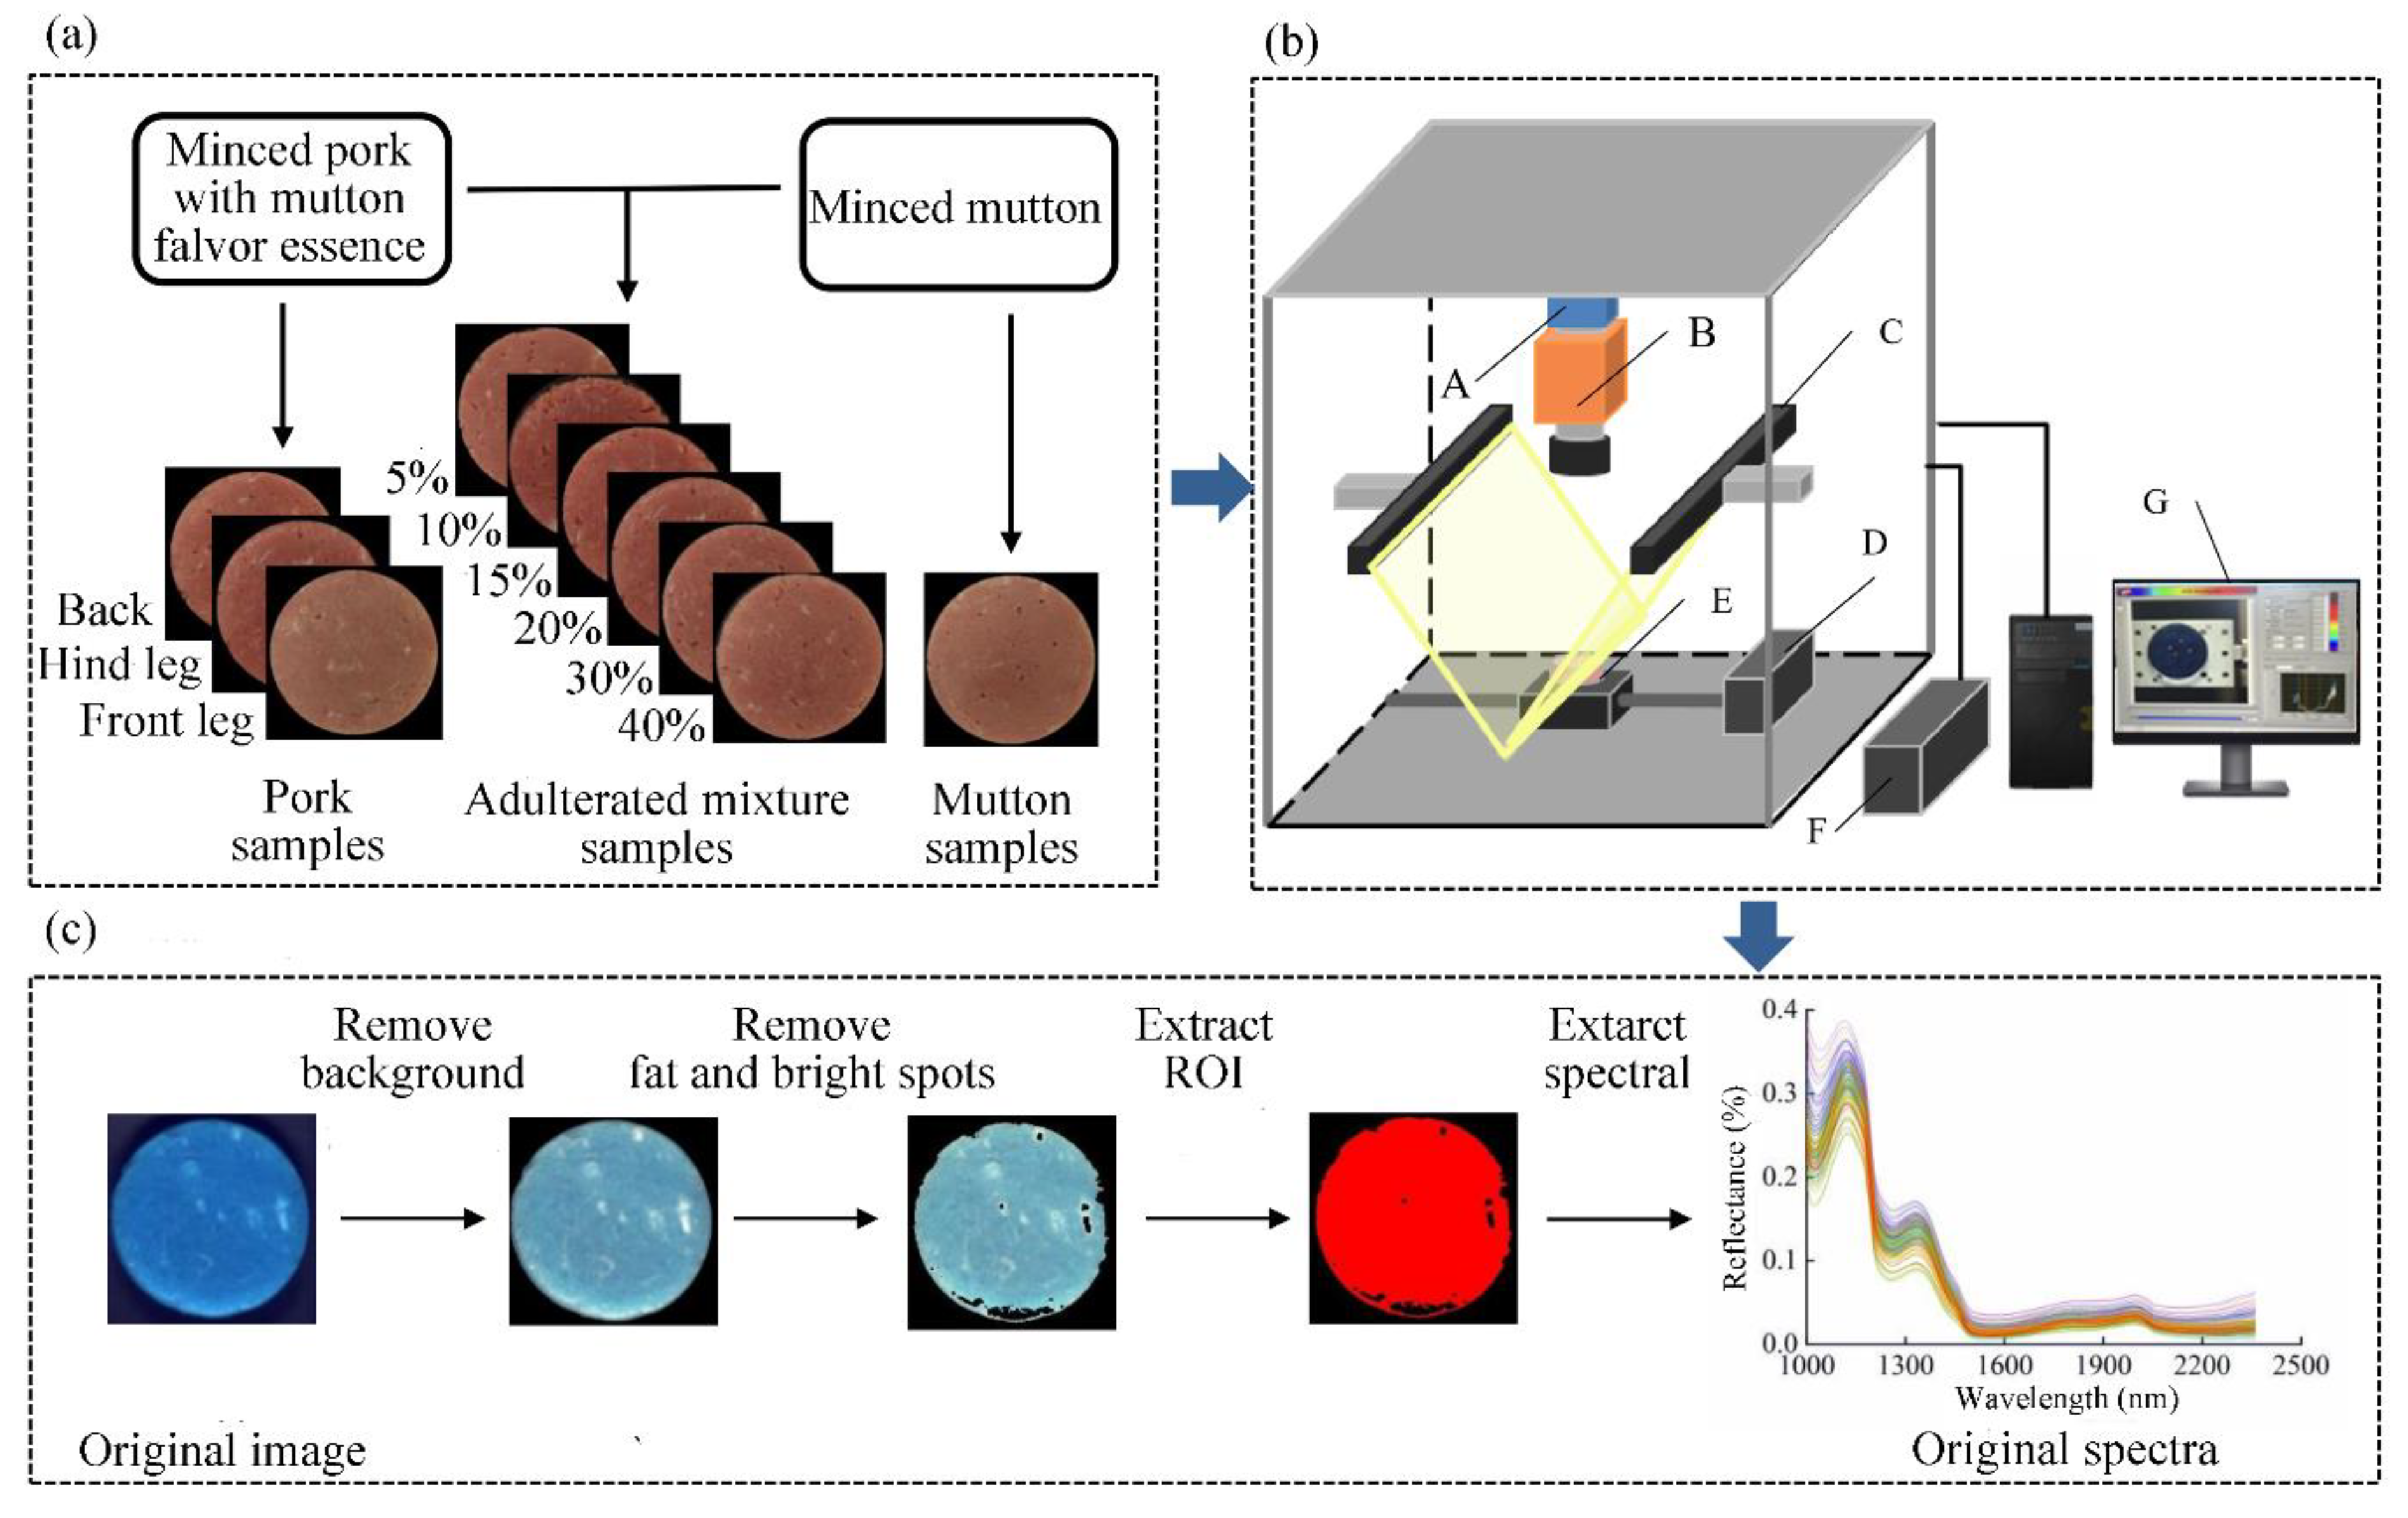
2.1. Sample Preparation
2.2. Acquisition and Calibration of NIR-HSI Images
2.3. Spectral Acquisition
2.4. Spectral Data Preprocessing
2.5. Model Establishment and Evaluation
2.5.1. Modelling Methods
2.5.2. Sparrow Search Algorithm Optimisation
2.5.3. Establishment and Evaluation of Classification Models
2.5.4. Establishment and Evaluation of Quantification Models
3. Results and Discussion
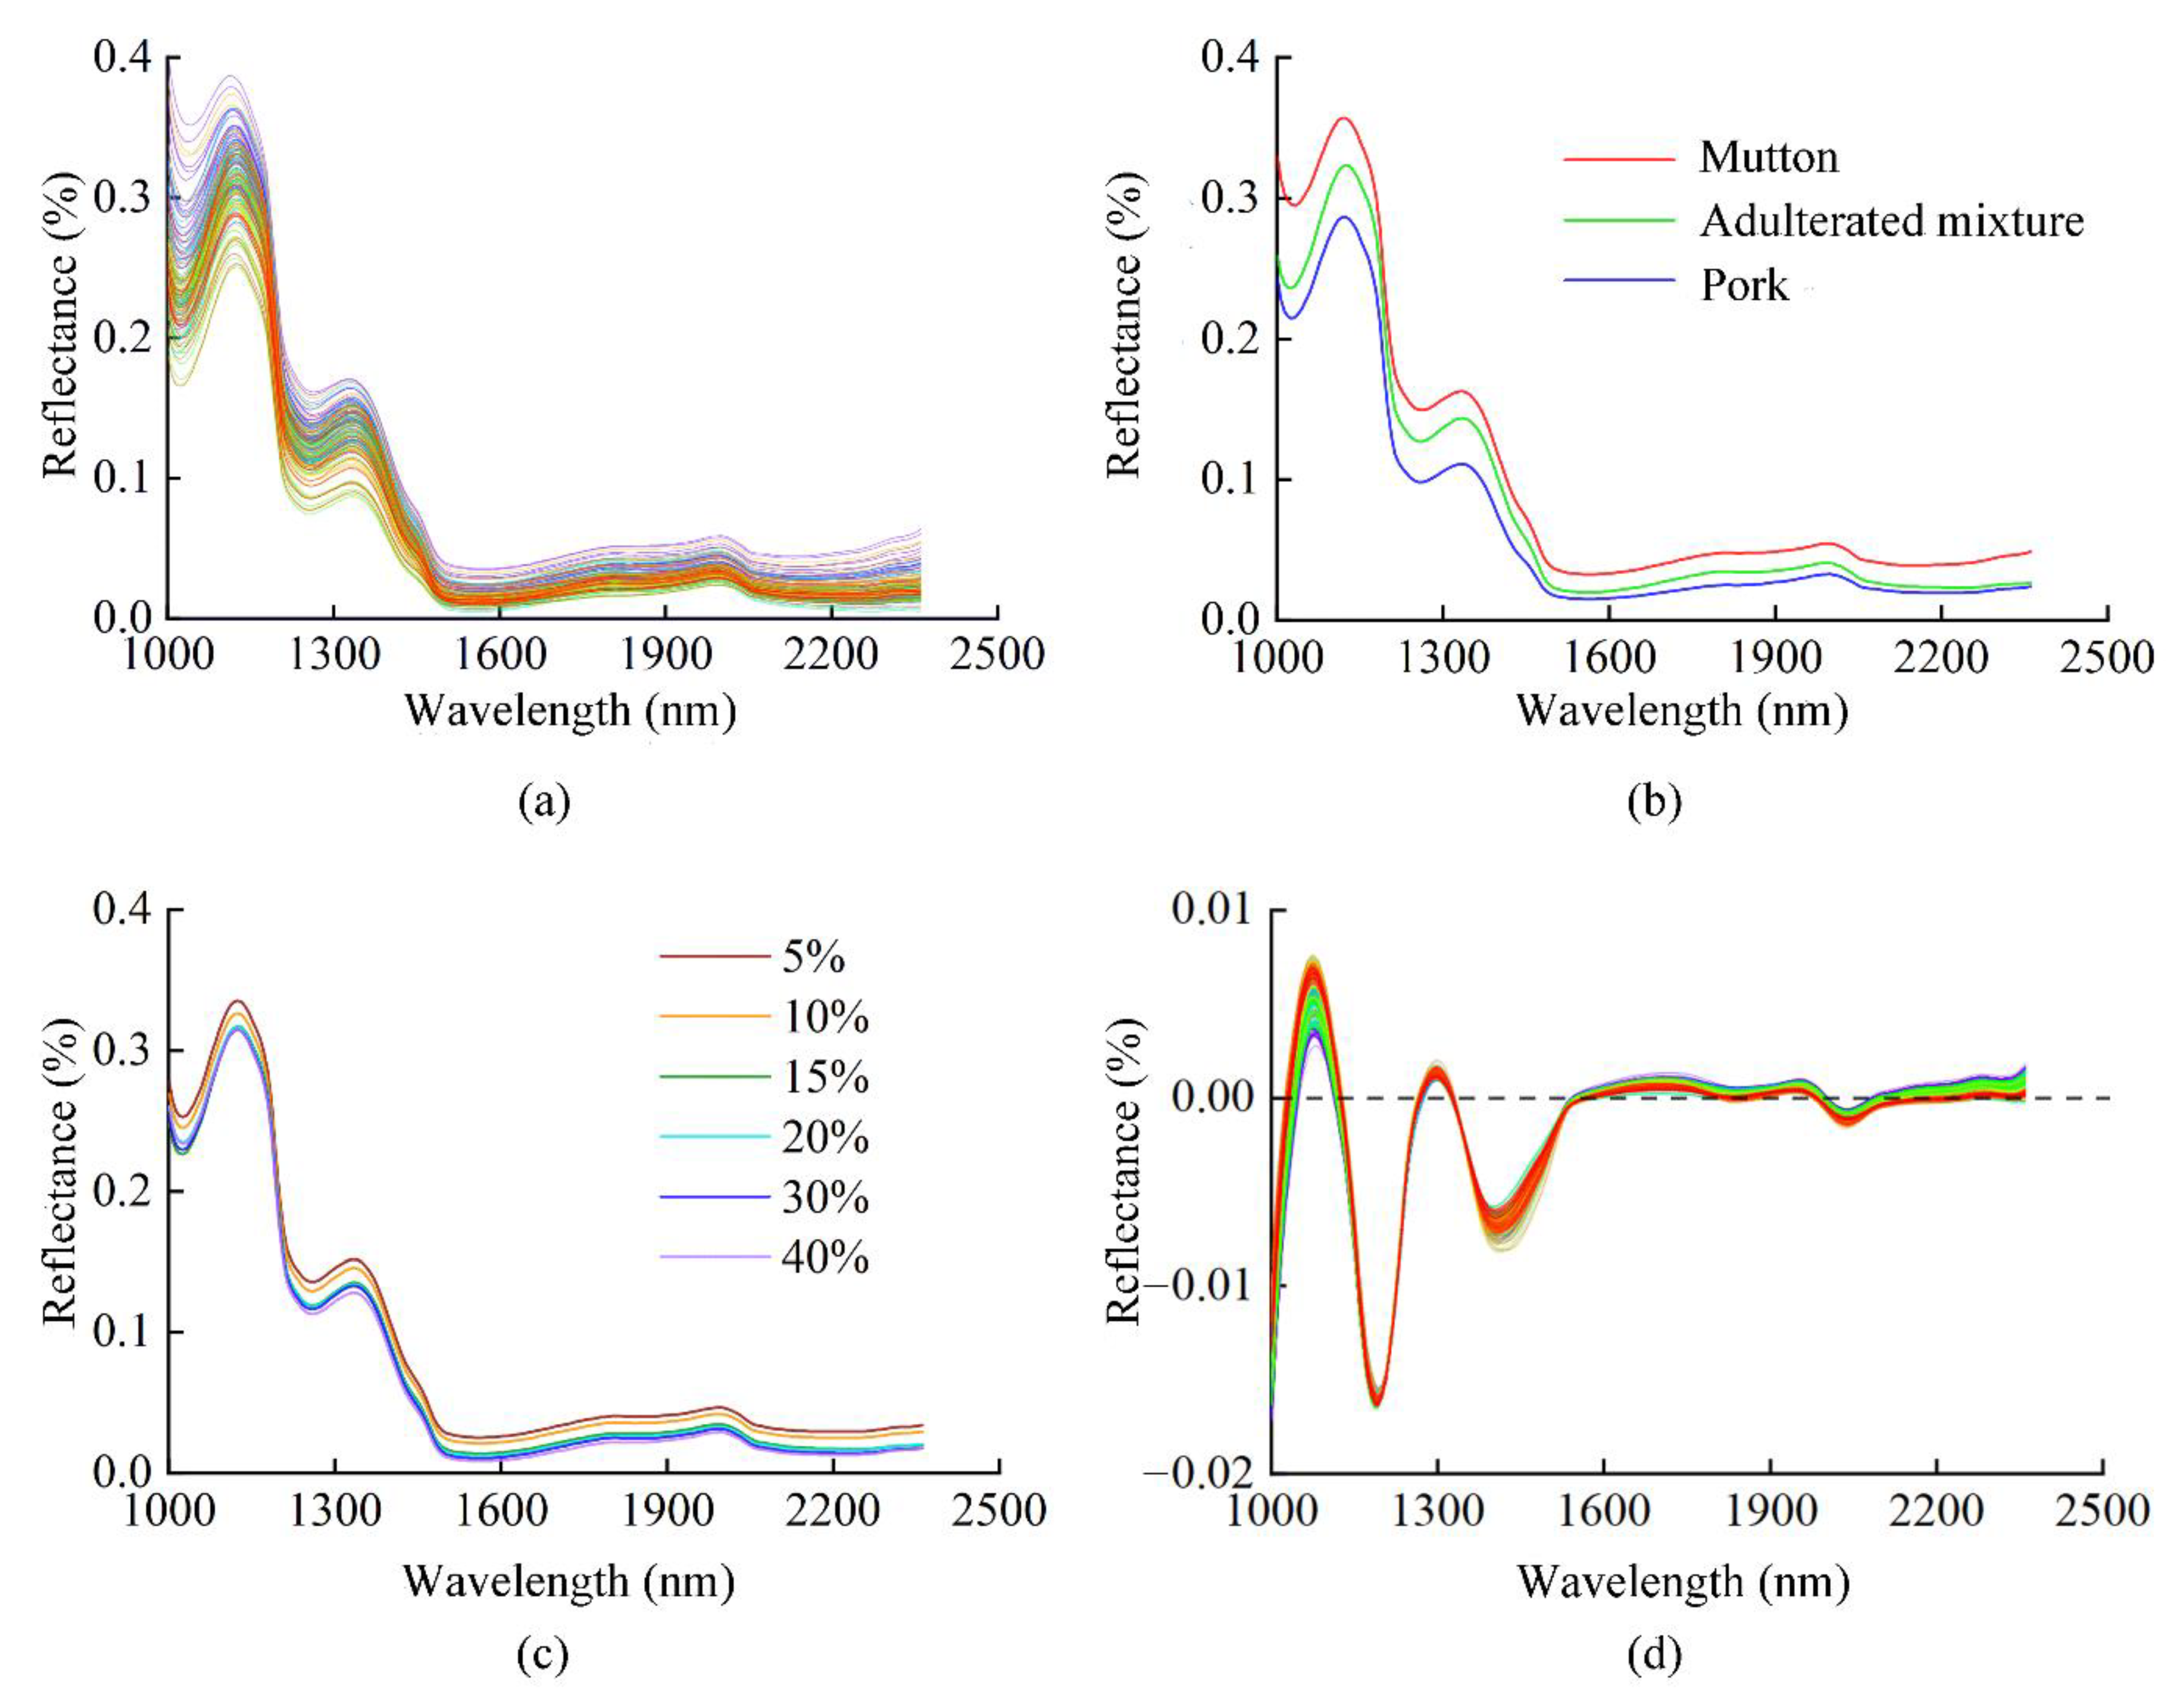
3.1. Analysis of Spectral Characteristics
3.2. Establishment and Evaluation of Classification Model
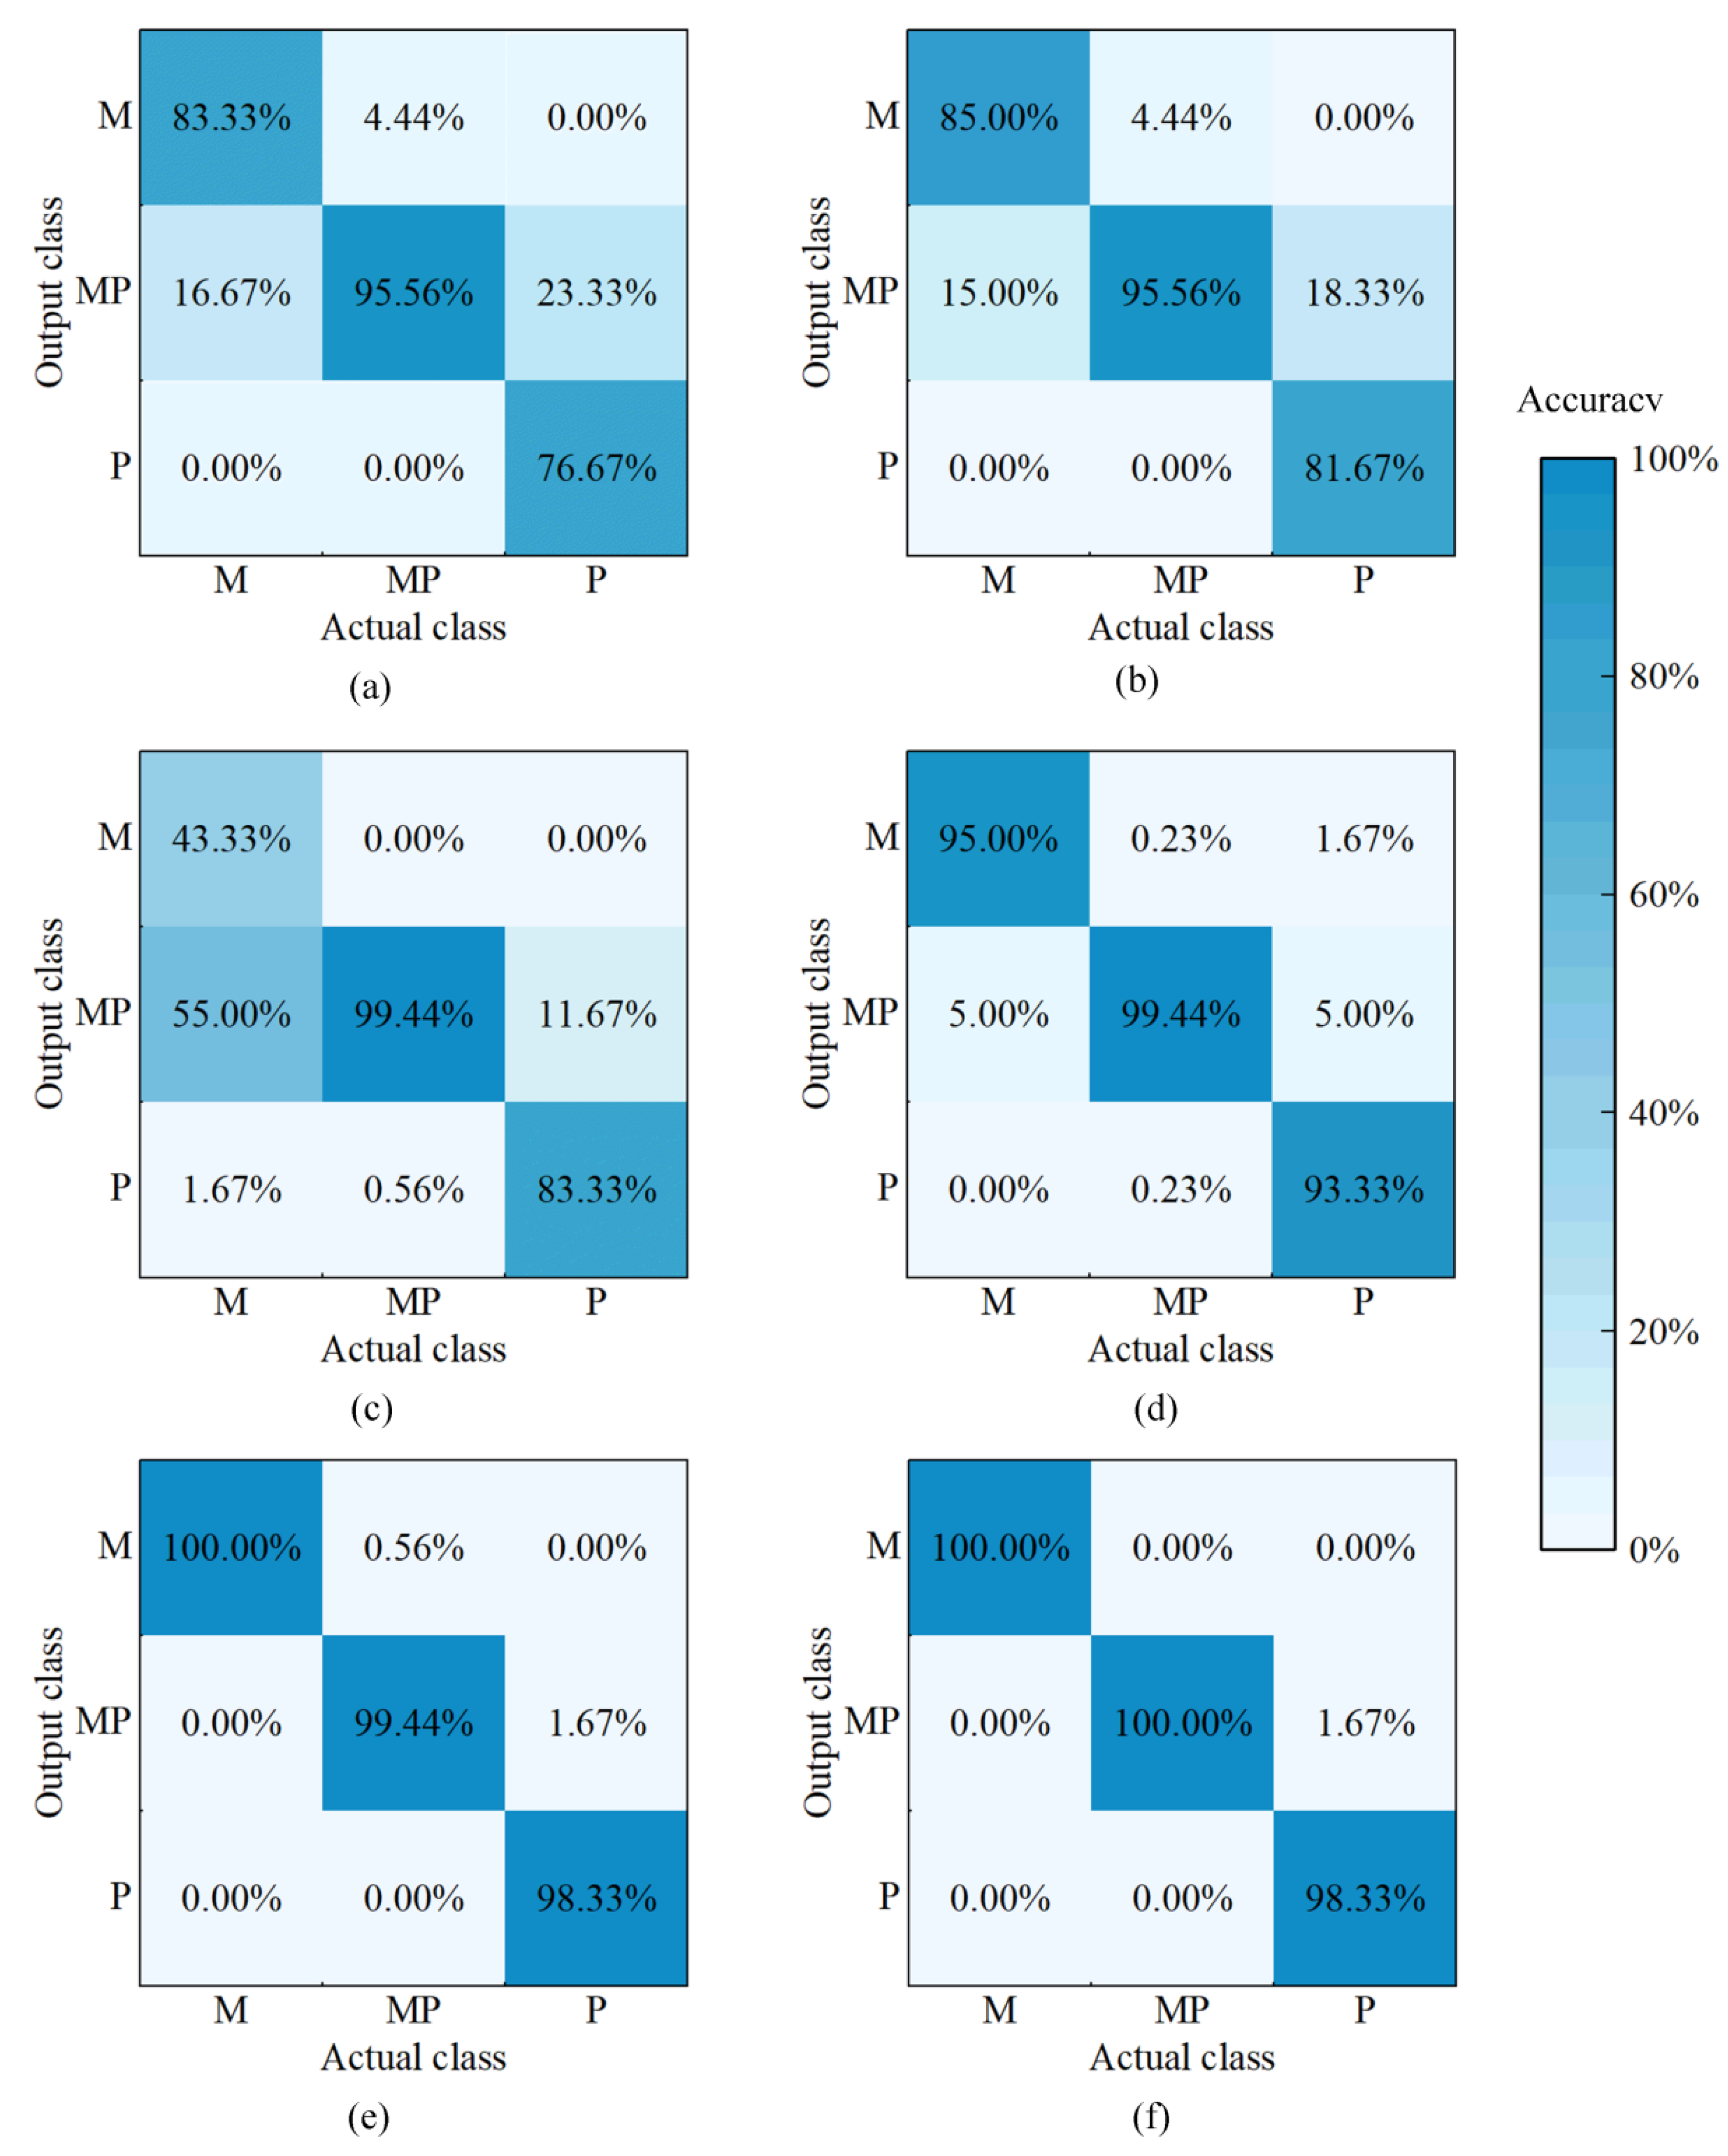
3.2.1. Model Establishment
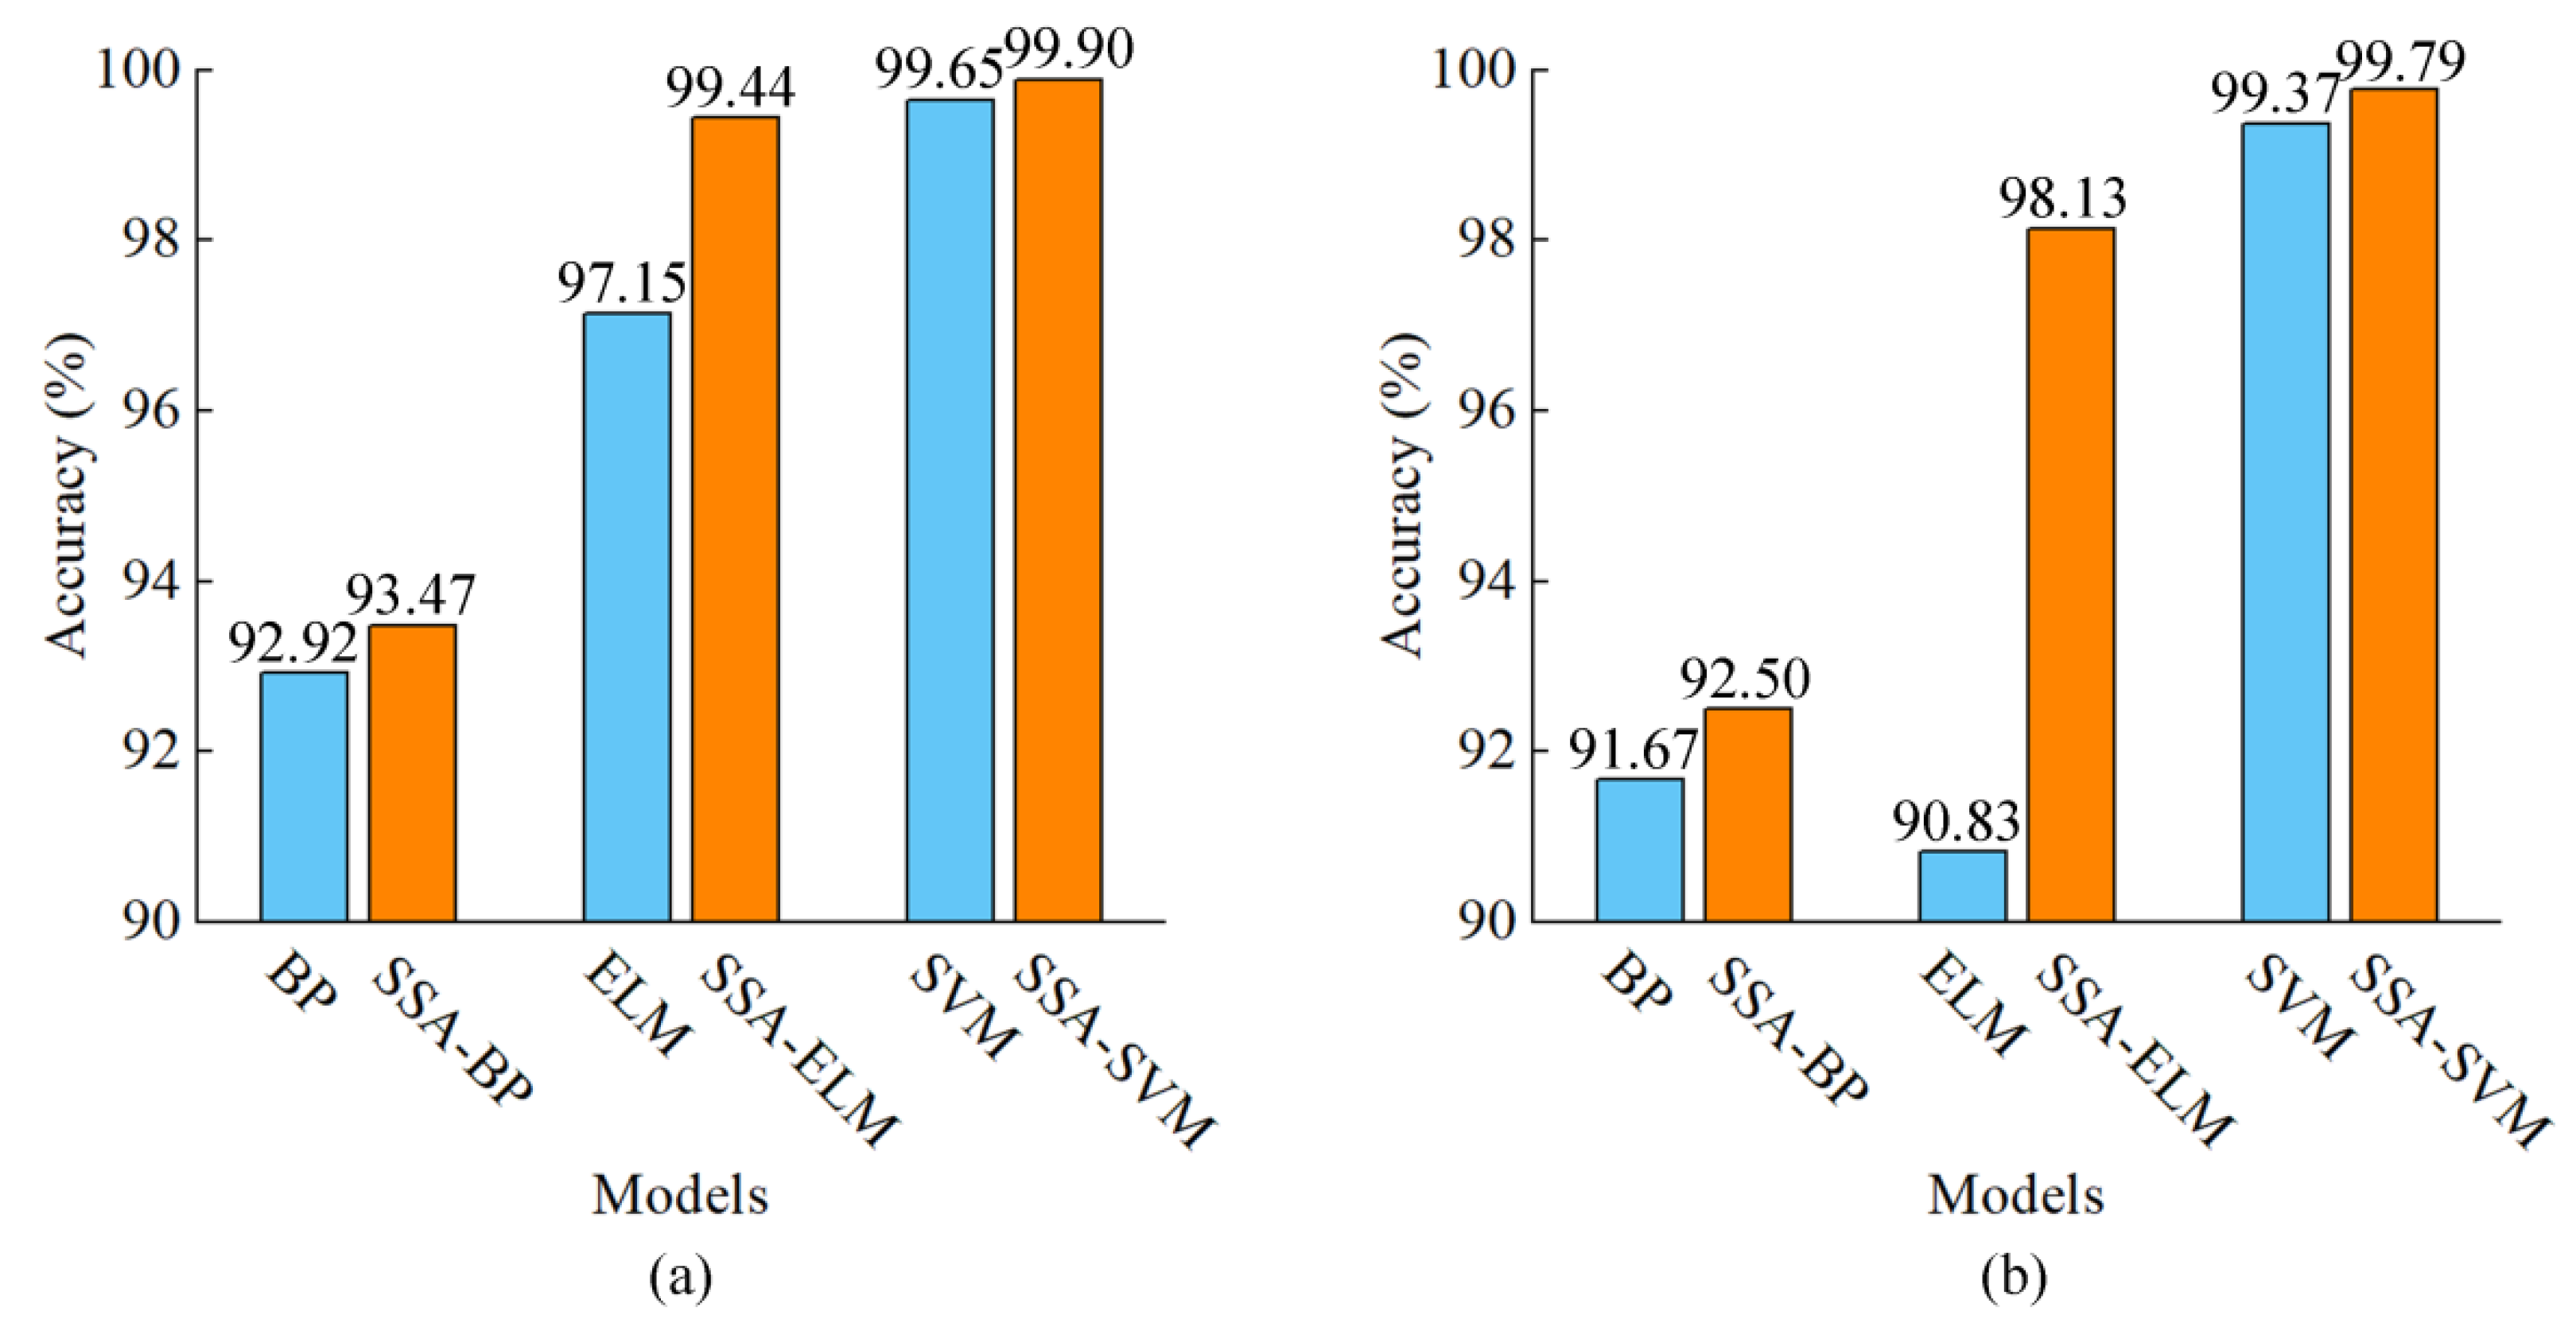
3.2.2. Model Optimisation and Comparison
3.3. Establishment and Evaluation of Quantification Model
3.3.1. Model Establishment
3.3.2. Model Optimisation and Comparison
4. Conclusions
Supplementary Materials
Author Contributions
Funding
Institutional Review Board Statement
Informed Consent Statement
Data Availability Statement
Conflicts of Interest
References
- Mohammed, H.H.H.; Jin, G.F.; Ma, M.H.; Khalifa, I.; Shukat, R.; Elkhedir, A.E.; Zeng, Q.; Noman, A.E. Comparative characterization of proximate nutritional compositions, microbial quality and safety of camel meat in relation to mutton, beef, and chicken. LWT 2020, 118, 108714. [Google Scholar] [CrossRef]
- Liu, C.C.; Chu, Z.J.; Weng, S.Z.; Zhu, G.Q.; Han, K.X.; Zhang, Z.X.; Huang, L.S.; Zhu, Z.D.; Zheng, S.G. Fusion of electronic nose and hyperspectral imaging for mutton freshness detection using input-modified convolution neural network. Food Chem. 2022, 385, 132651. [Google Scholar] [CrossRef] [PubMed]
- Zhang, Y.Y.; Liu, M.Y.; Wang, S.W.; Kang, C.D.; Zhang, M.Y.; Li, Y.Y. Identification and quantification of fox meat in meat products by liquid chromatography-tandem mass spectrometry. Food Chem. 2022, 372, 131336. [Google Scholar] [CrossRef] [PubMed]
- Jackson, L.S. Chemical Food Safety Issues in the United States: Past, Present, and Future. J. Agric. Food Chem. 2009, 57, 8161–8170. [Google Scholar] [CrossRef]
- Martins, C.; Rueff, J.; Rodrigues, A.S. Genotoxic alkenylbenzene flavourings, a contribution to risk assessment. Food Chem. Toxicol. 2018, 118, 861–879. [Google Scholar] [CrossRef] [PubMed]
- Zheng, M.; Zhang, Y.; Gu, J.; Bai, Z.; Zhu, R. Classification and quantification of minced mutton adulteration with pork using thermal imaging and convolutional neural network. Food Control 2021, 126, 108044. [Google Scholar] [CrossRef]
- Wang, Q.; Li, L.; Ding, W.; Zhang, D.; Wang, J.; Reed, K.; Zhang, B. Adulterant identification in mutton by electronic nose and gas chromatography-mass spectrometer. Food Control 2019, 98, 431–438. [Google Scholar] [CrossRef]
- Valletta, M.; Ragucci, S.; Landi, N.; Di Maro, A.; Pedone, P.V.; Russo, R.; Chambery, A. Mass spectrometry-based protein and peptide profiling for food frauds, traceability and authenticity assessment. Food Chem. 2021, 365, 130456. [Google Scholar] [CrossRef]
- Mandli, J.; El Fatimi, I.; Seddaoui, N.; Amine, A. Enzyme immunoassay (ELISA/immunosensor) for a sensitive detection of pork adulteration in meat. Food Chem. 2018, 255, 380–389. [Google Scholar] [CrossRef]
- Wang, F.; Wu, X.F.; Xu, D.S.; Chen, L.P.; Ji, L. Identification of Chicken-Derived Ingredients as Adulterants Using Loop-Mediated Isothermal Amplification. J. Food Prot. 2020, 83, 1175–1180. [Google Scholar] [CrossRef]
- Liu, R.; Wang, X.; Wang, X.; Shi, Y.; Shi, C.; Wang, W.; Ma, C. A simple isothermal nucleic acid amplification method for the effective on-site identification for adulteration of pork source in mutton. Food Control 2019, 98, 297–302. [Google Scholar] [CrossRef]
- Prachugsorn, A.; Thanakiatkrai, P.; Phooplub, K.; Ouiganon, S.; Sriaead, Y.; Thavarungkul, P.; Kanatharana, P.; Buranachai, C.; Kitpipit, T. Detection of porcine DNA in food using direct asymmetric PCR and catalyzed hairpin assembly fluorescent biosensor: A novel assay for halal food analysis. Food Control 2022, 139, 108989. [Google Scholar] [CrossRef]
- Chen, J.R.; Yan, W.J.; Fu, Y.; Wang, L.; Lv, X.Z.; Dai, R.T.; Li, X.M.; Jia, F. The Use of Electronic Nose in the Quality Evaluation and Adulteration Identification of Beijing-You Chicken. Foods 2022, 11, 782. [Google Scholar] [CrossRef] [PubMed]
- Tian, X.J.; Wang, J.; Shen, R.Q.; Ma, Z.R.; Li, M.S. Discrimination of pork/chicken adulteration in minced mutton by electronic taste system. Int. J. Food Sci. Technol. 2019, 54, 670–678. [Google Scholar] [CrossRef]
- Fengou, L.C.; Lianou, A.; Tsakanikas, P.; Mohareb, F.; Nychas, G.J.E. Detection of Meat Adulteration Using Spectroscopy-Based Sensors. Foods 2021, 10, 861. [Google Scholar] [CrossRef] [PubMed]
- Siddiqui, M.A.; Khir, M.H.M.; Witjaksono, G.; Ghumman, A.S.M.; Junaid, M.; Magsi, S.A.; Saboor, A. Multivariate Analysis Coupled with M-SVM Classification for Lard Adulteration Detection in Meat Mixtures of Beef, Lamb, and Chicken Using FTIR Spectroscopy. Foods 2021, 10, 2405. [Google Scholar] [CrossRef]
- Gowen, A.A.; O’Donnell, C.P.; Cullen, P.J.; Downey, G.; Frias, J.M. Hyperspectral imaging—An emerging process analytical tool for food quality and safety control. Trends Food Sci. Technol. 2007, 18, 590–598. [Google Scholar] [CrossRef]
- Khamsopha, D.; Woranitta, S.; Teerachaichayut, S. Utilizing near infrared hyperspectral imaging for quantitatively predicting adulteration in tapioca starch. Food Control 2021, 123. [Google Scholar] [CrossRef]
- Laborde, A.; Puig-Castellvi, F.; Bouveresse, D.J.R.; Eveleigh, L.; Cordella, C.; Jaillais, B. Detection of chocolate powder adulteration with peanut using near-infrared hyperspectral imaging and Multivariate Curve Resolution. Food Control 2021, 119, 107454. [Google Scholar] [CrossRef]
- Jiang, H.Z.; Ru, Y.; Chen, Q.; Wang, J.P.; Xu, L.Y. Near-infrared hyperspectral imaging for detection and visualization of offal adulteration in ground pork. Spectrochim. Acta Part A 2021, 249, 119307. [Google Scholar] [CrossRef]
- Jiang, H.; Cheng, F.; Shi, M. Rapid Identification and Visualization of Jowl Meat Adulteration in Pork Using Hyperspectral Imaging. Foods 2020, 9, 154. [Google Scholar] [CrossRef] [PubMed] [Green Version]
- Leng, T.; Li, F.; Xiong, L.A.; Xiong, Q.; Zhu, M.T.; Chen, Y. Quantitative detection of binary and ternary adulteration of minced beef meat with pork and duck meat by NIR combined with chemometrics. Food Control 2020, 113, 107203. [Google Scholar] [CrossRef]
- Nunes, K.M.; Andrade, M.V.O.; Almeida, M.R.; Sena, M.M. A soft discriminant model based on mid-infrared spectra of bovine meat purges to detect economic motivated adulteration by the addition of non-meat ingredients. Food Anal. Method 2020, 13, 1699–1709. [Google Scholar] [CrossRef]
- Lu, B.; Han, F.K.; Aheto, J.H.; Rashed, M.M.A.; Pan, Z.G. Artificial bionic taste sensors coupled with chemometrics for rapid detection of beef adulteration. Food Sci. Nutr. 2021, 9, 5220–5228. [Google Scholar] [CrossRef] [PubMed]
- Sun, Y.A.; Zhang, M.; Adhikari, B.; Devahastin, S.; Wang, H.X. Double-layer indicator films aided by BP-ANN-enabled freshness detection on packaged meat products. Food Packag. Shelf. 2022, 31, 100808. [Google Scholar] [CrossRef]
- Shen, G.H.; Cao, Y.Y.; Yin, X.C.; Dong, F.; Xu, J.H.; Shi, J.R.; Lee, Y.W. Rapid and nondestructive quantification of deoxynivalenol in individual wheat kernels using near-infrared hyperspectral imaging and chemometrics. Food Control 2022, 131, 108420. [Google Scholar] [CrossRef]
- Sun, Y.R.; Zhang, H.N.; Liu, G.S.; He, J.G.; Cheng, L.J.; Li, Y.; Pu, F.N.; Wang, H. Quantitative Detection of Myoglobin Content in Tan Mutton During Cold Storage by Near-infrared Hyperspectral Imaging. Food Anal. Method 2022, 15, 2132–2144. [Google Scholar] [CrossRef]
- Chen, T.; Ma, L.J.; Tang, Z.Q.; Yu, L.X. Identification of coumarin-based food additives using terahertz spectroscopy combined with manifold learning and improved support vector machine. J. Food Sci. 2022, 87, 1108–1118. [Google Scholar] [CrossRef]
- Tang, Y.Q.; Li, C.H. An Online Network Intrusion Detection Model Based on Improved Regularized Extreme Learning Machine. IEEE Access 2021, 9, 94826–94844. [Google Scholar] [CrossRef]
- Huang, L.S.; Wu, K.; Huang, W.J.; Dong, Y.Y.; Ma, H.Q.; Liu, Y.; Liu, L.Y. Detection of Fusarium Head Blight in Wheat Ears Using Continuous Wavelet Analysis and PSO-SVM. Agriculture 2021, 11, 998. [Google Scholar] [CrossRef]
- Guan, X.; Liu, J.; Huang, Q.R.; Li, J.J. Assessing the Freshness of Meat by Using Quantum-Behaved Particle Swarm Optimization and Support Vector Machine. J. Food Prot. 2013, 76, 1916–1922. [Google Scholar] [CrossRef] [PubMed]
- Jiang, X.H.; Xue, H.R.; Zhang, L.N.; Gao, X.J.; Wu, G.D.; Bai, J. Nondestructive detection of chilled mutton freshness based on multi-label information fusion and adaptive BP neural network. Comput. Electron. Agric. 2018, 155, 371–377. [Google Scholar]
- Meng, L.; Zhu, R.; Bai, Z.; Zheng, M.; Gu, J.; Ma, B. Discrimination of Chilled Lamb from Different Carcass Parts at Different Storage Times Based on Mobile Phone Images. Food Sci. 2020, 41, 21–26. [Google Scholar]
- Xue, J.; Shen, B. A novel swarm intelligence optimization approach: Sparrow search algorithm. Syst. Sci. Control Eng. 2020, 8, 22–34. [Google Scholar] [CrossRef]
- Chen, Y.; Duan, W.L.; Yang, Y.; Liu, Z.; Zhang, Y.B.; Liu, J.F.; Li, S.H. Rapid in measurements of brown tide algae cell concentrations using fluorescence spectrometry and generalized regression neural network. Spectrochim. Acta A 2022, 272, 120967. [Google Scholar] [CrossRef]
- Zhang, J.N.; Xia, K.W.; He, Z.P.; Yin, Z.X.; Wang, S.J. Semi-Supervised Ensemble Classifier with Improved Sparrow Search Algorithm and Its Application in Pulmonary Nodule Detection. Math. Probl. Eng. 2021, 2021, 6622935. [Google Scholar] [CrossRef]
- Gai, J.B.; Zhong, K.Y.; Du, X.J.; Yan, K.; Shen, J.X. Detection of gear fault severity based on parameter-optimized deep belief network using sparrow search algorithm. Measurement 2021, 185, 110079. [Google Scholar] [CrossRef]
- Liu, J.P.; Hu, P.W.; Xue, H.R.; Pan, X.; Chen, C. Prediction of milk protein content based on improved sparrow search algorithm and optimized back propagation neural network. Spectrosc. Lett. 2022, 55, 229–239. [Google Scholar] [CrossRef]
- Kamruzzaman, M.; ElMasry, G.; Sun, D.W.; Allen, P. Non-destructive assessment of instrumental and sensory tenderness of lamb meat using NIR hyperspectral imaging. Food Chem. 2013, 141, 389–396. [Google Scholar] [CrossRef]
- Gao, Q.; Wang, P.; Niu, T.; He, D.J.; Wang, M.L.; Yang, H.J.; Zhao, X.Q. Soluble solid content and firmness index assessment and maturity discrimination of Malus micromalus Makino based on near-infrared hyperspectral imaging. Food Chem. 2022, 370, 131013. [Google Scholar] [CrossRef]
- Diwu, P.Y.; Bian, X.H.; Wang, Z.F.; Liu, W. Study on the Selection of Spectral Preprocessing Methods. Spectrosc. Spect. Anal. 2019, 39, 2800–2806. [Google Scholar]
- Lu, H.P.; Jiang, H.; Chen, Q.S. Determination of Fatty Acid Content of Rice during Storage Based on Feature Fusion of Olfactory Visualization Sensor Data and Near-Infrared Spectra. Sensors 2021, 21, 3266. [Google Scholar] [CrossRef] [PubMed]
- Yan, J.S.; Tian, H.; Wang, S.; Wang, Z.P.; Xu, H.R. Paddy moisture on-line detection based on ensemble preprocessing and modeling for combine harvester. Comput. Electron. Agric. 2022, 198, 107050. [Google Scholar] [CrossRef]
- Liu, S.Y.; Wang, S.T.; Hu, C.H.; Zhan, S.J.; Kong, D.M.; Wang, J.Z. Rapid and accurate determination of diesel multiple properties through NIR data analysis assisted by machine learning. Spectrochim. Acta A 2022, 277, 121261. [Google Scholar] [CrossRef]
- Yin, H.; Lv, J.W.; Chen, Y.C.; Cen, H.L.; Li, J.B.; Liu, S.Y. Prediction of CO2 Concentration in Xinjiang Breeding Environment of Mutton Sheep Based on LightGBM-SSA-ELM. Trans. Chin. Soc. Agric. Mach. 2022, 53, 261–270. [Google Scholar]
- Bai, X.X.; Cao, A.Y.; Cai, W.; Wen, Y.Y.; Liu, Y.Q.; Wang, S.W.; Li, X.W. Rock burst mechanism induced by stress anomaly in roof thickness variation zone: A case study. Geomat. Nat. Hazards Risk 2022, 13, 1805–1830. [Google Scholar] [CrossRef]
- Zou, X.B.; Zhao, J.W.; Povey, M.J.W.; Holmes, M.; Mao, H.P. Variables selection methods in near-infrared spectroscopy. Anal. Chim. Acta 2010, 667, 14–32. [Google Scholar]
- Pu, H.B.; Kamruzzaman, M.; Sun, D.W. Selection of feature wavelengths for developing multispectral imaging systems for quality, safety and authenticity of muscle foods-a review. Trends Food Sci. Technol. 2015, 45, 86–104. [Google Scholar] [CrossRef]


| Models | Calibration Set (10-Fold Cross-Validation) | Prediction Set |
|---|---|---|
| Accuracy (%) | Accuracy (%) | |
| BP | 92.92% | 91.67% |
| ELM | 97.15% | 90.83% |
| SVM | 99.65% | 99.37% |
| SSA-BP | 93.47% | 92.50% |
| SSA-ELM | 99.44% | 98.13% |
| SSA-SVM | 99.90% | 99.79% |
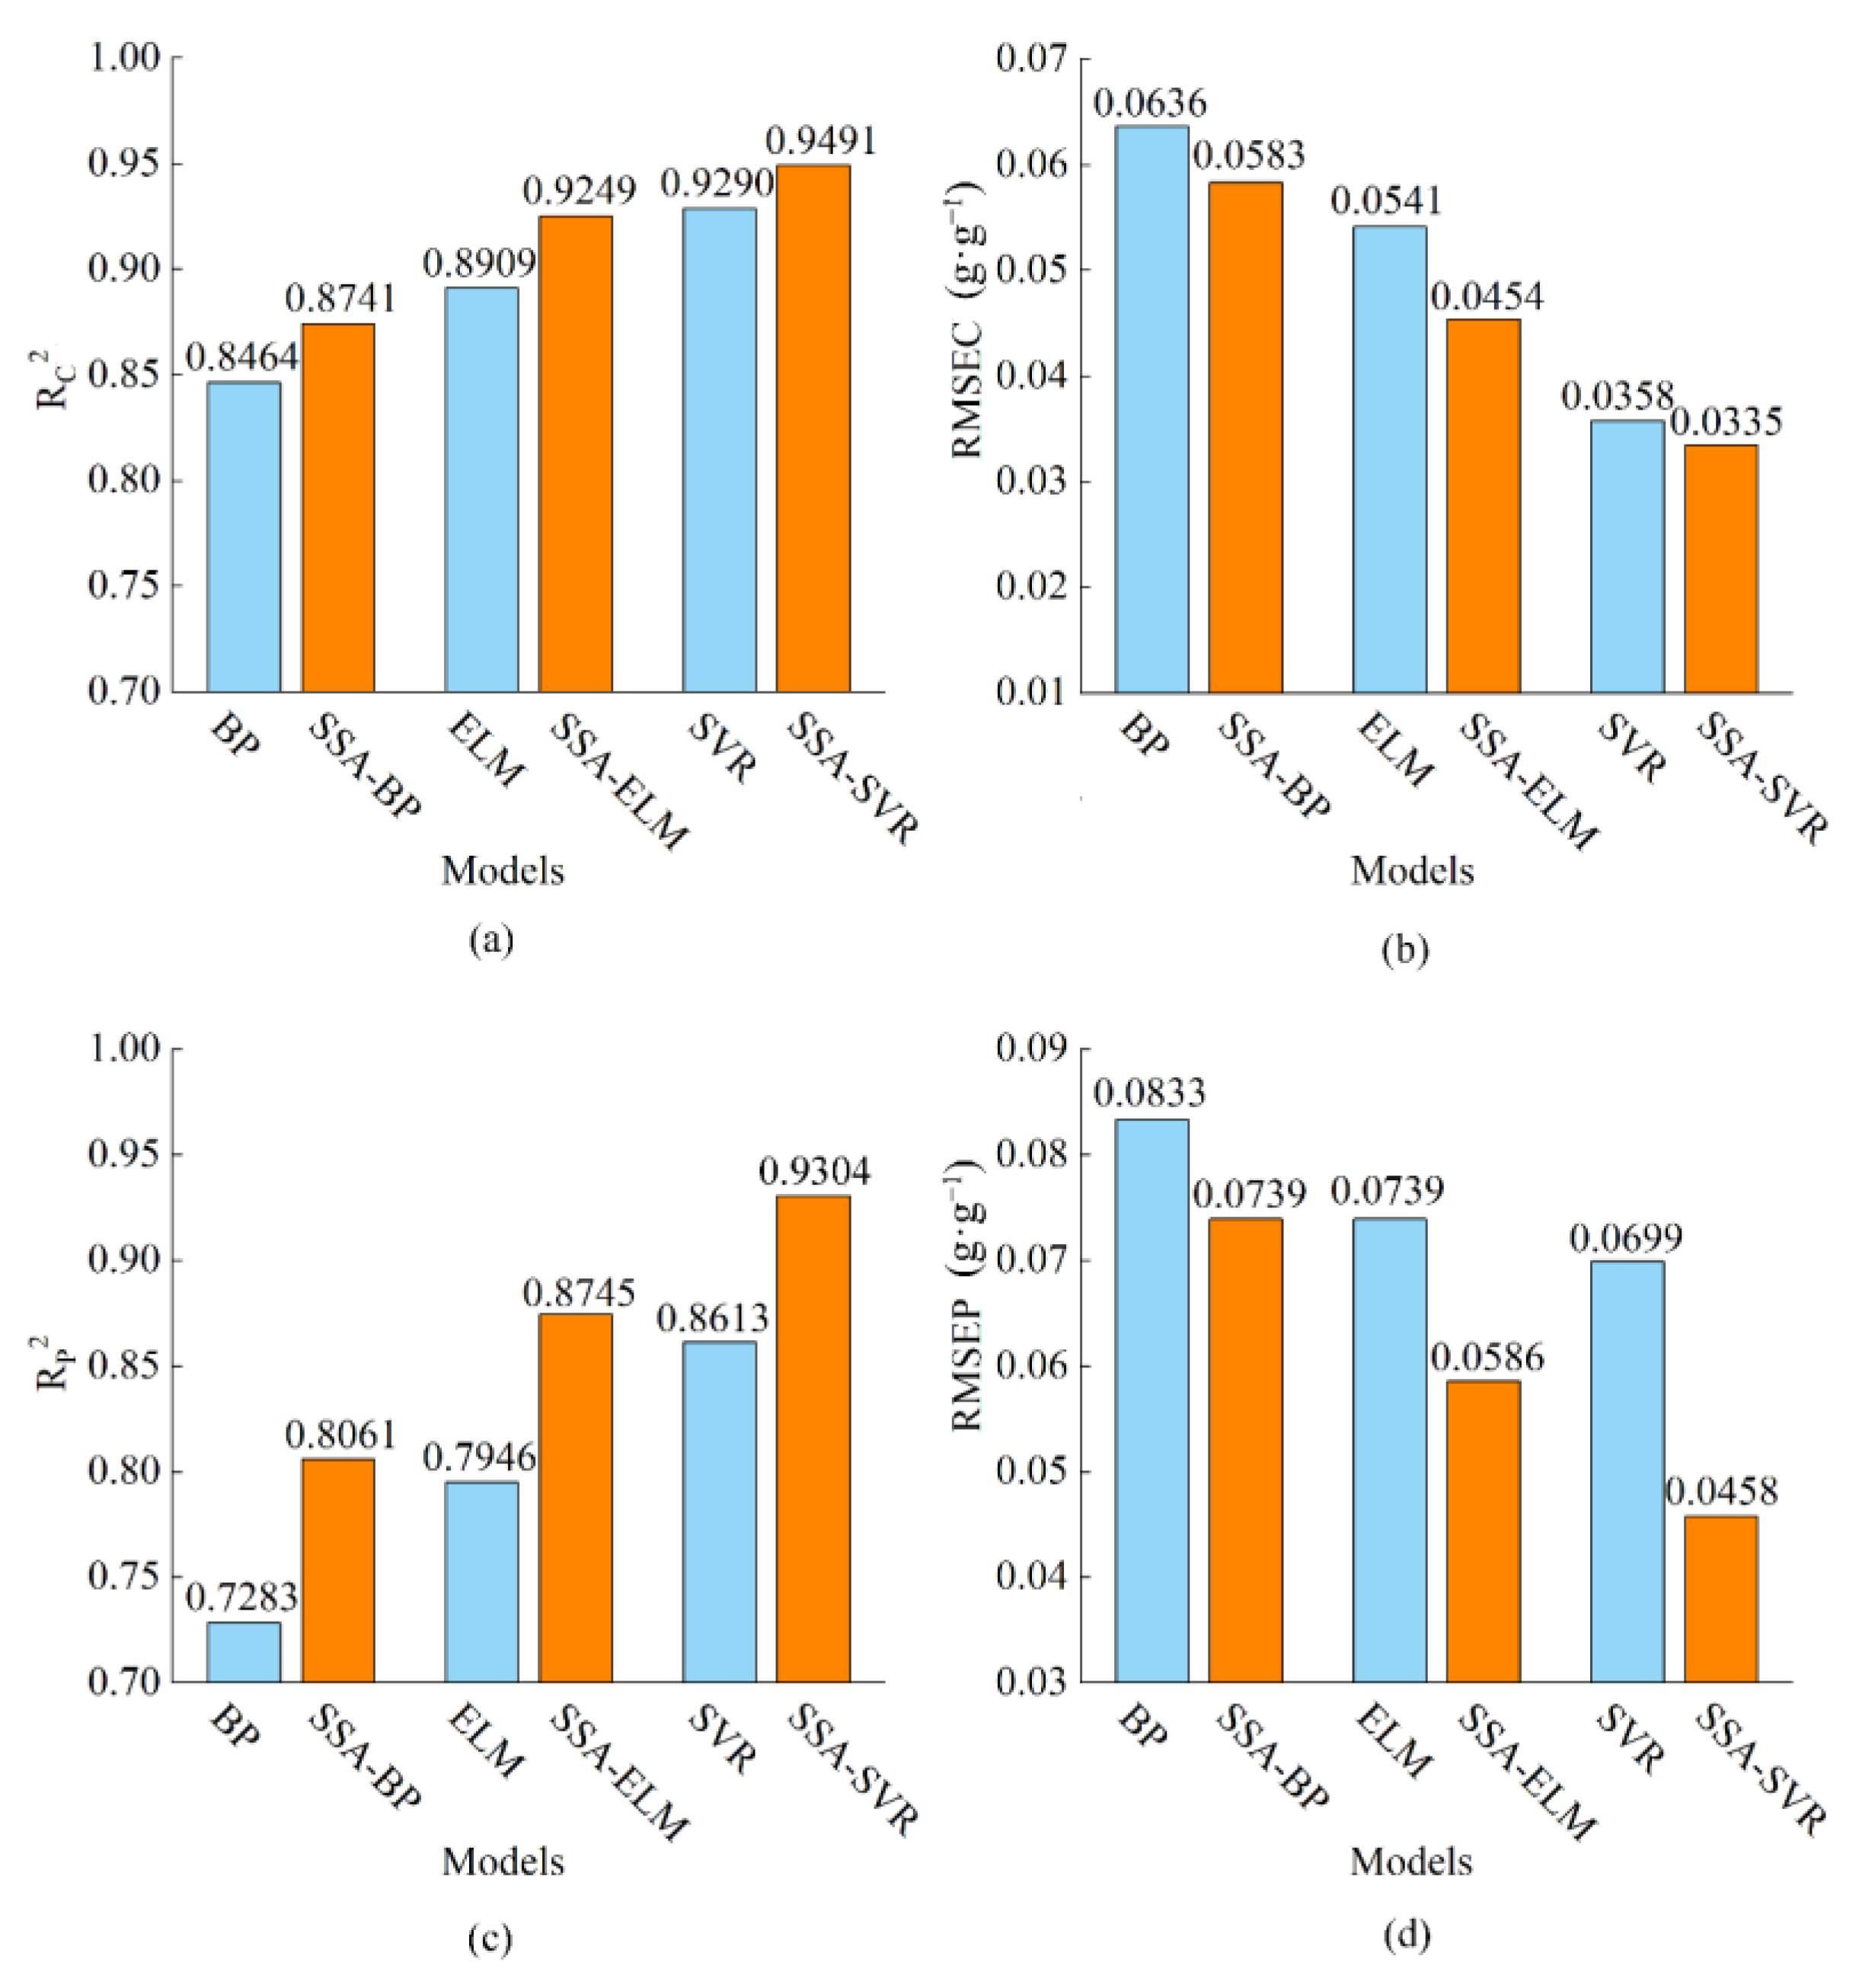
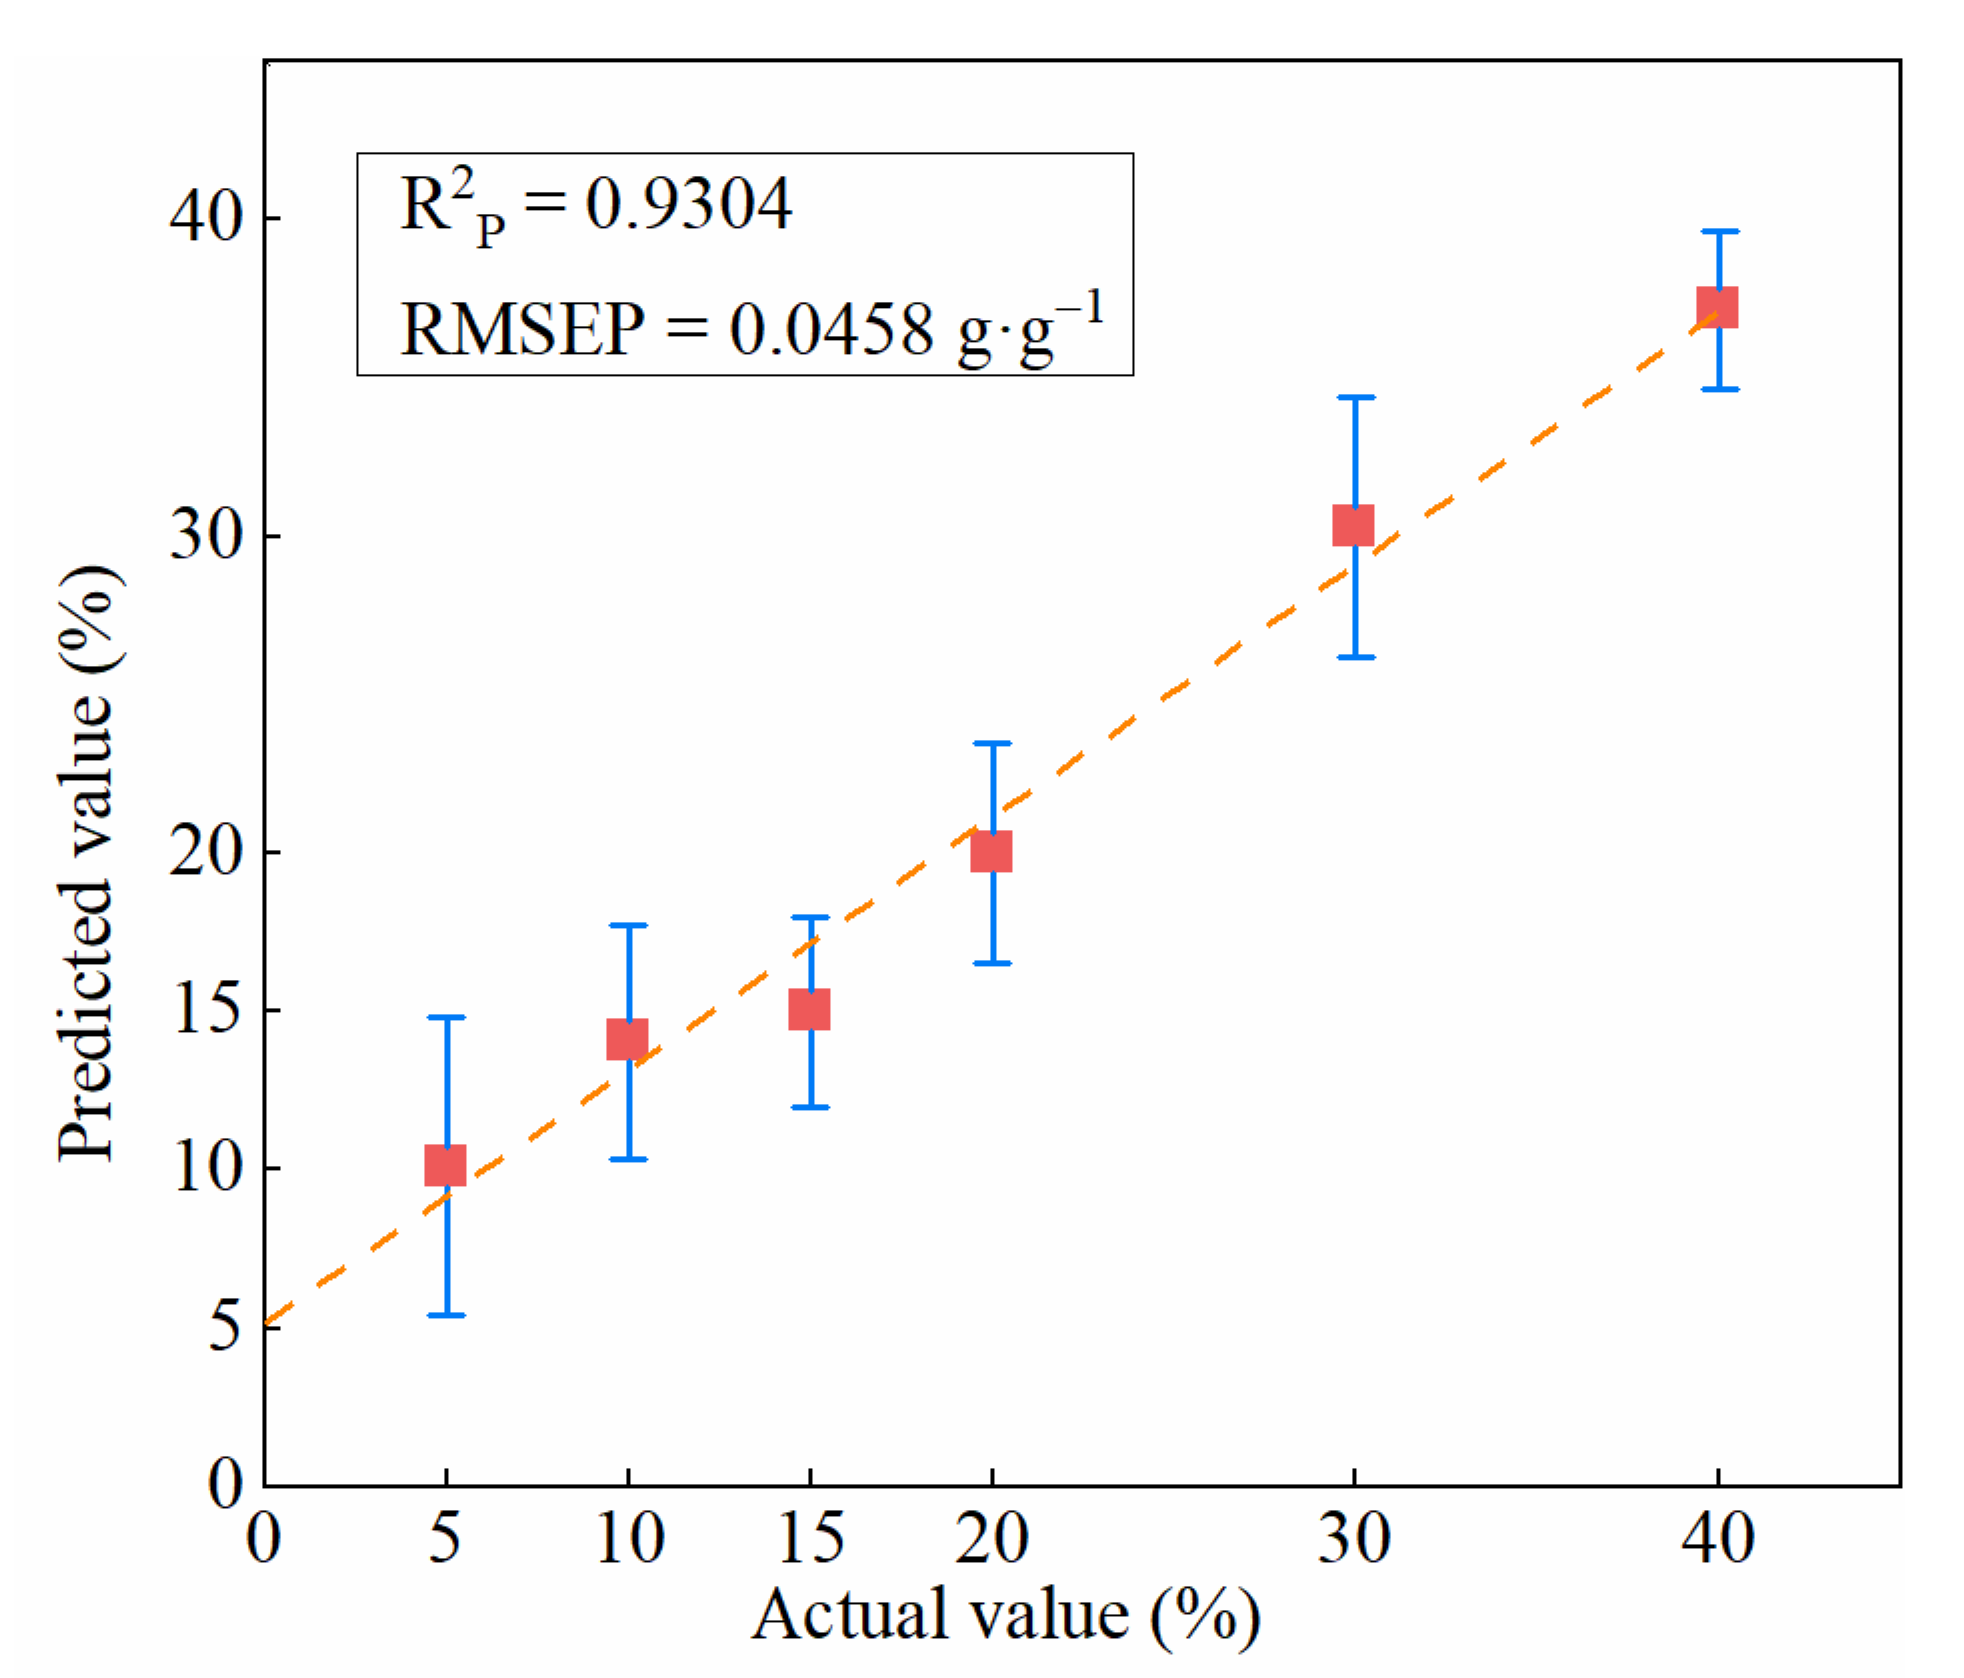
| Models | Calibration Set (10-Fold Cross-Validation) | Prediction Set | ||
|---|---|---|---|---|
| RC2 | RMSEC (g·g−1) | RP2 | RMSEP (g·g−1) | |
| BP | 0.8464 | 0.0636 | 0.7283 | 0.0833 |
| ELM | 0.8910 | 0.0542 | 0.7946 | 0.0739 |
| SVR | 0.9290 | 0.0359 | 0.8613 | 0.0699 |
| SSA-BP | 0.8741 | 0.0583 | 0.8061 | 0.0739 |
| SSA-ELM | 0.9249 | 0.0454 | 0.8745 | 0.0586 |
| SSA-SVR | 0.9491 | 0.0335 | 0.9304 | 0.0458 |
Publisher’s Note: MDPI stays neutral with regard to jurisdictional claims in published maps and institutional affiliations. |
© 2022 by the authors. Licensee MDPI, Basel, Switzerland. This article is an open access article distributed under the terms and conditions of the Creative Commons Attribution (CC BY) license (https://creativecommons.org/licenses/by/4.0/).
Share and Cite
Fan, B.; Zhu, R.; He, D.; Wang, S.; Cui, X.; Yao, X. Evaluation of Mutton Adulteration under the Effect of Mutton Flavour Essence Using Hyperspectral Imaging Combined with Machine Learning and Sparrow Search Algorithm. Foods 2022, 11, 2278. https://doi.org/10.3390/foods11152278
Fan B, Zhu R, He D, Wang S, Cui X, Yao X. Evaluation of Mutton Adulteration under the Effect of Mutton Flavour Essence Using Hyperspectral Imaging Combined with Machine Learning and Sparrow Search Algorithm. Foods. 2022; 11(15):2278. https://doi.org/10.3390/foods11152278
Chicago/Turabian StyleFan, Binbin, Rongguang Zhu, Dongyu He, Shichang Wang, Xiaomin Cui, and Xuedong Yao. 2022. "Evaluation of Mutton Adulteration under the Effect of Mutton Flavour Essence Using Hyperspectral Imaging Combined with Machine Learning and Sparrow Search Algorithm" Foods 11, no. 15: 2278. https://doi.org/10.3390/foods11152278