1. Introduction
Two recent papers showed how different degrees of cooking and milling of wheat grain could be used to modify the glycaemic response in eight products [
1,
2]. Associated changes in starch digestibility were not measured. To fill this knowledge gap, we carried out timed in vitro digestive analysis of starch in the same products as were used in the foregoing clinical trials. The results are of interest for a number of reasons. In vitro analysis of starch digestibility in such a set of physiologically characterised samples may help to explain directly how the cooking and milling processes lead to the measured differences in glycaemic response. The analyses may also identify changes in starch fractions in wholegrains that have benefits, such as improved colonic health, secondary to the primary aim of reducing glycaemic potency. Having the two sets of data—from the clinical and in vitro digestive analyses—on the same samples also provides an opportunity to reassess the accuracy and relative precision of in vitro digestive analysis in developing products of low glycaemic impact. Furthermore, if data on starch digestion from timed sampling during in vitro digestion accurately predict a time-dependent physiological response, the starch analysis will have been physiologically validated.
Having timed the in vitro and in vivo responses for two texturally contrasting types of wholegrain products, porridges, and bread, also provides an opportunity to examine the effect of product type on glycaemic analysis. Porridges, such as mueslis, are grains ingested as slurries, require little chewing to swallow, and their starch component is derived wholly from partially intact grain fragments. In bread, on the other hand, grain particles are embedded in a relatively dry starch-based matrix which requires chewing and bolus formation to be easily swallowed. The inhibitory effect of coarse wheat grain structure on the glycaemic response to bread is largely eliminated during normal ingestion because of the effects of mastication [
3]. Therefore, in vitro digestive analysis without an oral processing step that involves crushing should predict the glycaemic effects of grain particles consumed in porridges more accurately than when consumed in bread. Bread should be a less effective medium than porridges in which to capture the glycaemia-limiting benefits of grain structure retained by minimal processing.
A number of factors determine the effects of minimal processing on starch digestibility and have been exploited to make products of reduced glycaemic potency [
4]. Native structures in wheat may inhibit starch digestion at a number of levels [
5]. At the molecular level, the organisation of starch chains within granules retards digestion until disrupted by gelatinisation during hydrothermal processing [
6,
7]. At the morphological level, the starch density in the intact endosperm and an impenetrable seed coat may retard ingress of water for hydration and swelling of starch and limit access of digestive enzymes [
8,
9], particularly in wholegrain particles with an adherent seed coat. With such diverse factors acting to retard starch digestion, the interaction of particle size and cooking is likely to lead to a specific spectrum of nutritionally relevant starch fractions in any product. The starch complement may include rapidly digested (RDS), slowly digested (SDS), inaccessible (Type 1 resistant (RS1)), and ungelatinised (Type 2 resistant (RS2)) starches, with the proportions of the fractions depending on processing history [
10,
11]. Rapidly digested starch has been associated with postprandial hyperglycaemia [
12], which may induce a subsequent transitional insulin-driven hypoglycaemic over-reaction in both healthy and metabolically impaired individuals [
13]. More slowly digested starch induces a lower postprandial glucose peak but may sustain blood glucose above fasting into the late postprandial, inter-meal period [
14]. Resistant starch fractions, which are, by definition, forms of dietary fibre, may act as prebiotics, with microbiota-mediated gut health benefits [
15]. Such functional diversity in cereal starch fractions no doubt contributes to the multiple benefits recently linked to “carbohydrate quality” in whole grains [
16]. It justifies analysing starch fractions in whole grain products because of the secondary health benefits they may have, even if developed primarily for low glycaemic impact.
Establishing a valid association between changes in starch fractions and glycaemic impact would require measurement of starch digestion in the same material as was responsible for the glycaemic response, with a sampling of intestinal contents. However, if an in vitro digestion method used to determine starch fractions releases digestion product at a rate that correlates closely with the glycaemic response, it is likely to provide an accurate estimate of the starch fractions in vivo associated with the response and would validate the method. A method based on clinical data has been developed. It provides simulated blood glucose response curves by progressively subtracting estimated blood glucose disposal from available carbohydrates released in the course of in vitro digestion [
17]. The area under these curves may be used to obtain an accurate in vitro estimation of glycaemic index (GI) by the same trapezoid summation analysis as is used in the clinical determination of GI [
18]. If the GI values obtained during in vitro starch analysis accurately predict clinical GI values determined on the same material, it would provide concurrent validation of the method.
An aim of the present research was to determine how the content of nutritionally relevant starch fractions in wheat grain products would change as a result of processing to reduce the glycaemic potency of the products. A second aim was to test the correlation between GIs of the products predicted from in vitro digestion and GIs determined from the incremental area under the postprandial blood glucose response curves, as a test of the accuracy of the in vitro digestive analysis, and as a concurrent validation of the starch, fractions measured. A further aim was to determine whether the type of product in which kibbled wheat structure was ingested affected the survival of the low glycaemic and resistant starch properties of the kibbled grains. Two auxiliary experiments were conducted on the effects of cutting, crushing and cooking, respectively, on the digestibility of starch in cereal grains to demonstrate the effect of the individual physical processes on the glycaemic potency of cereal products. Finally, the research illustrates how processing steps taken to reduce the glycaemic impact of cereal products may lead to secondary changes in starch fractions considered to be of potential benefit to gut health [
15].
2. Materials and Methods
2.1. Samples
Four bread and four porridge samples (
Table 1) were prepared for clinical trials, and sub-samples supplied for the in vitro analyses reported here by the Dept. of Food Science, University of Otago. Preparation procedures have been detailed in publications presenting the clinical results [
1,
2]. The bread were nutrient matched, as were the porridges. A commercial white bread (Tip Top White) purchased at a local supermarket was included as an external reference, representing the white bread standard for which a GI of 70 is assumed [
19]. The particle size of the flours was <150 μm, while the kibbled grains were >1680 μm [
1,
2]. The four experimental bread were baked using the same standard commercial procedures.
The cooked porridges were made by heating the grain preparations in water at 85 °C for 15 min and served at 65 °C to prevent starch retrogradation. The porridges were served with yoghurt in portions required to deliver a 50 g carbohydrate dose 1.
2.2. In Vitro Digestion
The in vitro digestion has been described in detail elsewhere [
18]. Briefly, the bread was coarsely fragmented by rubbing gently through a 0.5 cm grating with care taken not to crush any particles. The porridge samples were dispersed gently in the digestion medium with a spatula, also with care not to crush particles. The samples were then subjected to an in vitro digestive analysis, which included a 30 min gastric phase followed by intestinal digestion lasting 150 min. During the intestinal phase, samples of the digestion medium were removed from the digestion pots for analysis of the accumulation of carbohydrate digestion products with time.
The digestions were carried out in duplicate in 70 mL specimen pots (LabServ, LBS 30002, Thermo Fisher Scientific, Auckland, New Zealand) placed in a custom-built heating block on a 15-place magnetic stirrer. A sub-sample (2.5 ± 0.01 g) of each bread was accurately weighed into each pot, 30 mL of water added, followed by 1.0 mL of 1 M HCl and 1 mL of 10% pepsin protease (Sigma-Aldrich, P-7125, Merck Life Science, Auckland, New Zealand) dissolved in 0.05 M HCl. The samples were incubated at pH 2.5 and 37 °C for 30 min to simulate gastric digestion.
The intestinal phase was initiated by adjusting the samples to pH 6.3 by adding 2 mL of 1 M NaHCO3 and 5 mL of 0.2 M Na maleate buffer pH 6.3 and made to the full (53 mL) mark with distilled water. Intestinal digestion, during which carbohydrate digestion was monitored, was initiated by adding 0.1 mL of amyloglucosidase (Megazyme, E-AMGDF, Megazyme, Wicklow, Ireland) and 1.0 mL of 1% pancreatin (Sigma-Aldrich, P-7545, 4 × USP, Merck Life Science, Auckland, New Zealand) solution in maleate buffer to the digestion pots, which were stirred at 130 rpm and 37 °C. Samples (0.5 mL) were removed to ethanol (2.0 mL) at 0, 10, 20, 40, 60 and 120 min and immediately mixed to stop digestion and precipitate any undigested starch. At 120 min, the digests were homogenised (Omni-GLH with an S18N-19G dispersing tool) to a slurry in the digestion pots, a further 0.1 mL of amyloglucosidase added, and the samples digested for a further 30 min to capture any starch protected by food structure before a final 0.5 mL sample was removed to ethanol.
The ethanolic samples were centrifuged and a sub-sample of the supernatant given a secondary digestion, with 1% amyloglucosidase and 1% invertase, to simulate brush border processing and convert all 80% ethanol-soluble fragments from digestion of starch (short dextrins, maltose) to glucose for analysis. Soluble sugars were then measured as grams of glucose equivalents (GE) using the standard dinitrosalicylic acid colourimetric procedure [
20].
Starch fractions determined in the above analysis were:
Rapidly digested starch (RDS)—starch digested in vitro up to 20 min. RDS refers solely to the time period of digestion, although it will contain glucose from starch species that differ in their intrinsic rates of digestion.
Slowly digested starch (SDS)—starch digested between 20 and 120 min in vitro.
Resistant starch Type 1(RS1)—starch that is not digested because amylase access is restricted by food structure. It was measured as the increase in sugar release at 150 min when the sample had been given secondary digestion after homogenising at 120 min.
Resistant starch Type 2 (RS2)—starch resistant to digestion as a result of native molecular structure. Hydrothermal processing converts Type 2 RS to digestible gelatinised starch as long as the starch is able to hydrate. RS2 was measured as difference between total starch in the fully cooked dispersed as the difference between total starch (TS) digested in the dispersed fully cooked sample and the sum of the preceding fractions (RS2 = TS − (RDS + SDS + RS1)).
2.3. In Vitro GI Values
In vitro glycaemic index (GI
iv) was determined from the digestion curves as previously described [
21]. Curves of cumulative sugar release from the products were determined, as well as theoretical cumulative glucose disposal over the same time (
Figure 1 and
Figure 2). Equations for glucose disposal (GD) rate as a function of glycemic glucose equivalent (GGE) intakes had previously been determined in clinical studies [
18] and were applied to in vitro values adjusted to serving size to provide realistic GD lines specific for each of the individual digestion curves. The difference (net GGE) between the lines of GGE release and GD provided a simulated blood glucose response from which the area under the curve (AUC) was determined by trapezoid summation. Comparison of the AUC for a product with the AUC for white bread with an assumed GI of 70 was used to derive the GI
iv of the product:
2.4. Clinical GI Values
The clinical GI values were determined from the mean iAUC values given in the publications describing blood glucose responses to the porridges [
1] and bread [
2], subsequently subjected to the in vitro digestive analysis described in the present paper.
2.5. Confirmation of Cutting, Crushing and Cooking Effects
Two additional experiments were conducted to show the role that three factors may play in the observed differences between treatments in the main study of porridge and bread: (A) The role of cutting and crushing in digestibility of cooked wheat grain; (B) The role of cooking in digestibility of crushed grain, using wholegrain rolled oats.
In Experiment A, wheat grains were allowed to hydrate overnight and cooked for 10 min in a glass tube in a boiling water bath. The cooked grains were digested individually either intact, sliced equatorially with a sharp razor blade, or crushed to 1 mm between glass sides, with 5 grains for each treatment. A scaled-down version of the in vitro digestion (above) was used with sugar release measured at 20 min (RDS), 120 min (RDS + SDS) and after homogenising with further digestion (RDS + SDS + RS1).
In Experiment B commercially available wholegrain rolled oats (Harraway’s, Dunedin, New Zealand) were digested using the full-scale in vitro digestion procedure (above; 2.5 g/50 mL) either as is or after cooking for 10 min in a boiling water bath for determination of RDS, RDS + SDS, and after homogenising, total starch.
2.6. Data Analysis
Mean values were calculated for all time points in the digestion. Precision of the analyses was estimated as the mean absolute deviation between duplicate values for sugar release per 100 g sample.
Values for total potentially available carbohydrates in the products were obtained from the 150 min value for the homogenised cooked version of the product (bread or porridge) made from the finest particle size flour. This would correspond to a standard available carbohydrate analysis.
Standard deviations (SD) of the clinical GI values (SD
GI) were calculated from the given SDs of the IAUC values used to calculate GI using the formula:
where X and Y are the IAUCs of the sample and glucose reference, respectively [
1,
2].
4. Discussions
The results have shown the extent to which increased particle size and reduced gelatinisation, which may be part of minimal processing of whole grains for reduced glycaemic potency, lead to changes in starch fractions that could have secondary health benefits. Amongst these changes, an increase in RS may make an important contribution to gut health through its prebiotic effects in the colon, with numerous secondary health benefits [
15]. Processes increasing RS in bread could, in theory, substantially improve dietary fibre intakes and associated gut health. In the bread containing 30% intact and 30% kibbled kernels, for instance, about 30% of the starch was in the form of resistant starch. Two average (45 g) slices of the bread, each containing 16 g of starch, would provide about 10 g of dietary fibre as RS, probably combined with 3–4 g of non-starch polysaccharide, thus potentially providing almost half of the daily recommended intake of about 30 g dietary fibre. However, the measured proportion of RS will be the maximum possible because a proportion of the RS1 may be lost through structural disintegration by chewing during normal ingestion. Thus, the in vivo contribution from intact grains may be lower in reality than was suggested by the in vitro results and would depend on the chewing characteristics of the consumer [
22]. Nevertheless, in the present study, the reduction in GI of the intact kernel bread of about 20 GI units compared with the wholemeal bread was consistent with the in vitro reduction in RDS and increased in RS to about 30% of total starch.
A typical serving of porridge or muesli containing 50 g of wholegrain, with a “carbohydrate” (total starch) content of about 35 g would, according to
Table 2, provide dietary fibre in the form of resistant starch ranging from 4.9 g for fine cooked, to 17.8 g for fine uncooked, to 28 g for kibbled uncooked, and 11.5 g for kibbled cooked. Thus, the uncooked kibbled grain could, in theory, provide most of the recommended daily intake of dietary fibre to augment the soluble and insoluble non-starch polysaccharide already present. Thus, the grain would be a valuable source of mixed dietary fibre in cereal mixtures consumed as intact and uncooked or partially uncooked grains, such as muesli. However, as the results in
Figure 4 showed, dietary fibre in the form of resistant starch is extremely susceptible to conversion to available carbohydrates by cooking and crushing treatments, which provides the opportunity to develop products with specific physiological effects by careful control of processing conditions.
An important advantage of consuming resistant starch in the form of intact and partially intact cereal kernels in whole grain products is that it is accompanied by bran. While RS may improve gut health by acting as a prebiotic substrate for the microbiota [
15], it adds little to faecal bulk because it is fermented. In contrast, the bran is a protective integument that resists bacterial attack, so it survives colonic transit and contributes more effectively to faecal bulk [
23]. Faecal bulking is an extremely important complementary role of dietary fibre in maintaining gut function and health, with many downstream benefits [
24]. Cereal products with the bran fraction removed are generally inadequate as sources of distal colonic bulk, while those that retain the bran have a high faecal bulking capacity [
25].
The two supplementary experiments on cooked wheat kernels (
Figure 4A) and rolled oats (
Figure 4B) respectively illustrated the importance of several factors determining the glycaemic potency of wholegrain cereals, namely cutting and crushing of intact cooked grains as would occur in kibbling and chewing to form a bolus, and starch gelatinisation as a result of hydrothermal processing. Both crushing cooked grain and cooking crushed grain largely eliminated the protective effect of structure at the plant morphological and starch granule levels. Cooking and crushing effects on glycaemic impact will combine when solid cooked wholegrain products, such as bakery products containing coarse kibbled and intact kernel particles in a dryish food matrix, are ingested because chewing will be induced as an essential part of bolus formation for swallowing. However, in products such as muesli, in which the starch is incompletely gelatinised, and the product is swallowed in the form of a slurry rather than a bolus, the combined effects of incomplete starch gelatinisation and grain structure may substantially modify the glycaemic index, as seen in the wide spread of GI values for porridge (
Figure 3). In cooked porridge, the effect of grain structure is likely to escape the effects of chewing, as the grains are swallowed in a slurry lubricated by gelatinised starch.
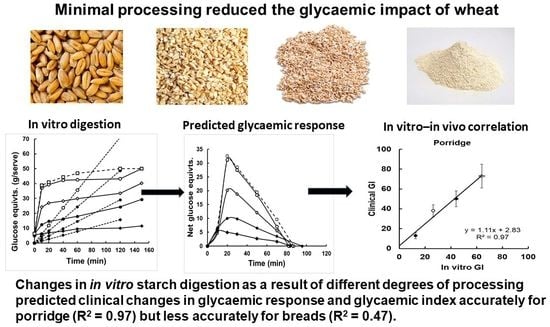
The high correlation between in vitro and in vivo GI values for the porridges suggests that in vitro digestion gives a true indication of the functional states of starch in vivo because the starch fractions and the in vitro GI values were based on the same starch digestion data. Furthermore, the physical form in vivo and in vitro would have been similar because bolus formation was not required for ingestion. The reason for the weaker correlation between the in vitro and in vivo GI values in the bread is probably because the population density of wholegrains was reduced by the flour-based bread matrix, The “hydrothermal” process of baking would have converted most of the RS1 to RDS, and the data were subject to large errors intrinsic to clinical GI determinations [
26]. The clinical study was probably underpowered to measure the differences between the bread in glycaemic impact. The figure illustrates the value of the precision of in vitro analysis of glycaemic impact compared with the unavoidable imprecision of in vivo measurements due to large individual differences. Although the intact grains were still able to yield a lower GI than the wholemeal, the difference was due partly due to Type 2 (ungelatinised) RS (
Table 3), suggesting that the intact grain structure had inhibited endosperm hydration and/or starch gelatinisation.
In an earlier study of bread containing fully hydrated, cooked, coarse grain, swallowing the bread without chewing lowered glycaemic impact, but the effect was largely eliminated when the bread was ingested normally [
3]. Presumably, chewing during bolus formation [
27], prolonged exposure to amylase during bolus persistence in the stomach, and other physical and enzymatic processes that the stomach uses to disintegrate foods obliterated the glycaemia-inhibiting effects of grain structure [
28,
29].
The results of the present study indicate that if coarsely kibbled grains are used to lower the glycaemic potency of foods, the foods containing them should be moist enough or textured to avert the need and urge to form a well-chewed bolus containing crushed particles before swallowing. Secondly, as RS2 formed such a substantial portion of the products with the lowest in vitro and clinical GIs (
Figure 4,
Table 2), limited hydrothermal processing should be part of minimal processing for low glycaemic impact wholegrain foods. Thus, a muesli-type product would be preferable to hot porridge for glycaemic control.
The present study has also shown how in vitro digestive analysis can be a useful tool in developing whole grain products for low glycaemic potency and/or improved prebiotic potential based on restricting the conversion of RS to digestible starch. The correlation between in vitro GI and clinical GI across all eight products was R
2 = 0.88, consistent with the value of R
2 = 0.90 obtained with 24 carbohydrate foods of diverse types [
21], and with earlier research showing that RDS predicts glycaemic response [
12]. The present research has confirmed that RDS is an accurate predictor of glycaemic response, at least in simple cereal products. A great advantage of the in vitro GI analysis over clinical GI is its far greater precision (
Table 3,
Figure 3), with CVs of about 5%, typical of laboratory analysis. Although clinical determination is mandatory for values to be assigned to consumer products, during the development phase, in vitro analyses can provide economic and precise identification of the best products to be taken into far more costly clinical trials. They can therefore allow greater speed, economy and accuracy than going directly from formulation to clinical trials in product development for glycaemic control.
However, as the present study has shown, if in vitro digestion is to be used to gauge the relative glycaemic impact of whole grain foods, such as experimental preclinical cereal products, it is important that the food be disintegrated in a way that accurately replicates the physical effects of ingestion, such as crushing (
Figure 4). For foods that do not need to be chewed before swallowing, such as a porridge or muesli slurry, the in vitro GI estimation proved to be reasonably accurate in this study.
If the in vitro procedure is to be applied beyond simple wholegrain cereal products, to produce low glycaemic impact composite products, the influence of food components that affect gastric emptying rate may need to be considered. Components such as fat, highly viscous polysaccharides, and organic acids may need to be made constant across comparisons so that effects of cereal and starch structure are not confounded by separate effects of food components on digestion and glucose absorption. Once the role of cereal structure has been defined under controlled conditions, other factors may be included to determine their additional contribution to an overall improvement in the nutritional attributes of a product.
This paper, by showing the substantial impact of factors, such as particle size, pre-hydration, cutting, crushing, and gelatinisation on the glycaemic potency of wholegrains, has highlighted a set of variables that can be systematically varied during minimal processing of grains. The products generated could create a matrix of minimally processed wholegrains for use in numerous composite products of predictable glycaemic impact.
The present study suffered from some limitations imposed by the fact that the primary aim of the study was to measure the effects of milling and cooking of wheat on human glycaemic responses to wheat products, with a necessarily limited number of samples. The design of the clinical study meant that changes in starch fractions and glycaemic responses as a detailed function of isolated processing variables could not be determined. However, the availability of the clinical data and the products responsible provided an excellent opportunity to retest in vitro digestive analysis and obtain some explanation for the clinical effects in terms of the effects of processing on starch fractions.


