Article

Decontamination of Pathogenic and Spoilage Bacteria on Pork and Chicken Meat by Liquid Plasma Immersion

by
Peeramas Sammanee
1,2,
Phakamas Ngamsanga
3,
Chalita Jainonthee
3,4,
Vena Chupia
5,
Choncharoen Sawangrat
6,
Wichan Kerdjana
7,
Kanninka Na Lampang
4,5,
Tongkorn Meeyam
3,4,5 and
Duangporn Pichpol
4,5,*
1
Master’s Degree Program in Veterinary Science, Faculty of Veterinary Medicine, Chiang Mai University, Chiang Mai 50100, Thailand
2
Department of Livestock Development, Ministry of Agriculture and Cooperatives, Bangkok 10400, Thailand
3
Veterinary Public Health and Food Safety Centre for Asia Pacific, Faculty of Veterinary Medicine, Chiang Mai University, Chiang Mai 50100, Thailand
4
Center of Excellence in Veterinary Public Health, Faculty of Veterinary Medicine, Chiang Mai University, Chiang Mai 50100, Thailand
5
Department of Veterinary Biosciences and Veterinary Public Health, Faculty of Veterinary Medicine, Chiang Mai University, Chiang Mai 50100, Thailand
6
Department of Industrial Engineering, Faculty of Engineering, Chiang Mai University, Chiang Mai 50200, Thailand
7
Science and Technology Park, Chiang Mai University, Chiang Mai 50100, Thailand
*
Author to whom correspondence should be addressed.
Foods 2022, 11(12), 1743; https://doi.org/10.3390/foods11121743
Submission received: 25 May 2022 / Revised: 10 June 2022 / Accepted: 12 June 2022 / Published: 14 June 2022
(This article belongs to the Section Food Microbiology)

Abstract

:
In this research, we aimed to reduce the bacterial loads of Salmonella Enteritidis, Salmonella Typhimurium, Escherichia coli, Campylobacter jejuni, Staphylococcus aureus, and Pseudomonas aeruginosa in pork and chicken meat with skin by applying cold plasma in a liquid state or liquid plasma. The results showed reductions in S. Enteritidis, S. Typhimurium, E. coli, and C. jejuni on the surface of pork and chicken meat after 15 min of liquid plasma treatment on days 0, 3, 7, and 10. However, the efficacy of the reduction in S. aureus was lower after day 3 of the experiment. Moreover, P. aeruginosa could not be inactivated under the same experimental conditions. The microbial decontamination with liquid plasma did not significantly reduce the microbial load, except for C. jejuni, compared with water immersion. When compared with a control group, the pH value and water activity of pork and chicken samples treated with liquid plasma were significantly different (p ≤ 0.05), with a downward trend that was similar to those of the control and water groups. Moreover, the redness (a*) and yellowness (b*) values (CIELAB) of the meat decreased. Although the liquid plasma group resulted in an increase in the lightness (L*) values of the pork samples, these values did not significantly change in the chicken samples. This study demonstrated the efficacy of liquid plasma at reducing S. Enteritidis, S. Typhimurium, E. coli, C. jejuni, and S. aureus on the surface of pork and chicken meat during three days of storage at 4–6 °C with minimal undesirable meat characteristics.

1. Introduction

The global population and the demand for meat consumption are growing; as a result, the production of food and meat is also increasing [1]. Global meat protein consumption is expected to rise by 14% at an estimated 138 million tons by 2030, compared with the period average of 121 million tons during 2018–2020 [2]. Bacterial contamination in food processing is a concern, since it is a cause of foodborne illness that can be harmful to the consumer [3]. The production of high-quality meat and meat products in the food industry faces a major challenge in reducing the risk of pathogens [4]. The global pork output is predicted to increase by 5% from October 2021 to 109.9 million tons in 2022, whereas global poultry meat production is expected to reach 100.8 million tons [5]. Additionally, the availability of pork and poultry meat protein is expected to increase by 13.1% and 17.8%, respectively, by 2030 [2]. Because of the increased population growth and the demands of meat consumption, the production of high-quality meat and meat products will also correspondingly increase, which will be a major challenge for the food industry considering the risk of pathogens [4].
During the slaughtering process, contamination with pathogens including Salmonella spp., Escherichia coli, Campylobacter spp., and spoilage bacteria can occur [6,7]. This can result in the contamination of food products with these bacteria [8,9].
The decontamination method during the slaughtering process is an essential condition to improve the quality of meat products. The decontamination method was divided into the following categories: (1) physical treatment, such as cold or hot water washing, steaming, and irradiation [10,11], and (2) chemical treatment such as organic acid, chlorine, ozone, trisodium phosphate, and cold plasma technology [12]. Physical modifications to meat and meat products are possible through the use of thermal decontamination procedures [13,14], freezing [15,16,17], irradiation [18,19,20], and trisodium phosphate [18,21]. In each method of decontamination, limitations can be found. For example, ozone can cause the rancidity of fat and muscle pigments in meat [22,23,24]. Additionally, the health and safety of meat handlers should be considered, including the risk of resistant acid bacteria such as E. coli O157:H7 [25], the corrosive effect of organic acid on meat industry equipment [26,27], and the risk of carcinogenic compounds as trihalomethanes (THMs) from working with chlorine [18,28], as several decontamination methods have been developed to mitigate the negative effects of existing methods. Thus, non-thermal (cold) plasma, particularly liquid plasma, is a novel decontamination technology that has the potential to aid in the elimination of pathogens in food or meat products and has been used in the meat business to overcome the limitations of conventional decontamination methods as previously mentioned. Liquid plasma is non-thermal plasma containing ions, atoms, and molecules, such as oxygen, ozone, nitrate, and nitrite. According to a study on non-thermal plasma in food processing, plasma can emit reactive oxygen and nitrogen species, which can eliminate harmful bacteria on meat surfaces [4,7,29]. Since liquid plasma can operate as a source of nitrite for meat products, a change in meat characteristics may also occur.
Chicken and pork are important protein sources and are in high demand with intensive production. Reducing the amount of bacterial contamination during the slaughtering process such as chilling in poultry or final washing in pig are categorized as crucial steps for the control point. Plasma technology has been applied with vegetables and fruits, as well as meat and meat products [30,31,32]. However, the application of liquid plasma in slaughtering and meat processing is limited. Therefore, the purpose of this research was to determine the efficiency of liquid plasma in reducing pathogenic and spoilage microorganisms in pork and chicken meat with skin and in modifying the quality of meat.

2. Materials and Methods

2.1. Experimental Design

Three groups of experiments were assigned in this study: liquid plasma, water, and the control treatment. In the liquid plasma group, meat samples were immersed in 500 mL of 60 ppm of H2O2 for 15 min at 25.5 °C. The water group was treated with 500 mL of sterile distilled water for 15 min. The control group consisted of samples that had not been exposed to any solution. Each strain of the bacteria was replicated in seven samples in pork and chicken with skin per group.

2.2. Preparation of Meat

The meat samples in this study were a pork belly with skin, composed of multiple muscles such cutaneous trunci, latissimus dorsi, pertoralis profundus, rectus abdominis, internal and external abdominal oblique, and fat tissues between these muscles [33], and a chicken breast meat with skin including the pectoralis major muscle part. We purchased the meat with skin from GMP-certified slaughterhouses that had total bacteria and Enterobacteriaceae counts of fewer than 4.0 log CFU/cm2 and that tested negative for Salmonella and Campylobacter. Meat samples from the same farm and batch of production were collected to control the color, pH, and core temperature of the meat during the cutting process. The cutting size of the meat was approximately 15 × 15 × 4 cm. The average weights were 315 ± 57 g of pork and 296 ± 40 g of chicken meat. The storage temperature of the meat was −18 °C.

2.3. Liquid Plasma Preparation

The liquid plasma was prepared by Science and Technology Park, Chiang Mai University, Thailand. It was generated by a pinhole plasma jet under atmospheric pressure. Argon gas was used as the carrier gas. The power supply was 15 kv with a 125-watt power density using the alternating current electricity of a neon transformer, and the frequency was 50 Hz. The concentration of hydrogen peroxide (H2O2) in the liquid plasma was 59.29 ± 4.46 ppm. A spectrophotometer was used to determine the concentration of H2O2 (Perkin Elmer Lambda 25, Norwalk, CT, USA) [34]. Following the generation process, the liquid plasma was directly used in the experiment.

2.4. Bacterial Strains

The Salmonella Enteritidis nalidixic acid-resistant strain, S. Typhimurium (wildtype strain), Campylobacter jejuni ATCC 33560, Escherichia coli ATCC 25922, Staphylococcus aureus ATCC 25923, and Pseudomonas aeruginosa ATCC 27853 were recovered from −80 °C stock on 5% sheep blood agar (Oxoid, Hampshire, UK) and incubated at an optimal temperature and atmosphere. The quality control of the bacterial concentration was performed using the drop-plating technique on selective media for all batches of the bacterial suspension.

2.5. Inoculation of Bacterial Suspension

All of the meat samples were packed in sterile plastic sealed bags. A total of 4 log CFU/mL of the bacterial suspension was inoculated and spread thoroughly on the samples’ surfaces using a sterile glass rod. They were left at room temperature for 15 min to allow for the bacterial attachment before further experimental processes [35,36].

2.6. Microbiological Analysis

The samples were refrigerated in the sterile plastic sealed bags at 4–6 °C to perform the microbial analysis four separate times on days 0, 3, 7, and 10.

2.6.1. Detection and Enumeration of Salmonella

The samples were cut to 25 g in sterile stomacher bags and 225 mL of sterile buffered peptone water (BPW; Merck, Darmstadt, Germany) was added. The sample was then homogenized with a stomacher (Interscience, Saint-Nom-la-Brétèche, France) for 2 min before being incubated at 37 °C for 24 h. A total of 100 μL of the overnight-incubated suspension was then pipetted onto the modified semisolid Rappaport–Vassiliadis (MSRV; Merck, Darmstadt, Germany) agar with three equally spaced spots and incubated at 41.5 °C for 24 h. Salmonella growth on the MSRV agar appeared to be opaque. One loopful (10 μL) of the furthest point of the opaque growth was picked up and steaked on brilliant green phenol red lactose sucrose agar (BPLS; Merck, Darmstadt, Germany) and xylose lysine deoxycholate agar (XLD; Merck, Darmstadt, Germany) and incubated at 37 °C for 24 h. The typical S. enterica cultured on XLD agar exhibited a clear pink appearance with or without a black center on pink agar. Additionally, the red zone surrounding the pink Salmonella colony was observed on BPLS agar. The typical colonies of Salmonella spp. were then selected for biochemical and serology confirmation [37].
To count Salmonella, a cut of 25 g of meat sample was added with 225 mL of sterile BPW (Merck, Darmstadt, Germany), and then homogenized with a stomacher for 2 min. A ten-fold serial dilution of the homogenate was performed before being dropped onto XLD agar (Merck, Darmstadt, Germany) and BPLS agar (Merck, Darmstadt, Germany) and incubated at 37 °C for 24 h. The typical colonies were counted and tested following the ISO 6579 [37].

2.6.2. Enumeration of E. coli

The drop-plating technique was performed to enumerate E. coli on E. coli direct agar (Fluorocult® ECD agar, Merck, Darmstadt, Germany). In a sterile stomacher bag, a 25 g meat sample was placed and 225 mL of the sterile BPW (Merck, Darmstadt, Germany) was added. Then, the sample was homogenized using a stomacher for 2 min and a ten-fold dilution was performed. A 50 μL sample of each dilution was dropped on ECD agar, and then incubated at 44 °C for 24 h in an aerobic condition. The round, turbid blue–white illuminated colonies were observed under a UV lamp (366 nm) and indole production was tested to identify the bacteria [38,39].

2.6.3. Detection and Enumeration of Campylobacter

A 25 g meat sample was mixed with 225 mL Bolton broth (Oxoid, Hampshire, UK and homogenized using a stomacher for 2 min, and then incubated at 37 °C for 4–6 h under microaerobic conditions (CampyGen, Oxoid, Hampshire, UK) and at 41.5 °C for 48 h. A loopful of the suspension was inoculated on a modified charcoal cefoperazone deoxycholate (mCCD; Oxoid, Hampshire, UK) agar and Preston agar (Oxoid, Hampshire, UK) and incubated at 41.5 °C for 48 h. To identify Campylobacter, the typical flat and moist grayish colonies, frequently with a metallic sheen, were observed on mCCD agar and the moist, gray, flat spreading colonies were observed on Preston agar [40]. The suspected colonies were streaked on a Columbia blood agar (CBA; Oxoid, Hampshire, UK) supplemented with 5% (v/v) sterile defibrinated sheep blood (Clinag, Bangkok, Thailand) and incubated under microaerobic conditions as described at 41.5 °C for 48 h. The pure cultures were then confirmed by morphology, motility, and oxidase tests [41,42], and multiplex PCR for genus and species confirmation followed the primers and condition in Denis’ study [43,44]. For Campylobacter enumeration, the homogenate of 25 g and 225 mL of the diluent underwent ten-fold dilution, and 50 μL of the sample was dropped onto mCCD agar and incubated at 41.5 °C for 48 h under microaerobic conditions [42].

2.6.4. Detection and Enumeration of S. aureus

The sample was cut to 25 g and placed in a sterile stomacher bag, and then 225 mL of the maximum recovery diluent (MRD; Merck, Darmstadt, Germany) was added and the sample was homogenized using a stomacher for 2 min. The homogenate underwent ten-fold dilution and was dropped on Baird–Parker agar (BPA; Merck, Darmstadt, Germany) before being incubated at 37 °C for 48 h. The typical black, convex, shiny colonies, with a diameter of 1–1.5 mm, were observed on BPA. To identify S. aureus, the clear halos surrounding colonies appeared after 48 h of incubation and tested positive with a coagulase test [45].

2.6.5. Detection and Enumeration of the Pseudomonad

The sample was cut to 25 g and placed in a sterile stomacher bag. A total of 225 mL of MRD was added, and then homogenized for 2 min with a stomacher. The homogenate underwent ten-fold dilution and drop plating was performed to count the bacteria on glutamate starch phenol red agar (GSP; Merck, Darmstadt, Germany). The homogenate was then incubated at 30 °C for 48 h. The typical large, blue-violet, and red-violet surrounding colonies that were 2–3 mm in diameter were observed on GSP agar and tested positive with oxidase [46,47].

2.7. Evaluation of Meat Quality

2.7.1. Meat Color

The evaluation of the meat color was performed on days 0, 3, 7, and 10 at the skin site and meat site in both types of meat samples (and side part with a fat layer in the pork sample) using a CIE colorimeter (MiniScan, Hunter Associates Laboratory, Inc., Reston, VA, USA) as shown in Figure 1, and then the values were recorded as averages [48]. The parameters of the CIELAB were as follows:
  • L*: lightness from black to white,
  • L0: black,
  • L100: white,
  • a*: red–green index,
  • a +: red,
  • a −: green,
  • b*: yellow–blue index,
  • b +: yellow,
  • b −: blue.

2.7.2. Water Activity (aw) of Meat

The samples from days 0, 3, 7, and 10 were cut into small pieces and placed in a sample container. The samples were then placed in a water activity meter (AquaLab®, Washington, DC, USA) for evaluation, and the values of aw and the temperature of the samples were then recorded [49].

2.7.3. pH of Meat

The pH value of the samples at nine positions were measured at the surface and inside of the meat using a pH meter (CyberScan® pH 310 series, Crescent, Singapore) on days 0, 3, 7, and 10, and the values were then recorded.

2.8. Statistical Analysis

The data of the microbial load from all experiments were expressed as log CFU/g. A two-way repeated ANOVA was used to compare the microbial load, color, pH, and water activity from each treatment group (liquid plasma, water immersion, and control groups) and the day of the experiment (days 0, 3, 7, and 10). A Bonferroni test as a multiple comparison with a confidence level of p ≤ 0.05 was used to analyze the significant differences between the mean values of the data from each of the treatment groups.

3. Results

3.1. Effect of Liquid Plasma on Inactivation of Pathogenic Bacteria

The immersion of the pork and chicken samples in liquid plasma (60 ppm of H2O2) for 15 min with the artificial inoculation of S. Enteritidis, S. Typhimurium, E. coli, and C. jejuni resulted in a reduction in the microbial loads. The reduction in the microbial loads of all of the abovementioned bacteria from day 0 to 10 in the liquid plasma group and water immersion group, compared with the control group, showed that the reduction of the liquid plasma group was not higher than that in the water group, except for C. jejuni, with reduction levels of 1.03 ± 0.99 log CFU/g in pork (Table 1), and 1.39 ± 1.10 log CFU/g in chicken meat (Table 2). The reduction of C. jejuni was reduced significantly when compared with the reduction of S. Typhimurium within the liquid plasma group (p ≤ 0.05), as shown in Table 1. However, the other bacterial reduction results in the water and plasma treatments were not significantly different in the pork and chicken samples (Table 1 and Table 3). The findings of the microbiological investigation of S. aureus after day 3 of the decontamination experiment in the pork and chicken samples indicated that the microbial loads started to increase. Moreover, the amount of P. aeruginosa in the pork and chicken samples on day 10 was overgrowth. The mean differences in the microbial loads between all treatment groups at each time point were illustrated in Figure 2 and Table 3 for the pork samples, and in Figure 3 and Table 4 for the chicken samples.

3.2. pH Values of Meat

The pH values on the surface and inside of the pork and the chicken samples after the application of liquid plasma with 60 ppm of H2O2 for 15 min on days 0, 3, 7, and 10 are illustrated in Table 5, Table 6, Table 7, and Table 8, respectively. There were significant decreases in the pH values in the liquid plasma group at days 0 and 10. In addition, comparisons of the pH values among each treatment group showed that most of the averages of the pH values were significantly different at each time point, except for the averages of the pH values inside the chicken samples on day 3 (Table 8).

3.3. Color of Meat

The CIELAB color values in the samples of pork belly and chicken meat with skin treated with liquid plasma for 15 min are shown in Table 9 and Table 10, respectively. The results show that the L* value of all parts of the pork samples increased with each time point, when compared with the control and water groups. On the other hand, the L* values of all parts of the chicken samples were not significantly different. Additionally, a* values of the samples of pork side parts with a fat layer as well as the skin parts of chicken samples in the liquid plasma group were significantly lower than the control and water treatments. Furthermore, the b* values of skin parts, pork side parts with a fat layer, and the meat parts of the chicken meat samples after the application of the liquid plasma were significantly lower than the control and water treatments. However, the b* values of the red meat parts of the pork samples in the liquid plasma group were significantly higher than the water immersion at day 10.

3.4. Water Activity of Meat

The aw in the pork samples treated with the liquid plasma slightly changed and tended to decrease at each time point. However, the aw values of the pork and chicken samples treated with the liquid plasma remained similar to the control and water treatments, as shown in Table 11.

4. Discussion

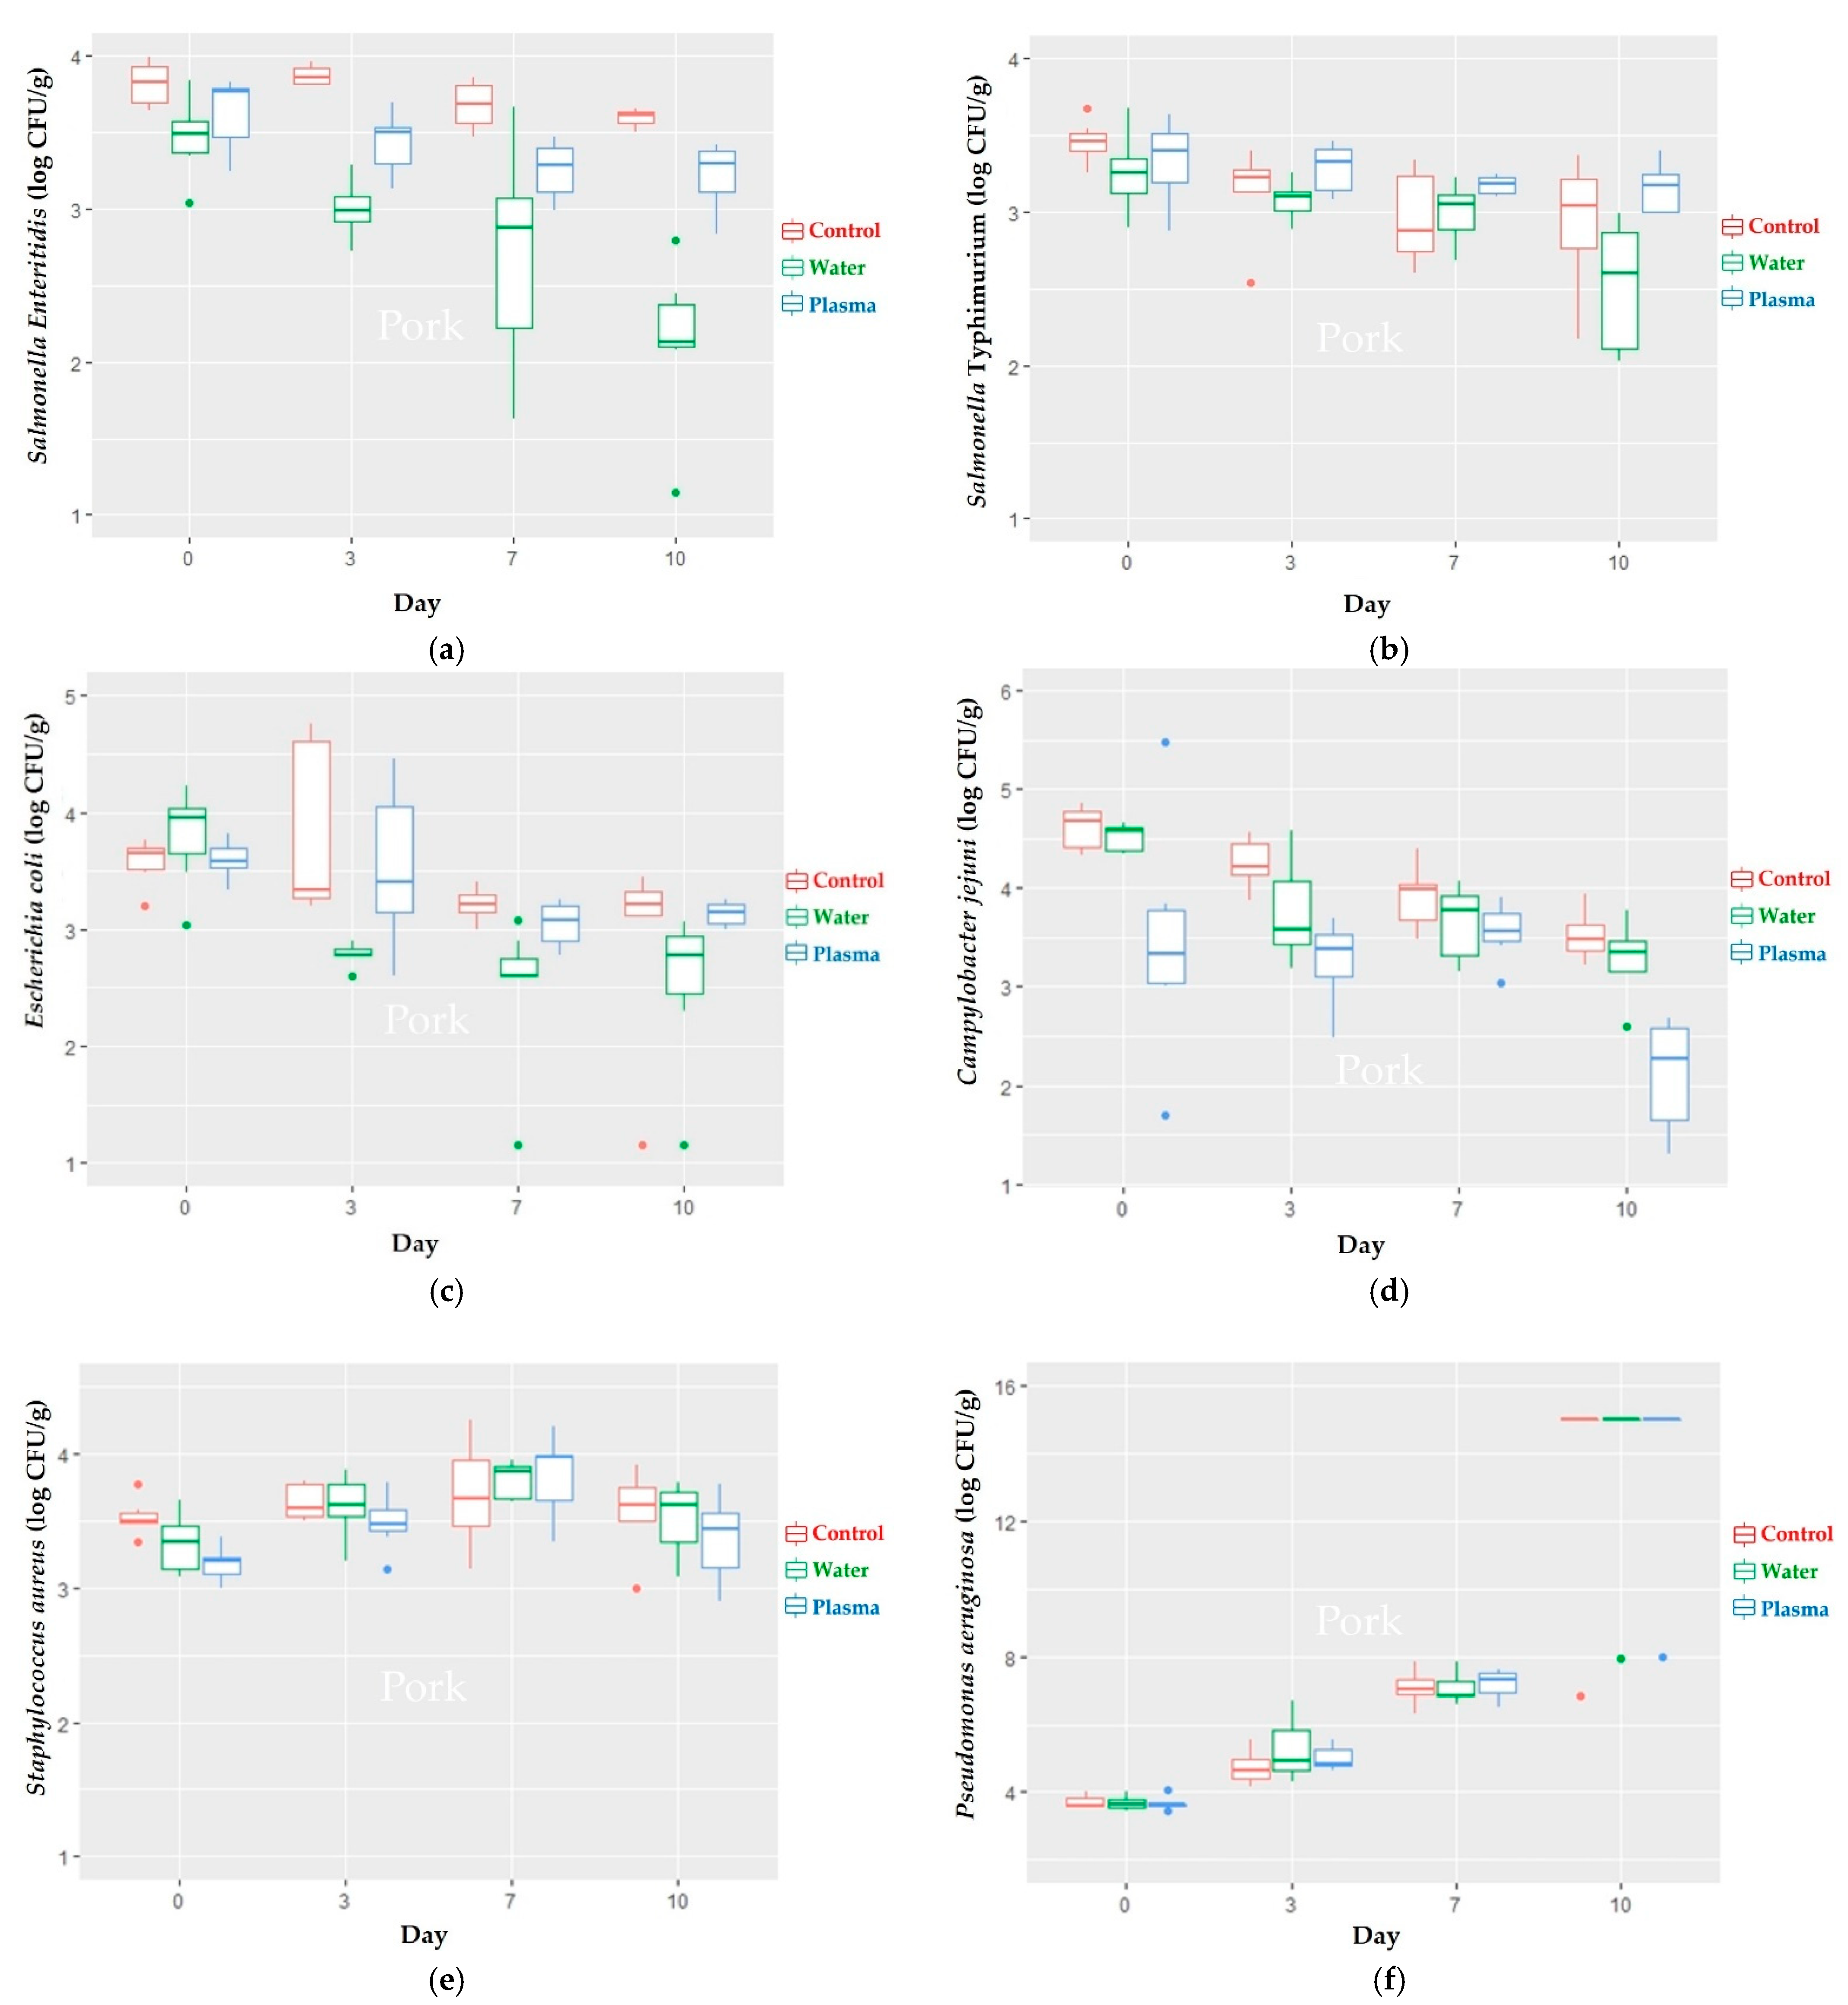
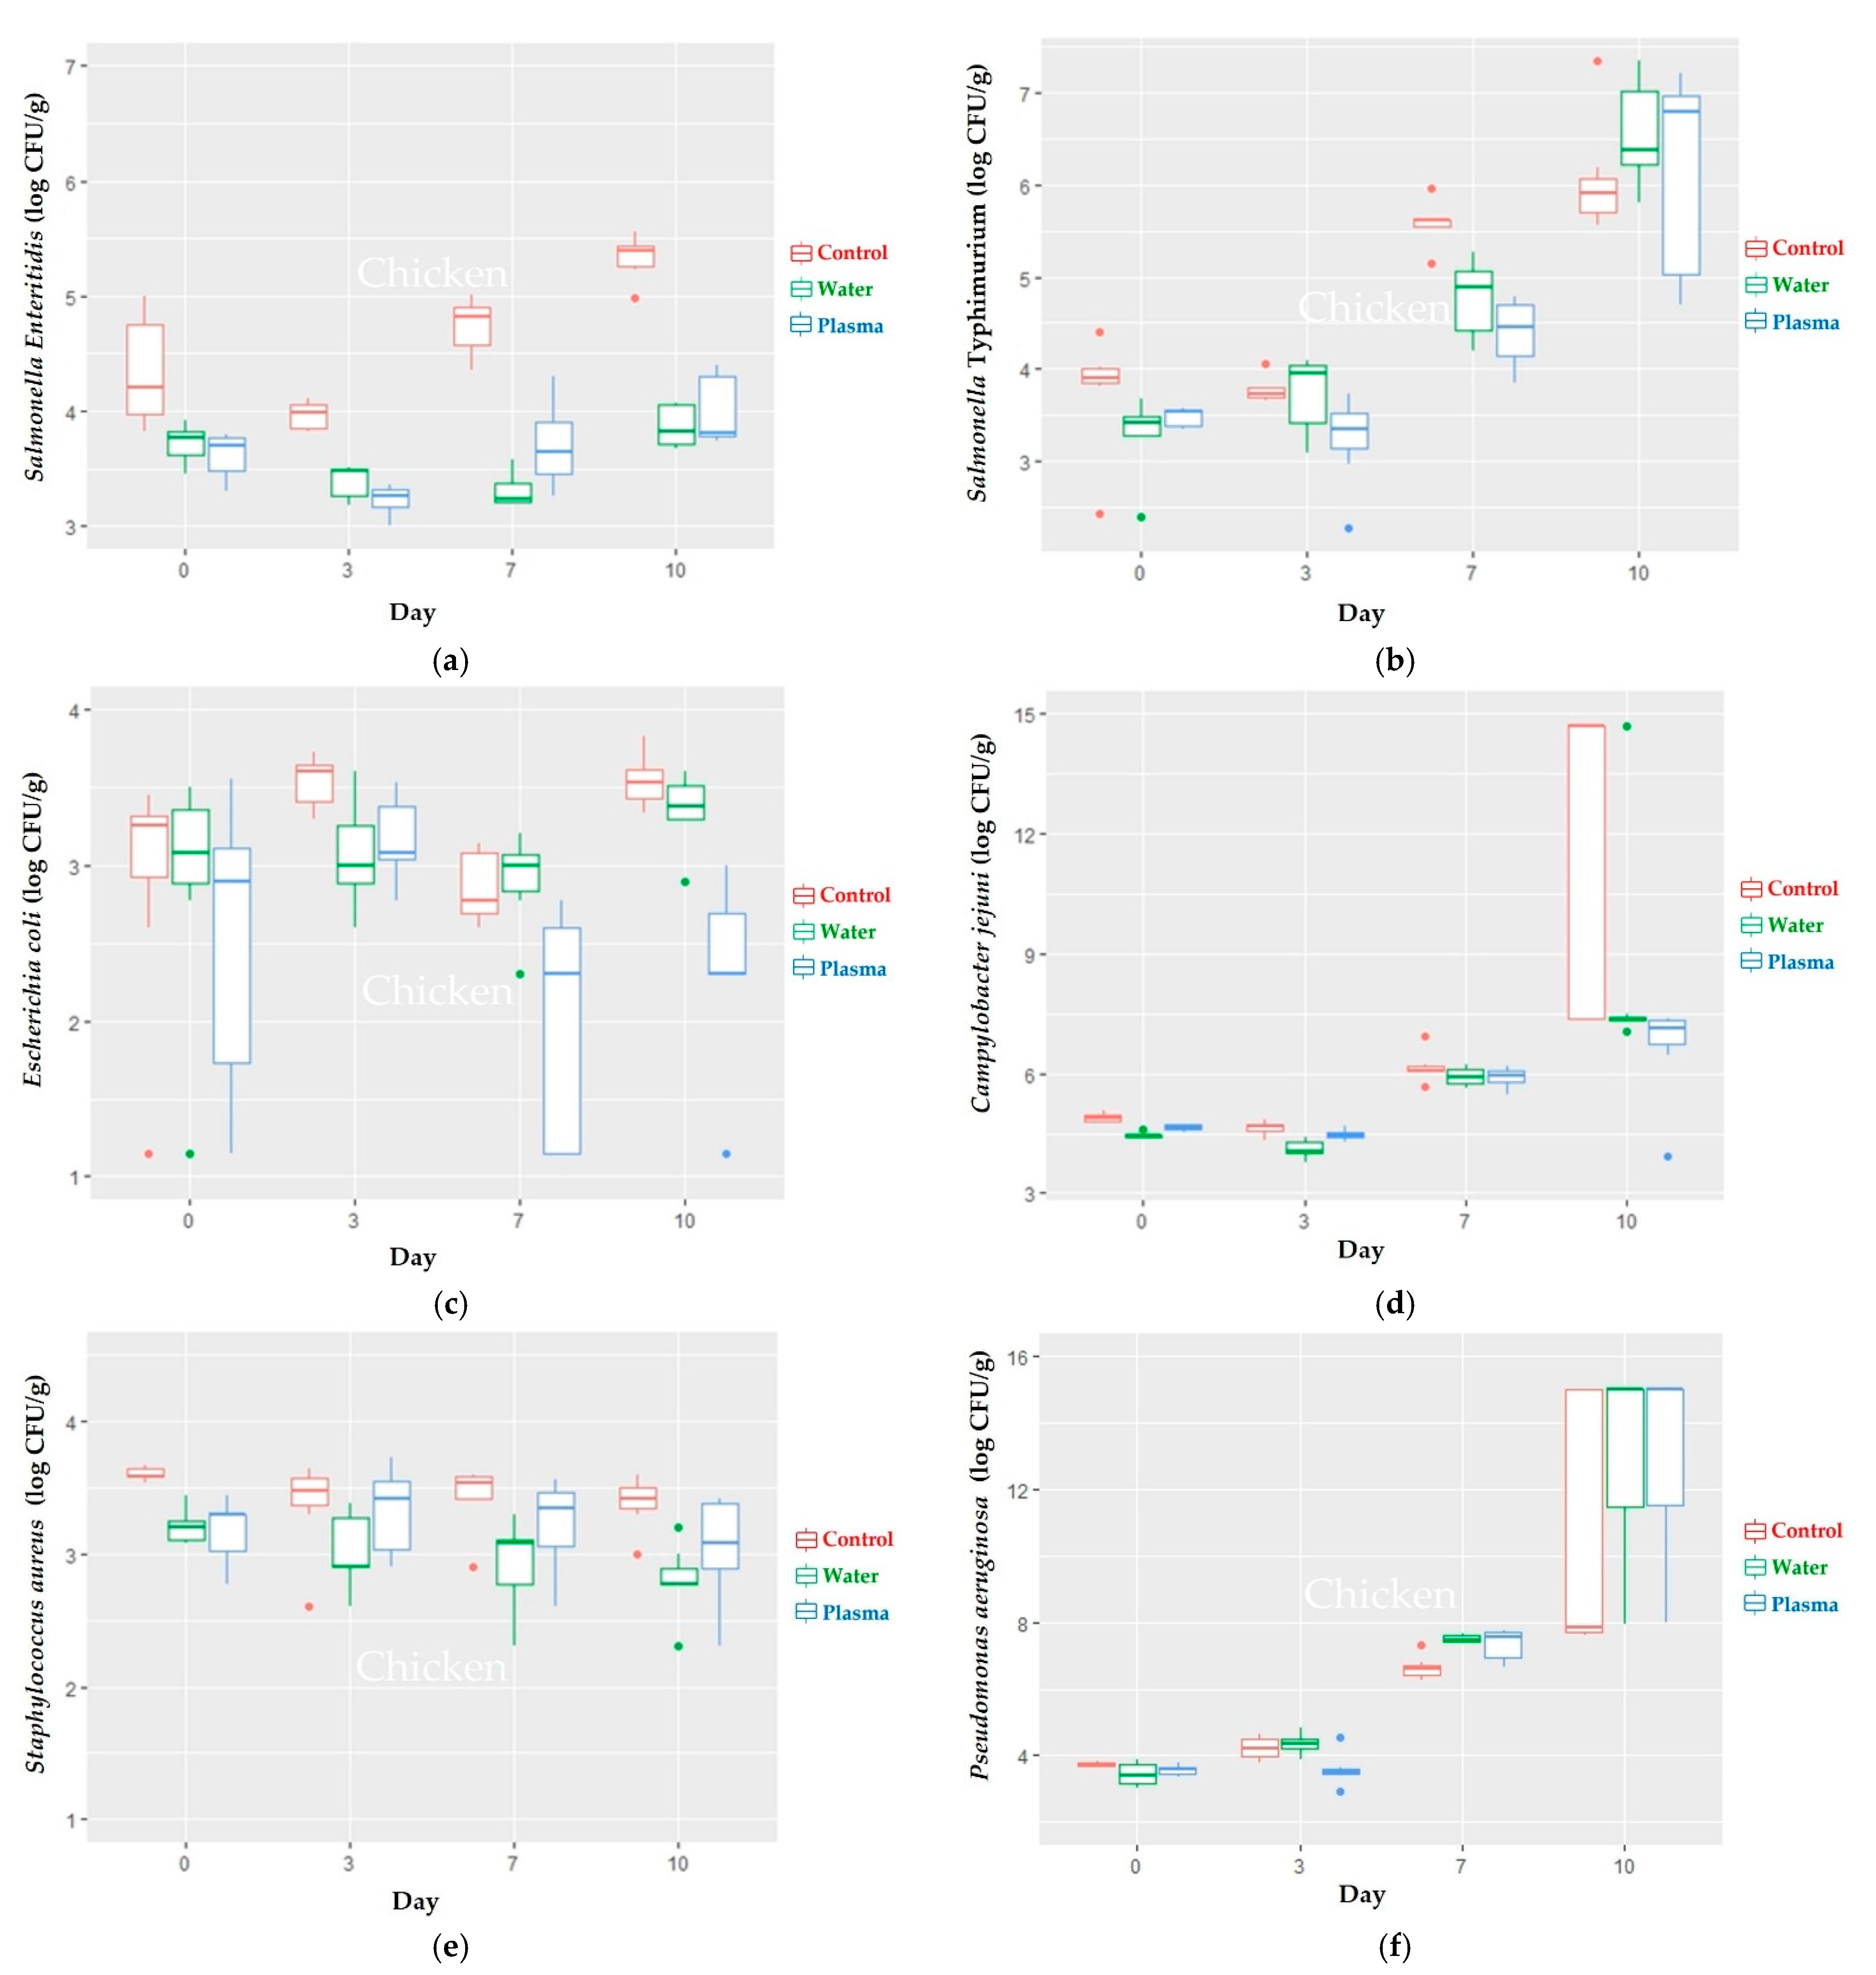
In the decontamination experiment, the application of the liquid plasma with 60 ppm of H2O2 for 15 min could reduce the microbial loads of S. Enteritidis, S. Typhimurium, and E. coli of the chicken meat’s surface, reaching values lower than those with decontamination with water. As of day 7 of the experiment, the chicken meat developed an unpleasant odor, resulting in an increase in the microbial loads of all strains of the bacteria in this study, leading to contamination from day 7 to day 10. The findings revealed that the chicken samples with the artificial inoculation of the bacteria were not able to be kept at the refrigerator temperature of 4–6 °C for more than 7 days. Moreover, in an experiment of the pork samples, the microbial loads of S. Enteritidis, S. Typhimurium, and E. coli decreased, but not significantly, when compared to the water treatment. Gas plasma in free-radical form, such as hydroxyl and hydroperoxyl, is generated under the stimulating energy to excite the gas molecules. These molecules perform charged particles in the form of free radicals. Their microbicidal ability is the interaction with essential cell components and destruction of the metabolism of microorganisms [50]. The water droplets in the liquid plasma process can suppress the radical deterioration reaction of hydrogen peroxide, and may enhance plasma efficiency [51]. Argon plasma is one of the most promising options for producing a high concentration of H2O2, since the hydroxyl dissolved in the argon plasma and hydroxyl radicals are the principal source of H2O2 formation that will be transferred to treated liquid or plasma-activated water (PAW) and contribute to the inactivation of bacteria [52]. In a study by Laurita et al., the H2O2 concentration in DBD air plasma-triggered PAW was analyzed and observed to be 200 μM. However, after 25 min of post-discharge kinetics, H2O2 decomposition in PAW at various intervals, the H2O2 concentration reduced to approximately 110 μM [53]. A study by Lee involved applying dielectric barrier discharge (DBD) plasma treatment to chicken breasts for 10 min, leading to a decrease in E. coli and S. Typhimurium of 2.73 and 2.71 log CFU/g, respectively [54]. In Fernandez and Thompson’s study, it was suggested that the efficacy of atmospheric cold plasma (ACP) for bacterial inactivation diminished when surface convolutions such as food surfaces or attachment sites increased [55]. When ACP was used to decontaminate eggshells inoculated with S. Enteritidis and S. Typhimurium, it was discovered that contact times longer than 1 h were necessary to inactivate all of the abovementioned bacteria [56]. Additionally, Mostafa’s study found that when chicken carcasses were immersed in water containing 0.1% of H2O2, the total colony counts, coliform counts, and S. aureus counts decreased when compared to untreated samples, indicating that adding H2O2 to the water used for chilling carcasses could help reduce bacterial contamination [57]. Furthermore, the study by Kim found that exposing DBD plasma to He and He plus O2 reduced the loads of E. coli by 0.26 and 0.50 log CFU/g, respectively, for 5 min as well as by 0.34 and 0.55 log CFU/g, respectively, for 10 min of application [58]. As a result, the efficiency of bacterial reduction in food and on meat surfaces was correlated with surface convolution, contact time, chemical substances, and input gas.
During 10 days of storage, the loads of C. jejuni on the surfaces of pork and chicken meat with skin were decreased by approximately 1 log CFU/g compared to the water and control groups. The results indicated that samples treated with liquid plasma containing 60 ppm H2O2 for 15 min might significantly reduce C. jejuni microbial loads when maintained at refrigerator temperature (4–6 °C) for the recommended storage time for each type of meat. Campylobacter spp. grows in a microaerobic or limited oxygen atmosphere. Reactive oxygen species, such as hydrogen peroxide, super oxide anion, and the hydroxyl radicals, are produced during aerobic respiration [59]. During the cold plasma production process, electrons and ions are generated. These particles include reactive oxygen species, which have antimicrobial properties [7,59]. As a result, C. jejuni can be inactivated following treatment with liquid plasma containing 60 ppm H2O2.
In addition, the microbial loads of pork and chicken samples artificially contaminated with S. aureus in all treatment groups were low on day 0, but increased after day 3. Pork and chicken meat treated with liquid plasma may not be suitable for storage in the refrigerator for more than three days at a temperature of 4–6 °C in this experimental environment. A study by Shen found that lowering the temperature enhanced the bactericidal effectiveness of PAW at −80 °C > −20 °C > 4 °C > 25 °C, respectively. Compared to PAW stored at 25 °C, 4 °C, and 20 °C, which exhibited a 0.2–2 log reduction in S. aureus for over 30 days after PAW generation, PAW stored at −80 °C had the greatest antibacterial activity, resulting in a 3–4-log reduction [60]. According to our study, the decontamination experiment was conducted at room temperature (25–30 °C), which could have had less antibacterial activity than those conducted at the lower temperatures. The effectiveness of the ACP treatment depended on the type of bacteria. Biofilms are extremely complex biomaterials that vary depending on the type and strain of bacteria [61]. After 60 sec of ACP treatment, colony counts demonstrated that E. coli biofilm populations were reduced to undetectable levels, although S. aureus biofilm populations were less affected [62].
Similarly, P. aeruginosa decreased on day 0 in the experiment with liquid plasma decontamination and did not appear to be inactivated by days 3–10. In the study of Ziuzina, the colony counts of the P. aeruginosa biofilm using DBD plasma were reduced by 5.44 log CFU/mL after 60 sec of treatment. Conversely, after 120 and 300 sec, the inactivation rate was observed to be lower [63]. Additionally, Patenall’s work found that ACP treatment reduced the P. aeruginosa biofilm at 0 and 4 h, with the reduction levels of 5 log CFU/mL. However, after the exposure time of 12, 20, and 24 h, the biofilm of P. aeruginosa had only reduced by 1–2 log CFU/mL [64].
In our trials, the artificial inoculation had a bacterial concentration of 4 log CFU/mL, which was a relatively high level of initial load. Furthermore, maintaining the stability of reactive oxygen species such as hydrogen peroxide during storage is essential to antimicrobial properties; the decrease of hydrogen peroxide over storage time at 25 °C, 4 °C, and −20 °C has been suggested to affect microbial inactivation by PAW compared to PAW stored at −80 °C [60]. In addition, our experiment was performed at room temperature (25–30 °C), affecting the antimicrobial activity of liquid plasma as well as the H2O2 concentration, which could decrease over a period of time. Since the microbial reduction using liquid plasma was low, considering a dose higher than 60 ppm hydrogen peroxide (H2O2) in the liquid plasma could enhance the decontamination performance. However, this may lead to a bleaching effect that would be undesirable for retailers and consumers [65]. The results show a reduction in antimicrobial activity that might lead to the liquid plasma treatment performing similarly to the water treatment, therefore potentially compromising the decontamination efficiency of the liquid plasma. A combination of liquid plasma treatment and good hygienic practices in the slaughtering process could be more efficient in lowering the bacterial load in meat.
Additionally, the pH values in the liquid plasma treatment were relatively low, but stayed within the range of 5.4–6.2 for the normal pork and 5.6–6.4 for the normal chicken meat [66]. According to the findings, liquid plasma with 60 ppm of H2O2 could be an effective decontamination procedure for pork and chicken with skin surfaces. On the other hand, in the study of Kim, the pH value of the DBD plasma-treated pork loins was approximately 5.3, which was significantly lower than the untreated meat samples [58]. Moutiq’s study reported that after being treated with DBD plasma for the duration of each treatment, the pH values of the chicken breast samples decreased overall (1, 3, and 5 min). The decrease in the pH value could be caused by a deficiency in acidogenic molecules such as nitric and nitrous acid, which frequently form in the gaseous phase and are released into the water-covering muscle [67]. However, variations in the plasma type, process gas, decontamination technique, moisture of the surface material, and muscle type can all have an effect on the pH value following cold-plasma application [58,67].
The color and overall appearance of meat have a greater effect on customer acceptance before consumption than flavor and texture [
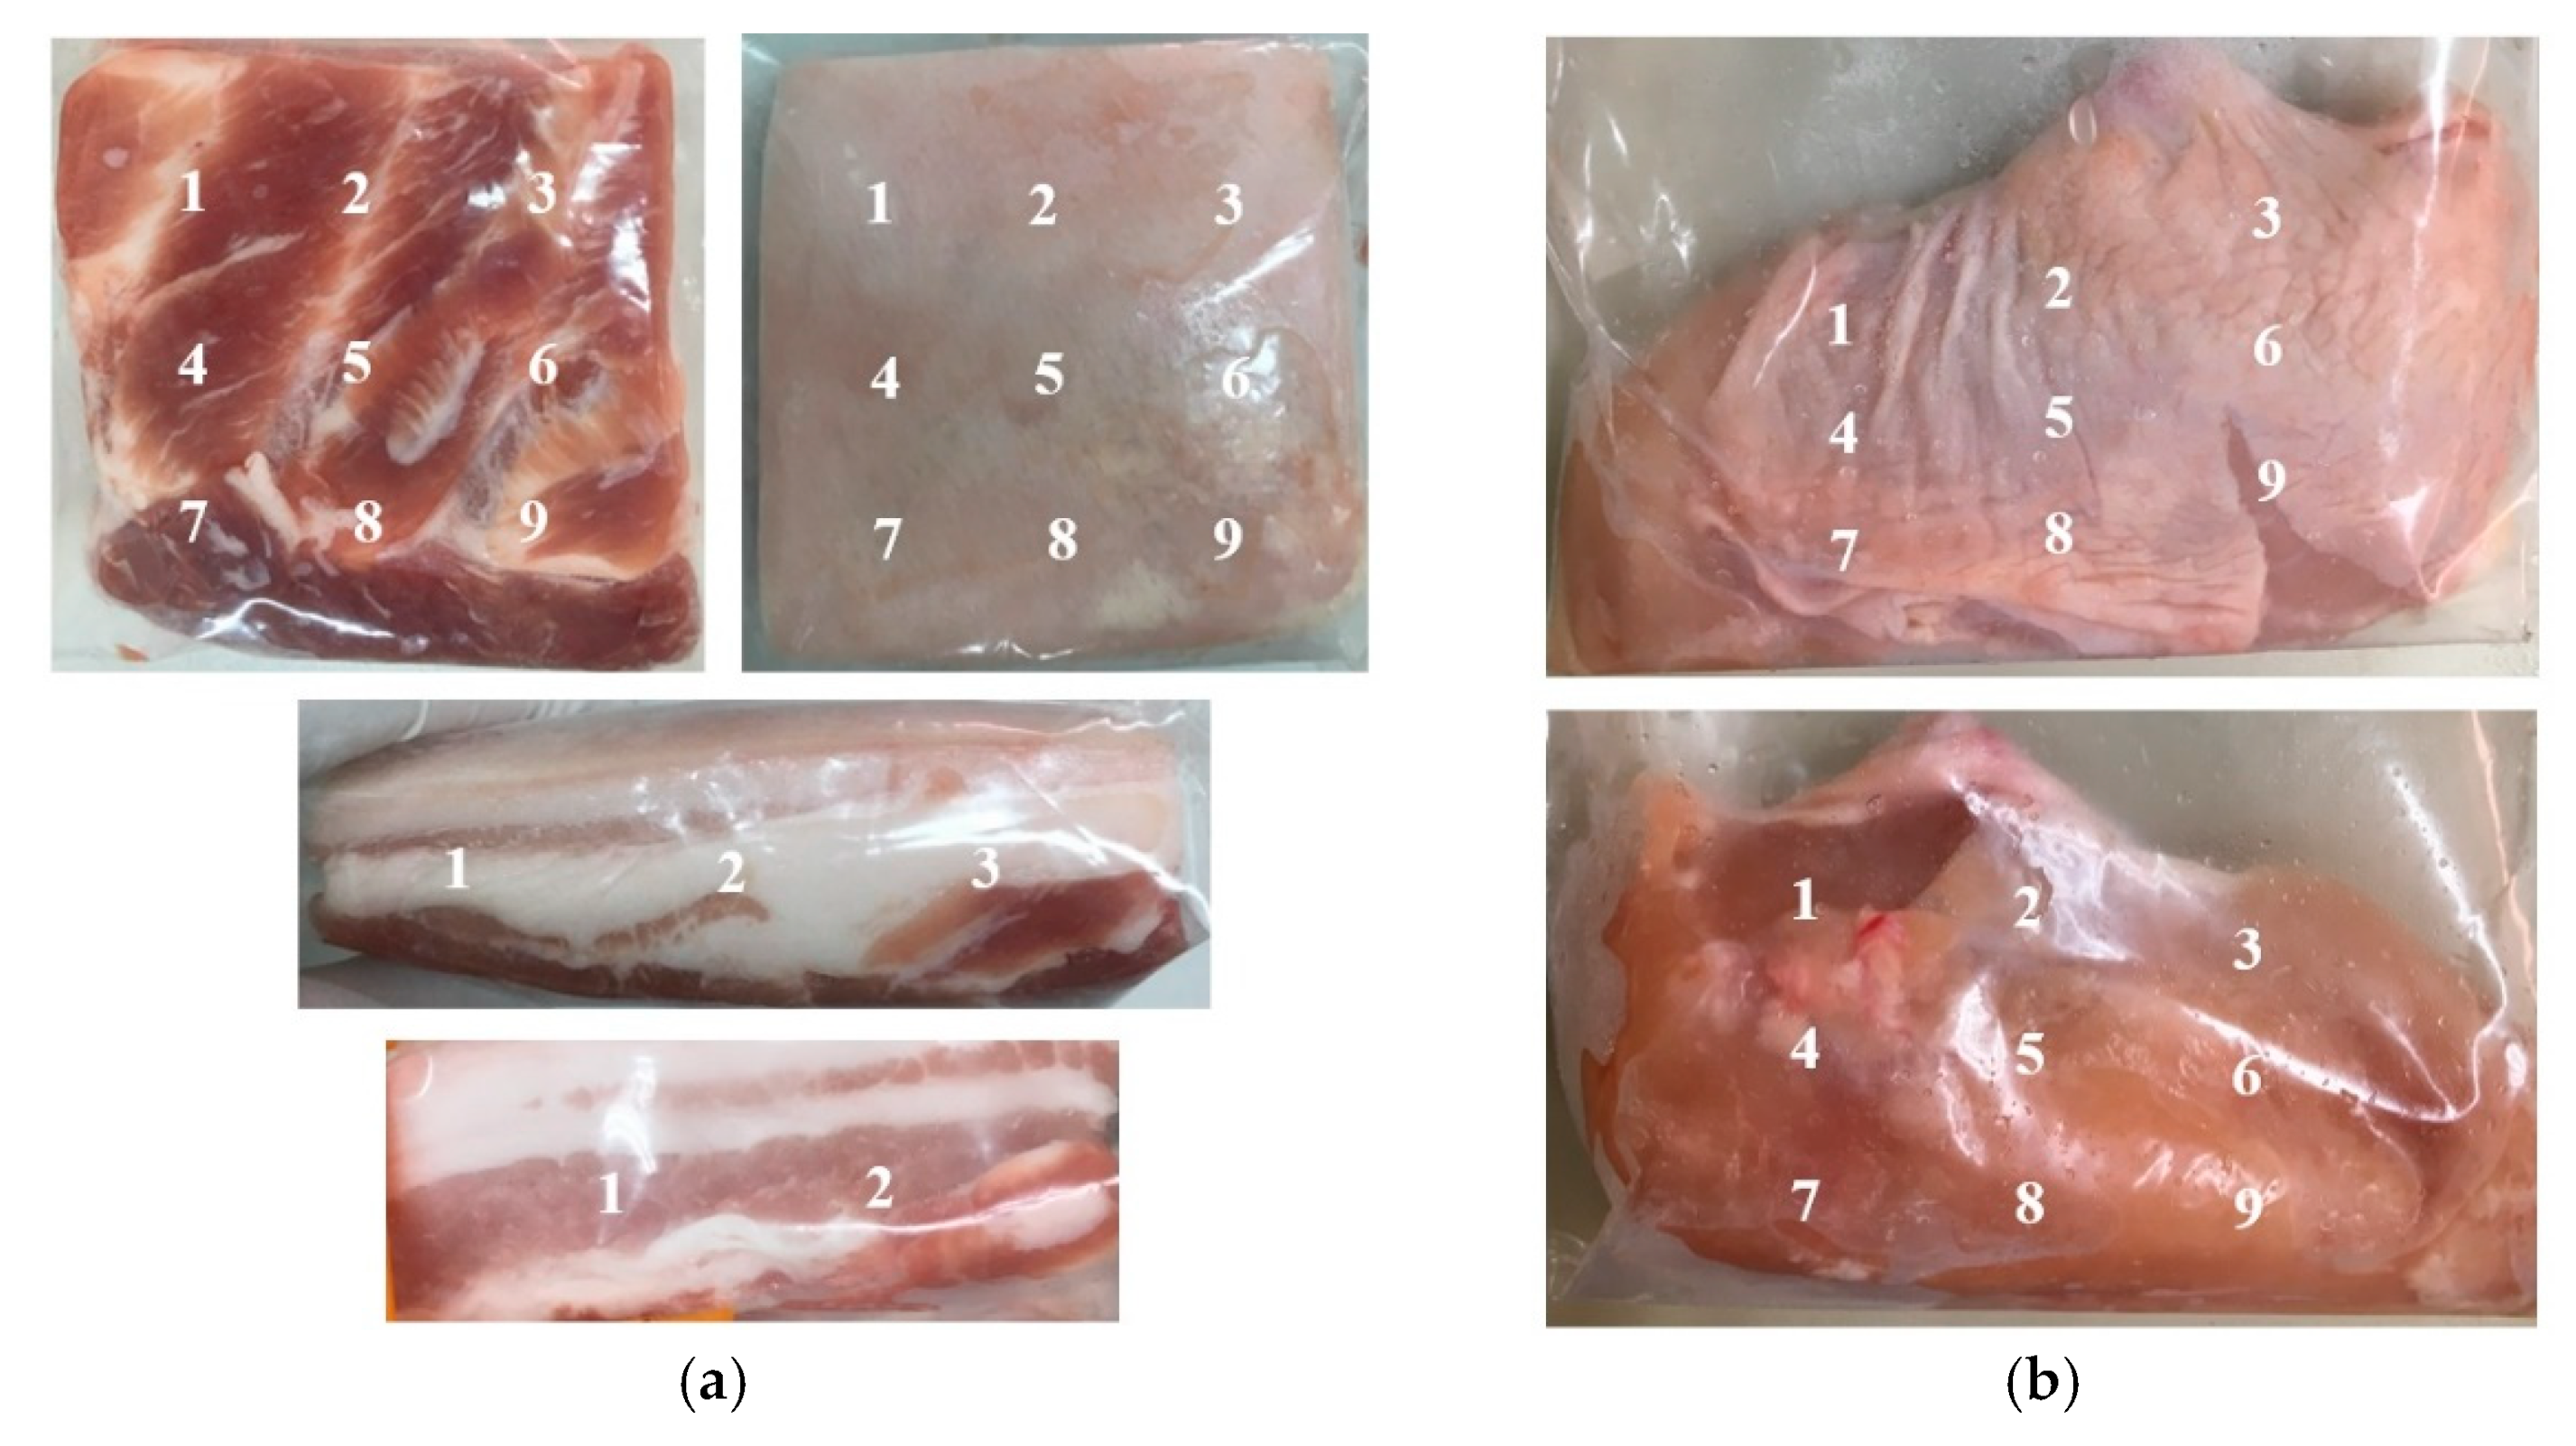
68]. According to our findings, the liquid plasma treatment had an effect on the appearance of the pork and chicken meat, such as paleness. When comparing the L* (lightness) value (CIELAB) of all parts of the pork samples treated with liquid plasma using 60 ppm of H2O2 for 15 min to the control and water groups, the L* values of all parts of the pork samples increased at each time point. Conversely, the L* values of the chicken samples did not change significantly. Peroxidation is associated with the coloration of raw meat, since oxidative reactions have a pronounced effect on the concentration and chemical state of the heme proteins, myoglobin, and hemoglobin in muscle. The brown metmyoglobin form is produced and accumulated in muscles as a result of myoglobin oxidation to metmyoglobin, impacting the meat’s color [69]. Mulder’s study reported that immersing chicken carcasses in 0.17%, 0.5%, and 1% of H2O2 for 10 min bleached and bloated the carcasses [70]. However, these adverse effects vanished after one day of storage at 1 °C, which may be attributed to the natural catalase activity releasing oxygen from the skin and blood following treatment [70]. Additionally, Zhuang’s study discovered that after five days of post-treatment storage, the L* value of chicken breast treated with in-package cold plasma was dramatically raised, resulting in paler breast meat [31].
Moreover, on the side part with a fat layer, the a* (redness) values of the pork treated with liquid plasma were significantly lower than the control and water groups. In addition, after applying the liquid plasma to the skin and side part with a fat layer of the pork samples, the b* (yellowness) value of the skin and side part with a fat layer was lower than the control and water groups. However, on day 10, the b* values of the red meat in the liquid plasma group were significantly higher than those of the water immersion group. A color evaluation of pork loins following treatment with DBD plasma revealed that the L* values significantly decreased, the a* values slightly decreased, and the b* values remained unchanged [58]. The a* values of the chicken samples’ skin in the liquid plasma group were significantly lower than the control and water groups. Furthermore, the b* values of the meat part were significantly lower than the control and water groups. The L*, a*, and b* values remained close to the untreated samples in the study of the in-package decontamination of chicken breast using ACP plasma [67]. According to Lee’s study, the L* and b* values of the chicken breast treated with flexible thin-layer DBD plasma increased but the a* values decreased, which correlated with an increase in exposure time [54].
In this study, the water activity of the pork samples treated with liquid plasma was slightly lower, but remained close to the untreated sample. In contrast, the water activity of the sample of chicken with skin treated with liquid plasma was similar to that of the control and water groups. The general water activity value of raw meat was 0.98 or above [71]. Additional cold plasma investigations are required to determine the components and procedures responsible for lowering water activity in order to preserve meat or inactivate bacteria.

5. Conclusions

In this study, cold plasma technology in liquid form or liquid plasma with 60 ppm H2O2 could effectively reduce the amount of S. Enteritidis, S. Typhimurium, E. coli, and C. jejuni on the surface of pork and chicken meat. However, the treatment had a limited effect on the reduction of S. aureus and P. aeruginosa. This treatment appeared to have a negligible effect on the color, pH value, and water activity of the meat. This method may represent a novel technology for use in the pig and chicken slaughtering process.

Author Contributions

Conceptualization, D.P.; methodology, P.S., K.N.L., T.M. and D.P.; software, P.S. and K.N.L.; validation, K.N.L., T.M. and D.P.; formal analysis, P.S., K.N.L., T.M. and D.P.; investigation, P.S., T.M., P.N., C.J., V.C. and D.P.; resources, P.S., C.S., W.K., K.N.L., T.M. and D.P.; data curation, P.S., K.N.L., T.M. and D.P.; writing—original draft, P.S., K.N.L., T.M. and D.P.; writing—review and editing, C.J., K.N.L., T.M. and D.P.; visualization, P.S., K.N.L. and D.P.; supervision, K.N.L., T.M. and D.P.; project administration, D.P.; funding acquisition, D.P. All authors have read and agreed to the published version of the manuscript.

Funding

This research was funded by the National Research Council of Thailand (NRCT) for the research project on using plasma for the decontamination of pathogenic bacteria on raw pork and chicken surfaces, the research project group of Plasma Technology for Food Safety and Agricultural Product Value Enhancing (R000020586), and the Center of Excellence in Veterinary Public Health (R000029943), Chiang Mai University.

Institutional Review Board Statement

Not applicable.

Informed Consent Statement

Not applicable.

Data Availability Statement

The data presented in this study are available on request from the corresponding author. The data are not publicly available due to institutional privacy policy.

Acknowledgments

The authors are particularly thankful to Nattawooti Sthitmatee, the principal investigator of this project, Kanruethai Wongsawan, and Kusnul aYuli Maulana, Faculty of Veterinary Medicine, Chiang Mai University, for assisting with the laboratory analysis work. We would like to express our gratitude to the Science and Technology Park, Chiang Mai University (CMU STeP), for their collaboration and the provision of liquid plasma. Furthermore, we thank the Veterinary Public Health and Food Safety Centre for Asia Pacific (VPHCAP) and the Center of Excellence in Veterinary Public Health, Faculty of Veterinary Medicine, Chiang Mai University, for their support in the publication of this project.

Conflicts of Interest

The authors declare no conflict of interest.

References

  1. Alexandratos, N.; Bruinsma, J. World Agriculture towards 2030/2050 The 2012 Revision; Food and Agriculture Organization of the United Nations: Rome, Italy, 2012. [Google Scholar]
  2. OECD/FAO. Meat—Projection highlights. In OECD-FAO Agricultural Outlook 2021–2030; Food and Agriculture Organization of the United Nations: Rome, Italy, 2021; p. 164. [Google Scholar]
  3. WHO. Food Safety; WHO: Geneva, Switzerland, 2022. [Google Scholar]
  4. Thirumdas, R.; Kothakota, A.; Annapure, U.; Siliveru, K.; Blundell, R.; Gatt, R.; Valdramidis, V.P. Plasma activated water (PAW): Chemistry, physico-chemical properties, applications in food and agriculture. Trends Food Sci. Technol. 2018, 77, 21–31. [Google Scholar] [CrossRef]
  5. USDA. Livestock and Poultry: World Markets and Trade; USDA: Washington, DC, USA, 2022; p. 2.
  6. Galiş, A.M.; Marcq, C.; Marlier, D.; Portetelle, D.; Van, I.; Beckers, Y.; Théwis, A. Control of Salmonella Contamination of Shell Eggs—Preharvest and Postharvest Methods: A Review. Compr. Rev. Food Sci. Food Saf. 2013, 12, 155–182. [Google Scholar] [CrossRef]
  7. Rothrock, M.J.; Zhuang, H.; Lawrence, K.C.; Bowker, B.C.; Gamble, G.R.; Hiett, K.L. In-Package Inactivation of Pathogenic and Spoilage Bacteria Associated with Poultry Using Dielectric Barrier Discharge-Cold Plasma Treatments. Curr. Microbiol. 2017, 74, 149–158. [Google Scholar] [CrossRef] [PubMed]
  8. Bakhtiary, F.; Sayevand, H.R.; Remely, M.; Hippe, B.; Hosseini, H.; Haslberger, A.G. Evaluation of Bacterial Contamination Sources in Meat Production Line. J. Food Qual. 2016, 39, 750–756. [Google Scholar] [CrossRef]
  9. Salmela, S.P.; Fredriksson-Ahomaa, M.; Hatakka, M.; Nevas, M. Microbiological contamination of sheep carcases in Finland by excision and swabbing sampling. Food Control 2013, 31, 372–378. [Google Scholar] [CrossRef]
  10. Huffman, R.D. Current and future technologies for the decontamination of carcasses and fresh meat. Meat Sci. 2002, 62, 285–294. [Google Scholar] [CrossRef]
  11. Dinçer, A.H.; Baysal, T. Decontamination Techniques of Pathogen Bacteria in Meat and Poultry. Crit. Rev. Microbiol. 2004, 30, 197–204. [Google Scholar] [CrossRef]
  12. Milios, K.; Drosinos, E.; Zoiopoulos, P.E. Carcass decontamination methods in slaughterhouses: A review. J. Hell. Vet. Med. Soc. 2014, 65, 65–78. [Google Scholar] [CrossRef] [Green Version]
  13. Dragan, V.; Radoslav, G.; Tomovic, V.; Torbica, A. Effects of temperature and method of heat treatment on myofibrillar proteins of pork. Chem. Ind. Chem. Eng. Q. 2014, 20, 23. [Google Scholar] [CrossRef] [Green Version]
  14. EFSA. Scientific Opinion on the safety and efficacy of using recycled hot water as a decontamination technique for meat carcasses. EFSA J. 2010, 8, 1827. [Google Scholar] [CrossRef]
  15. Zweifel, C.; Stephan, R. Antimicrobial activity of decontamination treatments for poultry carcasses: A literature survey. In Microbial Decontamination in the Food Industry; Demirci, A., Ngadi, M.O., Eds.; Woodhead Publishing: Cambridge, UK, 2012; pp. 60–95. [Google Scholar]
  16. Nesbakken, T.; Eckner, K.; Røtterud, O.-J. The effect of blast chilling on occurrence of human pathogenic Yersinia enterocolitica compared to Campylobacter spp. and numbers of hygienic indicators on pig carcasses. Int. J. Food Microbiol. 2008, 123, 130–133. [Google Scholar] [CrossRef]
  17. Fikiin, K. Handbook of frozen food processing and packaging. Int. J. Refrig. 2007, 30, 745–746. [Google Scholar] [CrossRef]
  18. Sohaib, M.; Anjum, F.M.; Arshad, M.S.; Rahman, U.U. Postharvest intervention technologies for safety enhancement of meat and meat based products; a critical review. J. Food Sci. Technol. 2016, 53, 19–30. [Google Scholar] [CrossRef] [Green Version]
  19. Cambero, M.I.; Cabeza, M.C.; Escudero, R.; Manzano, S.; Garcia-Marquez, I.; Velasco, R.; Ordonez, J.A. Sanitation of selected ready-to-eat intermediate-moisture foods of animal origin by E-beam irradiation. Foodborne Pathog. Dis. 2012, 9, 594–599. [Google Scholar] [CrossRef]
  20. Brewer, M.S. Irradiation effects on meat flavor: A review. Meat Sci. 2009, 81, 1–14. [Google Scholar] [CrossRef]
  21. Byrd, J.; McKee, S.R. Improving slaughter and processing technologies. In Food Safety Control in the Poultry Industry, 1st ed.; Elsevier: Amsterdam, The Netherlands, 2005; pp. 310–332. [Google Scholar] [CrossRef]
  22. Rahman, S.M.E.; Wang, J.; Oh, D.-H. Synergistic effect of low concentration electrolyzed water and calcium lactate to ensure microbial safety, shelf life and sensory quality of fresh pork. Food Control 2013, 30, 176–183. [Google Scholar] [CrossRef]
  23. Coll Cárdenas, F.; Andrés, S.; Giannuzzi, L.; Zaritzky, N. Antimicrobial action and effects on beef quality attributes of a gaseous ozone treatment at refrigeration temperatures. Food Control 2011, 22, 1442–1447. [Google Scholar] [CrossRef]
  24. MLA. Ozonated Water; MLA: Sydney, Australia, 2006; p. 4. [Google Scholar]
  25. Foster, J.W. Escherichia coli acid resistance: Tales of an amateur acidophile. Nat. Rev. Microbiol. 2004, 2, 898–907. [Google Scholar] [CrossRef]
  26. Carranza, L.; Rubio Lozano, M.; Mendez, D.; Wacher, C.; Espinosa, J.; Camacho, B.; Macedo, R.E.F. Acetic acid as an intervention strategy to decontaminate beef carcasses in mexican commercial slaughterhouse. Food Sci. Technol. 2013, 33, 446–450. [Google Scholar] [CrossRef] [Green Version]
  27. Stopforth, J.D.; Skandamis, P.N.; Geornaras, I.; Sofos, J.N. Acid tolerance of acid-adapted and nonacid-adapted Escherichia coli O157:H7 strains in beef decontamination runoff fluids or on beef tissue. Food Microbiol. 2007, 24, 530–538. [Google Scholar] [CrossRef]
  28. Sheen, S.; Hwang, C.A.; Juneja, V.K. Modeling the impact of chlorine on the behavior of Listeria monocytogenes on ready-to-eat meats. Food Microbiol. 2011, 28, 1095–1100. [Google Scholar] [CrossRef] [PubMed]
  29. Gavahian, M.; Khaneghah, A.M. Cold plasma as a tool for the elimination of food contaminants: Recent advances and future trends. Crit. Rev. Food Sci. Nutr. 2020, 60, 1581–1592. [Google Scholar] [CrossRef] [PubMed]
  30. Ulbin-Figlewicz, N.; Jarmoluk, A.; Marycz, K. Antimicrobial activity of low-pressure plasma treatment against selected foodborne bacteria and meat microbiota. Ann. Microbiol. 2015, 65, 1537–1546. [Google Scholar] [CrossRef] [PubMed] [Green Version]
  31. Zhuang, H.; Rothrock Jr, M.J.; Hiett, K.L.; Lawrence, K.C.; Gamble, G.R.; Bowker, B.C.; Keener, K.M. In-Package Air Cold Plasma Treatment of Chicken Breast Meat: Treatment Time Effect. J. Food Qual. 2019, 2019, 1837351. [Google Scholar] [CrossRef] [Green Version]
  32. Bhatt, H.; Prasad, R.; Joshi, D.; Nukasani, S. Non-Thermal plasma system for decontamination of fruits, vegetables and spices: A review. Int. J. Chem. Stud. 2018, 6, 619–627. [Google Scholar]
  33. Lee, E.-A.; Kang, J.-H.; Cheong, J.-H.; Koh, K.-C.; Jeon, W.-M.; Choe, J.-H.; Hong, K.-C.; Kim, J.-M. Evaluation of whole pork belly qualitative and quantitative properties using selective belly muscle parameters. Meat Sci. 2018, 137, 92–97. [Google Scholar] [CrossRef]
  34. Phan, K.T.K.; Phan, H.T.; Brennan, C.S.; Regenstein, J.M.; Jantanasakulwong, K.; Boonyawan, D.; Phimolsiripol, Y. Gliding arc discharge non-thermal plasma for retardation of mango anthracnose. LWT 2019, 105, 142–148. [Google Scholar] [CrossRef]
  35. Corry, J.E.L.; James, S.J.; Purnell, G.; Barbedo-Pinto, C.S.; Chochois, Y.; Howell, M.; James, C. Surface pasteurisation of chicken carcasses using hot water. J. Food Eng. 2007, 79, 913–919. [Google Scholar] [CrossRef]
  36. James, C.; James, S.J.; Hannay, N.; Purnell, G.; Barbedo-Pinto, C.; Yaman, H.; Araujo, M.; Gonzalez, M.L.; Calvo, J.; Howell, M.; et al. Decontamination of poultry carcasses using steam or hot water in combination with rapid cooling, chilling or freezing of carcass surfaces. Int. J. Food Microbiol. 2007, 114, 195–203. [Google Scholar] [CrossRef]
  37. ISO/TS6579; Microbiology of the Food Chain-Horizontal Method for the Detection, Enumeration and Serotyping of Salmonella-Part 1: Detection of Salmonella spp. Standard Norge: Oslo, Norway, 2017.
  38. Bredie, W.L.; de Boer, E. Evaluation of the MPN, Anderson-Baird-Parker, Petrifilm E. coli and Fluorocult ECD method for enumeration of Escherichia coli in foods of animal origin. Int. J. Food Microbiol. 1992, 16, 197–208. [Google Scholar] [CrossRef]
  39. Manafi, M.; Kneifel, W.; Bascomb, S. Fluorogenic and chromogenic substrates used in bacterial diagnostics. Microbiol. Rev. 1991, 55, 335–348. [Google Scholar] [CrossRef]
  40. Corry, J.E.; Post, D.E.; Colin, P.; Laisney, M.J. Culture media for the isolation of campylobacters. Int. J. Food Microbiol. 1995, 26, 43–76. [Google Scholar] [CrossRef]
  41. ISO/TS10272-1; Microbiology of the Food Chain Animal Feeding Stuffs—Horizontal Method for Detection and Enumeration of Campylobacter spp.—Part 1 Detection method. The International Organization for Standardization: Geneva, Switzerland, 2006; p. 16.
  42. ISO/TS10272-2; Microbiology of Food and Animal for Detection and Enumeration of Campylobacter spp. In Part 2: Colony-Count Technique. The International Organization for Standardization: Geneva, Switzerland, 2006; p. 13.
  43. Denis, M.; Soumet, C.; Rivoal, K.; Ermel, G.; Blivet, D.; Salvat, G.; Colin, P. Development of a m-PCR assay for simultaneous identification of Campylobacter jejuni and C. coli. Lett. Appl. Microbiol. 1999, 29, 406–410. [Google Scholar] [CrossRef]
  44. Sierra-Arguello, Y.M.; Perdoncini, G.; Rodrigues, L.B.; Ruschel Dos Santos, L.; Apellanis Borges, K.; Quedi Furian, T.; Pippi Salle, C.T.; de Souza Moraes, H.L.; Pereira Gomes, M.J.; Pinheiro do Nascimento, V. Identification of pathogenic genes in Campylobacter jejuni isolated from broiler carcasses and broiler slaughterhouses. Sci. Rep. 2021, 11, 4588. [Google Scholar] [CrossRef]
  45. ISO6888-1; Microbiology of the Food Chain Animal Feeding Stuffs—Horizontal Method for Enumeration of Coagulase Staphylococci (Staphylococcus aureus and Other Species—Part 1 Technique Using Baird Park Agar Medium. The International Organization for Standardization: Geneva, Switzerland, 1997; p. 19.
  46. ISO13720; Meat and Meat Products—Enumeration of Presumptive Pseudomonas spp. The International Organization for Standardization: Geneva, Switzerland, 2010.
  47. Pichpol, D. Experimental Reduction of Salmonella in Raw Chicken Breasts. Ph.D. Thesis, The Free University of Berlin, Berlin, Germany, 2009; p. 142. [Google Scholar]
  48. AMSA. Meat Color Measurement Guidelines; American Meat Science Association: Des Moines, IA, USA, 2012; p. 124. [Google Scholar]
  49. FDA. Water Activity (aw) in Foods. In Food and Drug Administration Inspection Technical Guides; FDA: White Oak, MD, USA, 2014. [Google Scholar]
  50. Rutala, W.A.; Weber, D.J. Healthcare Infection Control Practices Advisory Committee (HICPAC). Guideline for Disinfection and Sterilization in Healthcare Facilities, 2008, Prevention. CDC Certers Dis. Control. Prev. 2019, 64–65. [Google Scholar]
  51. Locke, B.R.; Shih, K.-Y. Review of the methods to form hydrogen peroxide in electrical discharge plasma with liquid water. Plasma Sources Sci. Technol. 2011, 20, 034006. [Google Scholar] [CrossRef]
  52. Bolouki, N.; Kuan, W.-H.; Huang, Y.-Y.; Hsieh, J.-H. Characterizations of a Plasma-Water System Generated by Repetitive Microsecond Pulsed Discharge with Air, Nitrogen, Oxygen, and Argon Gases Species. Appl. Sci. 2021, 11, 6158. [Google Scholar] [CrossRef]
  53. Laurita, R.; Barbieri, D.; Gherardi, M.; Colombo, V.; Lukes, P. Chemical analysis of reactive species and antimicrobial activity of water treated by nanosecond pulsed DBD air plasma. Clin. Plasma Med. 2015, 3, 53–61. [Google Scholar] [CrossRef]
  54. Lee, H.; Yong, H.I.; Kim, H.J.; Choe, W.; Yoo, S.J.; Jang, E.J.; Jo, C. Evaluation of the microbiological safety, quality changes, and genotoxicity of chicken breast treated with flexible thin-layer dielectric barrier discharge plasma. Food Sci. Biotechnol. 2016, 25, 1189–1195. [Google Scholar] [CrossRef]
  55. Fernández, A.; Thompson, A. The inactivation of Salmonella by cold atmospheric plasma treatment. Food Res. Int. 2012, 45, 678–684. [Google Scholar] [CrossRef]
  56. Ragni, L.; Berardinelli, A.; Vannini, L.; Montanari, C.; Sirri, F.; Guerzoni, M.E.; Guarnieri, A. Non-thermal atmospheric gas plasma device for surface decontamination of shell eggs. J. Food Eng. 2010, 100, 125–132. [Google Scholar] [CrossRef]
  57. Mostafa, N.Y. Effectiveness of Immersion Treatments with Hydrogen Peroxide in Reducing Microbial Populations on Raw Chicken Carcasses. Glob. Vet. 2010, 4, 362–365. [Google Scholar]
  58. Kim, H.-J.; Yong, H.I.; Park, S.; Choe, W.; Jo, C. Effects of dielectric barrier discharge plasma on pathogen inactivation and the physicochemical and sensory characteristics of pork loin. Curr. Appl. Phys. 2013, 13, 1420–1425. [Google Scholar] [CrossRef]
  59. Bolton, D.J. Campylobacter virulence and survival factors. Food Microbiol. 2015, 48, 99–108. [Google Scholar] [CrossRef]
  60. Shen, J.; Tian, Y.; Li, Y.; Ma, R.; Zhang, Q.; Zhang, J.; Fang, J. Bactericidal Effects against S. aureus and Physicochemical Properties of Plasma Activated Water stored at different temperatures. Sci. Rep. 2016, 6, 28505. [Google Scholar] [CrossRef] [Green Version]
  61. Vu, B.; Chen, M.; Crawford, R.J.; Ivanova, E.P. Bacterial Extracellular Polysaccharides Involved in Biofilm Formation. Molecules 2009, 14, 2535–2554. [Google Scholar] [CrossRef]
  62. Ziuzina, D.; Boehm, D.; Patil, S.; Cullen, P.J.; Bourke, P. Cold Plasma Inactivation of Bacterial Biofilms and Reduction of Quorum Sensing Regulated Virulence Factors. PLoS ONE 2015, 10, e0138209. [Google Scholar] [CrossRef]
  63. Ziuzina, D.; Patil, S.; Cullen, P.J.; Boehm, D.; Bourke, P. Dielectric Barrier Discharge Atmospheric Cold Plasma for Inactivation of Pseudomonas aeruginosa Biofilms. Plasma Med. 2014, 4, 137–152. [Google Scholar] [CrossRef] [Green Version]
  64. Patenall, B.L.; Hathaway, H.; Sedgwick, A.C.; Thet, N.T.; Williams, G.T.; Young, A.E.; Allinson, S.L.; Short, R.D.; Jenkins, A.T.A. Limiting Pseudomonas aeruginosa Biofilm Formation Using Cold Atmospheric Pressure Plasma. Plasma Med. 2018, 8, 269–277. [Google Scholar] [CrossRef]
  65. Lillard, H.S.; Thomson, J.E. Efficacy of Hydrogen Peroxide as a Bactericide in Poultry Chiller Water. J. Food Sci. 1983, 48, 125–126. [Google Scholar] [CrossRef]
  66. ICMSF. ICMSF HACCP in Microbiological Safety and Quality; Silliker, J.H., Baird-Parker, A.C., Bryan, F.L., Christian, J.H.B., Roberts, T.A., Tompkin, R.B., Eds.; Blackwell Scientific Publications: London, UK, 1988. [Google Scholar]
  67. Moutiq, R.; Misra, N.N.; Mendonça, A.; Keener, K. In-package decontamination of chicken breast using cold plasma technology: Microbial, quality and storage studies. Meat Sci. 2020, 159, 107942. [Google Scholar] [CrossRef] [PubMed]
  68. Elzerman, J.E.; Hoek, A.C.; van Boekel, M.A.J.S.; Luning, P.A. Consumer acceptance and appropriateness of meat substitutes in a meal context. Food Qual. Prefer. 2011, 22, 233–240. [Google Scholar] [CrossRef] [Green Version]
  69. Shleikin, A.G.; Medvedev, Y.V. Role of peroxidation and heme catalysis in coloration of raw meat. Acta Sci. Pol. Technol. Aliment. 2014, 13, 123–127. [Google Scholar] [CrossRef] [PubMed] [Green Version]
  70. Mulder, R.W.; van der Hulst, M.C.; Bolder, N.M. Salmonella decontamination of broiler carcasses with lactic acid, L-cysteine, and hydrogen peroxide. Poult. Sci. 1987, 66, 1555–1557. [Google Scholar] [CrossRef]
  71. FDA. Hazard Analysis and Risk-Based Preventive Controls for Human Food: Draft Guidance for Industry. In Chapter 4: Preventive Controls; FDA: White Oak, MD, USA, 2018; p. 22. [Google Scholar]
Figure 1. Sites for the color evaluation of pork with skin (a) and sites for the color evaluation of chicken meat with skin (b).
Foods 11 01743 g001
Figure 2. Microbial loads of (a) S. Enteritidis, (b) S. Typhimurium, (c) E. coli, (d) C. jejuni, (e) S. aureus, and (f) P. aeruginosa of pork samples at day 0 of the experiment and after being stored at 4–6 °C for 10 days (p ≤ 0.05).
Foods 11 01743 g002
Figure 3. Microbial loads of (a) S. Enteritidis, (b) S. Typhimurium, (c) E. coli, (d) C. jejuni, (e) S. aureus, and (f) P. aeruginosa of chicken samples at day 0 of the experiment and after being stored at 4–6 °C for 10 days (p ≤ 0.05).
Foods 11 01743 g003
Table 1. Reduction in the bacteria on pork.
Bacterial StrainsControlReduction (log CFU/g ± SD) *
WaterLiquid Plasma
Salmonella Enteritidis 3.75 ± 0.170.93 ± 0.670.37 ± 0.25
Salmonella Typhimurium 3.31 ± 0.410.20 ± 0.480.08 ± 0.19 a
Escherichia coli3.41 ± 0.640.50 ± 0.720.08 ± 0.43
Campylobacter jejuni4.07 ± 0.480.27 ± 0.571.03 ± 0.99 a
Staphylococcus aureus3.62 ± 0.260.05 ± 0.270.15 ± 0.34
Pseudomonas aeruginosa7.34 ± 4.28−0.67 ± 4.23 **−0.13 ± 4.25 **
a: The same lowercase letters within a column indicate that the values are significantly different at p ≤ 0.05. * Reduction is the difference of the mean (log CFU/g) of the bacteria between the initial load (control or untreated samples) and each treatment. ** Reduction (log CFU/g ± SD) is negative due to an increase in the number of microorganisms after each treatment.
Table 2. Reduction in the bacteria in chicken meat.
Bacterial StrainsControlReduction (log CFU/g ± SD) *
WaterLiquid Plasma
Salmonella Enteritidis 4.59 ± 0.581.04 ± 0.331.11 ± 0.52
Salmonella Typhimurium 4.79 ± 1.140.20 ± 1.360.49 ± 1.30
Escherichia coli3.21 ± 0.530.15 ± 0.490.72 ± 0.80
Campylobacter jejuni6.81 ± 3.401.09 ± 2.161.39 ± 1.10
Staphylococcus aureus3.45 ± 0.250.46 ± 0.290.26 ± 0.33
Pseudomonas aeruginosa6.36 ± 3.41−0.79 ± 4.14 **−0.58 ± 4.26 **
* Reduction is the difference of the mean (log CFU/g) of the bacteria between the initial load (control or untreated samples) and each treatment. ** Reduction (log CFU/g ± SD) is negative due to an increase in the number of microorganisms after the treatment.
Table 3. Means of the microbial loads (log CFU/g ± SD) of pork samples at days 0, 3, 7, and 10 after being stored under refrigerated conditions.
Bacterial StrainsGroupDay 0Day 3Day 7Day 10
S. Enteritidis Control3.86 ± 0.173.88 ± 0.06 a3.68 ± 0.163.60 ± 0.05 a
Water3.47 ± 0.25 a,b3.00 ± 0.18 a,c2.68 ± 0.772.15 ± 0.51 b,c
Liquid plasma3.62 ± 0.23 a3.43 ± 0.203.25 ± 0.19 a3.22 ± 0.21
S. Typhimurium Control3.46 ± 0.13 a3.14 ± 0.282.97 ± 0.302.94 ± 0.42 a
Water3.25 ± 0.253.08 ± 0.12 a3.00 ± 0.192.51 ± 0.42 a
Liquid plasma3.33 ± 0.273.28 ± 0.163.17 ± 0.063.15 ± 0.16
E. coliControl3.58 ± 0.193.87 ± 0.743.22 ± 0.142.96 ± 0.81
Water3.80 ± 0.41 a,b,c2.79 ± 0.10 a2.50 ± 0.63 b2.54 ± 0.67 c
Liquid plasma3.60 ± 0.16 a,b3.55 ± 0.693.05 ± 0.19 b3.13 ± 0.11 b
C. jejuniControl4.61 ± 0.22 a,b4.26 ± 0.24 c3.90 ± 0.31 a,c3.52 ± 0.25 b,c
Water4.52 ± 0.13 a,b,c3.77 ± 0.48 a3.64 ± 0.37 b3.28 ± 0.37 c
Liquid plasma3.45 ± 1.143.26 ± 0.44 a3.56 ± 0.29 b1.88 ± 0.81 a,b
S. aureusControl3.53 ± 0.133.65 ± 0.133.70 ± 0.393.58 ± 0.30
Water3.33 ± 0.22 a3.62 ± 0.233.80 ± 0.13 a3.51 ± 0.28
Liquid plasma3.18 ± 0.12 a3.49 ± 0.20 b3.83 ± 0.30 a,b3.37 ± 0.32
P. aeruginosaControl3.72 ± 0.17 a4.72 ± 0.49 a7.09 ± 0.49 a>8.00 ± 0.00 a
Water3.68 ± 0.20 a5.27 ± 0.87 a7.08 ± 0.46 a>8.00 ± 0.00 a
Liquid plasma3.67 ± 0.20 a5.01 ± 0.35 a7.21 ± 0.45 a>8.00 ± 0.00 a
a,b,c: The same lowercase letters within a row indicate that the values are significantly different at p ≤ 0.05.
Table 4. Means of the microbial loads (log CFU/g ± SD) of chicken samples at days 0, 3, 7, and 10 after being stored under refrigerated conditions.
Bacterial StrainsGroupDay 0Day 3Day 7Day 10
S. Enteritidis Control4.35 ± 0.48 a3.96 ± 0.11 b,c4.73 ± 0.26 b,d5.33 ± 0.19 a,c,d
Water3.72 ± 0.183.39 ± 0.14 a3.21 ± 0.30 b3.87 ± 0.18 a,b
Liquid plasma3.62 ± 0.19 a3.05 ± 0.25 a3.71 ± 0.373.55 ± 0.83
S. Typhimurium Control3.77 ± 0.62 a,b3.77 ± 0.14 c,d5.58 ± 0.24 a,c6.05 ± 0.61 b,d
Water3.29 ± 0.42 a,b3.72 ± 0.45 c,d4.76 ± 0.44 a,c,e6.57 ± 0.57 b,d,e
Liquid plasma3.47 ± 0.10 a,b3.24 ± 0.49 c,d4.40 ± 0.40 a,c6.10 ± 1.14 b,d
E. coliControl2.91 ± 0.823.53 ± 0.16 a2.87 ± 0.23 a,b3.54 ± 0.17 b
Water2.89 ± 0.813.07 ± 0.332.90 ± 0.303.36 ± 0.23
Liquid plasma2.47 ± 0.983.18 ± 0.261.96 ± 0.772.34 ± 0.59
C. jejuniControl4.89 ± 0.10 a,b,c4.62 ± 0.16 a,d,e6.16 ± 0.37 b,d7.37 ± 0.02 c,e
Water4.44 ± 0.07 a4.47 ± 0.12 b5.93 ± 0.22 a,b7.31 ± 0.14
Liquid plasma4.64 ± 0.07 a,b4.11 ± 0.21 c,d5.91 ± 0.26 a,c6.66 ± 1.24 b,d
S. aureusControl3.60 ± 0.053.37 ± 0.363.44 ± 0.253.38 ± 0.20
Water3.21 ± 0.13 a3.03 ± 0.282.92 ± 0.332.80 ± 0.28 a
Liquid plasma3.17 ± 0.243.32 ± 0.323.22 ± 0.353.05 ± 0.41
P. aeruginosaControl3.74 ± 0.07 a,b4.23 ± 0.35 c,d6.63 ± 0.36 a,c7.73 ± 0.11 b,d
Water3.45 ± 0.35 a,b,c4.36 ± 0.30 a,d,e7.5 ± 0.11 b,d,f7.97 ± 0.02 c,e,f
Liquid plasma3.57 ± 0.15 a,b3.57 ± 0.49 c,d7.32 ± 0.47 a,c,e8.01 ± 0.02 b,d,e
a,b,c,d,e,f: The same lowercase letters within a row indicate that the values are significantly different at p ≤ 0.05.
Table 5. Averages of the pH value on the surface of the pork samples (n = 9).
Average of pH Value ± SD
DayControlWaterLiquid Plasma
05.76 ± 0.09 a5.66 ± 0.07 a6.03 ± 0.66 a
35.78 ± 0.05 a5.60 ± 0.02 a5.70 ± 0.27 a
75.66 ± 0.03 a5.61 ± 0.06 b5.79 ± 0.39 a,b
106.02 ± 0.08 a,b5.70 ± 0.06 a5.76 ± 0.38 b
a,b: The same lowercase letters within a row indicate that the values are significantly different at p ≤ 0.05.
Table 6. Averages of the pH value of the inside of the pork samples (n = 9).
Average of pH Value ± SD
DayControlWaterLiquid Plasma
05.55 ± 0.05 a5.66 ± 0.06 a5.98 ± 0.07 a
35.68 ± 0.04 a5.46 ± 0.02 a,b5.63 ± 0.06 b
75.57 ± 0.06 a5.54 ± 0.04 b5.68 ± 0.06 a,b
105.93 ± 0.07 a5.54 ± 0.07 a5.65 ± 0.06 a
a,b: The same lowercase letters within a row indicate that the values are significantly different at p ≤ 0.05.
Table 7. Averages of the pH value on the surface of the chicken samples (n = 9).
Average of pH Value ± SD
DayControlWaterLiquid Plasma
05.93 ± 0.05 a6.06 ± 0.09 a6.22 ± 0.03 a
36.00 ± 0.03 a5.95 ± 0.02 a,b6.02 ± 0.03 b
76.06 ± 0.03 a5.92 ± 0.07 a5.99 ± 0.04 a
106.13 ± 0.06 a6.41 ± 0.12 a6.03 ± 0.03 a
a,b: The same lowercase letters within a row indicate that the values are significantly different at p ≤ 0.05.
Table 8. Averages of the pH value of the inside of the chicken samples (n = 9).
Average of pH Value ± SD
DayControlWaterLiquid Plasma
05.94 ± 0.04 a5.99 ± 0.11 b6.08 ± 0.05 a,b
35.95 ± 0.055.90 ± 0.035.90 ± 0.08
75.96 ± 0.05 a,b5.84 ± 0.06 a5.86 ± 0.08 b
106.05 ± 0.06 a6.30 ± 0.13 a,b5.99 ± 0.05 b
a,b: The same lowercase letters within a row indicate that the values are significantly different at p ≤ 0.05.
Table 9. Means of color values based on lightness (L*), the red–green index (a*), and the yellow–blue index (b*) on the surface of the pork samples in the control, water immersion, and liquid plasma groups.
Part of Meat Day 0Day 3Day 7Day 10
Index Control Group
Red meat 1L*56.26 ± 8.36 a53.08 ± 12.2554.99 ± 10.2143.7 ± 7.52 a
a*6.83 ± 2.296.29 ± 2.616.09 ± 2.399.08 ± 1.00
b*13.17 ± 3.5511.69 ± 2.3210.64 ± 3.2612.93 ± 3.47
Skin 1L*58.63 ± 5.7961.75 ± 4.1860.05 ± 6.4860.40 ± 8.29
a*7.86 ± 1.457.68 ± 1.717.58 ± 2.315.50 ± 2.25
b*17.68 ± 3.4018.56 ± 2.8316.50 ± 3.6915.91 ± 3.90
Side 2L*57.99 ± 10.71 a52.74 ± 12.9337.64 ± 8.69 a,b51.04 ± 9.17 b
a*7.07 ± 1.547.87 ± 2.488.65 ± 2.307.78 ± 1.89
b*14.39 ± 1.21 a14.58 ± 1.51 b14.00 ± 3.1116.98 ± 1.61 a,b
Water Group
Red meat 1L*45.20 ± 10.1039.33 ± 4.19 a43.34 ± 6.9054.30 ± 6.75 a
a*7.52 ± 3.118.89 ± 2.4610.73 ± 2.07 a6.04 ± 2.80 a
b*12.76 ± 3.27 a9.16 ± 3.66 b17.17 ± 1.80 a,b,c11.87 ± 2.76 c
Skin 1L*65.72 ± 9.25 a64.71 ± 5.33 b66.39 ± 2.48 c76.29 ± 0.79 a,b,c
a*3.45 ± 1.18 a,b6.59 ± 1.49 a,c7.91 ± 0.84 b3.26 ± 0.33 c
b*16.18 ± 3.25 a19.18 ± 3.53 b21.77 ± 1.50 a,c14.45 ± 0.73 b,c
Side 2L*58.21 ± 8.89 a50.94 ± 9.62 b55.18 ± 9.44 c68.00 ± 2.77 a,b,c
a*5.46 ± 2.67 a8.19 ± 1.86 a,b8.16 ± 1.25 c3.93 ± 0.70 b,c
b*14.90 ± 2.4114.54 ± 1.51 a17.52 ± 1.91 a,b13.97 ± 1.58 b
Liquid Plasma Group
Red meat 1L*64.10 ± 7.51 a50.54 ± 7.67 a,b61.58 ± 6.7165.91 ± 3.87 b
a*5.89 ± 2.126.96 ± 1.757.88 ± 1.786.45 ± 1.66
b*13.26 ± 1.42 a,b12.23 ± 2.42 c,d17.05 ± 1.97 a,c16.12 ± 1.42 b,d
Skin 1L*73.78 ± 1.88 a,b,c70.19 ± 2.84 a,d,e78.17 ± 1.38 b,d,f79.81 ± 0.55 c,e,f
a*3.22 ± 0.61 a5.50 ± 1.70 a,b,c3.34 ± 0.44 b3.16 ± 0.30 c
b*15.34 ± 0.93 a,b16.61 ± 2.10 c,d12.49 ± 1.27 a,c,e9.27 ± 0.72 b,d,e
Side 2L*70.26 ± 3.39 a,b59.07 ± 6.70 a,c,d71.40 ± 8.30 c76.62 ± 3.12 b,d
a*3.02 ± 0.82 a6.79 ± 2.19 a,b,c3.71 ± 0.97 b3.57 ± 0.49 c
b*11.86 ± 0.84 a,b15.12 ± 2.26 a13.28 ± 2.2813.65 ± 0.53 b
a,b,c,d,e,f: The same lowercase letters within a row indicate that the values are significantly different at p ≤ 0.05; 1: n = 9; 2: n = 10.
Table 10. Means of color values based on lightness (L*), the red–green index (a*), and the yellow–blue index (b*) on the surface of chicken meat samples in the control, water immersion, and liquid plasma groups.
Part of Meat Day 0Day 3Day 7Day 10
Index Control Group
MeatL*57.73 ± 6.24 a,b45.37 ± 5.17 a48.30 ± 6.81 b46.96 ± 7.02
a*5.11 ± 0.95 a8.08 ± 1.40 a,b5.65 ± 1.53 b5.25 ± 2.55
b*16.11 ± 1.42 a19.63 ± 3.08 a17.65 ± 3.4817.17 ± 4.12
SkinL*55.40 ± 4.4559.33 ± 13.3654.74 ± 10.1052.07 ± 4.17
a*5.66 ± 0.915.33 ± 2.324.15 ± 1.115.99 ± 1.55
b*17.15 ± 3.5916.39 ± 4.6716.01 ± 3.1619.02 ± 2.69
Water Group
MeatL*47.06 ± 4.6549.73 ± 8.4946.04 ± 10.5151.47 ± 5.54
a*5.49 ± 1.197.14 ± 1.885.11 ± 1.125.38 ± 1.22
b*16.74 ± 1.3718.44 ± 2.1517.04 ± 2.2415.98 ± 2.18
SkinL*39.15 ± 13.0850.51 ± 6.4657.72 ± 9.9154.73 ± 8.55
a*6.52 ± 1.77 a7.16 ± 1.26 b3.62 ± 0.89 a,b4.65 ± 1.50
b*16.95 ± 1.8220.48 ± 2.32 a16.37 ± 1.9915.79 ± 2.17 a
Liquid Plasma Group
MeatL*45.89 ± 9.1048.15 ± 3.1251.23 ± 5.1643.18 ± 10.69
a*5.08 ± 1.566.67 ± 1.246.45 ± 2.027.10 ± 1.76
b*12.16 ± 3.2719.32 ± 4.7116.42 ± 3.8516.40 ± 2.62
SkinL*57.89 ± 8.3961.79 ± 5.0559.54 ± 7.2463.14 ± 7.56
a*6.06 ± 1.605.05 ± 1.705.40 ± 0.904.56 ± 0.93
b*18.74 ± 3.1617.32 ± 2.7519.20 ± 3.0217.24 ± 3.25
a,b: The same lowercase letters within a row indicate that the values are significantly different at p ≤ 0.05 (n = 9 in each group).
Table 11. Water activity of pork and chicken meat samples.
DayControlWaterLiquid Plasma
awTemperature (°C)awTemperature (°C)awTemperature (°C)
Pork Samples
00.99023.80.99825.00.99225.25
30.99323.71.00025.00.98425.45
70.99124.11.00225.00.98525.45
100.99124.11.00425.00.98425.45
Chicken Meat Samples
00.99424.80.99424.50.99424.4
30.99324.30.99424.50.99224.4
70.99424.40.99624.30.99324.4
100.99224.10.99224.50.99424.4
Publisher’s Note: MDPI stays neutral with regard to jurisdictional claims in published maps and institutional affiliations.

