Article

Comparing the LC-MS Phenolic Acids Profiles of Seven Different Varieties of Brown Rice (Oryza sativa L.)

1
School of Modern Industry for Selenium Science and Engineering, Wuhan 430023, China
2
Key Laboratory of Deep Processing of Major Grain and Oil, Ministry of Education, Wuhan 430023, China
3
Institute for Farm Products Processing and Nuclear-Agricultural Technology, Hubei Academy of Agricultural Sciences, Wuhan 430064, China
4
National Engineering Laboratory for Deep Process of Rice and Byproducts, Central South University of Forestry and Technology, Changsha 410004, China
5
Nutrición y Bromatología, Facultad de Ciencias, Universidad de Burgos, 09001 Burgos, Spain
6
Preventive Medicine and Public Health, Food Science, Toxicology and Forensic Medicine Department, Faculty of Pharmacy, Universitat de València, Avda. Vicent Andrés Estellés, Burjassot, 46100 València, Spain
*
Authors to whom correspondence should be addressed.
These authors contributed equally to this work.
Foods 2022, 11(11), 1552; https://doi.org/10.3390/foods11111552
Submission received: 5 April 2022 / Revised: 26 April 2022 / Accepted: 20 May 2022 / Published: 25 May 2022

Abstract

:
Brown rice, an important material of whole-grain food, is increasingly popular for its health benefits. Thus, seven varieties of brown rice from southern China were analyzed in this study, concerning the free and bound phenolic compounds in the extract. The phenolic profiles of different brown rice were obtained and compared by the combination of HPLC and LC-MS analysis, in which eleven phenolic acids were identified. It was indicated that the total phenolic contents of different brown rice varied from 92.32 to 196.54 mg of gallic acid equivalent (GAE)/100 g DW. Ferulic acid and p-coumaric acid, free and bound, dominated within the phenolic acids. To be mentioned, the total phenols of Luotiangongmi (a kind of red rice) were significantly higher than the other six varieties. The high phenolic content of brown rice can further guide us to explore the functional properties of the crops.

1. Introduction

Epidemiological studies have indicated that a healthy diet plays a vital role in preventing chronic diseases [1,2,3,4]. As we know, rice (Oryza Sativa L.) is the staple and main food of many developing countries. Brown rice, an important material of whole-grain food, is the product obtained from rice husking without the milling process. Compared to polished rice, the bran and embryo in brown rice remain, which contain rich nutrient substances (such as phenols, dietary fiber and minerals). It has been reported that the total sugar released from brown rice was significantly lower than that from polished rice in in vitro studies, implying that brown rice could alleviate the high glycemic responses in diabetes and hyperlipidemia patients [5]. Moreover, researchers found that the total phenolic content in bran and embryos of brown rice was 13.1 times higher than that in the endosperm [6]. It has been identified that protocatechuic acid, p-hydroxybenzoic acid, vanillic acid, syringic acid, cis-p-coumaric acid, ferulic acid, sinapic acid and other derivatives were present in whole grains [7,8,9], and ferulic acid was dominant in the phenolic profiles of brown rice [10,11]. Meanwhile, the conjugated phenols accounted for 40.6~50.2% of the total phenols, further proving the presence of different types of phenolic compounds in different varieties of brown rice. To be mentioned, the total phenolic content in pigmented rice was significantly higher than brown rice, in which anthocyanin/proanthocyanidin was detected [12,13]. For instance, anthocyanin-3-glucoside is the main component of anthocyanin in black rice seeds, followed by paeoniflorin-3-glucoside and anthocyanin-3-rutinoside [14]. However, Luotiangongmi, a special variety of red rice in southern China, has not been well known and studied previously.
Therefore, in this paper, seven varieties of brown rice, including Luotiangongmi from Hubei province, were selected by the Hubei Academy of Agricultural Sciences, which contained different levels of nutritional components (data not shown). Comparing the phenolic profiles of Luotiangongmi with other varieties is beneficial so to estimate its functional and economical value, and to promote the development of the local agricultural economy. The total phenolic content (TPC) involving free and bound fractions from seven varieties of brown rice were determined in this study. Furthermore, the different composition and content of the individual phenols were characterized.

2. Materials and Methods

2.1. Chemicals and Reagents

Phenolic standards such as gallic acid, protocatechuic acid, p-hydroxybenzoic acid, chlorogenic acid, vanillin acid, caffeic acid, syringic acid, vanillin, p-coumaric acid, ferulic acid and trans-3-hydroxycinnamic acid were purchased from Sigma-Aldrich (St. Louis, MO, USA). Acetonitrile and methanol were obtained from Fisher (HPLC-grade, Thermo Fisher Scientific, Waltham, MA, USA). Other unmarked reagents were of an analytical grade.

2.2. Sample Preparation

Seven varieties of brown rice (Oryza sativa L.): Guangliangyouxiang-66, Zhaoyou-5431, Ezhong No.5, Juliangyou-60, Y liangyou-900, Zhongzheyou No.8 and Luotiangongmi were supplied by the Rice Research Institute, Hubei Academy of Agricultural Sciences (Hubei Province, China). Guangliangyouxiang-66 and Y liangyou-900 were two-line hybrid rice; Zhaoyou-5431, Juliangyou-60 and Zhongzheyou No.8 were indica-type hybrid rice; Ezhong No.5 and Luotiangongmi were indica-type conventional rice. All varieties were freshly harvested in 2018. After dehulling, the brown rice was ground to a fine powder and sieved to a uniform particle size by passing through a 100-mesh sieve, then stored at −40 °C until analysis.

2.3. Extraction of Free Phenolics

The extraction of free polyphenols from brown rice was referred to a previously described method following the appropriate modifications [15]. Briefly, 2.0 g brown rice samples were mixed with 30 mL acidified methanol solution (95% methanol: 1 mol/L HCl = 90:10, v/v). Then, the mixture was vibrated at 50 °C by a constant-temperature shaker (Guohua, China) for 1 h, followed by centrifugation at 8000 rpm for 10 min at 4 °C. After two times of extraction, the supernatant was combined and dried by a rotary evaporator under a vacuum at 40 °C (Yarong Co., Shanghai, China). Subsequently, the dried residuals were redissolved to 10 mL with methanol (HPLC-grade) and stored at –40 °C for further analysis.

2.4. Extraction of Bound Phenolics

Bound phenolics were extracted according to the previous literature following appropriate modifications [16]. After removal of the free polyphenols, the remainder was collected and mixed with 20 mL 4 M NaOH for 2 h by a constant-temperature shaker. Then, the pH of the hydrolyzed product was adjusted to 2 by an HCl solution and extracted five times with ethyl acetate. The supernatant was combined and dried by a rotary evaporator under a vacuum at 40 °C. Finally, the dried residuals were redissolved to 10 mL with methanol (HPLC-grade) and stored at −40 °C for further analysis.

2.5. Determination of Total Phenolic Content (TPC)

The TPC of extract was determined by Folin–Ciocalteu assay with minor modifications [17]. Briefly, 0.1 mL of properly diluted extracts were mixed with 6 mL of distilled water and 0.5 mL of Folin–Ciocalteu reagent, then 1.5 mL of 10% Na2CO3 solution was added and finally diluted with distilled water to 10 mL. The mixture was incubated at room temperature for 60 min away from light, and the absorbance was measured at 765 nm using a spectrophotometer (Unic Co., Shanghai, China). The standard curve was performed with a series of gallic acid ranging from 0.1 to 0.5 mg/mL in the reaction mixture. Results of the TPC in samples were calculated and expressed as mg of gallic acid equivalents (GAE) per 100 g dry weight of brown rice (mg GAE/100 g DW).

2.6. UPLC-HRMS Determination of the Phenolic Composition

The monomeric phenolic acids were identified by comparing their relative retention times (RT), UV and ESI-MS spectra with authentic compounds [18,19].
The structural analysis was performed on an Ultimate 3000 ultra-high-performance liquid chromatography (UPLC) instrument coupled to a Q-Exactive Orbitrap mass spectrometer (Thermo Fisher Scientific, Waltham, MA, USA). Negative ion mode was focused by electrospray ionization (ESI) and chromatography was acquired from a Hypersil GOLD C18 column (2.1 × 100 mm, 3 µm). The column temperature was maintained at 30 °C, and mobile phase A (0.1% formic acid in acetonitrile) and B (0.1% formic acid in water) were applied. The elution procedure was as follows: 0–8 min, 5–16% A; 8–20 min, 16–35% A; 20–30 min, 35–90% A; 30–32 min, 90% A; 32–32.1 min, 90–5% A; 32.1–40 min, 5% A. The flow rate was 0.25 mL/min, and 10 µL of each sample was injected into the system. Full scans (100–1000 m/z) were acquired using the mass analyzer. In order to better respond to most of the compounds, the optimal conditions were set as follows: spray voltage, 3.2 kV; capillary temperature, 300 °C; sheath gas pressure, 40 psi; auxiliary gas pressure, 15 arb; heater temperature, 350 °C.
The main phenolic acids were simultaneously analyzed on an HPLC system according to a previous method with some modifications [20]. The chromatographic separation system was equipped with a photodiode array (PDA) detector (Waters Co., Milford, MA, USA). A C18 column (150 mm × 4.6 mm, 5 μm particle size, Shimadzu Co., Kyoto, Japan) was used and set at 30 °C. The mobile phase consisted of 0.4% acetic acid aqueous solution (A) and acetonitrile (B): 0–40 min, 5–35% B; 40–45 min, 35–50% B; 45–50 min, 50–80% B; 50–55 min, 80%–5% B; 55–60 min, 5% B. The flow rate was 1.0 mL/min, and the injection volume was 10 μL. The PDA detector scanned ranging from 200 to 400 nm. To quantify individual phenolic acid, the monitor wavelength was set at 280 nm and compared with the concentration of known standards.

2.7. Statistical Analysis

All experiments were repeated at least three times. The results were expressed as mean ± SD. Data were analyzed by ANOVA and t-test. Significance was obtained by the Duncan method. Statistical significance was declared at p < 0.05 or p < 0.01. Pearson’s correlation tests were conducted to determine the correlation between variables. Moreover, the figures were depicted with Origin 9.0 and Photoshop CC software, and the structural formulas were drawn by KingDraw 2.2 (Qingyuan Co., Qingdao, China) software.

3. Results and Discussion

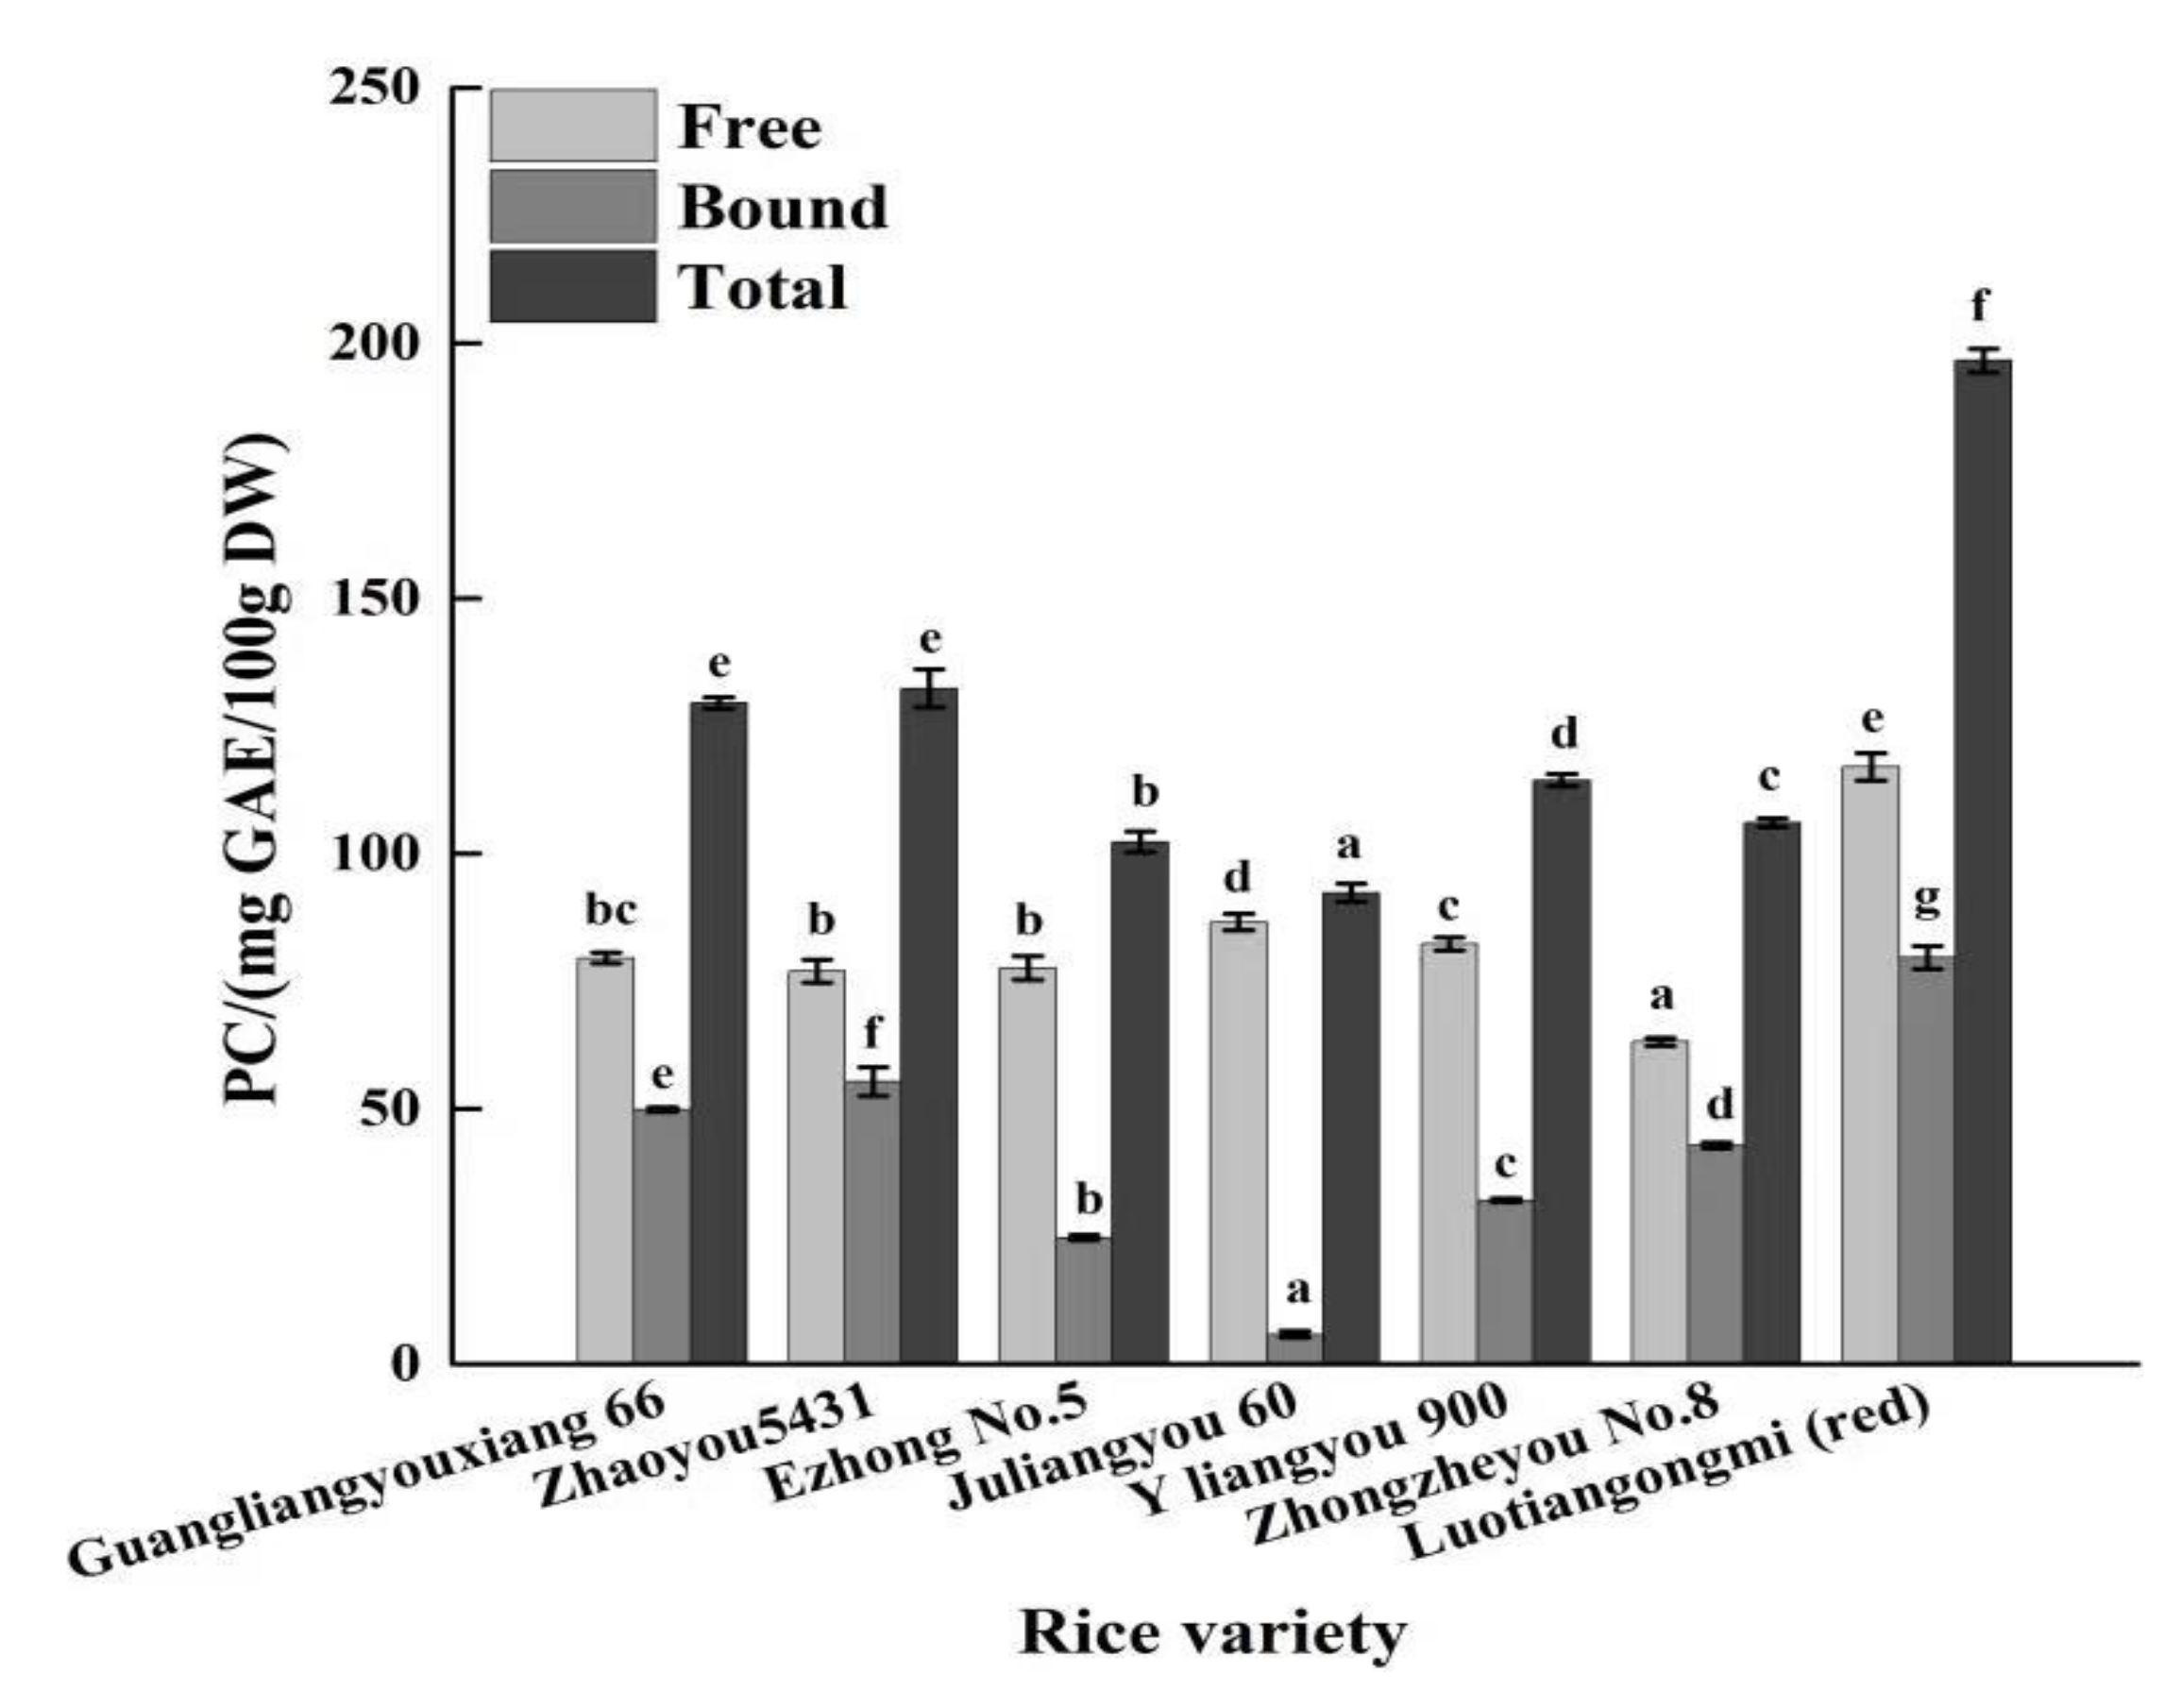
3.1. Total Phenolic Content in Different Brown Rice Varieties

In our understanding, the phenolic profiles of different cereal grains vary in type and variety. The free phenolic content (PC) of rice is lower than that of corn, but higher than those of wheat and oat. However, the bound PC of rice is the lowest compared to other grains [21,22]. Herein, the free and bound phenolic fractions in seven varieties of brown rice was compared, as shown in Figure 1. It was exhibited that the free PC of brown rice ranged from 63.15 (Zhongzheyou No.8) to 116.92 (Luotiangongmi) mg GAE/100 g DW, and the bound PC ranged from 5.77 (Juliangyou-60) to 79.62 (Luotiangongmi) mg GAE/100 g DW, with significant differences. It was obvious that the total PC in Luotiangongmi was significantly higher than the other varieties (p < 0.05), approximately 1.49~2.13 times in total quantity. The reason could be that only Luotiangongmi was the sample with a unique color in this study (Figure 2), possibly containing high amounts of anthocyanins. Moreover, the bound PC from seven varieties accounted for 6.25–41.86% of the total phenols in the extract, which is slightly lower than the result of previous literature [23]. This difference may be due to the variety of rice, the growing environment or the extraction method applied. To be mentioned, bound phenolics, also considered as insoluble phenolics, are covalently bound to cell wall structural components such as cellulose, hemicellulose, lignin and pectin, providing both physical and chemical barriers. Phenolic acids, such as hydroxybenzoic acids and hydroxycinnamic, can form ester linkages with structural carbohydrates and proteins through their carboxylic group, or generate ether linkages with lignin through their hydroxyl groups in the aromatic ring, respectively [24,25].

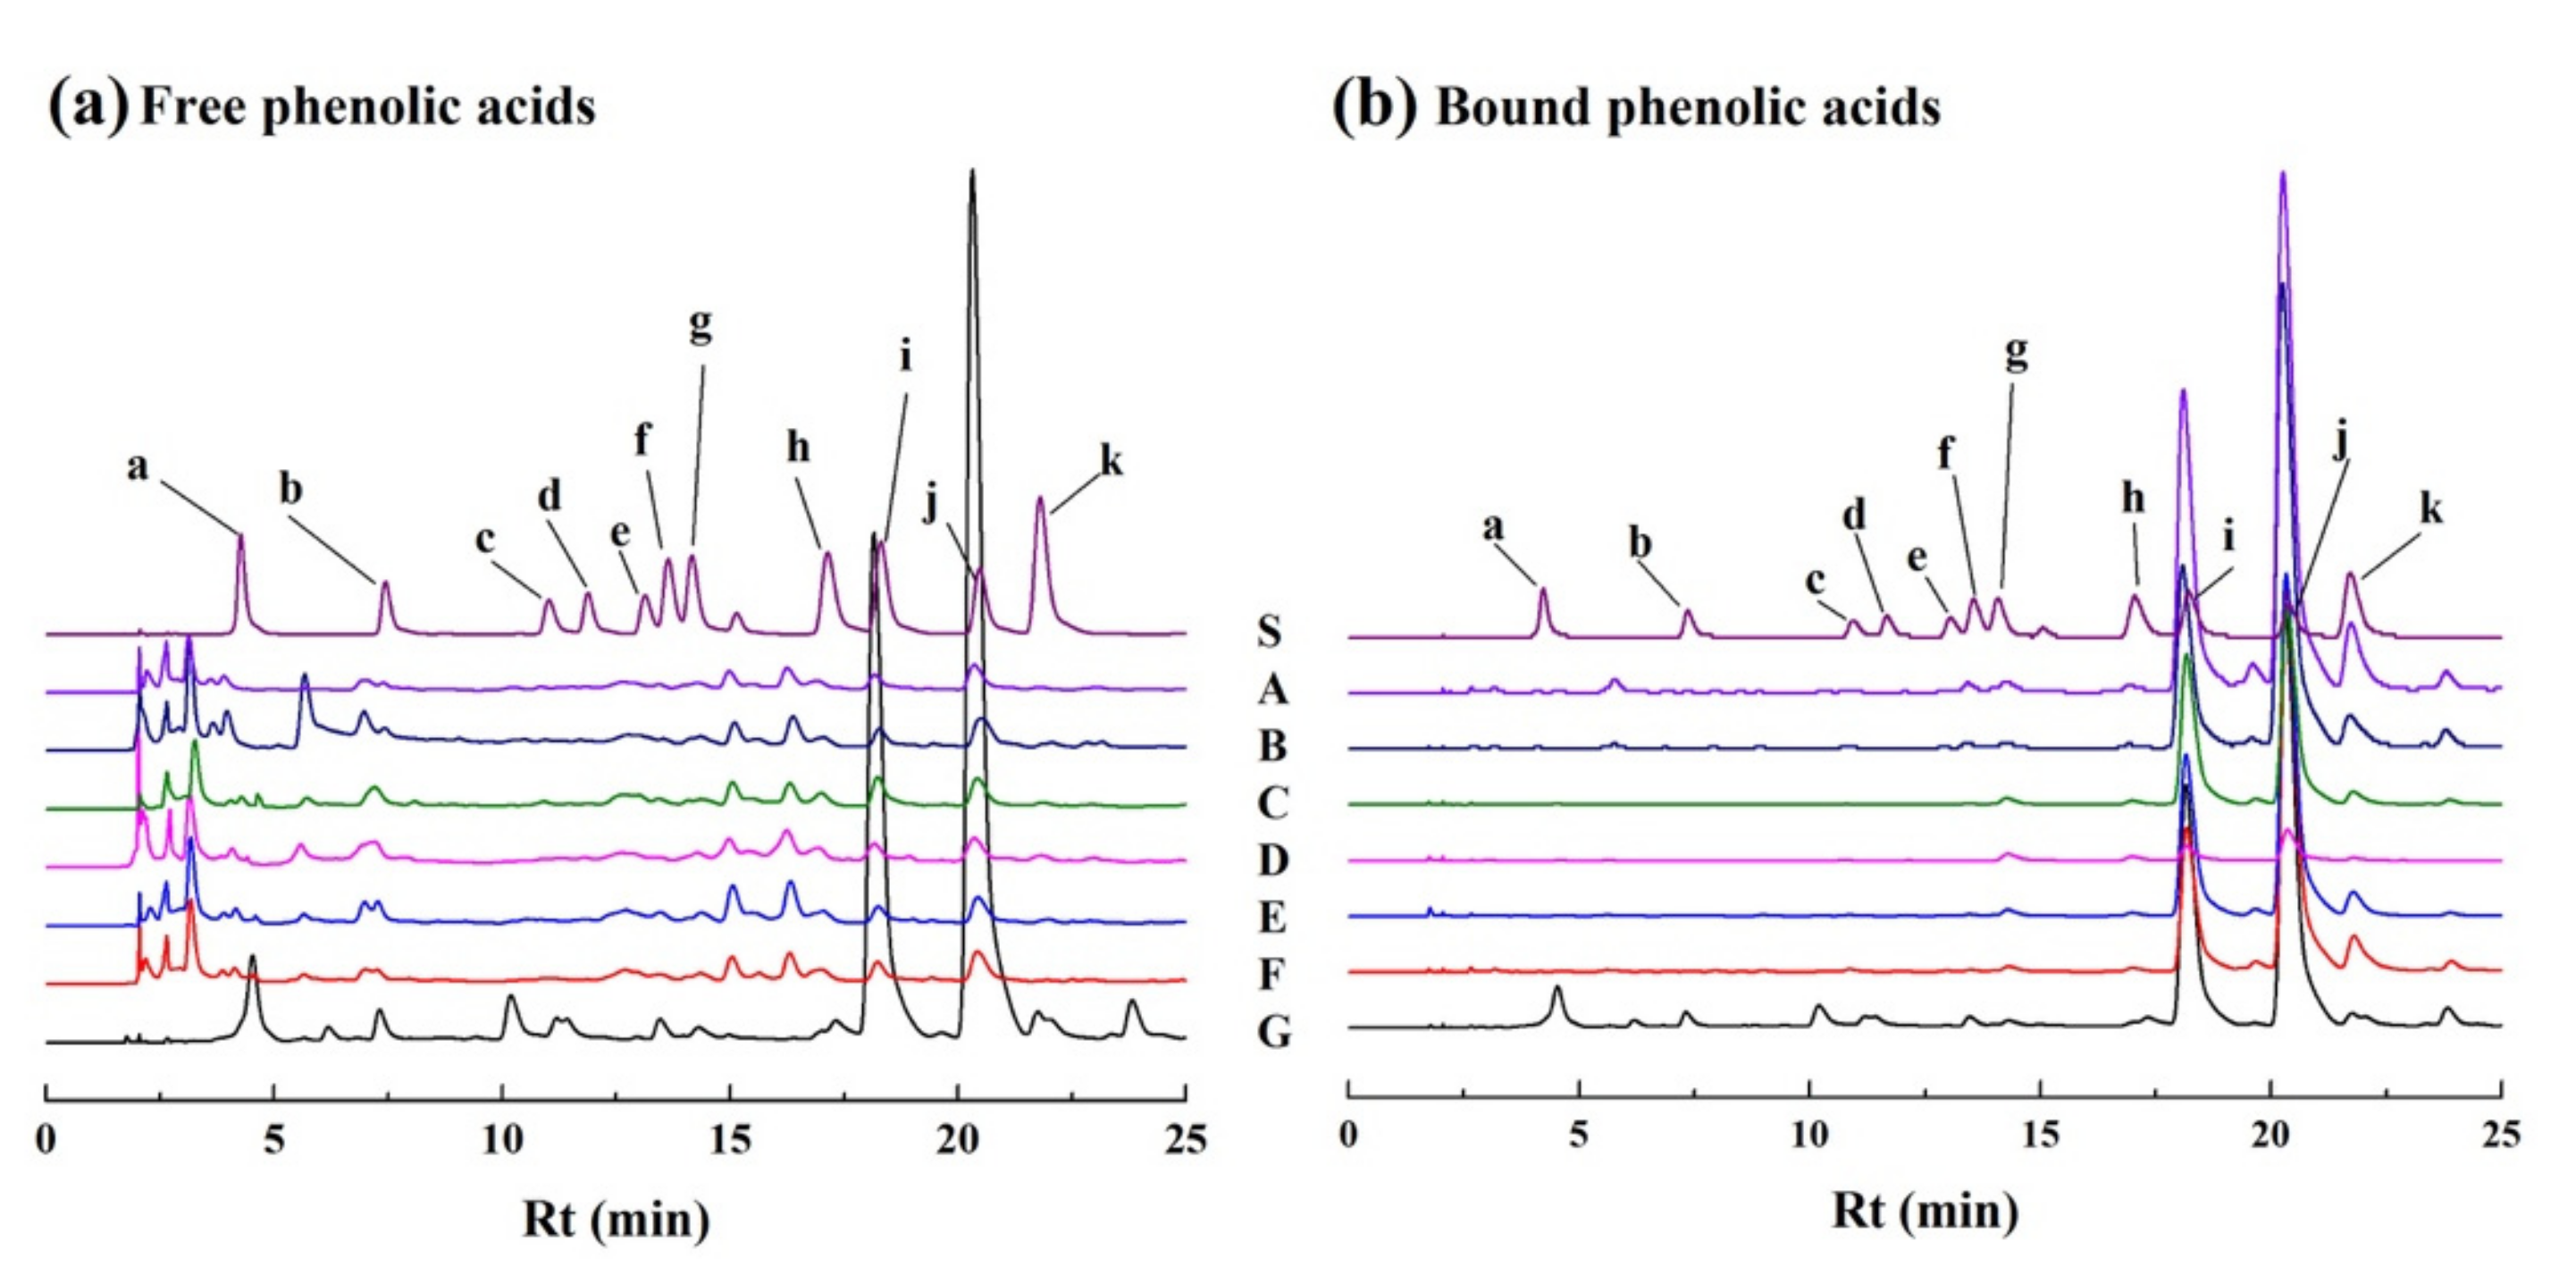
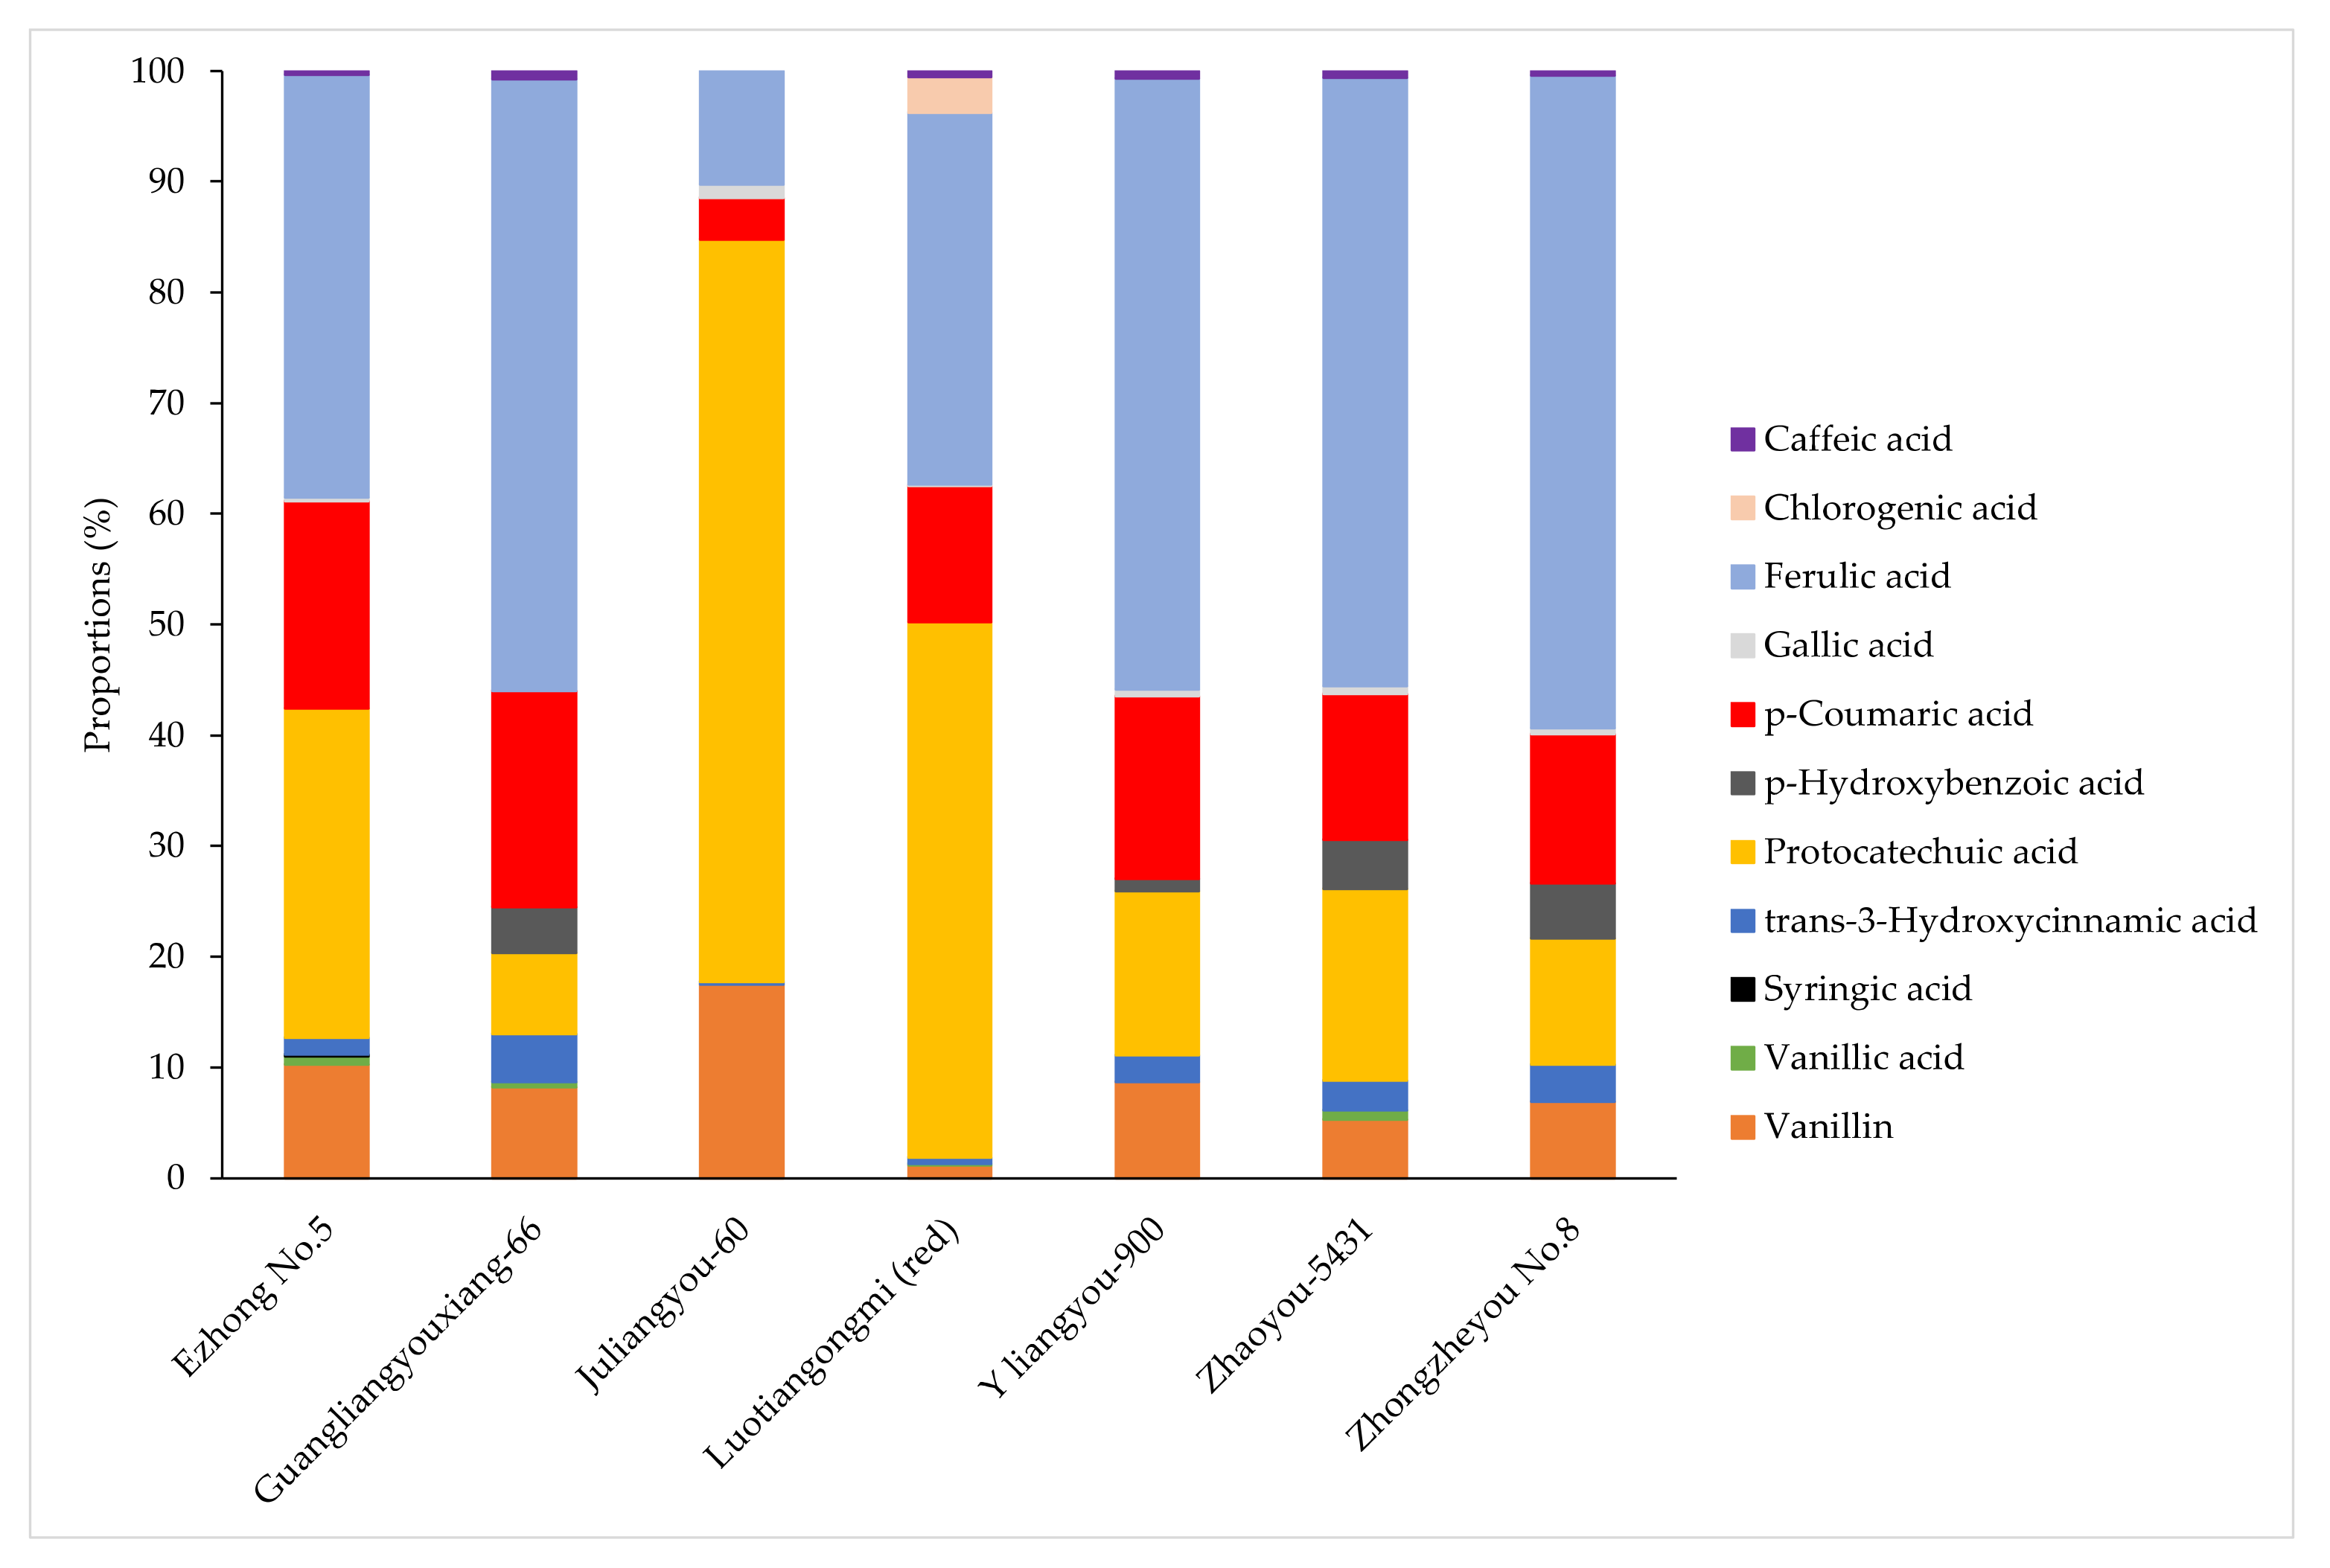
3.2. Qualitative and Quantitative Analysis of Phenolic Acids

Referring to the spectral and structural information obtained from the HPLC and LC-MS analysis, eleven phenolic acids, free and/or bound forms, were identified in different varieties of brown rice, including gallic acid, protocatechuic acid, p-hydroxybenzoic acid, chlorogenic acid, vanillic acid, caffeic acid, vanillin, syringic acid, p-coumaric acid, ferulic acid and trans-3-hydroxycinnamic acid (Table 1, Figure 3).
Based on the comparison to phenolic standards, the contents of these phenols and their corresponding percentage contribution in free and bound fractions were calculated and are presented in Table 2.
As reported previously, the phenolic profiles of both brown and milled rice were dominated by ferulic and p-coumaric acids with lower levels of gallic, vanillic, caffeic and syringic acids, which was in accordance with our study [11].
In Figure 4, the distribution of phenolic compounds in each sample was presented. It can be easily observed that vanillin, p-coumaric acid and ferulic acid, involving free and bound forms, were present in all varieties of brown rice. However, the distribution of other phenols in the extract varied, depending on the variety and form. Gallic acid was observed in six varieties of rice except for Guangliangyouxiang-66, ranging from 1.4 (Ezhong No.5) to 4.7 (Zhaoyou 5431) μg/g DW in free forms. Free protocatechuic acid was detected in all varieties, with contents ranging from 51.3 (Guangliangyouxiang-66) to 291.0 (Luotiangongmi) μg/g DW but was only found in the bound form in the Luotiangongmi variety, with a content of 274.0 μg/g DW. Free p-hydroxybenzoic acid was present in Y liangyou-900 (5.4 μg/g DW), while its bound form was more abundant in Guangliangyouxiang-66, Zhaoyou 5431 and Zhongzheyou No.8, at 29.2, 28.2 and 25.0 μg/g DW, respectively. Furthermore, vanillic acid was detected in Ezhong No.5 (2.9 μg/g DW), Luotiangongmi (1.7 μg/g DW) and Zhaoyou-5431 (3.8 μg/g DW) in free forms, but its bound form was also found in Guangliangyouxiang-66 (3.4 μg/g DW). Caffeic acid existed in all varieties except Juliangyou-60 and was detected in Ezhong No.5 only in free form (1.4 μg/g DW), but in Guangliangyouxiang-66, only in bound form (5.2 μg/g DW). It is worth mentioning that some phenols were typically present in specific varieties, which can be assigned as characteristic compounds in brown rice. For example, the free and bound forms of chlorogenic acid were only found in Luotiangongmi, at 20.8 and 16.6 μg/g DW. Syringic acid only existed in the free fraction of Ezhong No.5 (0.6 μg/g DW).
In summary, Luotiangongmi (red rice) possessed the highest level of phenolic compounds, in which protocatechuic acid, ferulic acid and p-coumaric acid made up 50.1%, 21.3% and 24.4% of total phenols, respectively. Moreover, bound phenols play a dominant role in the phenolic compounds identified in Guangliangyouxiang-66 and Luotiangongmi. As far as vanillin was concerned, its bound fraction of Guangliangyouxiang-66 (44.3 μg/g DW) was significantly higher than other varieties (p < 0.05). In terms of p-coumaric acid, its bound form accounted for more than 90% of total phenols in all varieties, except Juliangyou-60. In the same situation, the ferulic acid presented in brown rice was mostly conjugated. According to previous research, apart from being directly connected to the cell wall, ferulic acid was also crosslinking arabinoxylan with a form of dehydrodimer as a structural component in the cell walls, playing an important role in enhancing the mechanical properties [26].

4. Conclusions

In order to compare the phenolic profile of different brown rice, a series of qualitative and quantitative analyses were carried out. The results indicated that the free, bound and total PC of red rice (Luotiangongmi) were significantly higher than those of brown rice (Guangliangyouxiang-66, Y liangyou-900, Zhaoyou-5431, Juliangyou-60, Zhongzheyou No.8 and Ezhong No.5). A similar trend was also found in the total FC of Luotiangongmi. Moreover, eleven kinds of phenolic compounds, including gallic acid, protocatechuic acid, p-hydroxybenzoic acid, chlorogenic acid, vanillin acid, caffeic acid, syringic acid, vanillin, p-coumaric acid, ferulic acid and trans-3-hydroxycinnamic acid, were determined in brown rice, in which p-coumaric acid and ferulic acid were comparably dominant, accounting for over 14.3% and 44.9% in total. Several phenols, such as chlorogenic acid and syringic acid, were specifically present in some varieties. In addition, the levels of bound phenolic acids were much higher than the free phenolic acids in the extracts. This study will contribute to further understanding the distribution of polyphenols in brown rice and accelerate the comprehensive utilization of red rice.

Author Contributions

Conceptualization, Y.S. and S.L.; methodology, Y.S. and S.L.; investigation, H.X., X.M., J.S., S.C. and T.X.; data curation, H.X., X.M., J.S., J.M.C., C.C., Z.Z. and F.J.B.; writing—original draft preparation, S.L. and H.X.; writing—review and editing, Y.S., S.L., H.X., J.M.C., C.C. and F.J.B. All authors have read and agreed to the published version of the manuscript.

Funding

This research is supported by the project of Outstanding young and middle-aged science and technology innovation team in Hubei Province (T2020012). The support of the Key Laboratory of Deep Processing of Major Grain and Oil (Ministry of Education, 2018JYBQGDKFA03) is also appreciated. Thanks to the funding from the Hubei Province Grain Science and Technology Project (2021KJCX-06). Juan Manuel Castagnini is beneficiary of the grant (ZA21-028) for the requalification of the Spanish university system from the Ministry of Universities of the Government of Spain, modality “Maria Zambrano”, financed by the European Union, NextGeneration EU through the project “Extraction of bioactive compounds from food matrices using innovative and sustainable technologies (EXTRABIO)”.

Institutional Review Board Statement

Not applicable.

Informed Consent Statement

Not applicable.

Data Availability Statement

The data presented in this study are available in article.

Conflicts of Interest

The authors declare that they have no conflict of interest.

References

  1. Kumar, M.; Tomar, M.; Amarowicz, R.; Saurabh, V.; Nair, M.S.; Maheshwari, C.; Sasi, M.; Prajapati, U.; Hasan, M.; Singh, S.; et al. Guava (Psidium guajava L.) Leaves: Nutritional Composition. Foods 2021, 10, 752. [Google Scholar] [CrossRef] [PubMed]
  2. Pedrosa, M.M.; Guillamón, E.; Arribas, C. Autoclaved and Extruded Legumes as a Source of Bioactive Phytochemicals: A Review. Foods 2021, 10, 379. [Google Scholar] [CrossRef] [PubMed]
  3. Fardet, A.; Boirie, Y. Associations between Food and Beverage Groups and Major Diet-Related Chronic Diseases: An Exhaustive Review of Pooled/Meta-Analyses and Systematic Reviews. Nutr. Rev. 2014, 72, 741–762. [Google Scholar] [CrossRef] [PubMed]
  4. Von Ruesten, A.; Feller, S.; Bergmann, M.M.; Boeing, H. Diet and Risk of Chronic Diseases: Results from the First 8 Years of Follow-up in the EPIC-Potsdam Study. Eur. J. Clin. Nutr. 2013, 67, 412–419. [Google Scholar] [CrossRef]
  5. Panlasigui, L.N.; Thompson, L.U. Blood Glucose Lowering Effects of Brown Rice in Normal and Diabetic Subjects. Int. J. Food Sci. Nutr. 2006, 57, 151–158. [Google Scholar] [CrossRef]
  6. Niu, Y.; Gao, B.; Slavin, M.; Zhang, X.; Yang, F.; Bao, J.; Shi, H.; Xie, Z.; Yu, L. (Lucy) Phytochemical Compositions, and Antioxidant and Anti-Inflammatory Properties of Twenty-Two Red Rice Samples Grown in Zhejiang. LWT—Food Sci. Technol. 2013, 54, 521–527. [Google Scholar] [CrossRef]
  7. Dinelli, G.; Segura-Carretero, A.; Di Silvestro, R.; Marotti, I.; Arráez-Román, D.; Benedettelli, S.; Ghiselli, L.; Fernadez-Gutierrez, A. Profiles of Phenolic Compounds in Modern and Old Common Wheat Varieties Determined by Liquid Chromatography Coupled with Time-of-Flight Mass Spectrometry. J. Chromatogr. A 2011, 1218, 7670–7681. [Google Scholar] [CrossRef]
  8. Guo, W.; Beta, T. Phenolic Acid Composition and Antioxidant Potential of Insoluble and Soluble Dietary Fibre Extracts Derived from Select Whole-Grain Cereals. Food Res. Int. 2013, 51, 518–525. [Google Scholar] [CrossRef]
  9. Ravisankar, S.; Queiroz, V.A.V.; Awika, J.M. Rye Flavonoids–Structural Profile of the Flavones in Diverse Varieties and Effect of Fermentation and Heat on Their Structure and Antioxidant Properties. Food Chem. 2020, 324, 126871. [Google Scholar] [CrossRef]
  10. Gunaratne, A.; Wu, K.; Li, D.; Bentota, A.; Corke, H.; Cai, Y.Z. Antioxidant Activity and Nutritional Quality of Traditional Red-Grained Rice Varieties Containing Proanthocyanidins. Food Chem. 2013, 138, 1153–1161. [Google Scholar] [CrossRef]
  11. Shao, Y.; Xu, F.; Sun, X.; Bao, J.; Beta, T. Identification and Quantification of Phenolic Acids and Anthocyanins as Antioxidants in Bran, Embryo and Endosperm of White, Red and Black Rice Kernels (Oryza sativa L.). J. Cereal Sci. 2014, 59, 211–218. [Google Scholar] [CrossRef]
  12. Saikia, S.; Dutta, H.; Saikia, D.; Mahanta, C.L. Quality Characterisation and Estimation of Phytochemicals Content and Antioxidant Capacity of Aromatic Pigmented and Non-Pigmented Rice Varieties. Food Res. Int. 2012, 46, 334–340. [Google Scholar] [CrossRef]
  13. Shao, Y.; Xu, F.; Sun, X.; Bao, J.; Beta, T. Phenolic Acids, Anthocyanins, and Antioxidant Capacity in Rice (Oryza Sativa L.) Grains at Four Stages of Development after Flowering. Food Chem. 2014, 143, 90–96. [Google Scholar] [CrossRef] [PubMed]
  14. Bordiga, M.; Gomez-Alonso, S.; Locatelli, M.; Travaglia, F.; Coïsson, J.D.; Hermosin-Gutierrez, I.; Arlorio, M. Phenolics Characterization and Antioxidant Activity of Six Different Pigmented Oryza sativa L. Cultivars Grown in Piedmont (Italy). Food Res. Int. 2014, 65, 282–290. [Google Scholar] [CrossRef]
  15. Zhao, G.; Zhang, R.; Dong, L.; Huang, F.; Liu, L.; Deng, Y.; Ma, Y.; Zhang, Y.; Wei, Z.; Xiao, J.; et al. A Comparison of the Chemical Composition, In Vitro Bioaccessibility and Antioxidant Activity of Phenolic Compounds from Rice Bran and Its Dietary Fibres. Molecules 2018, 23, 202. [Google Scholar] [CrossRef] [Green Version]
  16. Ti, H.; Li, Q.; Zhang, R.; Zhang, M.; Deng, Y.; Wei, Z.; Chi, J.; Zhang, Y. Free and Bound Phenolic Profiles and Antioxidant Activity of Milled Fractions of Different Indica Rice Varieties Cultivated in Southern China. Food Chem. 2014, 159, 166–174. [Google Scholar] [CrossRef]
  17. Chen, Z.; Yu, L.; Wang, X.; Gu, Z.; Beta, T. Changes of Phenolic Profiles and Antioxidant Activity in Canaryseed (Phalaris canariensis L.) during Germination. Food Chem. 2016, 194, 608–618. [Google Scholar] [CrossRef]
  18. Chandrasekara, A.; Shahidi, F. Antiproliferative Potential and DNA Scission Inhibitory Activity of Phenolics from Whole Millet Grains. J. Funct. Foods 2011, 3, 159–170. [Google Scholar] [CrossRef]
  19. Xiong, Y.; Zhang, P.; Dorothy, R.; Shen, S.; Johnson, S.; Fang, Z. Comprehensive Profiling of Phenolic Compounds by HPLC-DAD-ESI-QTOF-MS / MS to Reveal Their Location and Form of Presence in Different Sorghum Grain Genotypes. Food Res. Int. 2020, 137, 109671. [Google Scholar] [CrossRef]
  20. Qiu, Y.; Liu, Q.; Beta, T. Antioxidant Properties of Commercial Wild Rice and Analysis of Soluble and Insoluble Phenolic Acids. Food Chem. 2010, 121, 140–147. [Google Scholar] [CrossRef]
  21. Adom, K.K.; Liu, R.H. Antioxidant Activity of Grains. J. Agric. Food Chem. 2002, 50, 6182–6187. [Google Scholar] [CrossRef] [PubMed]
  22. Van Hung, P. Phenolic Compounds of Cereals and Their Antioxidant Capacity. Crit. Rev. Food Sci. Nutr. 2016, 56, 25–35. [Google Scholar] [CrossRef] [PubMed]
  23. Gao, Y.; Guo, X.; Liu, Y.; Zhang, M.; Zhang, R.; Abbasi, A.M.; You, L.; Li, T.; Liu, R.H. Comparative Assessment of Phytochemical Profile, Antioxidant Capacity and Anti-Proliferative Activity in Different Varieties of Brown Rice (Oryza sativa L.). Lwt 2018, 96, 19–25. [Google Scholar] [CrossRef]
  24. Acosta-Estrada, B.A.; Gutiérrez-Uribe, J.A.; Serna-Saldívar, S.O. Bound Phenolics in Foods, a Review. Food Chem. 2014, 152, 46–55. [Google Scholar] [CrossRef] [PubMed]
  25. Zhang, B.; Zhang, Y.; Li, H.; Deng, Z.; Tsao, R. A Review on Insoluble-Bound Phenolics in Plant-Based Food Matrix and Their Contribution to Human Health with Future Perspectives. Trends Food Sci. Technol. 2020, 105, 347–362. [Google Scholar] [CrossRef]
  26. Renger, A.; Steinhart, H. Ferulic Acid Dehydrodimers as Structural Elements in Cereal Dietary Fibre. Eur. Food Res. Technol. 2000, 211, 422–428. [Google Scholar] [CrossRef]
Figure 1. Free and bound PC in seven different varieties of brown rice. Results are expressed as mean ± SD. Percent contribution to total content is presented in parentheses. Different letters indicate significant differences among varieties for each fraction (free/bound/total) (p < 0.05). DW, dry weight of sample.
Foods 11 01552 g001
Figure 2. Appearance pictures of different varieties of brown rice cultivated in Hubei province.
Foods 11 01552 g002
Figure 3. HPLC chromatograms (280 nm) of free phenolic compounds (a) and bound phenolic compounds (b) extracted from seven varieties of brown rice. (S, standard mixture of phenolic acids; A, Guangliangyouxiang-66; B, Zhaoyou-5431; C, Ezhong No.5; D, Juliangyou-60; E, Y liangyou-900; F, Zhongzheyou No.8; G, Luotiangongmi; a, Gallic acid; b, Protocatechuic acid; c, p-Hydroxybenzoic acid; d, Chlorogenic acid; e, Vanillic acid; f, Caffeic acid; g, Syringic acid; h, Vanillin; i, p-Coumaric acid; j, Ferulic acid; k, trans-3-Hydroxycinnamic acid).
Foods 11 01552 g003
Figure 4. Percentual distribution of phenolics compounds extracted from seven varieties of brown rice.
Foods 11 01552 g004
Table 1. Identification of main phenolic compounds in brown rice with structural information.
Phenolic CompoundsMolecular Formula Rt (min)[M-H](m/z)Main Fragment Ions (m/z)Structure
Gallic acidC7H6O52.22169.0132125.0232 Foods 11 01552 i001
Protocatechuic acidC7H6O43.98153.0182109.0283 Foods 11 01552 i002
p-Hydroxybenzoic acidC7H6O35.96137.023393.0333 Foods 11 01552 i003
Chlorogenic acidC16H18O96.74353.0879191.0555 Foods 11 01552 i004
Vanillic acidC8H8O47.26167.0342152.0104
123.0439
108.0204
Foods 11 01552 i005
Caffeic acidC9H8O47.52179.0342135.0441 Foods 11 01552 i006
Syringic acidC9H10O58.41197.0447182.0211
166.9976
152.8930
Foods 11 01552 i007
VanillinC8H8O69.26151.0390136.0155 Foods 11 01552 i008
p-Coumaric acidC9H8O310.20163.0391119.0490 Foods 11 01552 i009
Ferulic acidC10H10O411.28193.0502178.0263
149.0342
Foods 11 01552 i010
trans-3-Hydroxycinnamic acidC9H8O312.21163.0391119.0490 Foods 11 01552 i011
Table 2. Quantitative analysis of identified phenolic compounds in seven varieties of brown rice *.
Phenolic AcidsSamplesPhenolic Acid Content (μg/g DW)
FreeBoundTotal
Gallic acidGuangliangyouxiang-66NDNDND
Zhaoyou-54314.70 ± 1.60 bND4.70 ± 1.60 b
Ezhong No.51.38 ± 0.04 aND1.38 ± 0.04 a
Juliangyou-603.14 ± 1.17 a,bND3.14 ± 1.17 a,b
Y liangyou-9002.83 ± 1.14 a,bND2.83 ± 1.14 a,b
Zhongzheyou No.82.77 ± 0.91 aND2.77 ± 0.91 a
Luotiangongmi (red)1.62 ± 0.07 aND1.62 ± 0.07 a
Protocatechuic acidGuangliangyouxiang-6651.3 ± 24.8 aND51.3 ± 24.80 a
Zhaoyou-5431110 ± 4.45 b,cND110 ± 4.45 b
Ezhong No.5113 ± 36.71 cND113 ± 36.71 b
Juliangyou-60165 ± 21.58 dND165 ± 21.58 c
Y liangyou-90068.2 ± 1.94 a,bND68.2 ± 1.94 a,b
Zhongzheyou No.857.4 ± 35.15 aND57.4 ± 35.15 a
Luotiangongmi (red)291 ± 21.04 e274 ± 15.69566 ± 28.57 d
p-Hydroxybenzoic acidGuangliangyouxiang-66ND29.2 ± 11.35 a29.2 ± 11.35 b
Zhaoyou-5431ND28.2 ± 8.01 a28.2 ± 8.01 b
Ezhong No.5NDNDND
Juliangyou-60NDNDND
Y liangyou-9005.35 ± 0.29ND5.35 ± 0.29 a
Zhongzheyou No.8ND25.0 ± 4.73 a25.0 ± 4.73 b
Luotiangongmi (red)NDNDND
Chlorogenic acidGuangliangyouxiang-66NDNDND
Zhaoyou-5431NDNDND
Ezhong No.5NDNDND
Juliangyou-60NDNDND
Y liangyou-900NDNDND
Zhongzheyou No.8NDNDND
Luotiangongmi (red)20.8 ± 2.8616.6 ± 3.3437.3 ± 6.16
Vanillic acidGuangliangyouxiang-66ND3.37 ± 2.33 a3.37 ± 2.33 a,b
Zhaoyou-54313.75 ± 1.02 b1.64 ± 0.17 a5.39 ± 1.17 b
Ezhong No.52.87 ± 0.30 a,bND2.87 ± 0.30 a,b
Juliangyou-60NDNDND
Y liangyou-900NDNDND
Zhongzheyou No.8NDNDND
Luotiangongmi (red)1.65 ± 0.24 aND1.65 ± 0.24 a
Caffeic acidGuangliangyouxiang-66ND5.16 ± 1.45 c5.16 ± 1.45 d
Zhaoyou-54310.70 ± 0.50 a3.24 ± 0.84 b3.95 ± 0.75 c,d
Ezhong No.51.37 ± 0.69 a,bND1.37 ± 0.69 a
Juliangyou-60NDNDND
Y liangyou-9001.67 ± 0.26 b1.54 ± 1.12 a3.21 ± 0.88 b,c
Zhongzheyou No.80.99 ± 0.30 a,b1.20 ± 0.34 a2.19 ± 0.09 a,b
Luotiangongmi (red)0.78 ± 0.16 a5.91 ± 0.30 c6.69 ± 0.42 e
Syringic acidGuangliangyouxiang-66NDNDND
Zhaoyou-5431NDNDND
Ezhong No.50.56 ± 0.11ND0.56 ± 0.11
Juliangyou-60NDNDND
Y liangyou-900NDNDND
Zhongzheyou No.8NDNDND
Luotiangongmi (red)NDNDND
VanillinGuangliangyouxiang-6613.2 ± 3.21 a,b44.3 ± 16.22 b57.5 ± 19.43 c
Zhaoyou-54319.01 ± 3.79 a24.6 ± 9.94 a33.6 ± 6.80 a,b
Ezhong No.518.3 ± 6.88 a,b20.6 ± 5.39 a38.9 ± 12.27 b,c
Juliangyou-6021.7 ± 8.21 b21.2 ± 5.02 a42.9 ± 13.00 b,c
Y liangyou-90018.1 ± 4.04 a,b22.1 ± 12.15 a40.2 ± 16.16 b,c
Zhongzheyou No.813.4 ± 7.83 a,b21.2 ± 5.02 a34.6 ± 3.34 a,b,c
Luotiangongmi (red)13.4 ± 1.14 a,bND13.4 ± 1.14 a
p-Coumaric acidGuangliangyouxiang-661.49 ± 0.02 a135 ± 2.46 e137 ± 2.46 e
Zhaoyou-54311.57 ± 0.34 a82.4 ± 1.95 d83.9 ± 2.13 d
Ezhong No.53.73 ± 0.94 b67.3 ± 0.40 b71.1 ± 1.33 b
Juliangyou-602.40 ± 0.72 a6.72 ± 0.71 a9.12 ± 1.43 a
Y liangyou-9002.11 ± 0.64 a73.9 ± 2.98 c76.0 ± 3.05 c
Zhongzheyou No.82.04 ± 0.64 a65.8 ± 3.68 b67.8 ± 3.55 b
Luotiangongmi (red)1.49 ± 0.46 a142 ± 3.97 f144 ± 3.92 f
Ferulic acidGuangliangyouxiang-664.32 ± 0.73 b,c384 ± 11.76 f388 ± 11.08 f
Zhaoyou-54315.71 ± 0.24 d345 ± 12.11 e350 ± 12.21 e
Ezhong No.55.53 ± 0.87 c,d139 ± 0.78 b145 ± 0.20 b
Juliangyou-604.55 ± 1.02 b,c,d20.6 ± 0.23 a25.1 ± 0.79 a
Y liangyou-9004.21 ± 0.26 b251 ± 11.82 c255 ± 11.83 c
Zhongzheyou No.85.32 ± 0.17 b,c,d291 ± 18.11 d296 ± 11.28 d
Luotiangongmi (red)2.47 ± 0.78 a392 ± 9.21 f394 ± 9.87 f
trans-3-Hydroxycinnamic acidGuangliangyouxiang-660.18 ± 0.07 a,b30.3 ± 1.89 d30.5 ± 1.89 e
Zhaoyou-54310.44 ± 0.02 d16.9 ± 1.63 c17.3 ± 1.62 d
Ezhong No.50.33 ± 0.08 c,d5.61 ± 1.36 a5.94 ± 1.36 b
Juliangyou-600.58 ± 0.15 eND0.58 ± 0.15 a
Y liangyou-9000.29 ± 0.01 b,c11.0 ± 2.01 b11.2 ± 2.01 c
Zhongzheyou No.80.08 ± 0.01 a16.7 ± 1.02 c16.8 ± 1.02 d
Luotiangongmi (red)0.40 ± 0.03 c,d6.75 ± 3.38 a7.14 ± 3.38 b
* Results are expressed as mean ± SD. Different letters indicate significant differences among varieties for each phenolic acid and fraction (free/bound/total) (p < 0.05). DW, dry weight of sample. ND, not detected.
Publisher’s Note: MDPI stays neutral with regard to jurisdictional claims in published maps and institutional affiliations.

