
Detecting Dye-Contaminated Vegetables Using Low-Field NMR Relaxometry

 , , , and
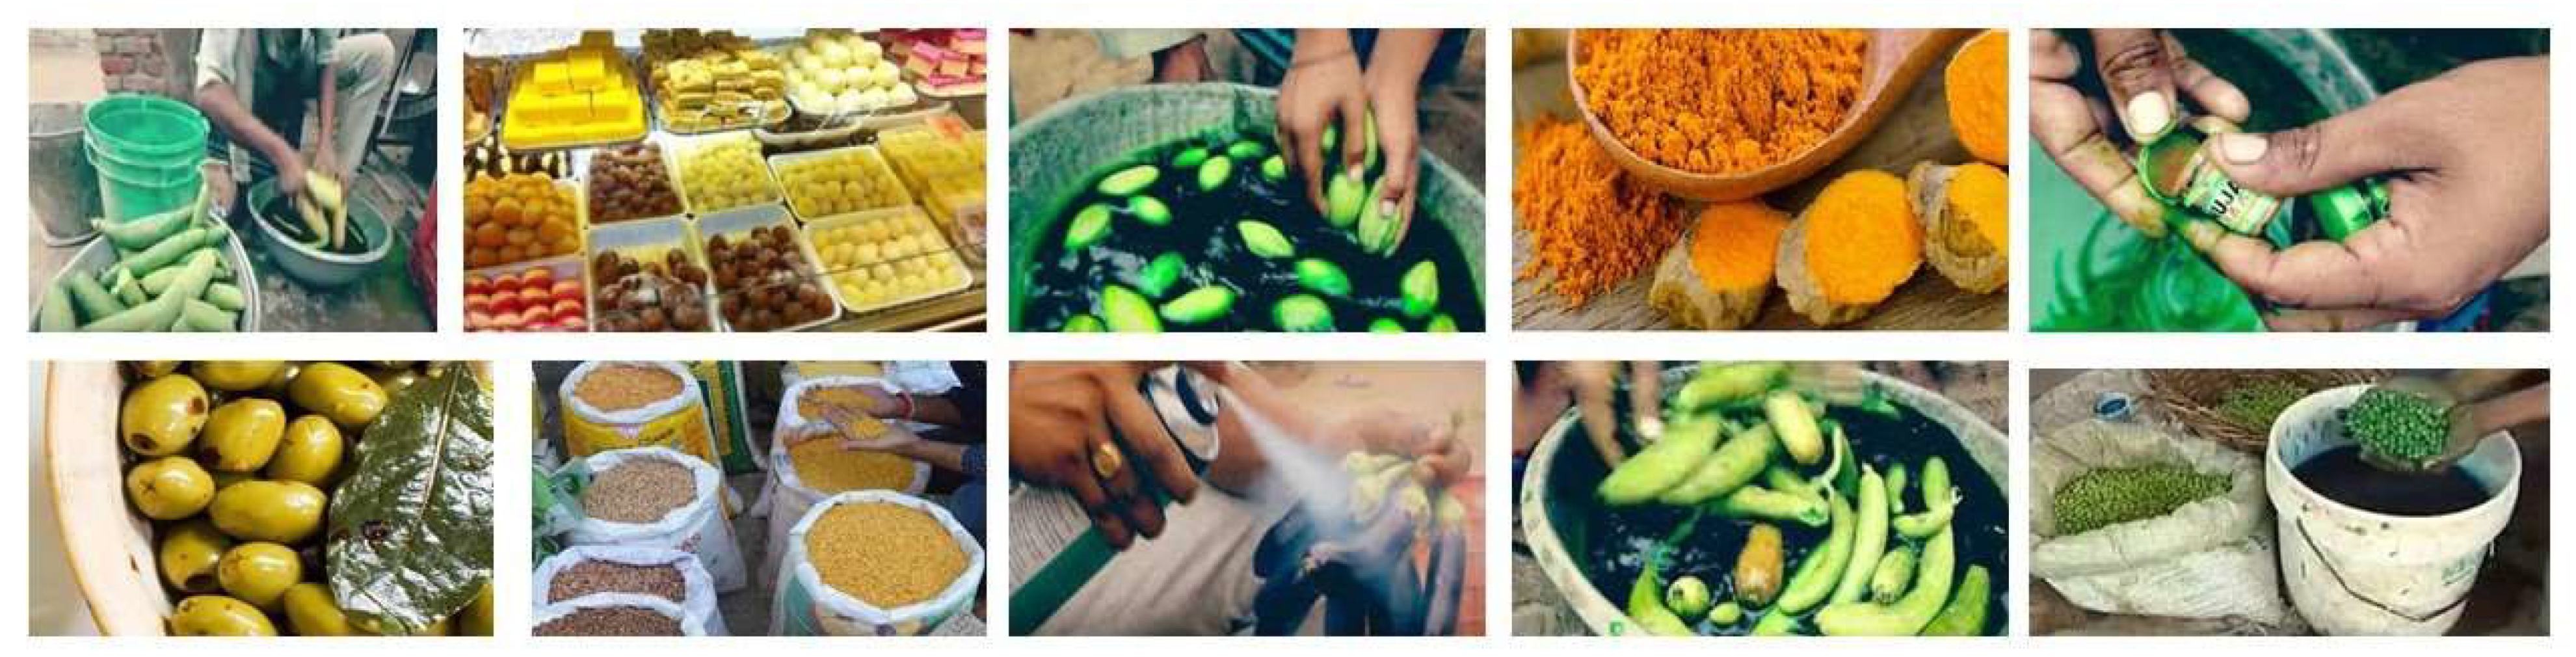
Abstract
:1. Introduction
2. Materials and Methods
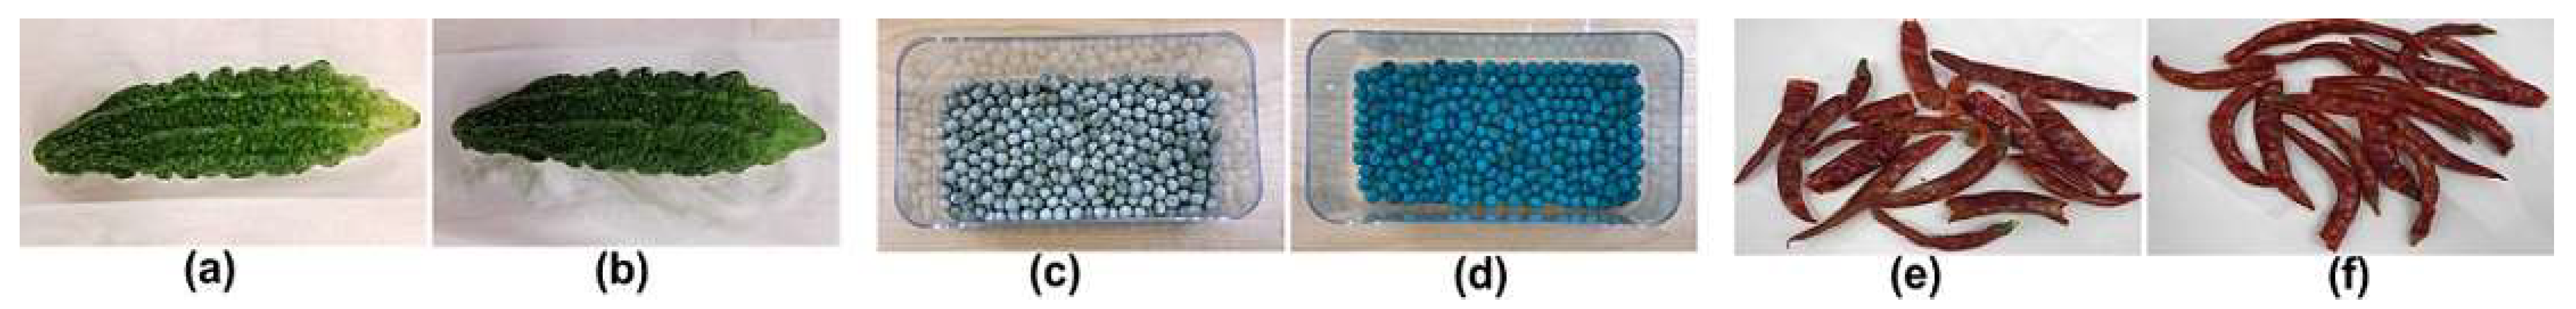
2.1. Dyes and Vegetables
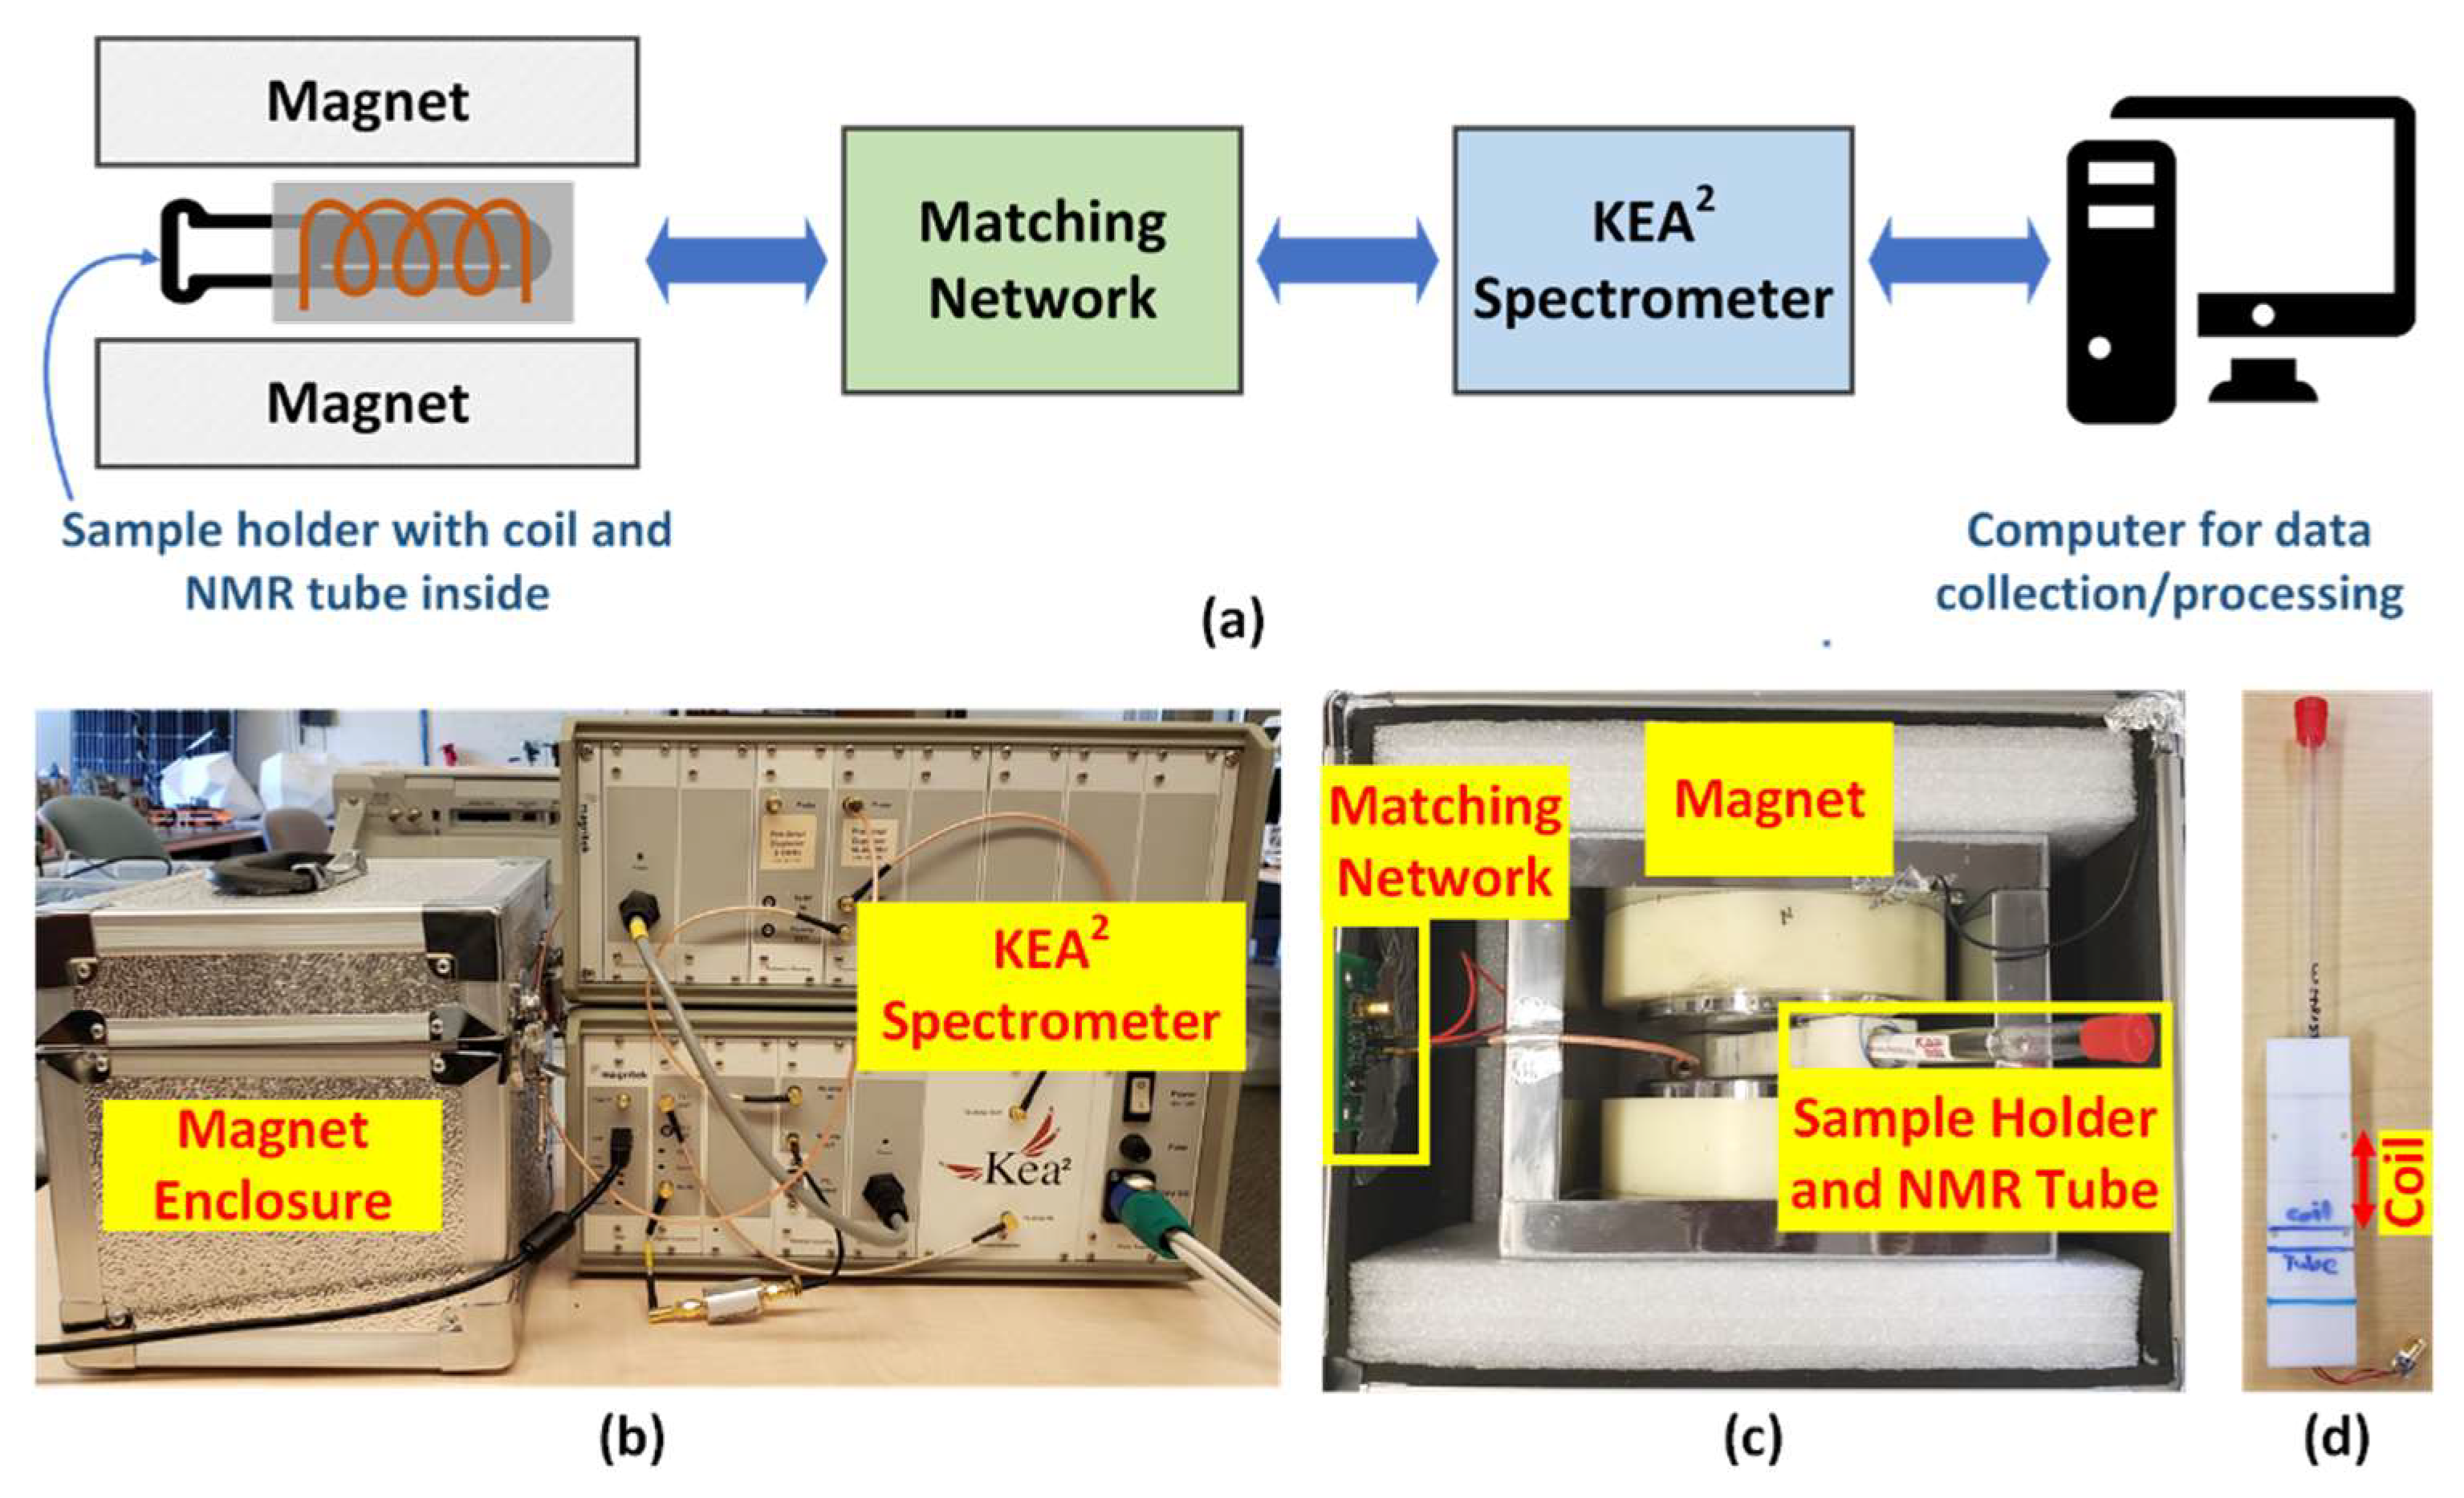
2.2. NMR Relaxometry Instrumentation
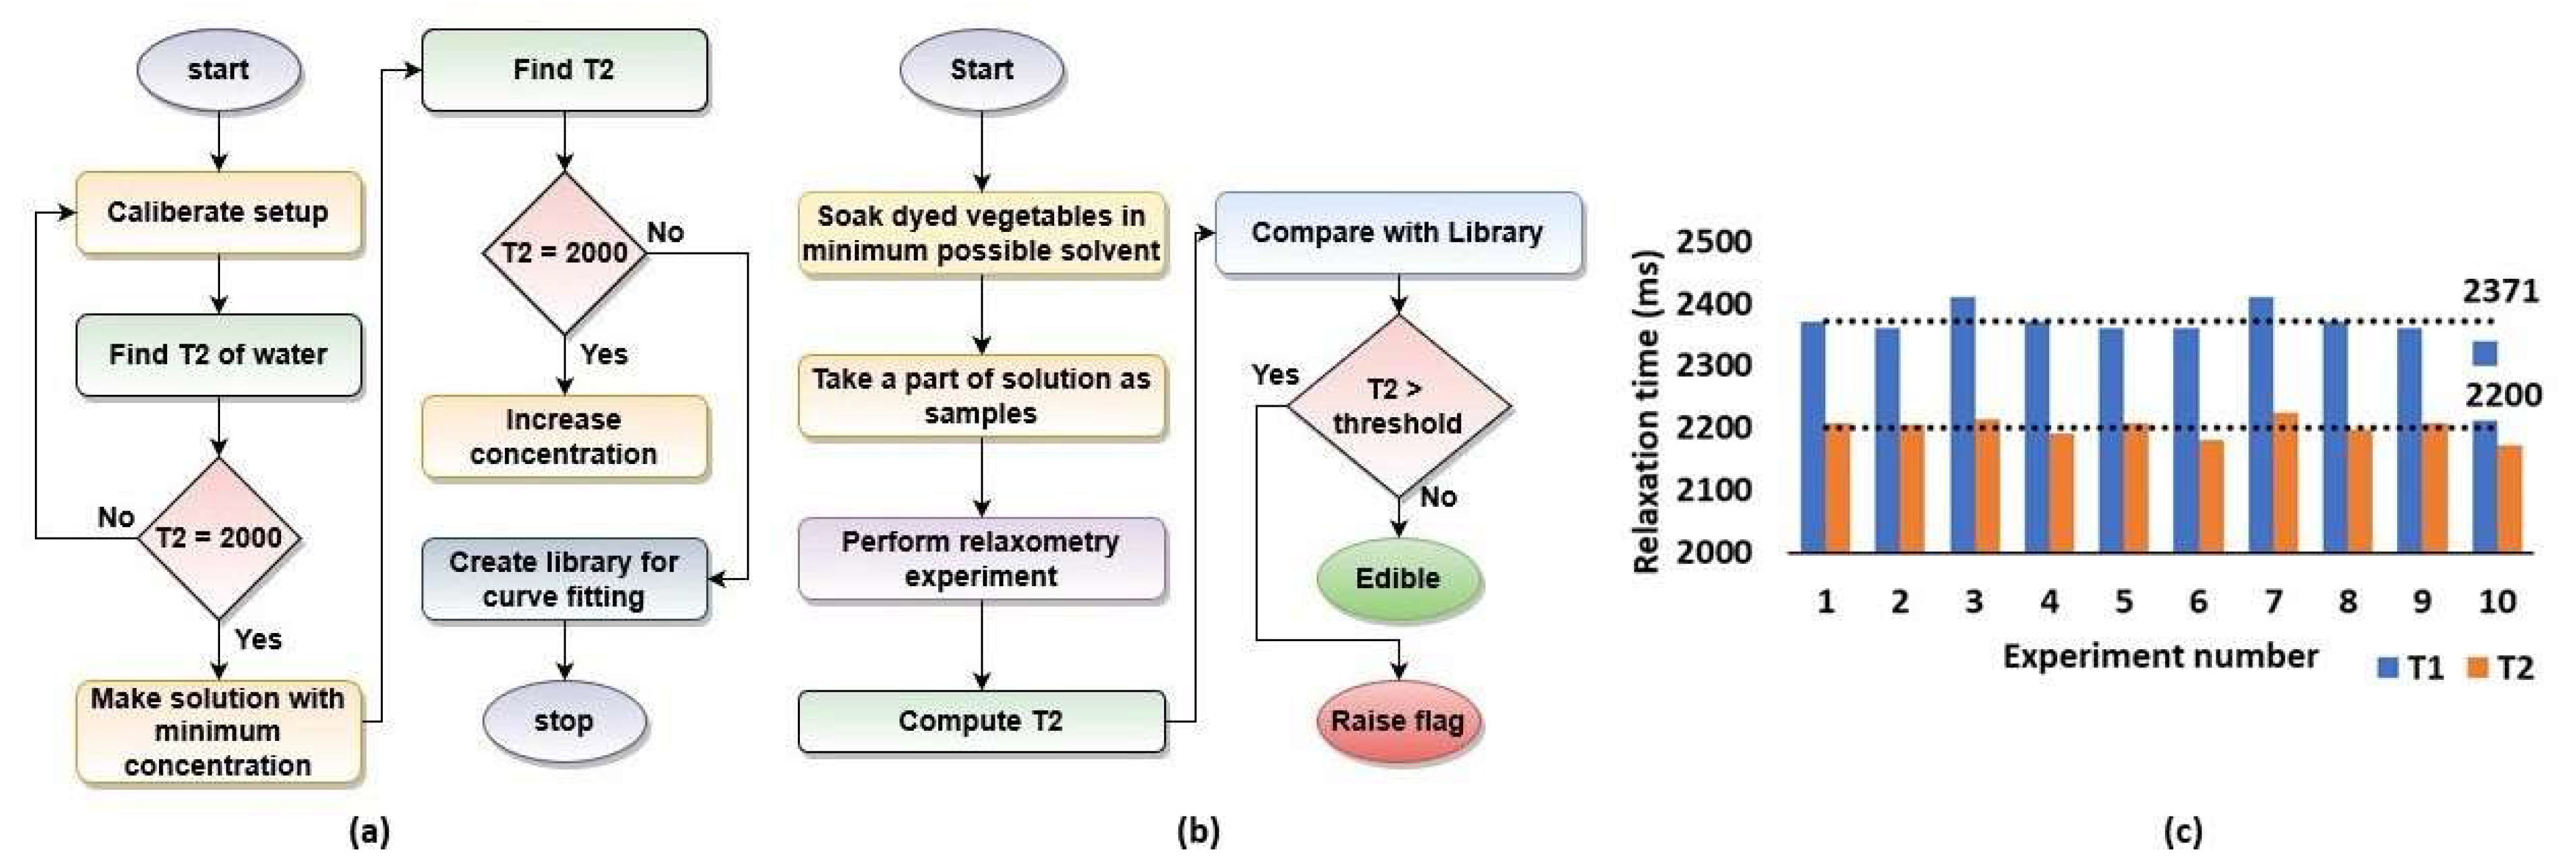
2.3. Methodology
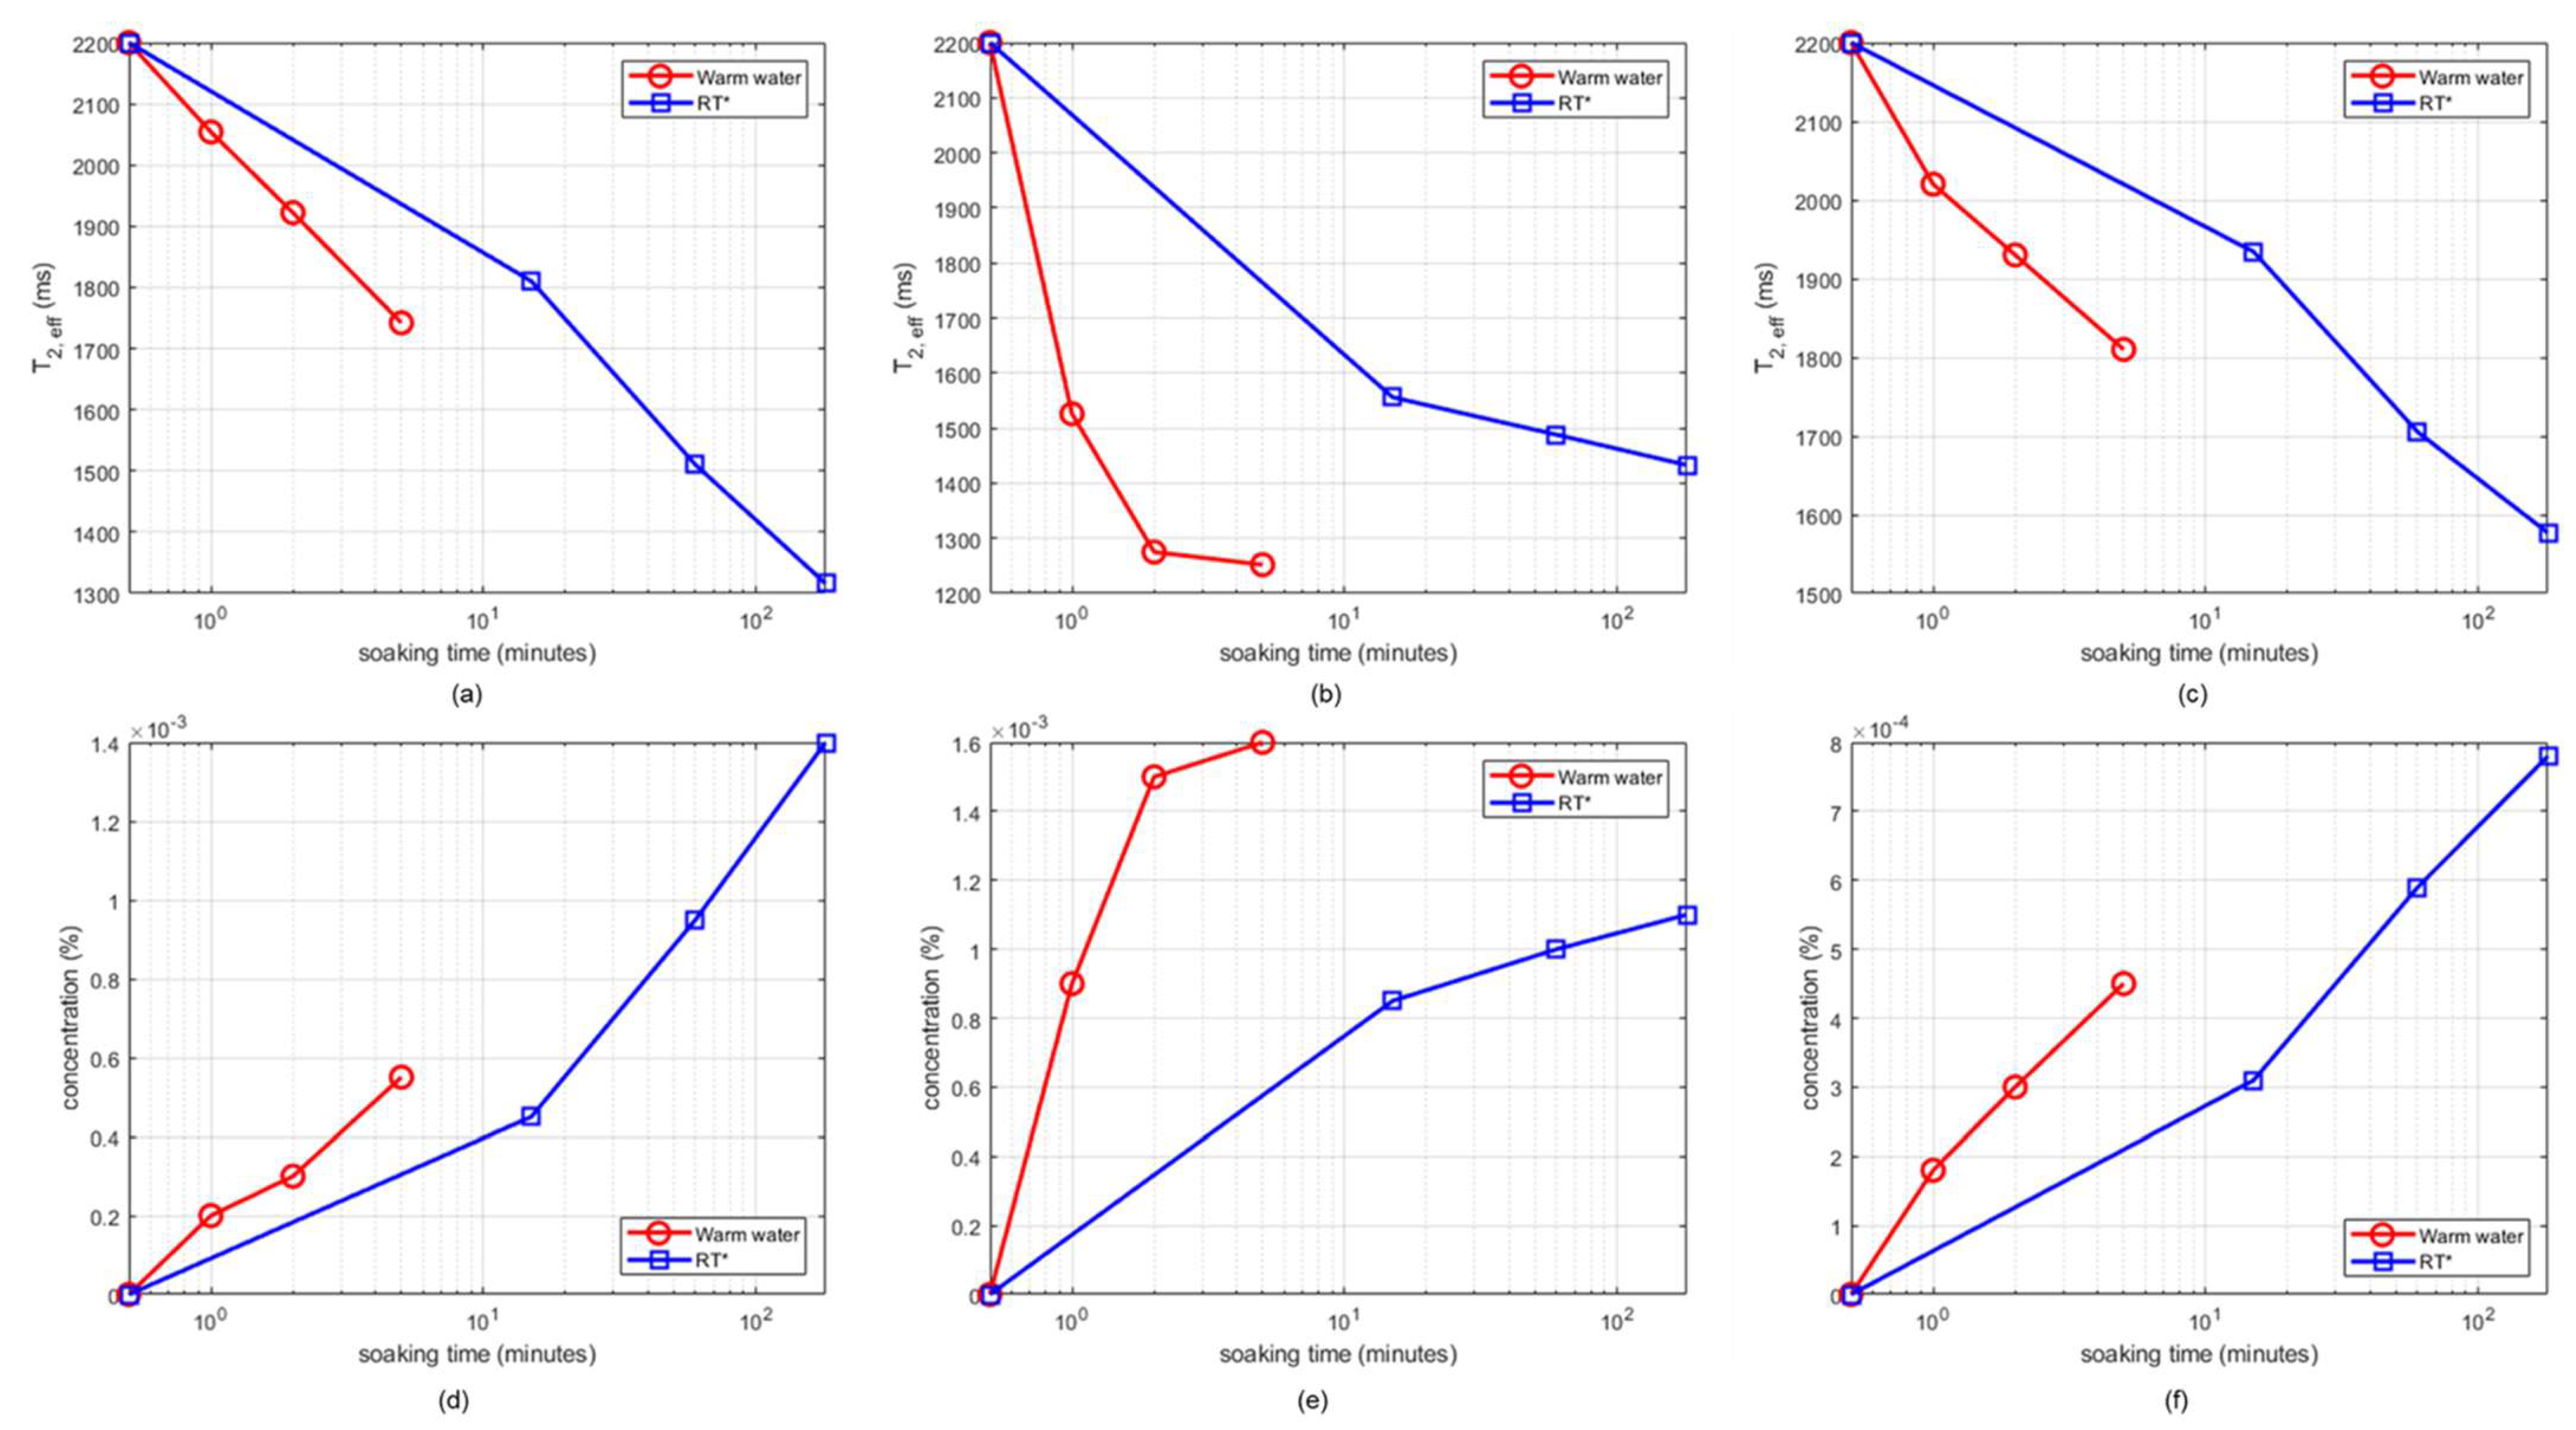
3. Results and Discussion
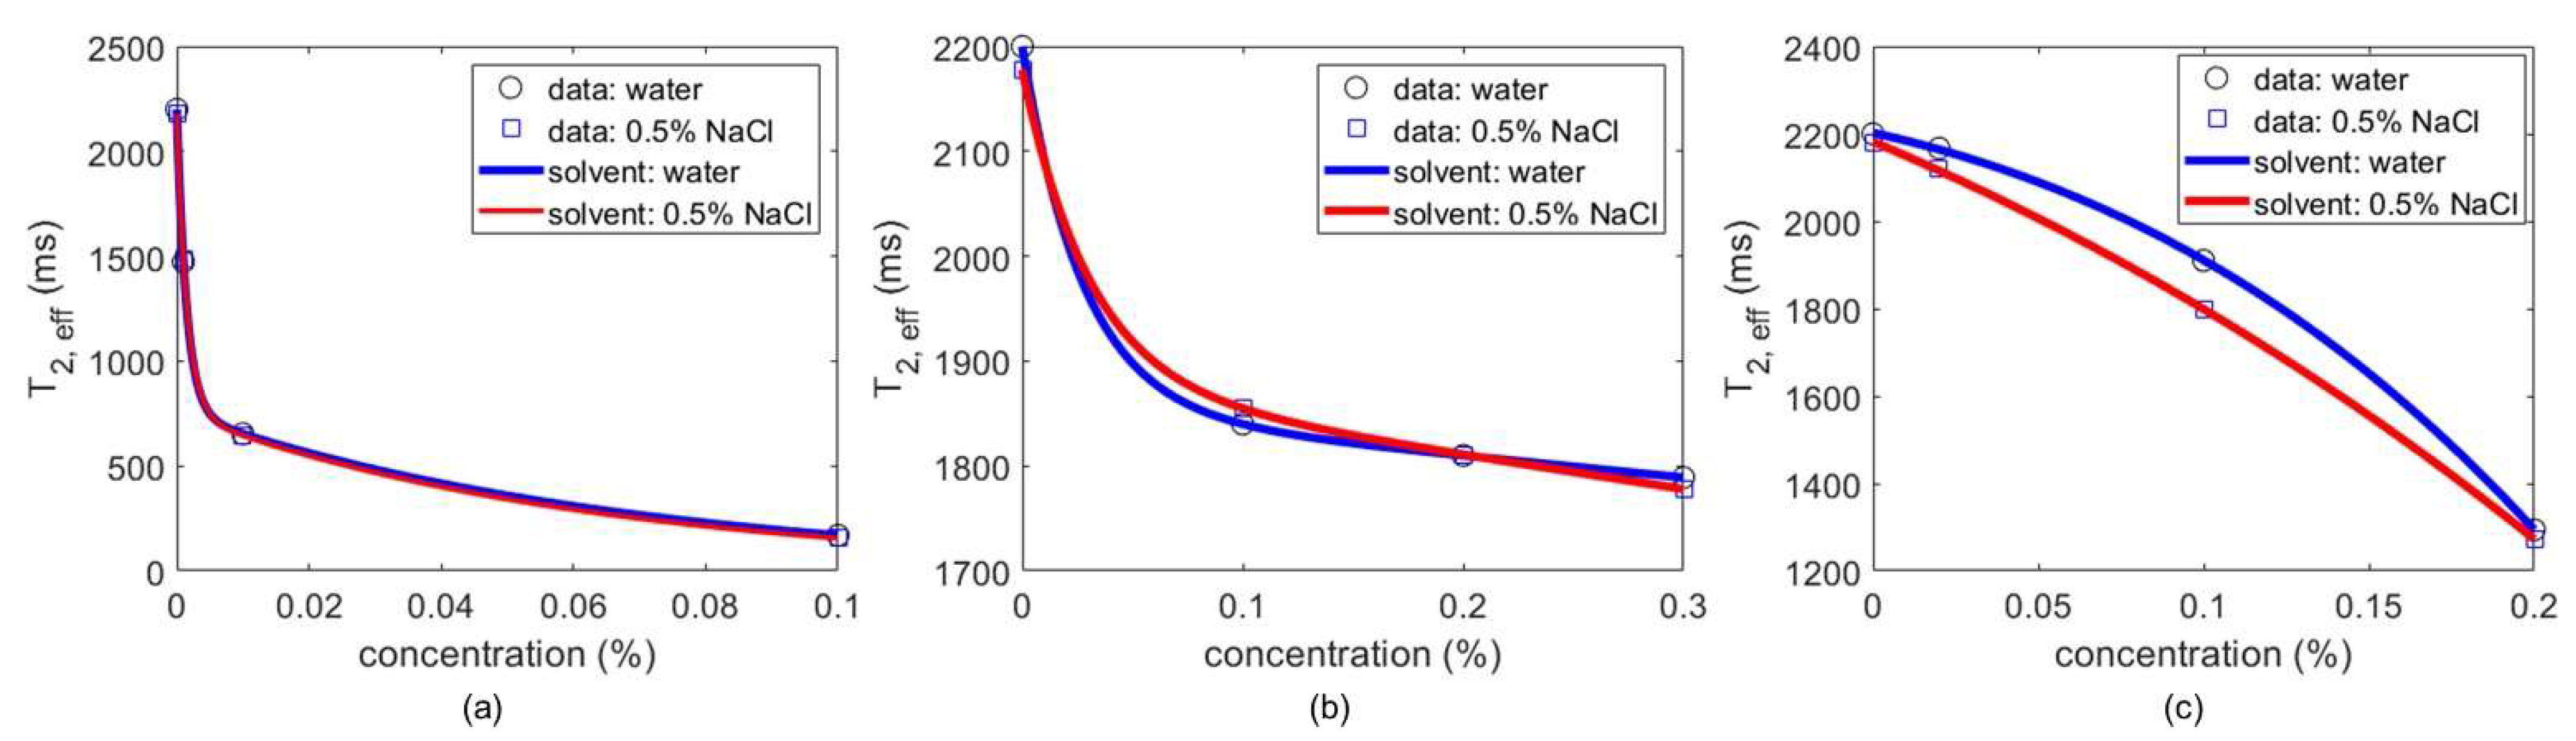
3.1. Library Creation
3.2. Detection of Unknown Concentrations
3.3. Discussion
4. Conclusions
Author Contributions
Funding
Institutional Review Board Statement
Informed Consent Statement
Data Availability Statement
Conflicts of Interest
References
- Schell, L.M.; Gallo, M.V.; Cook, K. What’s NOT to eat—food adulteration in the context of human biology. Am. J. Hum. Biol. 2012, 24, 139–148. [Google Scholar] [CrossRef] [Green Version]
- Moore, J.C.; Spink, J.; Lipp, M. Development and application of a database of food ingredient fraud and economically motivated adulteration from 1980 to 2010. J. Food Sci. 2012, 77, R118–R126. [Google Scholar] [CrossRef]
- Bansal, S.; Singh, A.; Mangal, M.; Mangal, A.K.; Kumar, S. Food adulteration: Sources, health risks, and detection methods. Crit. Rev. Food Sci. Nutr. 2017, 57, 1174–1189. [Google Scholar] [CrossRef] [PubMed]
- Naik, S.; Prasad, R. Pesticide residue in organic and conventional food-risk analysis. J. Chem. Health Saf. 2006, 13, 12–19. [Google Scholar]
- Kobylewski, S.; Jacobson, M.F. Toxicology of food dyes. Int. J. Occup. Environ. Health 2012, 18, 220–246. [Google Scholar] [CrossRef]
- Oplatowska-Stachowiak, M.; Elliott, C.T. Food colors: Existing and emerging food safety concerns. Crit. Rev. Food Sci. Nutr. 2017, 57, 524–548. [Google Scholar] [CrossRef] [PubMed]
- Hong, E.; Lee, S.Y.; Jeong, J.Y.; Park, J.M.; Kim, B.H.; Kwon, K.; Chun, H.S. Modern analytical methods for the detection of food fraud and adulteration by food category. J. Sci. Food Agric. 2017, 97, 3877–3896. [Google Scholar] [CrossRef]
- Uematsu, Y.; Ogimoto, M.; Kabashima, J.; Suzuki, K.; Ito, K. Fast cleanup method for the analysis of Sudan IIV and para red in various foods and paprika color (oleoresin) by high-performance liquid chromatography/diode array detection: Focus on removal of fat and oil as fatty acid methyl esters prepared by transesterification of acylglycerols. J. AOAC Int. 2007, 90, 437–445. [Google Scholar]
- Culp, S.; Beland, F.A.; Heflich, R.H.; Benson, R.W.; Blankenship, L.R.; Webb, P.J.; Mellick, P.W.; Trotter, R.W.; Shelton, S.D.; Greenlees, K.U.J.; et al. Mutagenicity and carcinogenicity in relation to DNA adduct formation in rats fed leucomalachite green. Mutat. Res. /Fundam. Mol. Mech. Mutagenesis 2002, 506, 55–63. [Google Scholar] [CrossRef] [Green Version]
- Hu, Y.; Wang, S.; Wang, S.; Lu, X. Application of nuclear magnetic resonance spectroscopy in food adulteration determination: The example of Sudan dye I in paprika powder. Sci. Rep. 2017, 7, 1–9. [Google Scholar] [CrossRef] [Green Version]
- Jolene. Indian Farmers Dye and Inject Vegetables To Make Them Look ‘Fresher and Bigger. 2016. Available online: https://www.worldofbuzz.com/indian-farmer-dye-inject-vegetables-make-look-fresh-big/ (accessed on 5 March 2020).
- Julia Glotz. New Copper Sulphate Scam on The Rise in Fruit & Veg Sector. 2016. Available online: https://www.thegrocer.co.uk/food-safety/new-copper-sulphate-scam-on-the-rise-in-fruit-and-veg-sector/544132.article (accessed on 5 March 2020).
- India Today. Common Food Adulterants in India. 2019. Available online: https://www.indiatoday.in/education-today/gk-current-affairs/story/common-food-adulterants-in-india-1370601-2018-10-19 (accessed on 5 March 2020).
- NDTV Food. Is Your Turmeric Real or Fake? Use These Smart Tricks to Find Out. 2017. Available online: https://food.ndtv.com/food-drinks/is-your-turmeric-real-or-fake-use-these-smart-tricks-to-find-out-1709273 (accessed on 5 March 2020).
- Anasazi Instruments, Inc. Cryogen Free NMR Spectrometers for Education and Industry. 2021. Available online: https://www.aiinmr.com/ (accessed on 8 September 2021).
- Magritek. Discover the Spinsolve Desktop NMR Spectrometer Family. 2021. Available online: https://magritek.com/products/spinsolve/ (accessed on 8 September 2021).
- Ellis, D.I.; Brewster, V.L.; Dunn, W.B.; Allwood, J.W.; Golovanov, A.P.; Goodacre, R. Fingerprinting food: Current technologies for the detection of food adulteration and contamination. Chem. Soc. Rev. 2012, 41, 5706–5727. [Google Scholar] [CrossRef]
- Masna, N.V.R.; Paul, S.D.; Chen, C.; Mandal, S.; Bhunia, S. Eat, but verify: Low-cost portable devices for food safety analysis. IEEE Consum. Electron. Mag. 2018, 8, 12–18. [Google Scholar] [CrossRef]
- Hatzakis, E. Nuclear magnetic resonance (NMR) spectroscopy in food science: A comprehensive review. Compr. Rev. Food Sci. Food Saf. 2019, 18, 189–220. [Google Scholar] [CrossRef] [PubMed] [Green Version]
- Kryukov, E.; Bugoslavsky, Y.; Linde, A.J.P.; Holubar, T.; Burgess, S.; Marlow, D.; Good, J. A method for fast field settling in cryogen-free superconducting magnets for NMR. Solid State Nucl. Magn. Reson. 2020, 109, 101684. [Google Scholar] [CrossRef] [PubMed]
- Fukushima, E.; Roeder, S.B. Experimental Pulse NMR: A Nuts and Bolts Approach; CRC Press: Boca Raton, FL, USA, 2018. [Google Scholar]
- Cistola, D.P.; Robinson, M.D. Compact NMR relaxometry of human blood and blood components. TrAC Trends Anal. Chem. 2016, 83, 53–64. [Google Scholar] [CrossRef] [Green Version]
- NMR Relaxation. Available online: http://chem.ch.huji.ac.il/nmr/techniques/other/t1t2/t1t2.html (accessed on 8 September 2021).
- Fedorov, L.A. NMR spectroscopy of azo dyes. Russ. Chem. Rev. 1988, 57, 941. [Google Scholar] [CrossRef]
- Allisy-Roberts, P.J.; Williams, J. Farr’s Physics for Medical Imaging; Elsevier Health Sciences: New York, NY, USA, 2007. [Google Scholar]
- Bharti, S.K.; Roy, R. Quantitative 1H NMR spectroscopy. TrAC Trends Anal. Chem. 2012, 35, 5–26. [Google Scholar] [CrossRef]
- Song, Y.Q.; Venkataramanan, L.; Hürlimann, M.; Flaum, M.; Frulla, P.; Straley, C. T1–T2 correlation spectra obtained using a fast two-dimensional Laplace inversion. J. Magn. Reson. 2002, 154, 261–268. [Google Scholar] [CrossRef]
- Tadepalli, S. Green Veggies Made Greener with Lethal Copper Sulphate. 2015. Available online: https://times9ofindia.indiatimes.com/city/hyderabad/Green-veggies-made-greener-with-lethal-copper-sulphate/articleshow/48599444.cms (accessed on 8 September 2021).
- Gamakaranage, C.S.S.K.; Rodrigo, C.; Weerasinghe, S.; Gnanathasan, A.; Puvanaraj, V.; Fernando, H. Complications and management of acute copper sulphate poisoning; a case discussion. J. Occup. Med. Toxicol. 2011, 6, 1–5. [Google Scholar] [CrossRef] [Green Version]
- National Center for Biotechnology Information. PubChem Database. Malachite Green, CID=11294. 2020. Available online: https://pubchem.ncbi.nlm.nih.gov/compound/Malachite-green (accessed on 26 February 2020).
- National Center for Biotechnology Information. PubChem Database. Sudan III, CID=62331. 2020. Available online: https://pubchem.ncbi.nlm.nih.gov/compound/Sudan-III (accessed on 26 February 2020).
- Xu, J.; Zhang, Y.; Yi, J.; Meng, M.; Wan, Y.; Feng, C.; Wang, S.; Lu, X.; Xi, R. Preparation of anti-Sudan red monoclonal antibody and development of an indirect competitive enzyme-linked immunosorbent assay for detection of Sudan red in chilli jam and chilli oil. Analyst 2010, 135, 2566–2572. [Google Scholar] [CrossRef]
- Daood, H.G.; Biacs, P.A. Simultaneous determination of Sudan dyes and carotenoids in red pepper and tomato products by HPLC. J. Chromatogr. Sci. 2005, 43, 461–465. [Google Scholar] [CrossRef] [PubMed] [Green Version]
- Greer, M.; Chen, C.; Mandal, S. Automated classification of food products using 2D low-field NMR. J. Magn. Reson. 2018, 294, 44–58. [Google Scholar] [CrossRef] [PubMed]
- Greer, M.; Chen, C.; Mandal, S. An easily reproducible, hand-held, single-sided, MRI sensor. J. Magn. Reson. 2019, 308, 106591. [Google Scholar] [CrossRef] [PubMed]
- Hoult, D.I.; Richards, R. The signal-to-noise ratio of the nuclear magnetic resonance experiment. J. Magn. Reson. (1969) 1976, 24, 71–85. [Google Scholar] [CrossRef]
- Carr, H.Y.; Purcell, E.M. Effects of diffusion on free precession in nuclear magnetic resonance experiments. Phys. Rev. 1954, 94, 630. [Google Scholar] [CrossRef]
- Meiboom, S.; Gill, D. Modified spin-echo method for measuring nuclear relaxation times. Rev. Sci. Instrum. 1958, 29, 688–691. [Google Scholar] [CrossRef] [Green Version]
- Tsukiashi, A.; Min, K.S.; Kitayama, H.; Terasawa, H.; Yoshinaga, S.; Takeda, M.; Lindoy, L.F.; Hayami, S. Application of spin-crossover water soluble nanoparticles for use as MRI contrast agents. Sci. Rep. 2018, 8, 1–5. [Google Scholar] [CrossRef] [PubMed]
- T2 Relaxation. Available online: https://radiopaedia.org/articles/t2-relaxation (accessed on 8 September 2021).
- Koenig, S.H.; Brown III, R.D. Relaxation of solvent protons by paramagnetic ions and its dependence on magnetic field and chemical environment: Implications for NMR imaging. Magn. Reson. Med. 1984, 1, 478–495. [Google Scholar] [CrossRef] [PubMed]
- Kimmich, R. (Ed.) Field-Cycling NMR Relaxometry: Instrumentation, Model Theories and Applications; Royal Society of Chemistry: Cambridge, UK, 2018. [Google Scholar]
- Ariando, D.; Chen, C.; Greer, M.; Mandal, S. An autonomous, highly portable NMR spectrometer based on a low-cost System-on- Chip (SoC). J. Magn. Reson. 2019, 299, 74–92. [Google Scholar] [CrossRef]


Publisher’s Note: MDPI stays neutral with regard to jurisdictional claims in published maps and institutional affiliations. |
© 2021 by the authors. Licensee MDPI, Basel, Switzerland. This article is an open access article distributed under the terms and conditions of the Creative Commons Attribution (CC BY) license (https://creativecommons.org/licenses/by/4.0/).
Share and Cite
Shomaji, S.; Masna, N.V.R.; Ariando, D.; Deb Paul, S.; Horace-Herron, K.; Forte, D.; Mandal, S.; Bhunia, S. Detecting Dye-Contaminated Vegetables Using Low-Field NMR Relaxometry. Foods 2021, 10, 2232. https://doi.org/10.3390/foods10092232
Shomaji S, Masna NVR, Ariando D, Deb Paul S, Horace-Herron K, Forte D, Mandal S, Bhunia S. Detecting Dye-Contaminated Vegetables Using Low-Field NMR Relaxometry. Foods. 2021; 10(9):2232. https://doi.org/10.3390/foods10092232
Chicago/Turabian StyleShomaji, Sumaiya, Naren Vikram Raj Masna, David Ariando, Shubhra Deb Paul, Kelsey Horace-Herron, Domenic Forte, Soumyajit Mandal, and Swarup Bhunia. 2021. "Detecting Dye-Contaminated Vegetables Using Low-Field NMR Relaxometry" Foods 10, no. 9: 2232. https://doi.org/10.3390/foods10092232