Article

Survival of Escherichia coli O157:H7 during Moderate Temperature Dehydration of Plant-Based Foods

by
Yadwinder Singh Rana
1,
Philip M. Eberly
2,
Quincy J. Suehr
3,
Ian M. Hildebrandt
3,
Bradley P. Marks
3 and
Abigail B. Snyder
1,*
1
Department of Food Science, Cornell University, Ithaca, NY 14850, USA
2
Department of Food Science, The Ohio State University, Columbus, OH 43210, USA
3
Department of Biosystems and Agricultural Engineering, Michigan State University, East Lansing, MI 48824, USA
*
Author to whom correspondence should be addressed.
Foods 2021, 10(9), 2162; https://doi.org/10.3390/foods10092162
Submission received: 10 August 2021 / Revised: 25 August 2021 / Accepted: 30 August 2021 / Published: 13 September 2021
(This article belongs to the Special Issue Effect of Different Processing Methods on Microorganisms in Food)

Abstract

:
The effect of moderate-temperature (≤60 °C) dehydration of plant-based foods on pathogen inactivation is unknown. Here, we model the reduction of E. coli O157:H7 as a function of product-matrix, aw, and temperature under isothermal conditions. Apple, kale, and tofu were each adjusted to aw 0.90, 0.95, or 0.99 and inoculated with an E. coli O157:H7 cocktail, followed by isothermal treatment at 49, 54.5, or 60.0 °C. The decimal reduction time, or D-value, is the time required at a given temperature to achieve a 1 log reduction in the target microorganism. Modified Bigelow-type models were developed to determine D-values which varied by product type and aw level, ranging from 3.0–6.7, 19.3–55.3, and 45.9–257.4 min. The relative impact of aw was product dependent and appeared to have a non-linear impact on D-values. The root mean squared errors of the isothermal-based models ranged from 0.75 to 1.54 log CFU/g. Second, we performed dynamic drying experiments. While the isothermal results suggested significant microbial inactivation might be achieved, the dehydrator studies showed that the combination of low product temperature and decreasing aw in the pilot-scale system provided minimal inactivation. Pilot-scale drying at 60 °C only achieved reductions of 3.1 ± 0.8 log in kale and 0.67 ± 0.66 log in apple after 8 h, and 0.69 ± 0.67 log in tofu after 24 h. This illustrates the potential limitations of dehydration at ≤60 °C as a microbial kill step.

1. Introduction

Dehydration has served as a preservation process for hundreds of years wherein microbial growth is inhibited through the removal of available water from a food product [1]. Typical commercial dehydration is a mild thermal process often ranging from 40 to 80 °C with forced air circulation [2,3,4]. The kinetics of thermal pathogen inactivation under complex dehydration conditions is poorly understood. Previous fruit dehydration research has primarily evaluated microbial inactivation at temperatures >60 °C [5,6,7]. However, processors, especially small-scale processors, may use temperatures ≤60 °C for dehydration of plant-based foods including dried fruits, kale chips, kale smoothie powders, spices and herbs, and vegan jerky (dehydrated tofu or mushrooms). Fresh produce has been associated with outbreaks of foodborne illness attributed to a variety of pathogens including diarrheagenic E. coli [8,9], although there are limited reports of foodborne disease outbreaks attributed to dehydrated plant-based food products [10,11]. However, the relative efficacy of moderate-temperature (≤60 °C) dehydration of plant-based foods on pathogen inactivation remains unknown.
Heat-assisted dehydration involves dynamic temperature and moisture levels, which increases the complexity of validating microbial inactivation outcomes. Accurate assessments of microbial inactivation must account for these dynamics. Processing variables (air currents, temperature, and humidity) within the dehydration unit affect product temperature and water activity (aw), critical factors for pathogen inactivation. Processing variables are often unit-specific and dependent on equipment design features [12]. In addition, factors dependent on food-type (initial moisture content, moisture diffusivity, thickness) and dehydrator operation (fill density, tray position, and initial product temperature) can also affect microbial kill [3,12,13]. Uneven humidity and thermal distribution may result in “cold spots”, locations of lower temperature and higher aw relative to the rest of the unit [13]. In thermal processes at consistent moisture levels, the cold spot represents the location of least kill. However, because of the higher aw at these locations relative to “hotter spots”, the cold spot may not represent the worst-case scenario location for microbial inactivation. In these cases, the driest spot, even if it achieves a higher treatment temperature, may represent the worst-case scenario for microbial lethality during dehydration. Additionally, moderate temperatures (≤60 °C) and extended come-up times may create suitable conditions for microbial growth [14,15]. Temperatures between 4.4 °C to 60 °C (40–140 °F), sometimes referred to as the “temperature danger zone,” and aw above 0.95 support the growth of many spoilage and pathogenic bacteria and can potentially lead to toxin production from such foodborne pathogens as Staphylococcus aureus and Bacillus cereus [15,16]. Given that the aw of plant-based products is initially >0.95 prior to dehydration, these conditions may support microbial growth until sufficient moisture has been removed.
In the U.S., the Preventive Controls for Human Food Rule of the Food Safety and Modernization Act (FSMA) established a regulatory basis for validation of process preventive controls, which could include thermal dehydration [17]. While larger businesses are more likely to have validated their processes, and more likely use higher temperatures, smaller food businesses are often engaged in operations that may have less empirical evidence supporting efficacy. Recent studies reporting microbial thermal inactivation models in low aw food systems include potato discs, ground almonds, and whey powder [18,19,20]. However, those systems are appreciably different than heat-assisted dehydration of plant-based foods and the application of existing models to additional legacy processes must be explored to ensure microbial safety in other low aw foods. The objective of this study was to evaluate Escherichia coli O157:H7 inactivation kinetics in isothermal and iso-moisture (40–60 °C, 0.90–0.99 aw) experiments and in pilot-scale dehydrator (60 °C) trials on plant-based foods to assess the feasibility of using 60 °C dehydration as a thermal kill step.

2. Materials and Methods

2.1. Food Samples

Three plant-based products, extra firm tofu (Nasoya foods, Ayer, MA, USA), fuji apples (Archer farms, Minneapolis, MN, USA), and fresh-cut kale (Taylor farms, Salinas, CA, USA) were purchased from a national retailer. The samples were stored under refrigeration conditions (~4 °C) up to 24 h before use. Initial background microbiota counts in the samples were determined by plating uninoculated product samples onto tryptic soy agar (TSA, BD, Thermo Fisher Scientific, Waltham, MA, USA), followed by incubation at 35 ± 2 °C for 24 ± 3 h.

2.2. Inoculum Selection and Preparation

E. coli O157:H7 32C, E. coli O157:H7 32DB [21], E. coli O157:H7 meat-1, and E. coli O157:H7 meat-2 provided from the culture collection of Dr. Ahmed Yousef (Department of Food Science and Technology, The Ohio State University, Columbus, OH, USA) were used to make a four-strain cocktail for this study. Cultures were maintained at −80 °C in 20% glycerol stock. A loopful of frozen stock was initially inoculated into tryptic soy broth (TSB, BD, Thermo Fisher Scientific, Waltham, MA, USA) and incubated at 35 ± 2 °C for 24 ± 3 h. Broth suspension was streaked onto TSA plates and incubated at 35 ± 2 °C for 24 ± 3 h. An isolated colony was transferred from stock plates into TSB followed by incubation at 35 ± 2 °C for 20 ± 3 h. After incubation the culture broth was centrifuged at 2817× g for 5 min and 4 °C (Eppendorf, NY, USA), the cell pellet was washed and resuspended in 0.1% peptone water (PW) (BD, Thermo Fisher Scientific, Waltham, MA, USA). This process was repeated for each of the four E. coli strains and prior to inoculation, equal volumes of each bacterial strain were mixed together to make a cell cocktail. The initial cell count was determined to be ~108 CFU/mL by plating cell dilutions onto TSA.

2.3. Sample Inoculation

An hour before inoculation, food samples were taken out of refrigeration (~4 °C) and allowed to equilibrate to room temperature (~20 °C). Initial product aw was recorded using Aqualab 4-TE (METER group, Pullman, WA, USA). The aw of apple and tofu slices, as well as chopped kale was adjusted for isothermal experiments using a dehydration unit (Weston pro-2400, Weston, Southern Pines, NC, USA) operated at 60 °C for up to 2.5 ± 0.5 h (kale), 8 ± 2 h (apple) and 20 ± 2 h (tofu) to achieve the target aw level (0.99 ± 0.01, 0.95 ± 0.01, or 0.90 ± 0.01). Inoculum (1 mL) was concentrated by centrifugation (2817× g for 5 min at 4 °C) and resuspended in 10 µL PW to minimize the food sample aw change by reducing the volume of inoculum applied. For sample preparation, 5 g of aw adjusted sample was added to a sterile Whirl-Pack® bags (Nasco, Fort Atkinson, Madison, WI, USA) followed by inoculation with 10 µL concentrated cell cocktail (~108 CFU/g). Inoculum was distributed by hand massaging and the final aw was confirmed (±0.02 of the target aw) before isothermal treatment.

2.4. Isothermal Studies

Samples were heat-sealed and treated at 49 °C, 54.5 °C, and 60.0 °C (120, 130, and 140 °F) for up to 300, 180, and 30 min, respectively, in a water bath (FSGPD05, Thermo Fisher Scientific, Waltham, MA, USA). Come-up-time was initially verified for two samples of each product using a thin wire K-type thermocouple (5SRTC-GG-K-24-36, Omega Engineering, Norwalk, CT, USA) inserted in the center of the bag. The isothermal time series was initiated when the sample temperature was within 0.5 °C of the set temperature, with the come-up-time defined as the heating time needed to reach this temperature. Samples were pulled after predetermined time intervals between 5 and 60 min, depending on temperature, and transferred to an ice bath for ~3 min to halt the thermal treatment. PW (0.1% w/v, 5 mL) was added to the bags and the samples were hand stomached for ~1 min and appropriate dilutions plated onto TSA. Plates were incubated for 24 ± 3 h at 35 ± 2 °C. Three biological replications were performed for each experimental condition.

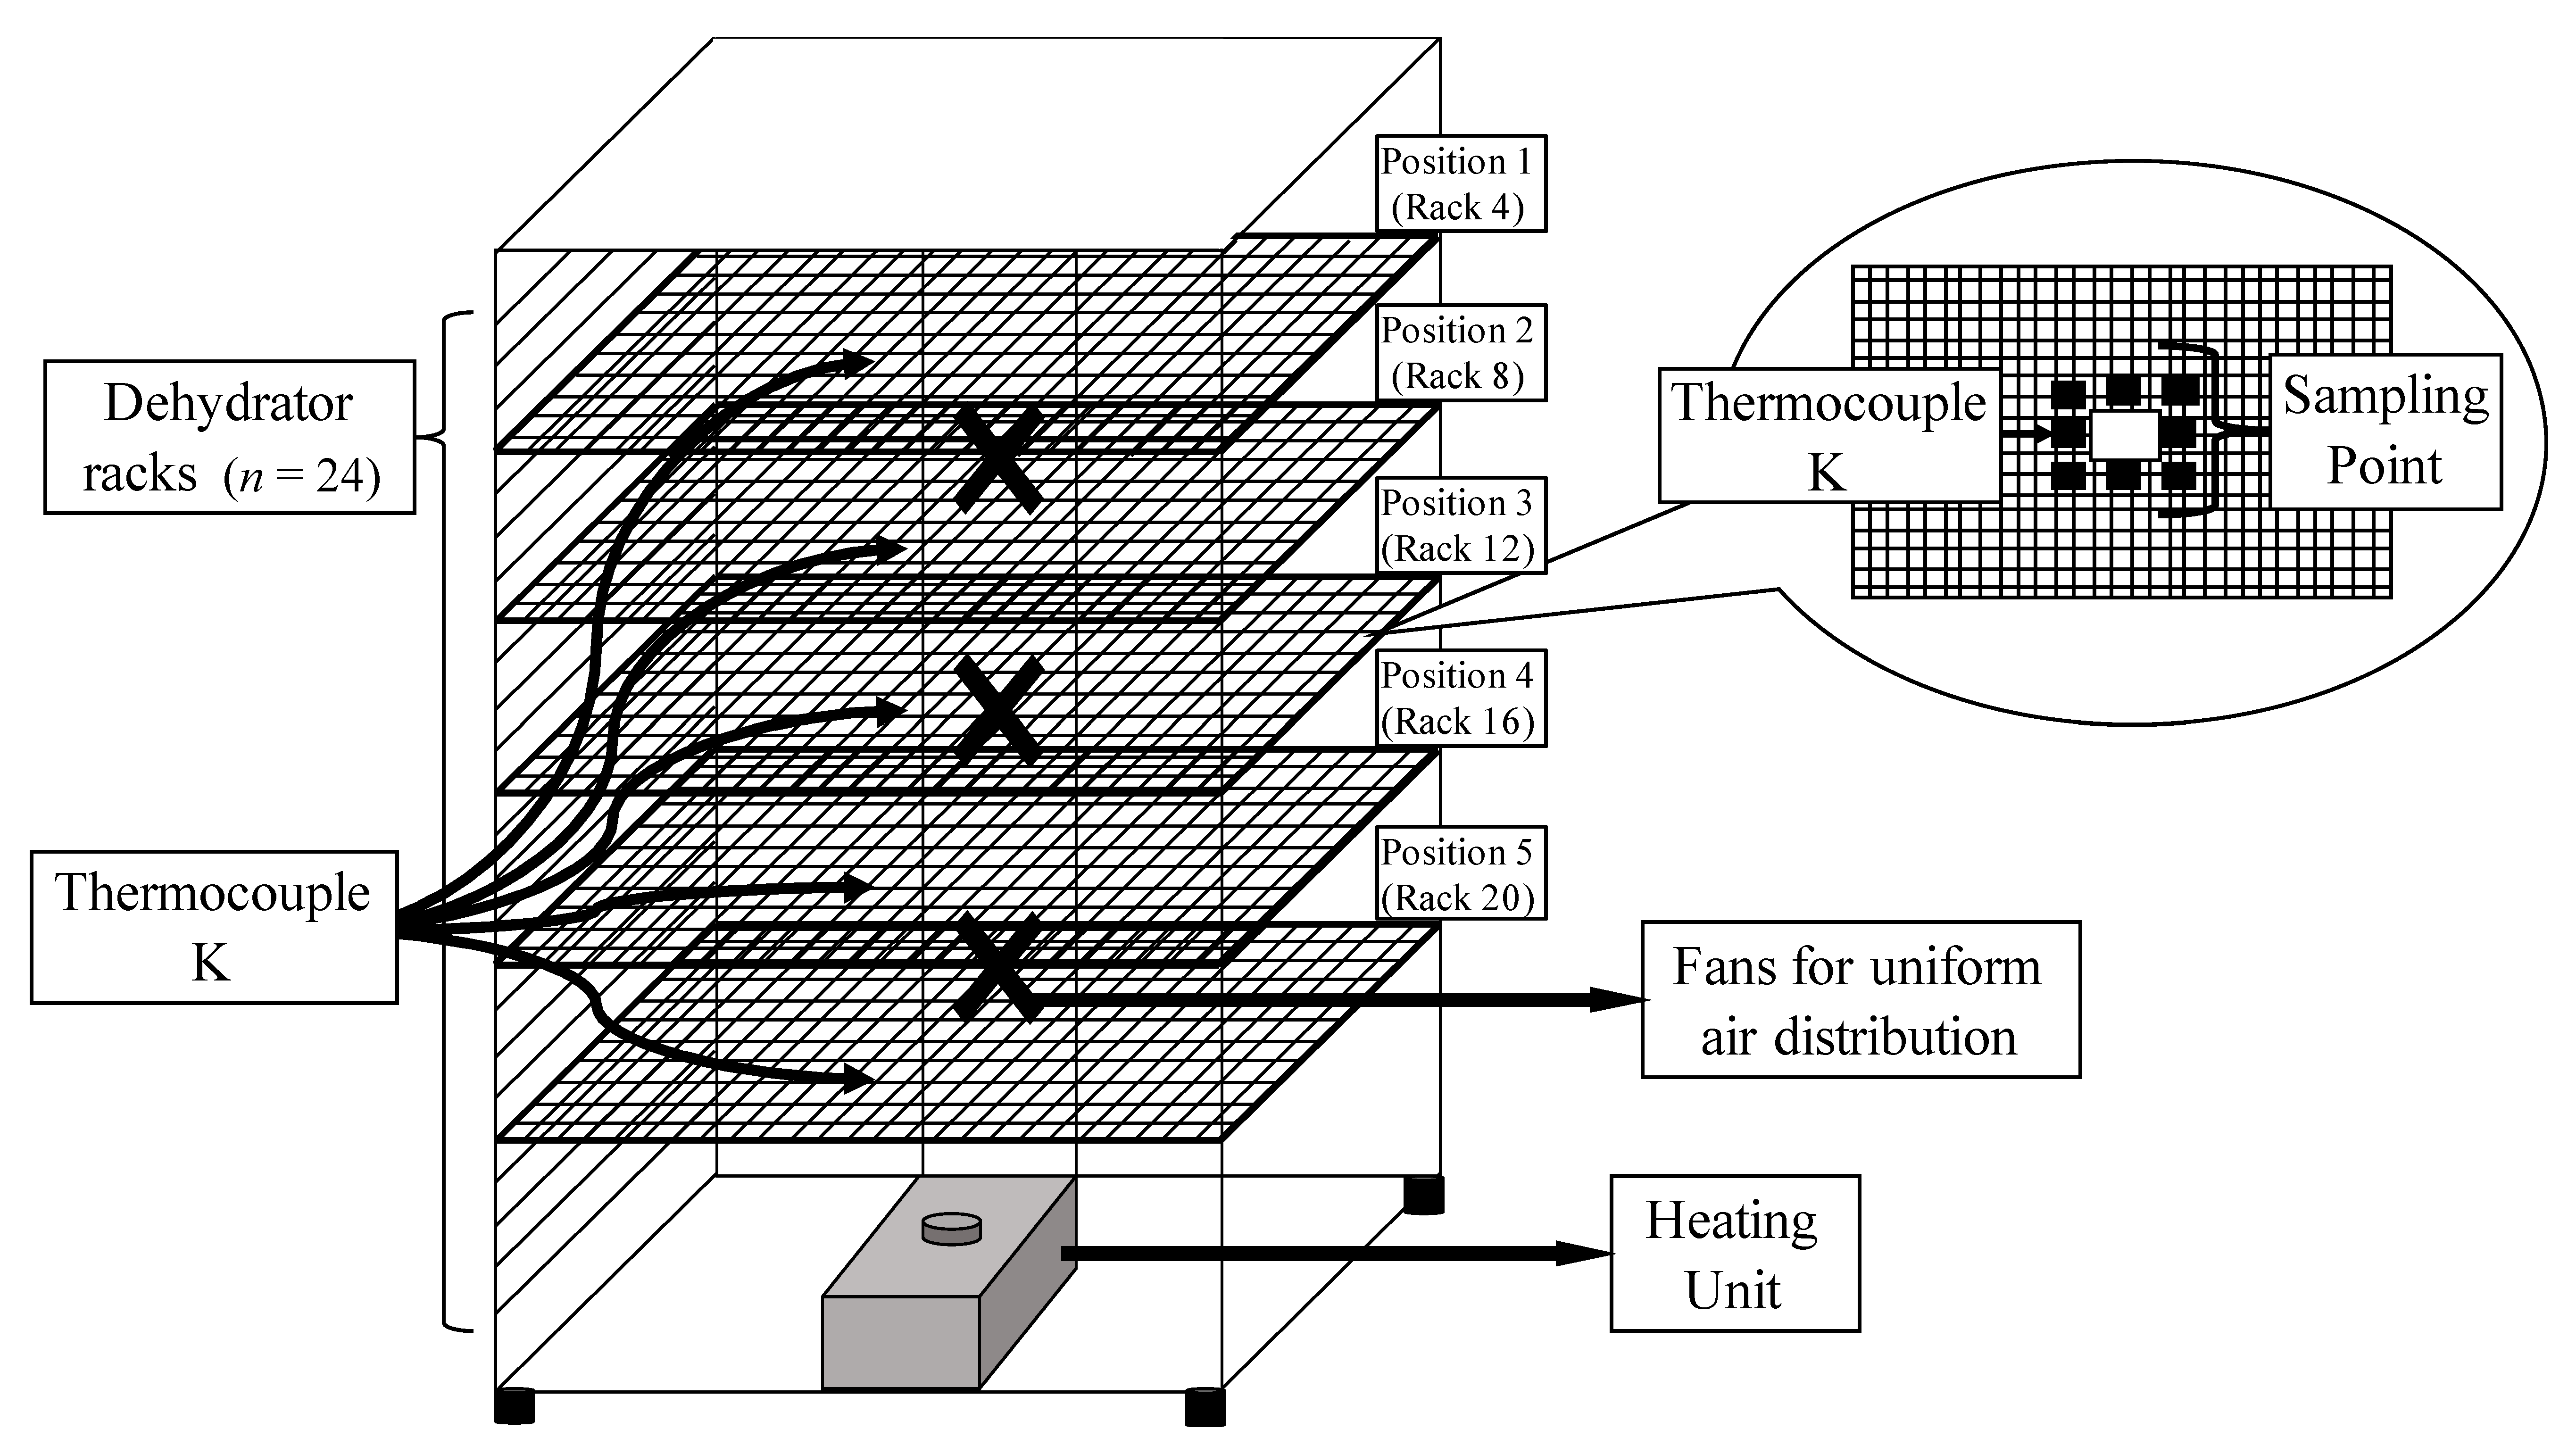
2.5. Inoculated Pack Dehydration Studies

Apple and tofu samples were sliced to approximately 0.60 cm thickness using an ethanol-sterilized knife (Oxo V-blade, Conshohocken, PA, USA), and pre-chopped kale samples (~1 cm wide strips) were used. The dehydrator unit (Weston pro-2400) was filled (24 racks) with uninoculated samples placed ~1 cm or less apart across racks, with only one product type per trial. Spot inoculated samples (aw 0.99 ± 0.01) with initial E. coli O157:H7 counts of 8.0 ± 0.5 log CFU/g were treated in the dehydrator at 60.0 °C (140 °F) for 24 h (apples and tofu) or 8 h (kale). Five different rack positions (rack No. 4, 8, 12, 16, and 20 from the top) were chosen to represent various height levels in the dehydration unit and inoculated samples were centered within each tray (Figure 1). During each dehydration trial, samples were pulled from each rack position and transferred to a sterile Whirl-Pak® bag after 1, 2, 3, 4, and 8 h. Samples were transferred to ice bath for ~3 min, diluted with PW, stomached (Stomacher 400 circulation, VWR), and plated on to TSA. Plates were incubated for 24 ± 3 h at 35 ± 2 °C. Three independent replications were performed with an independent biological culture for each product and trial. A thin wire K-type thermocouple was inserted into the center of food samples placed at pre-determined locations (Figure 1). Wire thermocouples were attached to an 8-input data logger (OM-HL-EH-TC, Omega Engineering), with recording intervals of 10 s. For apple and tofu, aw sampling was performed every 60 min. For kale, the sampling interval was set to 30 min.

2.6. Isothermal Data Modeling

The primary inactivation model used was the first order kinetic, or log-linear model.
log ( N N 0 ) = t D T
where N and N0 are the bacteria populations (CFU/g) at times t and 0, respectively, t (min) is isothermal treatment time, and DT is the time (min) required to reduce the bacterial population by 10-fold at a specified temperature T (°C).
After fitting the primary model for each set of survivor data resulting from each food matrix, temperature, and aw combination, two Bigelow-type secondary models were used to model the effect of temperature and aw on the D-value. The first secondary model examined only the effect of temperature for each food matrix and aw combination independently on the D-value:
D T ( T ) = D r e f × 10 T r e f T z T
where Dref is the time (min) required to achieve a 10-fold reduction at Tref (°C), the reference temperature, and zT is the temperature required to change the D-value by 10-fold (°C).
The second secondary model evaluated the effect of aw and temperature on the inactivation kinetics as reported in Smith et al., 2016 [22]:
D T , a w ( T , a w ) = D r e f × 10 T r e f T z T × 10 R a w × ( a w r e f a w )
where aw,ref (unitless) was taken as a reference for this experiment, aw (unitless) is the water activity of the sample at treatment, and Raw (unitless) is the scaled impact an incremental change of aw has on the D-value.
Parameters for each model were estimated using a weighted ordinary least squares minimization in MATLAB (version 2019b; MathWorks, Natick, MA, USA) via the nlinfit function. Primary model (Equation (1)) parameters were estimated using each food matrix, temperature, and aw combination with all trials normalized then pooled. For the secondary models, parameters were estimated by incorporating Equation (2) or Equation (3) into the primary model (Equation (1)) and fitting the data globally with all experimental data combined for each food matrix. Parameter standard error (SE) and 95% confidence intervals were computed using the nlpredci function in MATLAB. The estimated parameter values in the text are written as the average estimate ± SE.
Model error was estimated for each predictive model with root mean squared error (RMSE; log CFU/g):
RMSE = i = 1 n [ log ( N N 0 ) p r e d i c t i e d log ( N N 0 ) o b s e r v e d ] 2 n p
where log ( N N 0 ) p r e d i c t i e d is the predicted log reduction from the model, log ( N N 0 ) o b s e r v e d is the experimentally obtained log reduction, n is the total number of observations in the dataset, and p is the number of model parameters.

2.7. Statistical Modeling

The results of isothermal experiments were examined for statistical significance by a linear model with the main effects of temperature, aw, and food matrix, as well as their two-way interactions. F-tests were used to assess statistical significance of model effects. Microbial counts were log transformed to better align with the model assumptions of normality and homogeneous variance. Pairwise comparisons for statistical significance between different food matrices were performed using the Tukey HSD method to adjust for multiple comparisons in the R-package Emmeans [23]. The R-studio computer program (version 1.3.959, 2009–2020 RStudio, PBC) was used for all ANOVA calculations [24].

3. Results and Discussion

3.1. Inactivation of E. coli O157:H7 during Isothermal Treatments

Relatively short come-up-times of 60–80 s were recorded across all aw levels. Minimal shouldering effects were observed on inactivation curves (Figure 2) particularly at higher temperatures as has been previously reported [25]. The log D-values were found to vary significantly by temperature and food matrix (p < 0.05). Pairwise comparisons of log D-values revealed a statistically significant difference between inactivation rates in apple and kale (p < 0.05). In kale, D49°C was 86.3 min at aw level 0.90 (Table 1). Under these same conditions, the D-values from apple and tofu trials were 54.5 min and 107.6 min, respectively. The smaller D-value in apple compared to kale may be due to matrix composition factors such as lower pH (3.5) which has been shown to reduce the thermal tolerance of E. coli [26]. The slowed inactivation rate in tofu compared to kale may be due to the increased thickness fat, and protein content, which can confer a protective effect [27]. While the aw level had a non-statistically significant effect on inactivation, a general increase in D-values was observed with decreasing aw across all product types. However, the change in inactivation rates was not linearly correlated with the change in aw as has also been reported by Buerman et al., 2019 [28]. The general relationship between decreasing aw and increasing inactivation rate has been identified in a wide-range of low moisture foods, including peanut butter [29], spices, and pet food [30]. However, the specific inactivation kinetics are dependent on the target pathogen as well as the food matrix [31,32]. To date, relatively little research has been done on E. coli O157:H7 inactivation in low moisture foods [33,34] or in dehydration of plant-based foods [2].
The temperature-only and combined temperature/aw models are reported in Table 1. The temperature-only Bigelow-type secondary (Equation (2)) model resulted in RMSE values of 0.62 to 0.82 log CFU/g for kale, 1.12 to 1.86 log CFU/g for apples, and 1.11 to 1.31 log CFU/g in tofu. The temperature and aw model (Equation (3)) provided similar RMSE values with values of 0.75, 1.54, and 1.24 log CFU/g for kale, apple, and tofu, respectively. Notably, the model RMSE for apple models represented the worst fit among all products. Notably, the estimated z-value also varied the most in apple at different water activities. This could suggest that the effect of aw on the inactivation rate is temperature dependent. With temperature-only and temperature and aw models resulting in similar RMSE values, this indicates that the addition of the aw term did not lower the model’s predictive power. This is in contrast to previous work where interaction effects were not identified [35,36,37,38]. Heating rate has been previously identified as a relevant factor in inactivation models, so the combination of a moderate treatment temperatures and acidic matrixes may by unique to dehydration in apples [39,40].

3.2. The Impact of Sample Location on Temperature, aw, and Microbial Inactivation in Inoculated Pack Studies

In dynamic dehydration studies, the temperature, aw levels, and microbiological outcomes varied by sample location within the dehydration unit (Figure 3). At the final sampling time, the average aw for apples, tofu, and kale on rack 4 were 0.27 ± 0.02, 0.89 ± 0.04, and 0.21 ± 0.05, respectively (Figure 3). The other end of the dehydrator (rack 20) at the same time, the average aw for apples, tofu, and kale were 0.54 ± 0.12, 0.98 ± 0.01, and 0.73 ± 0.17, respectively. The aw values varied significantly by rack position for apples and kale, the difference was not found to be statistically significant in tofu (p > 0.05).
Similarly, sliced apples taken from rack 4 achieved higher product temperatures (53.5 °C after 24 h) compared to sliced apples taken from rack 20 (40.6 °C after 24 h) (Figure 3d). In kale, a final product temperature of 54.1 °C was observed at rack 4 when compared to 43.6 °C for samples located on rack 20 at 8 h (Figure 3f). For tofu after 24 h treatment, the sample temperatures recorded at rack 4 and 20 were 45.6 °C and 33.9 °C, respectively (Figure 3b). Temperature was found to vary significantly by rack position for tofu and kale; however, the effect was not found to be statistically significant in apples (p > 0.05).
Microbial inactivation results were also location dependent. In kale, for example, the samples at rack 4 had a count of 4.5 ± 1.4 log CFU/g compared to 5.8 ± 0.6 log CFU/g in samples from rack 20 after 8 h (Figure 3e). For apples after 8 h, samples in the center of rack 4 had 7.4 log CFU/g survivors compared to 7.5 log CFU/g for rack 20 (Figure 3c). The difference increased after 24 h of treatment to 6.1 log CFU/g for samples on rack 4 compared to 7.3 log CFU/g survivors for samples on rack 20 (Figure S1b). Additionally, for tofu, an increase in cell count was recorded during the first 8 h of processing; however, after 24 h at 60 °C, survivor counts in tofu on rack 4 were 5.6 log CFU/g compared to 8.4 log CFU/g for samples on rack 20 (Figure S1a). While survivor counts were numerically different based on rack position, the effect of rack position on thermal inactivation of E. coli O157:H7 in inoculated pack studies was not statistically significant after 8 h of treatment across all products (Figure 3).
Overall, locations with the highest temperature also had the lowest aw and greatest microbial inactivation suggesting that, under the range of treatments evaluated in this process, product temperature was indicative of microbial inactivation despite its associated impact on moisture removal. Samples taken from rack 4 had the highest recorded temperature, lowest aw, and fewest survivors followed by rack 8, 12, 16, then 20 which had the lowest temperature, highest aw, and most survivors across all three food types. Rack 4 was the most distant from the heating source but is at the top of the dehydration unit (Figure 1). Various unit design features (location of heating source, air circulation system) as well as operational factors (fill density, tray position) have also been shown to impact heat distribution and aw dynamics during dehydration [12,13]. The extent to which mediating variables impact heat distribution may render a priori identification of the cold spot difficult. Under the conditions evaluated in this study, the “cold spot” represented the worst-case-scenario, despite the more rapid decrease in aw in warmer locations [3].

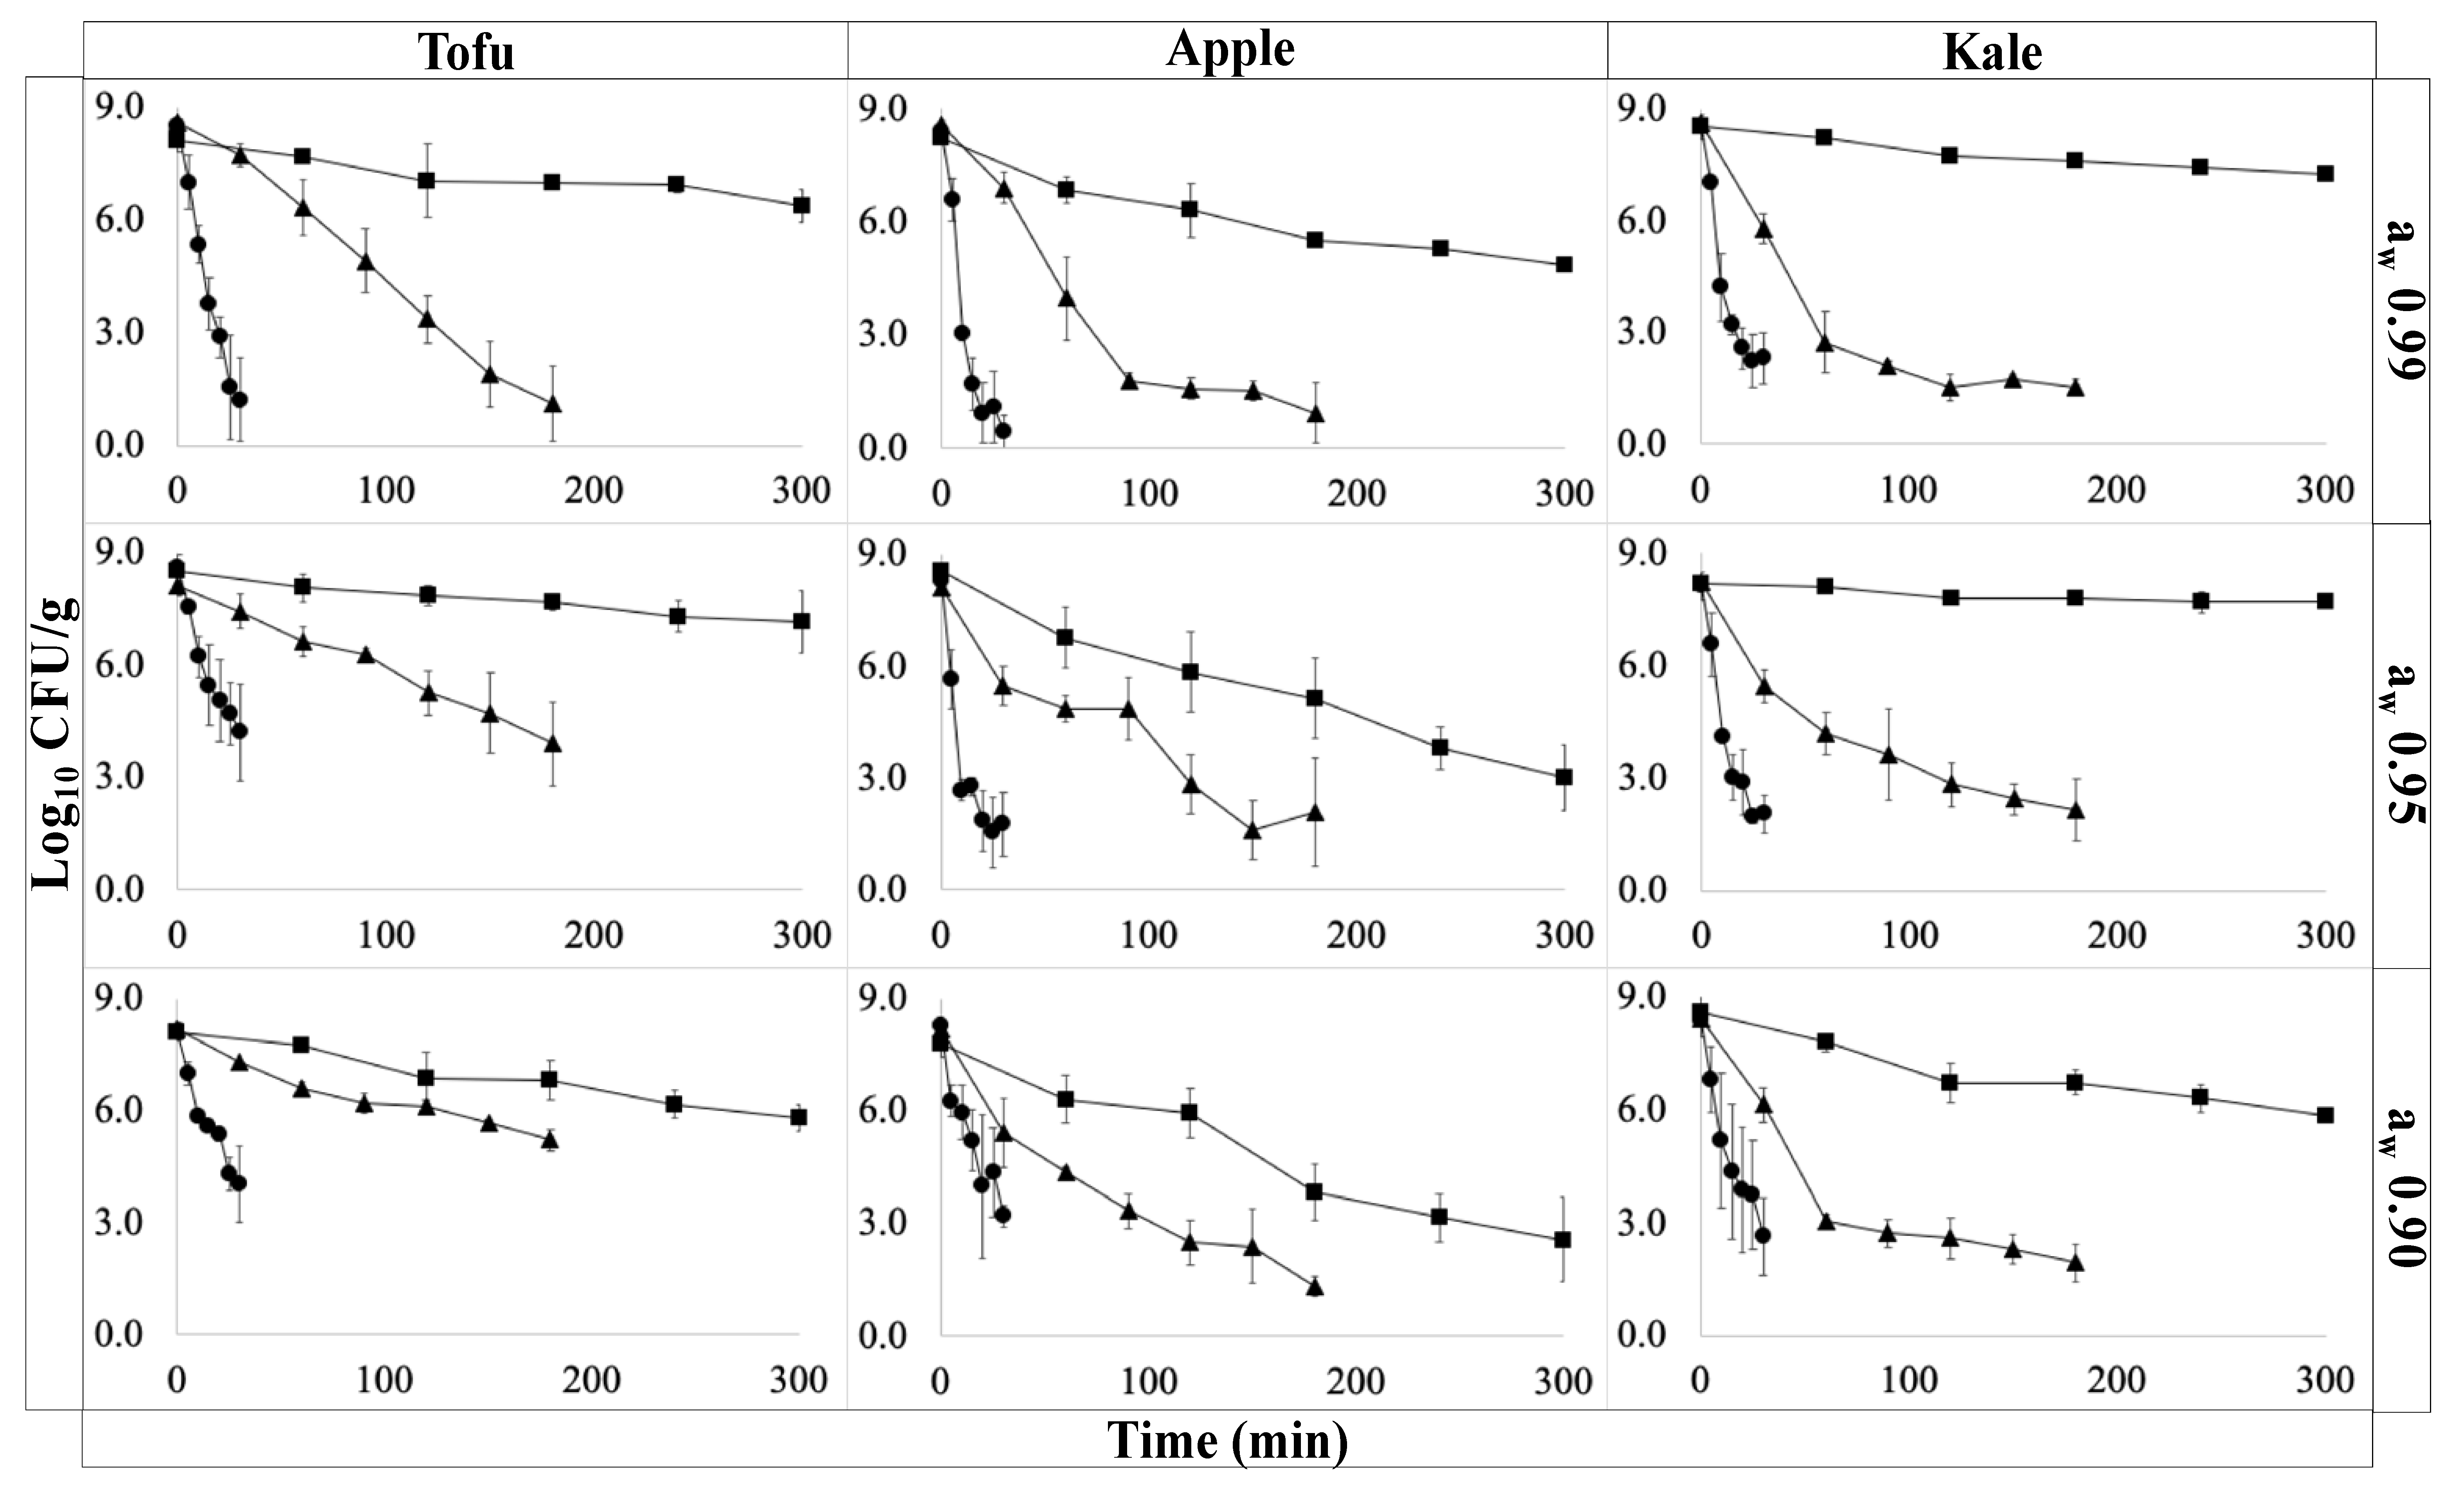
3.3. Changes in E. coli O157:H7 during Inoculated Pack Studies

Throughout the duration of the 24 h dehydration process, sample temperatures did not achieve the set temperature of 60 °C (Figure 3b,d,f), resulting in conditions of temperature abuse [15,16]. These conditions supported the initial outgrowth of E. coli O157:H7 in tofu. During the first 8 h of tofu dehydration, the E. coli O157:H7 count increased by ~1 log CFU/g resulting in a total count of ~9.5 log CFU/g (Figure 3a). By the 24 h sampling point, a decline in cell count was observed (final count 7.2 ± 1.7 log CFU/g after 24 h).
By contrast to tofu experiments, the E. coli O157:H7 counts in apples (Figure 3c) were reduced by 0.67 log CFU/g under the same treatment conditions due to the inhibitory effect of the matrix pH (3.5), more rapid increase in temperature, and decrease in aw. The aw of apple slices was reduced below 0.90 after ~8 h of treatment, and an average final aw of 0.35 was recorded after 24 h of treatment (Figure 3d). For kale, E. coli O157:H7 counts were reduced by 3.1 log CFU/g within 8 h of processing time as the aw level reached ~0.85 (the cut-off for pathogenic bacterial growth) within the first 5 h of treatment. An average final aw for kale of 0.39 was recorded after 8 h of treatment (Figure 3f) as a consequence of greater heat penetration compared to tofu slices (Figure 3e). Inoculated pack data suggested that the treatments necessary to achieve the final aw used for shelf-stability would not simultaneously provide a 5 log CFU/g E. coli O157:H7 reduction. In fact, minimal overall pathogen reduction was achieved in apple or tofu. The use of an acid bath or brine prior to dehydration has been suggested as a means to decrease the initial microbial load and increase cumulative microbial inactivation in dehydration by ~1 log CFU/g [5,6,7]. Additional operational changes that increase heat distribution may also enhance inactivation rates.
Previous studies on the inactivation of E. coli in apple slices during dehydration at 62.8 °C for 6 h achieved a reduction of 3.5 log CFU/g [5] and 3.1 log CFU/g [6]. These studies utilized a higher operational temperature (62.8 °C rather than 60 °C) and only included the test samples (n = 6 to 10) alone in the entire dehydrator unit. By contrast, the dehydration unit in this study was completely filled with product (n = 575 to 1750 pieces) to better align with commercial practices. High fill density may have impeded thermal distribution. Indeed, sample product temperatures never achieved the set operational temperatures even after prolonged periods of time (Figure 3b,d,f). Dynamic processing simulations which do not account for the impact of fill density on microbial inactivation may overestimate predicted lethality. The complexity of developing accurate models for both isothermal [41,42] and dynamic processes [43] has been identified as relevant in validation, even as there has been increased recognition of the food safety challenges in low aw foods which cannot simply be controlled by preventing contamination [44,45]. The research presented here contributes to the ongoing effort to improve thermal inactivation stratagies for the growing sector of minimally processed, plant-based foods.

4. Conclusions

Dehydration of plant-based foods at moderate temperatures (≤60 °C) is representative of growing interest in minimal processing. However, depending on operational conditions, the treatments applied to achieve shelf-stability may not provide sufficient inactivation in the pathogen of concern. Minimal microbial reductions, and in the case of tofu, initial growth, were achieved under dynamic drying conditions at 60 °C, indicating that moderate temperature dehydration under the conditions assessed here does not provide an effective thermal inactivation treatment. Although the isothermal data suggested that significant E. coli O157:H7 inactivation could be achieved, that model is only appropriately applied when the temperature is between 49 and 60 °C and when the aw is ≥ 0.90. Under dynamic dehydration treatments at 60 °C, these two conditions were never achieved simultaneously. Throughout the inoculated pack experiment, the product conditions either: (i) potentially supported microbial growth (<45 °C and aw > 0.90) or (ii) were too dry to apply the isothermal inactivation model (aw < 0.90). While there have been many recent studies using isothermal data to construct models to estimate dynamic microbial inactivation in various low aw food systems, this approach would not be appropriate under the conditions of moderate temperature dehydration of plant-based foods tested here. Given the minimal lethality, additional treatments such as an initial acid wash, equipment modification to enhance thermal distribution and penetration, or an increase in the processing temperature may be necessary if a 5 log CFU/g reduction is targeted. Variation among sites within the dehydration unit and the limitations of existing modeling strategies indicate that in-unit testing may be necessary to identify critical process control parameters and validate a heat-assisted dehydration kill step for microbial food safety in plant-based food products.

Supplementary Materials

The following are available online at https://www.mdpi.com/article/10.3390/foods10092162/s1, Figure S1: Survival plots for E. coli O157:H7 cocktail (average Log CFU/g) in tofu (a) and apples (b) when treated at 60 °C for up to 24 h during inoculated pack studies at two different tray locations.

Author Contributions

Conceptualization, Y.S.R. and A.B.S.; methodology, all authors; formal analysis, Y.S.R., Q.J.S. and I.M.H.; investigation, Y.S.R. and P.M.E.; resources, A.B.S. and B.P.M.; project administration, A.B.S. All authors have read and agreed to the published version of the manuscript.

Funding

This work was supported in part by the U.S. Department of Agriculture, National Institute of Food and Agriculture (award no. 2019-68015-32341 to ABS and award no. 2015-68003-23415 to BPM).

Institutional Review Board Statement

Not applicable.

Informed Consent Statement

Not applicable.

Data Availability Statement

The data presented in this study are openly available through the following citation: Yadwinder Singh Rana, Philip M. Eberly, Quincy J. Suehr, Ian M. Hildebrandt, Bradley P. Marks, and Abigail B. Snyder. (2021) Data from: Survival of Escherichia coli O157:H7 during moderate temperature dehydration of plant-based foods. [Dataset] Cornell University eCommons Repository. https://doi.org/10.7298/tn9b-gr76.

Acknowledgments

The authors thank Ahmed Yousef of The Ohio State University for providing the microbial cultures isolates for this study.

Conflicts of Interest

The authors declare no conflict of interest.

References

  1. Beuchat, L.R.; Komitopoulou, E.; Beckers, H.; Betts, R.P.; Bourdichon, F.; Fanning, S.; Joosten, H.M.; Ter-Kuile, B.H. Low-water activity foods: Increased concern as vehicles of foodborne pathogens. J. Food Prot. 2013, 76, 150–172. [Google Scholar] [CrossRef] [PubMed]
  2. Bourdoux, S.; Li, D.; Rajkovic, A.; Devlieghere, F.; Uyttendaele, M. Performance of drying technologies to ensure microbial safety of dried fruits and vegetables. Comp. Rev. Food Sci. Food Saf. 2016, 15, 1056–1066. [Google Scholar] [CrossRef]
  3. Jayaraman, K.S.; Das-Gupta, D.K. Drying of fruits and vegetables. In Handbook of Industrial Drying, 4th ed.; Mujumdar, A.S., Ed.; CRC Press: Boca Raton, FL, USA, 2014; pp. 611–635. [Google Scholar]
  4. Saravacos, G.D.; Kostaropoulos, A.E. Food dehydration equipment. In Handbook of Food Processing Equipment, 1st ed.; Saravacos, G.D., Kostaropoulos, A.E., Eds.; Springer: New York, NY, USA, 2002; pp. 331–382. [Google Scholar]
  5. Burnham, J.A.; Kendall, P.A.; Sofos, J.N. Ascorbic acid enhances destruction of Escherichia coli O157:H7 during home-type drying of apple slices. J. Food Prot. 2001, 64, 1244–1248. [Google Scholar] [CrossRef]
  6. Derrickson-Tharrington, E.; Kendall, P.A.; Sofos, J.N. Inactivation of Escherichia coli O157:H7 during storage or drying of apple slices pretreated with acidic solutions. Int. J. Food Microbiol. 2005, 99, 79–89. [Google Scholar] [CrossRef]
  7. Dipersio, P.A.; Kendall, P.A.; Calicioglu, M.; Sofos, J.N. Inactivation of Salmonella during drying and storage of apple slices treated with acidic or sodium metabisulfite solutions. J. Food Prot. 2003, 12, 2245–2251. [Google Scholar] [CrossRef]
  8. Centers for Disease Control and Prevention (CDC). List of Selected Multistate Foodborne Outbreak Investigations. 2020. Available online: https://www.cdc.gov/foodsafety/outbreaks/multistate-outbreaks/outbreaks-list.html (accessed on 28 June 2020).
  9. European Food Safety Authority (EFSA); Panel on Biological Hazards (BIOHAZ). Scientific Opinion on the Risk Posed by Pathogens in Food of Non-Animal Origin. Part 1 (Outbreak Data Analysis and Risk Ranking of Food/Pathogen Combinations). EFSA J. 2013, 11, 3025. [Google Scholar] [CrossRef] [Green Version]
  10. Centers for Disease Control and Prevention (CDC). Multistate Outbreak of Salmonella Typhimurium Infections Linked to Dried Coconut (Final Update). 2018. Available online: https://www.cdc.gov/salmonella/typhimurium-03-18/index.html (accessed on 28 June 2020).
  11. Centers for Disease Control and Prevention (CDC). Outbreak of E. coli Infections Linked to Flour (Final Update). 2019. Available online: https://www.cdc.gov/ecoli/2019/flour-05-19/index.html (accessed on 28 June 2020).
  12. Mujumdar, A.S. Principles, classification, selection of dryers. In Handbook of Industrial Drying, 4th ed.; Mujumdar, A.S., Ed.; CRC Press: Boca Raton, FL, USA, 2014; pp. 3–30. [Google Scholar]
  13. Kiang, C.S.; Jon, C.K. Heat Pump Drying Systems. In Handbook of Industrial Drying, 4th ed.; Mujumdar, A.S., Ed.; CRC Press: Boca Raton, FL, USA, 2014; pp. 1101–1126. [Google Scholar]
  14. Cai, S.; Worobo, R.W.; Snyder, A.B. Combined effect of storage condition, surface integrity, and length of shelf life on the growth of Listeria monocytogenes and spoilage microbiota on refrigerated ready-to-eat products. J. Food Prot. 2019, 82, 1423–1432. [Google Scholar] [CrossRef] [PubMed]
  15. Food and Drug Administration (FDA). Bad Bug Book, Foodborne Pathogenic Microorganisms and Natural Toxins, 2nd ed.; Lampel, K., Al-Khaldi, S., Cahill, S., Eds.; Center for Food Safety and Applied Nutrition: Washington, DC, USA, 2012. Available online: https://www.fda.gov/files/food/published/Bad-Bug-Book-2nd-Edition-%28PDF%29.pdf (accessed on 20 December 2019).
  16. Linton, R. Food Safety Hazards in Foodservice and Food Retail Establishments. 2003. Available online: http://citeseerx.ist.psu.edu/viewdoc/download?doi=10.1.1.222.2542&rep=rep1&type=pdf (accessed on 20 December 2019).
  17. Food and Drug Administration (FDA). H.R. 2751 FDA Food Safety Modernization Act. 2011. Available online: https://www.fda.gov/food/guidance-regulation-food-and-dietary-supplements/food-safety-modernization-act-fsma (accessed on 20 February 2020).
  18. Santillana-Farakos, S.M.; Frank, J.F.; Schaffner, D.W. Modeling the influence of temperature, water activity and water mobility on the persistence of Salmonella in low-moisture foods. Int. J. Food Microbiol. 2013, 166, 280–293. [Google Scholar] [CrossRef] [PubMed] [Green Version]
  19. Valdramidis, V.P.; Geeraerd, A.H.; Gaze, J.E.; Kondjoyan, A.; Boyd, A.R.; Shaw, H.L.; Van Impe, J.F. Quantitative description of Listeria monocytogenes inactivation kinetics with temperature and water activity as the influencing factors; model prediction and methodological validation on dynamic data. J. Food Eng. 2006, 76, 79–88. [Google Scholar] [CrossRef]
  20. Villa-Rojas, R.; Tang, J.M.; Wang, S.J.; Gao, M.X.; Kang, D.H.; Mah, J.H.; Gray, P.; Sosa-Morales, M.E.; Lopez-Malo, A. Thermal inactivation of Salmonella Enteritidis PT 30 in almond kernels as influenced by water activity. J. Food Prot. 2013, 76, 26–32. [Google Scholar] [CrossRef] [Green Version]
  21. Snyder, A.B.; Perry, J.J.; Yousef, A.E. Developing and optimizing bacteriophage treatment to control enterohemorrhagic Escherichia coli on fresh produce. Int. J. Food Microbiol. 2016, 236, 90–97. [Google Scholar] [CrossRef] [Green Version]
  22. Smith, D.F.; Hilderbrandt, I.M.; Casulli, K.E.; Dolan, K.D.; Marks, B.P. Modeling the effect of temperature and water activity on the thermal resistance of Salmonella Enteritidis PT 30 in wheat flour. J. Food Prot. 2016, 79, 2058–2065. [Google Scholar] [CrossRef] [PubMed]
  23. Lenth, R. Emmeans: Estimated Marginal Means, aka Least-Squares Means. R Package Version 1.4.8. 2020. Available online: https://CRAN.R-project.org/package=emmeans (accessed on 1 September 2021).
  24. R Core Team. R: A Language and Environment for Statistical Computing; R Foundation for Statistical Computing: Vienna, Austria, 2020; Available online: https://www.R-project.org/ (accessed on 1 September 2021).
  25. Mattick, K.L.; Jorgensen, F.; Wang, P.; Pound, J.; Vandeven, M.H.; Ward, L.R.; Legan, J.D.; Lappin-Scott, H.M.; Humphrey, T.J. Effect of challenge temperature and solute type on heat tolerance of Salmonella serovars at low water activity. Appl. Environ. Microbiol. 2001, 67, 4128–4136. [Google Scholar] [CrossRef] [Green Version]
  26. Usaga, J.; Worobo, R.W.; Padilla-Zakour, O.I. Effect of acid adaptation and acid shock on thermal tolerance and survival of Escherichia coli O157:H7 and O111 in apple juice. J. Food Prot. 2014, 77, 1656–1663. [Google Scholar] [CrossRef] [PubMed]
  27. Amaha, M.; Sakaguchi, K.I. Effects of carbohydrates, proteins, and bacterial cells in the heating media on the heat resistance of Clostridium sporogenes. J. Bacteriol. 1954, 68, 338–345. [Google Scholar] [CrossRef] [PubMed] [Green Version]
  28. Buerman, E.C.; Worobo, R.W.; Padilla-Zakour, O.I. Thermal resistance of xerophilic fungi in Low-Water-Activity (0.70 to 0.80) confectionery model foods. J. Food Protect. 2019, 82, 390–394. [Google Scholar] [CrossRef]
  29. He, Y.S.; Li, Y.; Salazar, J.K.; Yang, J.Y.; Tortorello, M.L.; Zhang, W. Increased water activity reduces the thermal resistance of Salmonella enterica in peanut butter. Appl. Environ. Microbiol. 2013, 79, 4763–4767. [Google Scholar] [CrossRef] [Green Version]
  30. Gautam, B.; Govindan, B.N.; Gänzle, M.; Roopesh, M.S. Influence of water activity on the heat resistance of Salmonella enterica in selected low-moisture foods. Int. J. Food Microbiol. 2020, 334, 108813. [Google Scholar] [CrossRef]
  31. Chen, L.; Wei, X.; Chaves, B.D.; Jones, D.; Ponder, M.A.; Subbiah, J. Inactivation of Salmonella enterica and Enterococcus faecium NRRL B2354 on cumin seeds using gaseous ethylene oxide. Food Microbiol. 2021, 94, 103656. [Google Scholar] [CrossRef]
  32. Bianchini, A.; Stratton, J.; Weier, S.; Hartter, T.; Plattner, B.; Rokey, G.; Hertzel, G.; Gompa, L.; Martinez, B.; Eskridge, K.M. Use of Enterococcus faecium as a surrogate for Salmonella enterica during extrusion of a balanced carbohydrate-protein meal. J. Food Protect. 2014, 77, 75–82. [Google Scholar] [CrossRef]
  33. Zhang, S.; Zhang, L.; Cheng, T.; Guan, X.; Wang, S. Effects of water activity, temperature and particle size on thermal inactivation of Escherichia coli ATCC 25922 in red pepper powder. Food Control 2020, 107, 106817. [Google Scholar] [CrossRef]
  34. Brar, P.K.; Proano, L.G.; Friedrich, L.M.; Harris, L.J.; Danyluk, M.D. Survival of Salmonella, Escherichia coli O157:H7, and Listeria monocytogenes on raw peanut and pecan kernels stored at −24, 4, and 22 °C. J. Food Protect. 2015, 78, 323–332. [Google Scholar] [CrossRef] [PubMed]
  35. Jin, Y.; Pickens, S.R.; Hildebrandt, I.M.; Burbick, S.J.; Grasso-Kelley, E.M.; Keller, S.E.; Anderson, N.M. Thermal inactivation of Salmonella Agona in Low–Water Activity foods: Predictive models for the combined effect of temperature, water activity, and food component. J. Food Protect. 2018, 81, 1411–1417. [Google Scholar] [CrossRef] [PubMed]
  36. Jin, Y.; Tang, J.; Zhu, M. Water activity influence on the thermal resistance of Salmonella in soy protein powder at elevated temperatures. Food Control 2020, 113, 107160. [Google Scholar] [CrossRef]
  37. Liu, S.; Rojas, R.V.; Gray, P.; Zhu, M.; Tang, J. Enterococcus faecium as a Salmonella surrogate in the thermal processing of wheat flour: Influence of water activity at high temperatures. Food Microbiol. 2018, 74, 92–98. [Google Scholar] [CrossRef] [PubMed]
  38. Wei, X.; Lau, S.K.; Chaves, B.D.; Danao, M.C.; Agarwal, S.; Subbiah, J. Effect of water activity on the thermal inactivation kinetics of Salmonella in milk powders. J. Dairy Sci. 2020, 103, 6904–6917. [Google Scholar] [CrossRef] [PubMed]
  39. Zhang, S.; Zhang, L.; Lan, R.; Zhou, X.; Kou, X.; Wang, S. Thermal inactivation of Aspergillus flavus in peanut kernels as influenced by temperature, water activity and heating rate. Food Microbiol. 2018, 76, 237–244. [Google Scholar] [CrossRef]
  40. Xu, J.; Tang, J.; Jin, Y.; Song, J.; Yang, R.; Sablani, S.S.; Zhu, M. High temperature water activity as a key factor influencing survival of Salmonella Enteritidis PT30 in thermal processing. Food Control 2018, 98, 520–528. [Google Scholar] [CrossRef]
  41. Giannakourou, M.C.; Stoforos, N.G. A theoretical analysis for assessing the variability of secondary model thermal inactivation kinetic parameters. Foods 2017, 6, 7. [Google Scholar] [CrossRef] [Green Version]
  42. Lang, E.; Chemlal, L.; Molin, P.; Guyot, S.; Alvarez-Martin, P.; Perrier-Cornet, J.M.; Dantigny, P.; Gervais, P. Modeling the heat inactivation of foodborne pathogens in milk powder: High relevance of the substrate water activity. Food Res. Int. 2017, 99, 577–585. [Google Scholar] [CrossRef]
  43. Brackett, R.E.; Ocasio, W.; Waters, K.; Barach, J.; Wan, J. Validation and Verification: A practical, industry-driven framework developed to support the requirements of the Food Safety Modernization Act (FSMA) of 2011. Food Protect. Trends 2014, 34, 410–425. [Google Scholar]
  44. Brar, P.K.; Danyluk, M.D. Nuts and grains: Microbiology and preharvest contamination risks. Preharvest Food Saf. 2018, 105–121. [Google Scholar] [CrossRef]
  45. Cai, S.; Phinney, D.; Heldman, D.; Snyder, A.B. All treatment parameters affect environmental surface sanitation efficacy, but their relative importance depends on the microbial target. Appl. Environ. Microbiol. 2020, 87, e01748-20. [Google Scholar] [CrossRef] [PubMed]
Figure 1. Schematic of the dehydration unit with five sampling rack positions ranging from top (rack 4) to the bottom (rack 20) of dehydrator (Total racks in the unit = 24). Inset shows specific sampling points for inoculated pack studies with a fixed thermocouple (Thermocouple-K) location for each rack position.
Foods 10 02162 g001
Figure 2. Survival plots for E. coli O157:H7 cocktail (log CFU/g) under different treatment temperature 49.0 °C (■), 54.5 °C (▲), and 60.0 °C (●) over time (min) during isothermal studies. Columns represent different food samples (tofu, apple, or kale) and rows represent different aw levels (0.99 ± 0.01, 0.95 ± 0.05, or 0.90 ± 0.05).
Foods 10 02162 g002
Figure 3. Survival plots for E. coli O157:H7 cocktail (log CFU/g) (Left) and simultaneous changes in sample temperature (solid lines) and aw (dashed lines) over time (Right) during dehydration of tofu (a,b), apple (c,d), and kale (e,f) at 60.0 °C. Symbols indicate sample location by rack number 4 (▲), 8 (♦), 12 (●), 16 (X), and 20 (■).
Foods 10 02162 g003
Table 1. Thermal inactivation kinetics for E. coli O157:H7 in apples, tofu, and kale determined using modified Bigelow-type models based on (Equation (2)) temperature or (Equation (3)) temperature and aw during isothermal studies.
ProductEstimations from Equation (2) (Temperature Only)Estimations from Equation (3) (Temperature & aw)
awTemp (°C)D-Value (min ± SE)z-Value (°C ± SE)RMSE
(log CFU/g)
D49°C
(min ± SE)
z-Value (°C ± SE)Raw
(Unitless ± SE)
RMSE
(log CFU/g)
Apple0.994978.2 ± 8.27.4 ± 0.61.2671.9 ± 10.18.7 ± 0.51.1 ± 0.71.54
54.519.3 ± 2.3
603.0 ± 0.5
0.954945.9 ± 3.98.9 ± 1.11.86
54.525.2 ± 2.9
603.5 ± 0.5
0.94954.5 ± 6.810.9 ± 1.21.12
54.523.1 ± 2.5
605.5 ± 0.8
Tofu0.9949173.3 ± 35.16.9 ± 0.31.31107.3 ± 14.27.7 ± 0.40.6 ± 0.51.24
54.524.1 ± 1.6
603.8 ± 0.3
0.9549173.5 ± 16.66.9 ± 0.41.11
54.543.3 ± 4.5
606.1 ± 0.8
0.949107.6 ± 12.77.6 ± 0.81.18
54.555.4 ± 4.6
606.7 ± 0.6
Kale0.9949174.1 ± 27.27.5 ± 0.60.62143.9 ± 17.07.0 ± 0.33.3 ± 0.50.75
54.519.6 ± 2.8
603.8 ± 0.4
0.9549257.4 ± 71.07.1 ± 0.50.64
54.522.8 ± 3.0
604.0 ± 0.4
0.94986.3 ± 10.88.7 ± 0.80.82
54.522.2 ± 3.1
604.8 ± 0.8
Publisher’s Note: MDPI stays neutral with regard to jurisdictional claims in published maps and institutional affiliations.

