
Eco-Inefficiency Formula: A Method to Verify the Cost of the Economic, Environmental, and Social Impact of Waste in Food Services

 ,
,  , , and
Abstract
: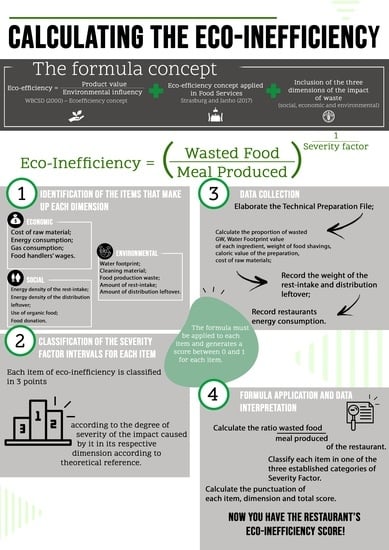
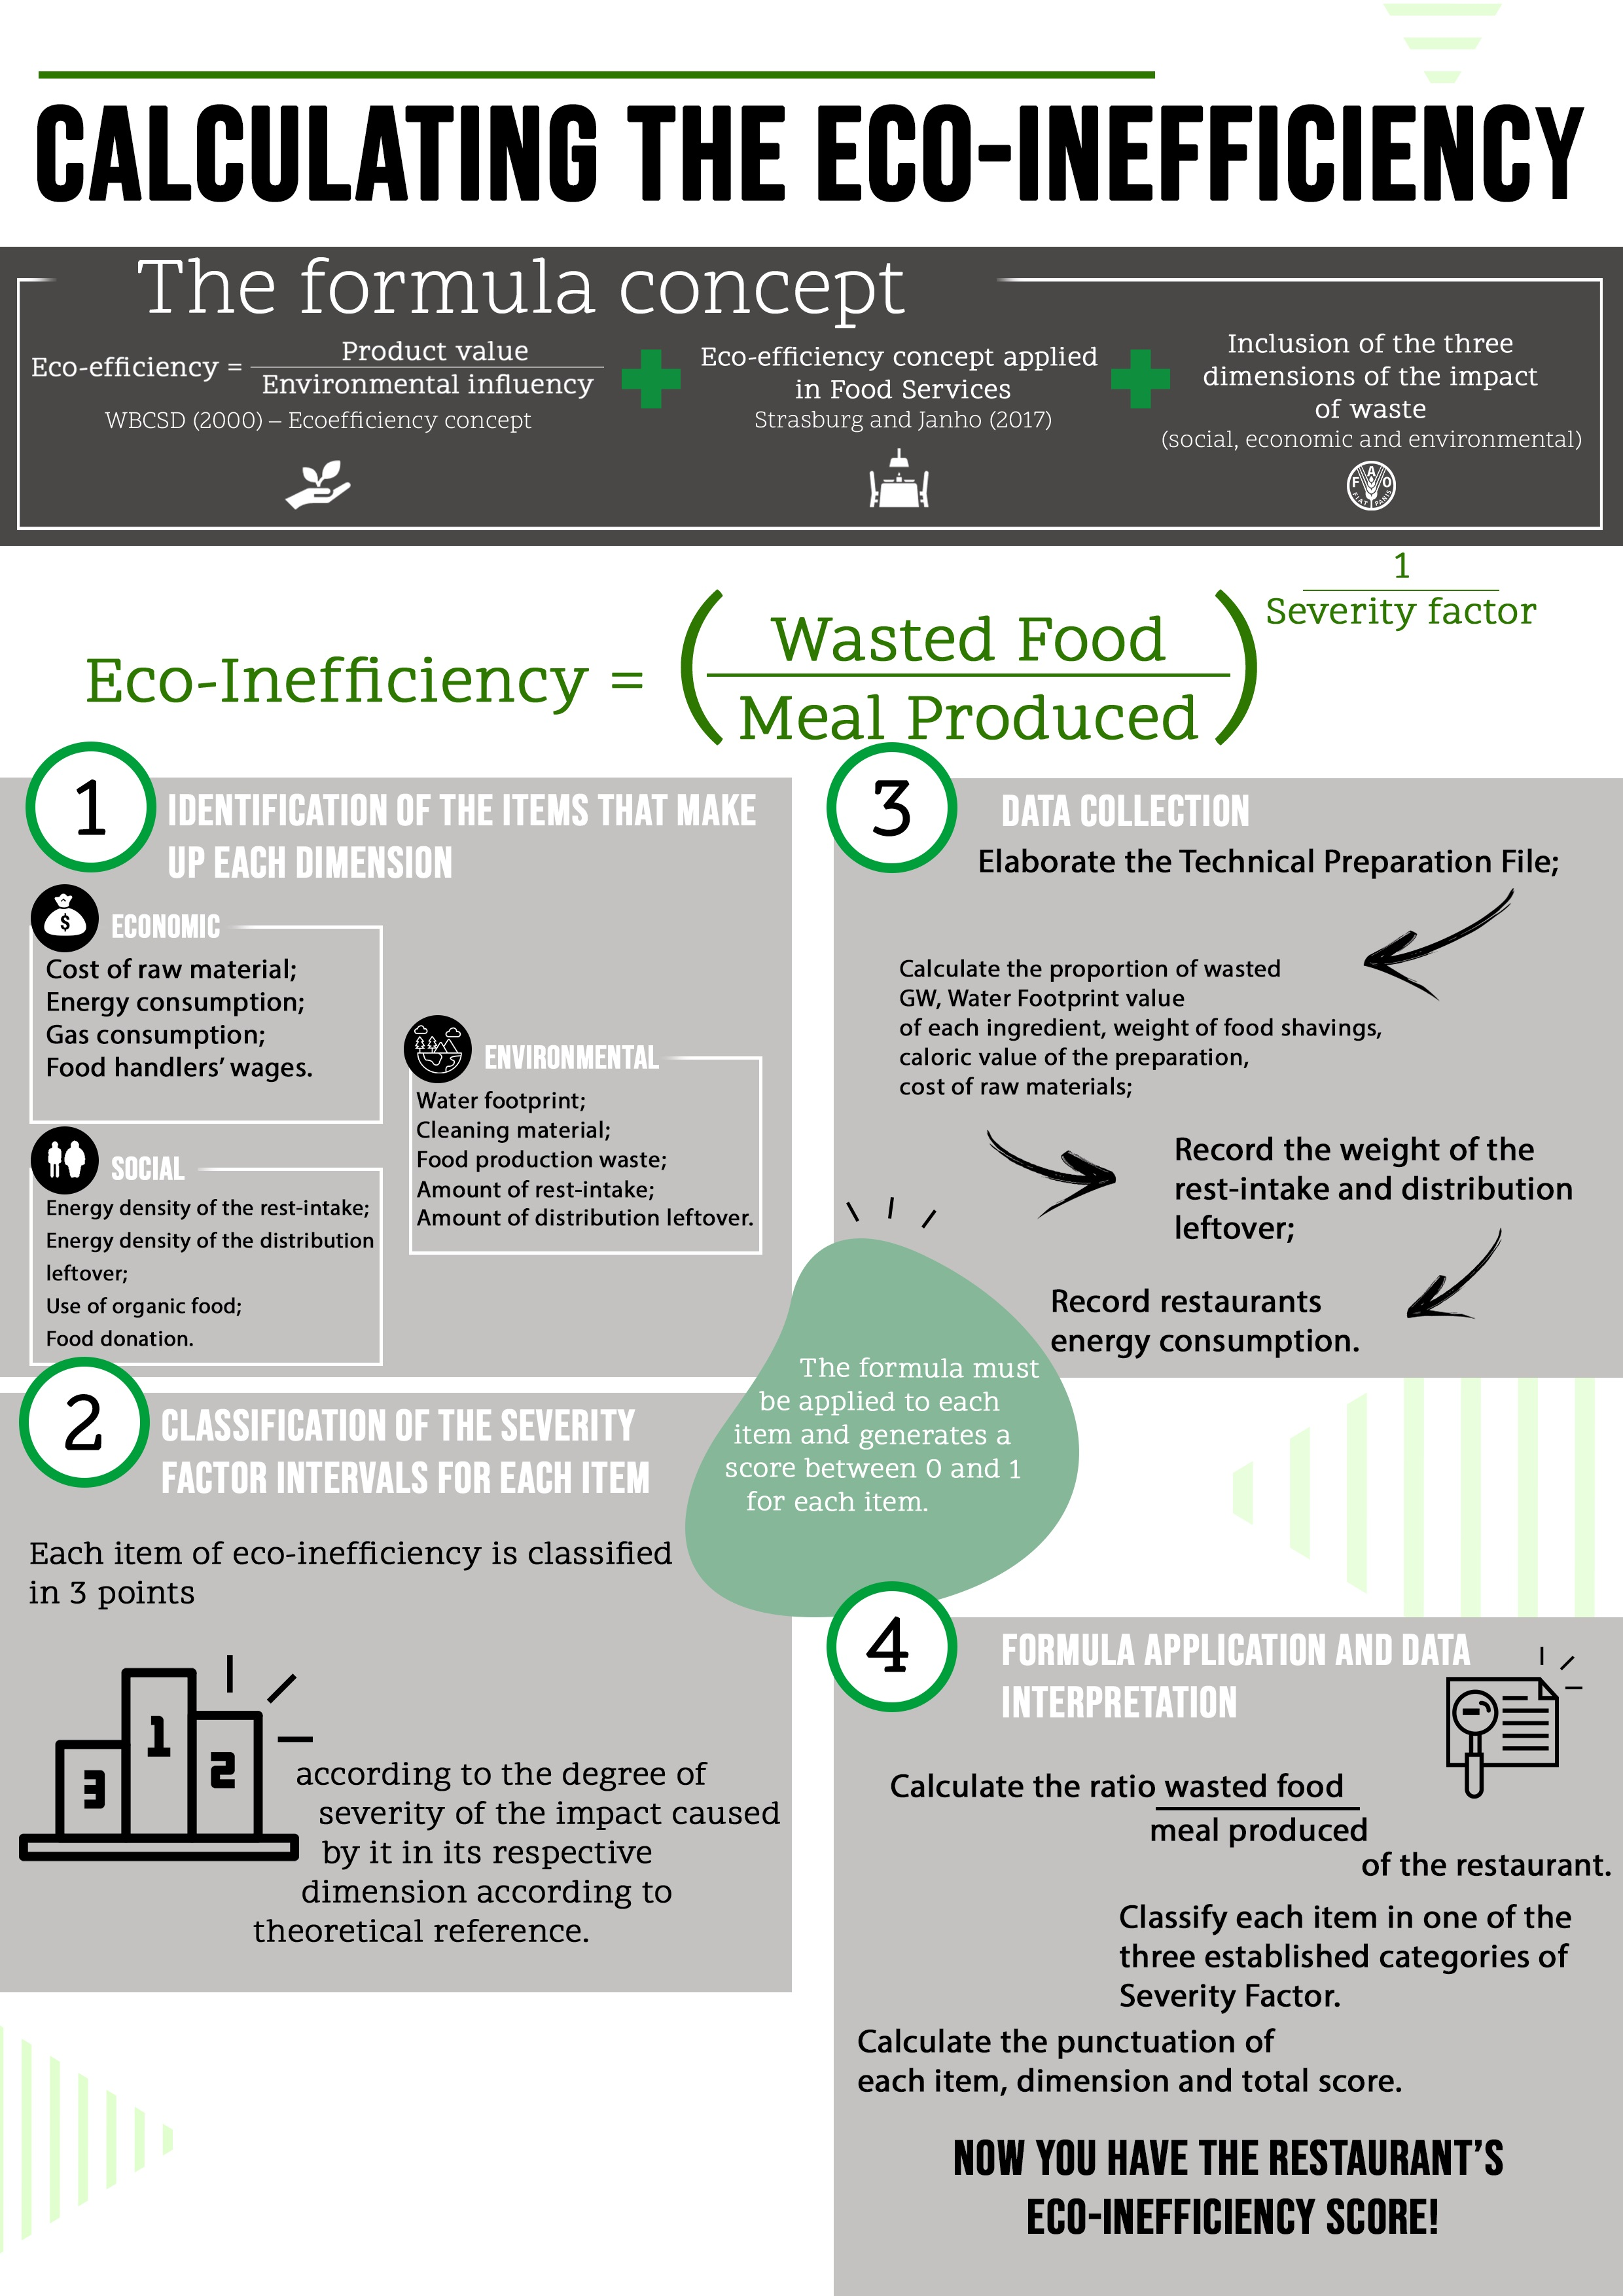
1. Introduction
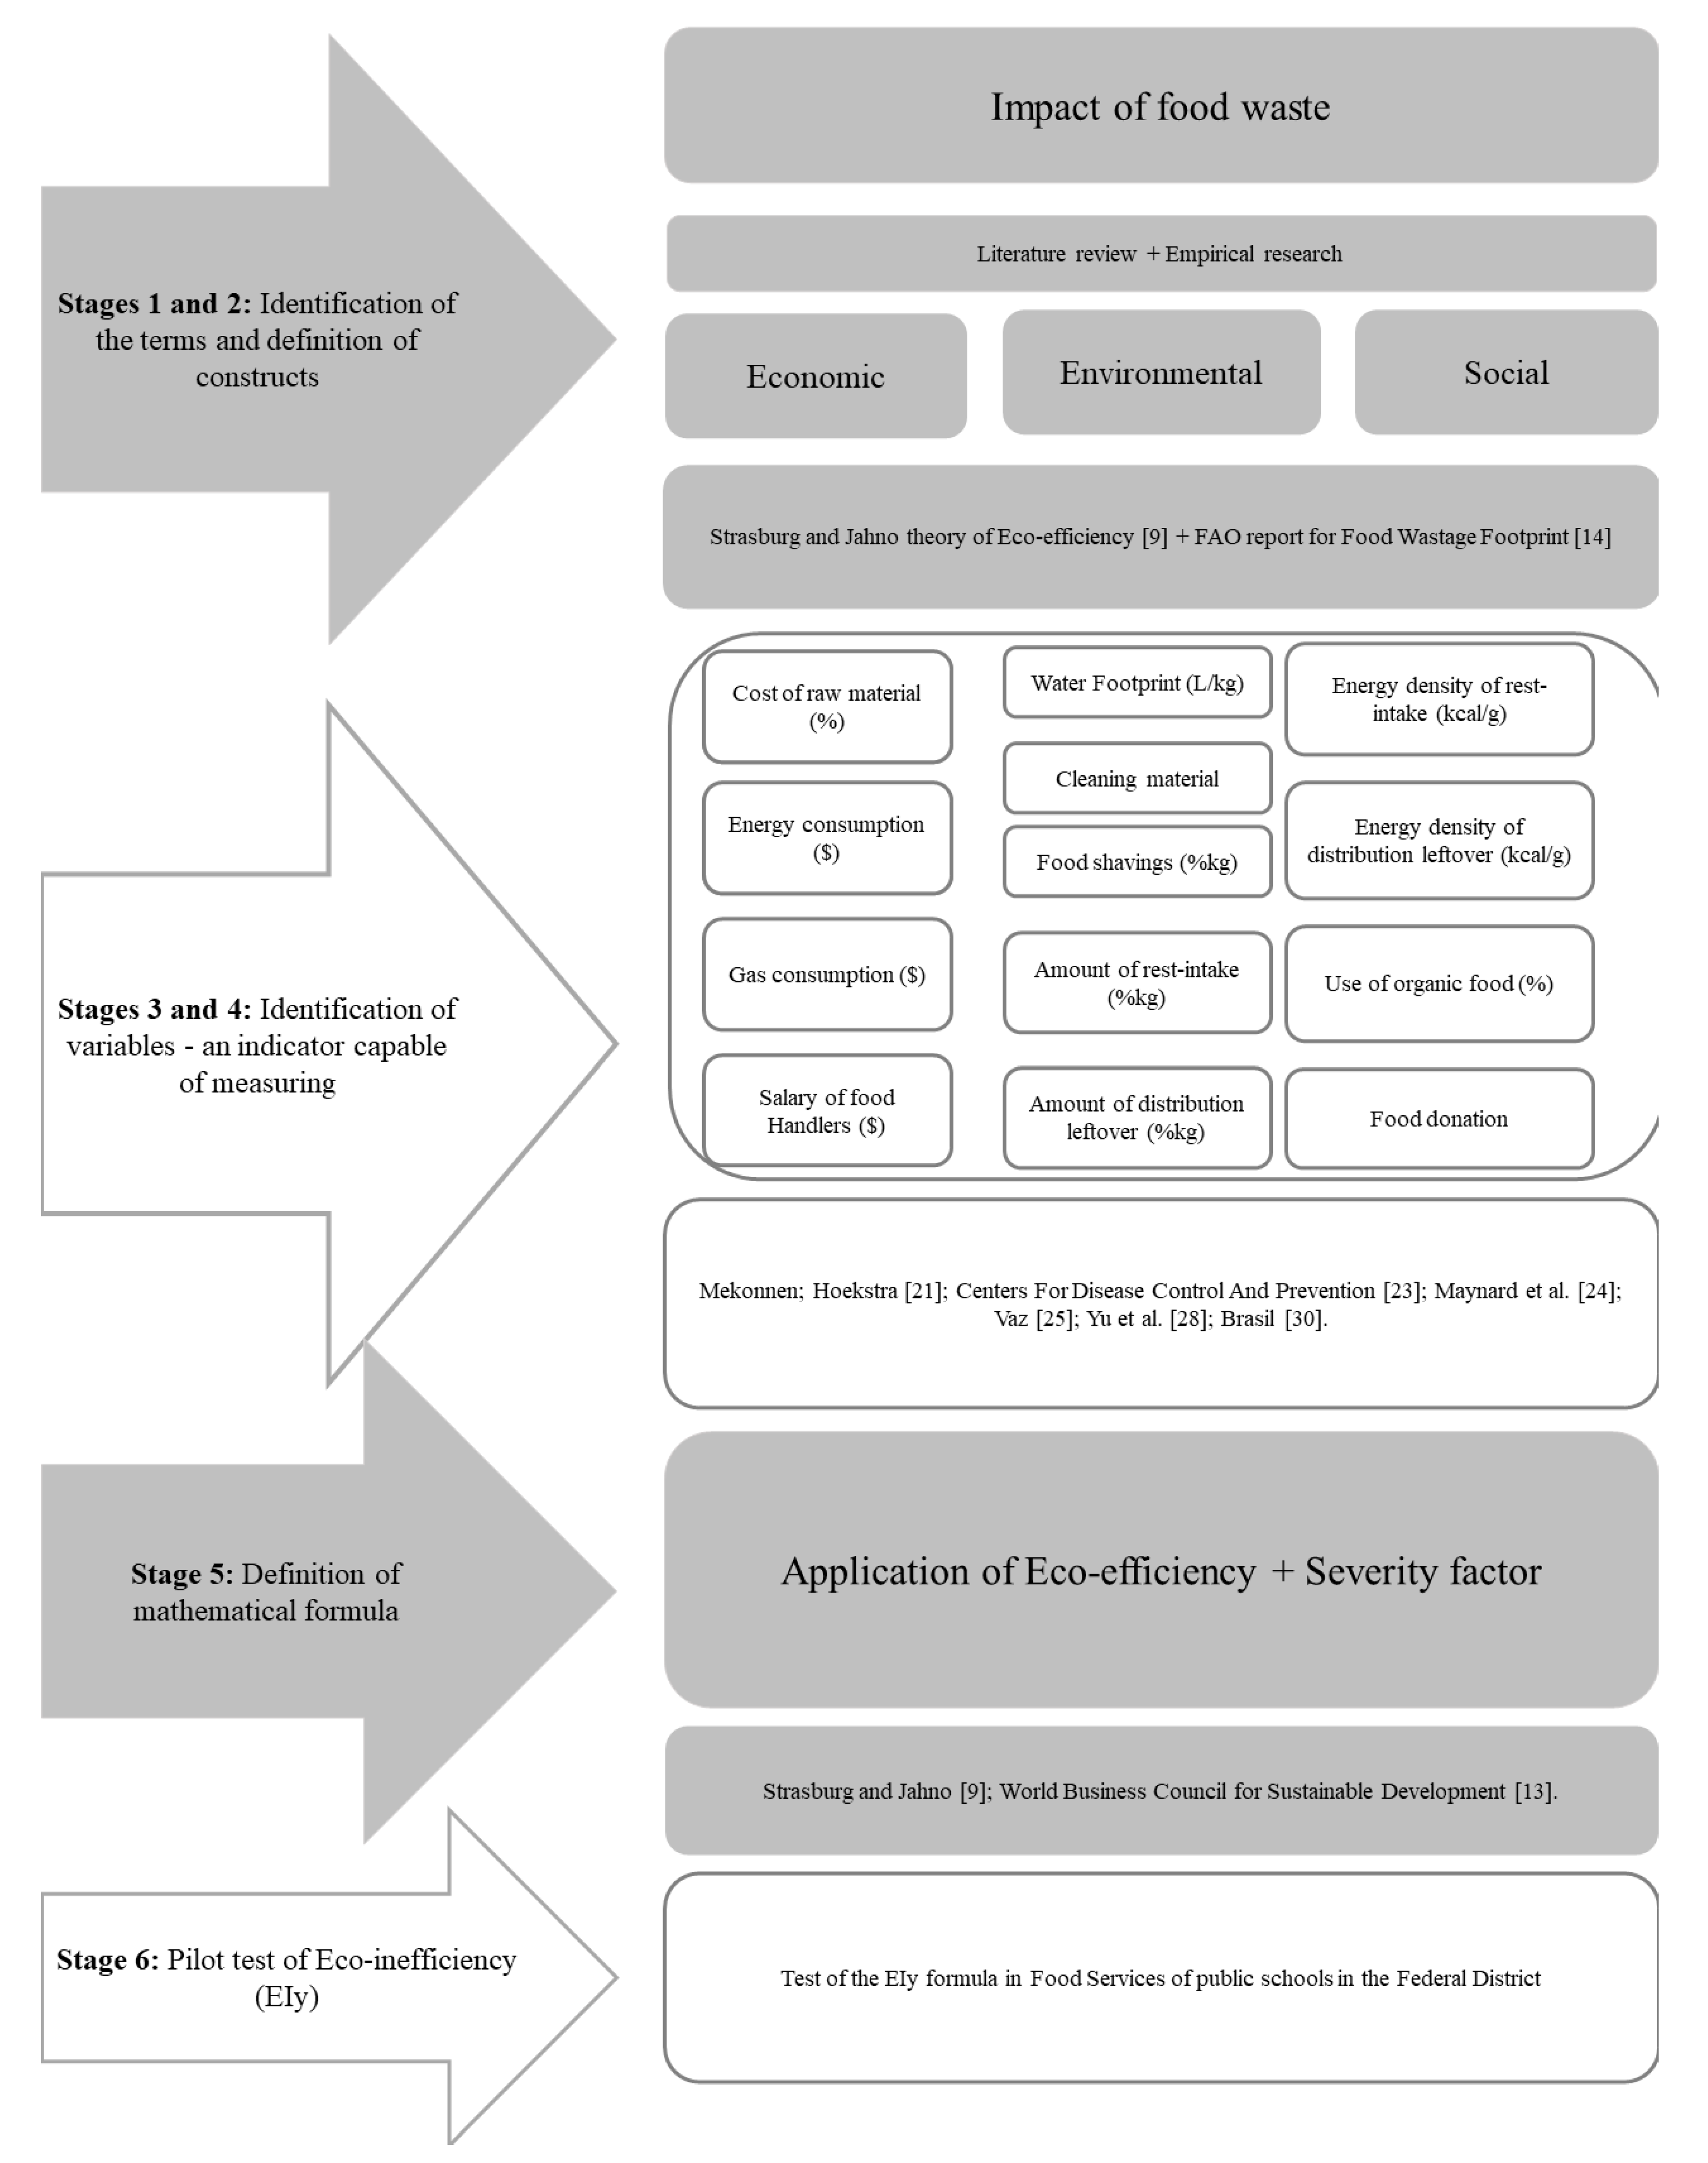
2. Materials and Methods
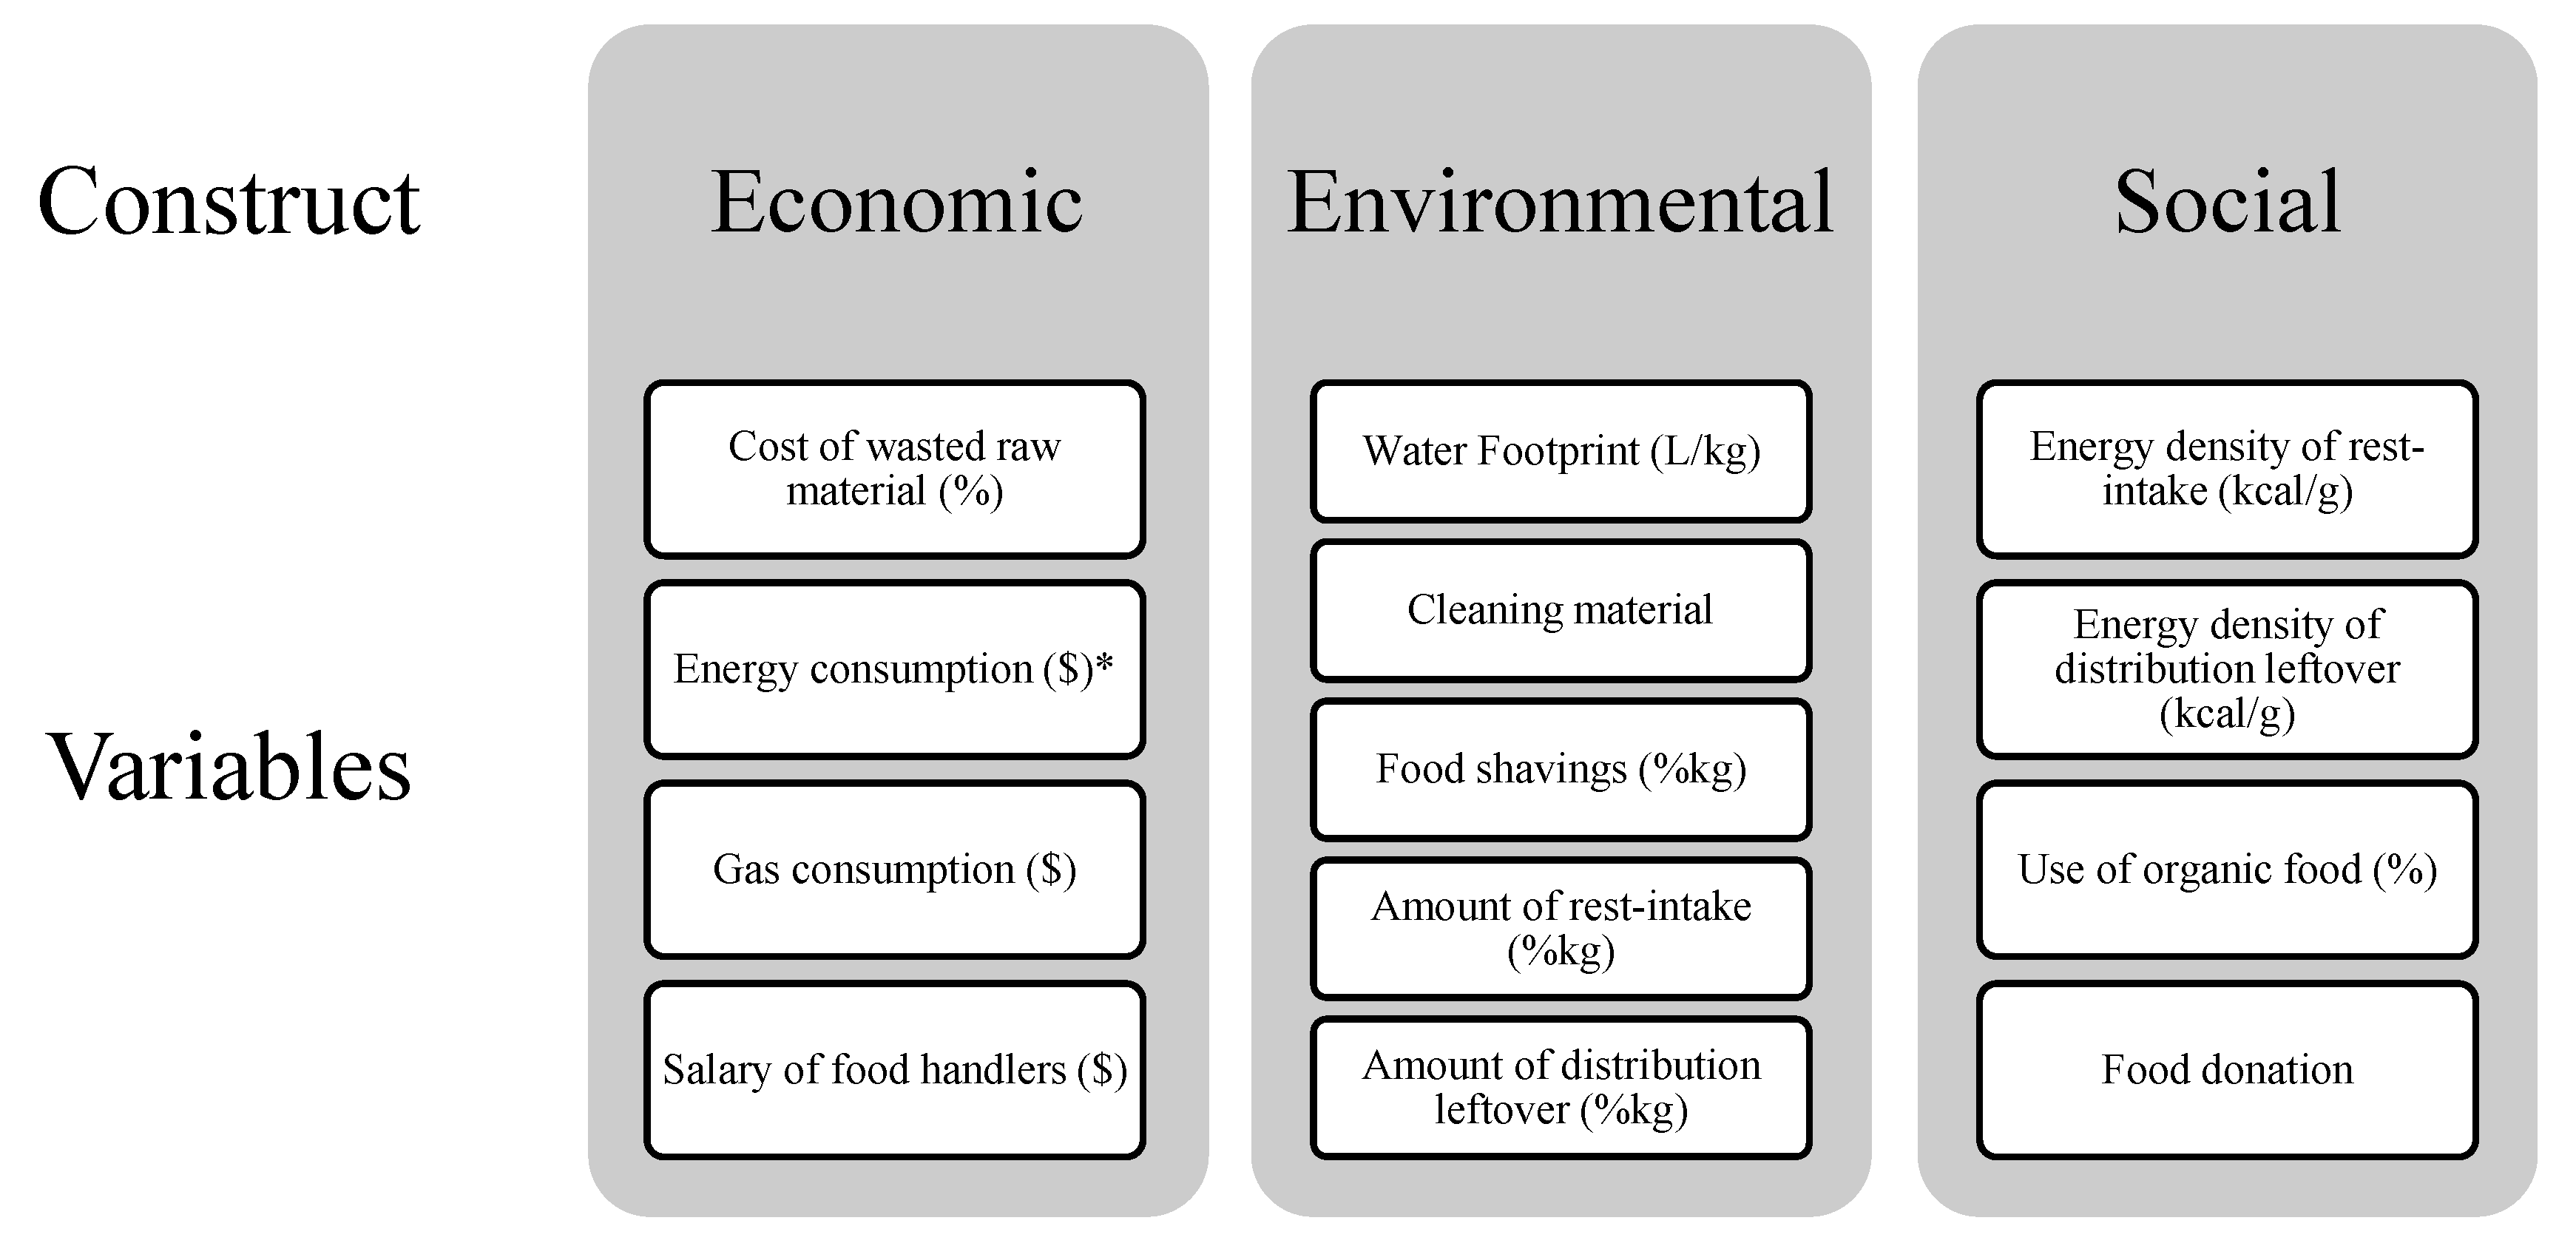
2.1. Identification of the Terms, Variables, and Definition of Constructs
2.2. Definition of Mathematical Formula
2.3. A Pilot Test of the Eco-Inefficiency Formula
- WGW—wasted gross weight.
- AWF—amount of wasted food.
- GW—gross weight.
- YP—yield preparation.
- WRM— wasted raw material.
- WGW—wasted gross weight.
- GW—gross weight.
- LPG—liquefied petroleum gas.
- YP—yield preparation.
- RI—rest-intake.
- WRI—wasted rest-intake.
- DL—distribution leftover.
- WDL—wasted distribution leftover.
- YM—yield of the meal.
- ED—energy density.
- EV—energy value (kcal).
- FW—food weight (g).
3. Results and Discussion
3.1. EIy Formula
Defined Parameters for the Application of EIy Formula
3.2. Pilot Study
4. Conclusions
Supplementary Materials
Author Contributions
Funding
Institutional Review Board Statement
Informed Consent Statement
Data Availability Statement
Acknowledgments
Conflicts of Interest
References
- Papargyropoulou, E.; Wright, N.; Lozano, R.; Steinberger, J.; Padfield, R.; Ujang, Z. Conceptual framework for the study of food waste generation and prevention in the hospitality sector. Waste Manag. 2016, 49, 326–336. [Google Scholar] [CrossRef] [PubMed]
- Food and Agriculture Organization of the United Nations. Food Wastage Footprint: Impacts on Natural Resources—Summary Report; FAO: Rome, Italy, 2013; 63p. [Google Scholar]
- Galdino, M.A.E.; Lima, J.H.G.; Ribeiro, C.M.; Serra, E.T. O Contexto das Energias Renováveis no Brasil. Revista da DIRENG, Rio de Janeiro, Brazil, 2000; 17–25. [Google Scholar]
- Peixoto, M.; Pinto, H.S. Desperdício de alimentos: Questões socioambientais, econômicas e regulatórias. Bol. Legis. 2016, 41, 1–14. [Google Scholar]
- ONU, Organização das Nações Unidas. Transformando Nosso Mundo: A Agenda 2030 para o Desenvolvimento Sustentável. 2015. Available online: https://nacoesunidas.org/pos2015/agenda2030/ (accessed on 31 January 2020).
- De los Mozos, E.A.; Badurdeen, F.; Dossou, P.E. Sustainable consumption by reducing food waste: A review of the current state and directions for future research. Procedia Manuf. 2020, 51, 1791–1798. [Google Scholar] [CrossRef]
- Lins, M.; Zandonadi, R.P.; Raposo, A.; Ginani, V.C. Food Waste on Foodservice: An Overview through the Perspective of Sustainable Dimensions. Foods 2021, 10, 1175. [Google Scholar] [CrossRef]
- Dhir, A.; Talwar, S.; Kaur, P.; Malibari, A. Food waste in hospitality and food services: A systematic literature review and framework development approach. J. Clean. Prod. 2020, 270, 122861. [Google Scholar] [CrossRef]
- Strasburg, V.J.; Jahno, V.D. Application of eco-efficiency in the assessment of raw materials consumed by university restaurants in Brazil: A case study. J. Clean. Prod. 2017, 161, 178–187. [Google Scholar] [CrossRef]
- Konstantas, A.; Stamford, L.; Azapagic, A. Economic sustainability of food supply chains: Life cycle costs and value added in the confectionary and frozen desserts sectors. Sci. Total Environ. 2019, 670, 902–914. [Google Scholar] [CrossRef] [Green Version]
- Gadanakis, Y.; Bennett, R.; Park, J.; Areal, F.J. Evaluating the Sustainable Intensification of arable farms. J. Environ. Manag. 2015, 150, 288–298. [Google Scholar] [CrossRef] [PubMed] [Green Version]
- Hengen, T.J.; Sieverding, H.L.; Cole, N.A.; Ham, J.M.; Stone, J.J. Eco-efficiency model for evaluating feedlot rations in the great plains, United States. J. Environ. Qual. 2016, 45, 1234–1242. [Google Scholar] [CrossRef]
- World Business Council for Sustainable Development (WBCSD). Eco-Efficiency: Creating More Value with Less Impact; WBCSD: Conches-Geneva, Switzerland, 2000; ISBN 9782940240173. [Google Scholar]
- Food and Agriculture Organization of the United Nations. Food Wastage Footprint: Full-Cost Accounting—Final Report; Rome, Italy, 2014. Available online: www.fao.org/publications (accessed on 26 November 2019).
- De Melo, E.V.; Dolabella, R.; Peixoto, M.; Pinheiro, A. Perdas e Desperdício de Alimentos [Recurso Eletrônico]: Estratégias Para Redução; Brasília, Ed.; Câmara dos Deputados: Brasília, Brazil, 2018; ISBN 978-85-402-0718-9 (e-book). [Google Scholar]
- Parfitt, J.; Barthel, M.; Macnaughton, S. Food waste within food supply chains: Quantification and potential for change to 2050. Philos. Trans. R. Soc. B Biol. Sci. 2010, 365, 3065–3081. [Google Scholar] [CrossRef] [Green Version]
- Sellitto, M.A.; Ribeiro, J.L.D. Construção de indicadores para avaliação de conceitos intangíveis em sistemas produtivos. Gestão Produção 2004, 11, 75–90. [Google Scholar] [CrossRef] [Green Version]
- CEB (Companhia Energética de Brasília). Tudo Sobre a Conta de Luz. Available online: http://ceb.com.br/index.php/tudo-sobre-a-conta-de-luz/370-tudo-sobre-a-conta-de-luz. (accessed on 4 April 2019).
- Eficiência Máxima Eficiência Energética. Como Calcular o Consumo de Energia Elétrica. Available online: https://www.eficienciamaxima.com.br/como-calcular-o-consumo-de-energia-eletrica/ (accessed on 4 April 2019).
- Hoekstra, A. The water footprint: Water in the supply chain. In The Environmentalist; Springer: New York, NY, USA, 2010; pp. 12–13. [Google Scholar]
- Mekonnen, M.M.; Hoekstra, A.Y. The green, blue and grey water footprint of crops and derived crop products. Hydrol. Earth Syst. Sci 2011, 15, 1577–1600. [Google Scholar] [CrossRef] [Green Version]
- Ricarte, M.P.R.; Fé, M.A.B.M.; Santos, I.H.V.; Lopes, A.K.M. Avaliação do Desperdício de Alimentos em uma Unidade de Alimentação e Nutrição Institucional em Fortaleza-CE. Revista Saber Científico 2008, 1, 158–175. [Google Scholar]
- Centers for Disease Control and Prevention. Can eating fruits and vegetables help people to manage their weight? Res. Pract. Ser. 2005, 1, 1–6. Available online: https://www.cdc.gov/nccdphp/dnpa/nutrition/pdf/rtp_practitioner_10_07.pdf (accessed on 1 January 2019).
- Maynard, D.d.C.; Vidigal, M.D.; Farage, P.; Zandonadi, R.P.; Nakano, E.Y.; Botelho, R.B.A. Environmental, Social and Economic Sustainability Indicators Applied to Food Services: A Systematic Review. Sustainability 2020, 12, 1804. [Google Scholar] [CrossRef] [Green Version]
- Vaz, C.S. Restaurantes Controlando Custos e Aumentando Lucros; Metha: Brasília, Brazil, 2006. [Google Scholar]
- Companhia Pernambucana de Gás (Copergás). Tarifas. Available online: https://www.copergas.com.br/atendimento-ao-cliente/tarifas/ (accessed on 4 April 2019).
- Instituto Brasileiro de Geografia e Estatística. Pesquisa de Orçamentos Familiares 2017–2018: Primeiros Resultados; 2019. Available online: https://biblioteca.ibge.gov.br/visualizacao/livros/liv101670.pdf (accessed on 10 October 2020).
- Yu, Y.; Hubacek, K.; Feng, K.; Guan, D. Assessing regional and global water footprints for the UK. Ecol. Econ. 2010, 69, 1140–1147. [Google Scholar] [CrossRef]
- FNDE. Resolução No 26, De 17 De Junho De 2013—Ministério da Educação: Brasília, Brazil; 2013. Available online: https://www.in.gov.br/materia/-/asset_publisher/Kujrw0TZC2Mb/content/id/30683767/do1-2013-06-18-resolucao-n-26-de-17-de-junho-de-2013-30683763 (accessed on 10 October 2020).
- Brasil. Lei no 14.016, de 24 de junho de 2020. Available online: http://www.planalto.gov.br/ccivil_03/_ato2019-2022/2020/lei/L14016.htm (accessed on 10 October 2020).
- Goossens, Y.; Wegner, A.; Schmidt, T. Sustainability Assessment of Food Waste Prevention Measures: Review of Existing Evaluation Practices. Front. Sustain. Food Syst. 2019, 3, 90. [Google Scholar] [CrossRef]
- IBGE. Pesquisa de Orçamentos Familiares 2002–2003—Primeiros Resultados; IBGE: Rio de Janeiro, Brazil, 2004. [Google Scholar]
- Lovarelli, D.; Ingrao, C.; Fiala, M.; Bacenetti, J. Beyond the Water Footprint: A new framework proposal to assess freshwater environmental impact and consumption. J. Clean. Prod. 2018, 172, 4189–4199. [Google Scholar] [CrossRef]
- Bleninger, T.; Kotsuka, L.K. Conceitos de água virtual e pegada hídrica: Estudo de caso da soja e óleo de soja no Brasil. Rev. Recur. Hídricos 2015, 36, 15–24. [Google Scholar] [CrossRef] [Green Version]
- De Laurentiis, V.; Hunt, D.V.L.; Rogers, C.D.F. Contribution of school meals to climate change and water use in England. Energy Procedia 2017, 123, 204–211. [Google Scholar] [CrossRef]
- Aleksandrowicz, L.; Green, R.; Joy, E.J.M.; Smith, P.; Haines, A. The Impacts of Dietary Change on Greenhouse Gas Emissions, Land Use, Water Use, and Health: A Systematic Review. PLoS ONE 2016, 11, e0165797. [Google Scholar] [CrossRef] [Green Version]
- Roche, E.J. The Environmental Impact of Cleaning Products. Available online: https://www.pjponline.com/the-environmental-impact-of-cleaning-products/#:~:text=Commercial%20use%20of%20cleaning%20products,lead%20to%20pollution%20and%20waste.&text=Air%20Pollution%20%E2%80%93%20Volatile%20organic%20compounds,to%20carbon%20emissions%20from%20trucks (accessed on 10 October 2020).
- Levis, J.W.; Barlaz, M.A.; Themelis, N.J.; Ulloa, P. Assessment of the state of food waste treatment in the United States and Canada. Waste Manag. 2010, 30, 1486–1494. [Google Scholar] [CrossRef]
- Papargyropoulou, E.; Steinberger, J.K.; Wright, N.; Lozano, R.; Padfield, R.; Ujang, Z. Patterns and causes of food waste in the hospitality and food service sector: Food waste prevention insights from Malaysia. Sustainability 2019, 11, 6016. [Google Scholar] [CrossRef] [Green Version]
- Araújo, W.M.; Montebello, N.P.; Botelho, R.B.A.; Borgo, L.A. Alquimia dos Alimentos; Senac: Brasília, Brazil, 2014; p. 557. [Google Scholar]
- Reynolds, C.; Soma, T.; Spring, C.; Lazell, J. Routledge Handbook of Food Waste, 1st ed.; Routledge: London, UK, 2020; Volume 1. [Google Scholar]
- Macedo, J.L.; de Brito, A.N.M.; Carvalho, S.D.L.; de Oliveira, J.V.F.; Brito, F.N.M. Avaliação do índice de resto-ingestão em unidade de alimentação e nutrição de um município do Maranhão. Res. Soc. Dev. 2020, 9, 140911817. [Google Scholar] [CrossRef]
- Viana, K.L.S.; Souza, A.L.M. De avaliação do indice de resto ingestão, antes e durante uma campanha educativa, em unidade de alimentação e nutrição (uan), porto velho –ro. Connect. LINE Rev. Eletrônica Do Univag 2016. [Google Scholar] [CrossRef] [Green Version]
- De Augustini, V.C.M.; Kishimoto, P.; Tescaro, T.C.; de Almeida, F.Q.A. Avaliação do índice de resto-ingesta e sobras em unidade de alimentação e nutrição (uan) de uma empresa metalúrgica na cidade de piracicaba/sp. Rev. Simbio Logias 2008, 1, 99–110. [Google Scholar]
- Ferreira, J.A.; dos Santos, C.H.P.; Pereira, A.J.S.; de Barros Britto, M.; dos Santos, D.R.; Britts, L.T. Avaliação da sobra limpa e resto ingesta de um ceinf em campo grande-ms. Ens. Ciência Ciências Biol. Agrárias Saúde 2012, 16, 83–94. [Google Scholar]
- De Matos, G.M.S.; Vasconcelos, T.S.; Boudou, F.; Bernardino, L. Avaliação do índice de resto-ingesta e sobras em uma unidade de alimentação e nutrição (uan) em uma rede hoteleira de aracaju/se. Rev. Hórusv 2015, 10, 94–106. [Google Scholar]
- General Assembly of the United Nations. Universal Declaration of Human Rights; General Assembly of the United Nations: New York, NY, USA, 1948. [Google Scholar]
- United Nations Environment Programme (UNEP). Guidelines for Social Life Cycle Assessment of Products; UNEP: Paris, France, 2009; pp. 1–104. ISBN 9789280730210. [Google Scholar]
- Ginani, V.C.; Araújo, W.M.C.; Botelho, R.B.A.; Akutsu, R.C.C.A.; Zandonadi, R.P. What is Offered by Public Foodservices for Low Income Population in Brazil is Adequate to Health Promotion Regarding Energy Density. J. Culin. Sci. Technol. 2017, 1–13. [Google Scholar] [CrossRef]
- Neff, R.A.; Spiker, M.L.; Truant, P.L. Wasted Food: U.S. Consumers’ Reported Awareness, Attitudes, and Behaviors. PLoS ONE 2015, 10, e0127881. [Google Scholar] [CrossRef] [Green Version]
- Soares, I.C.C.; da Silva, E.R.; Priore, S.E.; de Ribeiro, R.C.L.; da Pereira, M.M.L.S.; Pinheiro-Sant’ana, H.M. Quantificaçáo e análise do custo da sobra limpa em unidades de alimentaçáo e nutriçáo de uma empresa de grande porte. Rev. Nutr. 2011, 24, 593–604. [Google Scholar] [CrossRef] [Green Version]
- De Sousa, A.P.M.; Souza, F.L.; dos Duarte, E.C.P.S.; de Cabral, S.M.R.; Dos Santos, M.M. Perfil socioeconômico de manipuladores de alimentos da rede municipal de ensino de um município Piauiense. Braz. Appl. Sci. Rev. 2019, 3, 908–917. [Google Scholar]
- Vittuari, M.; De Menna, F.; Gaiani, S.; Falasconi, L.; Politano, A.; Dietershagen, J.; Segrè, A. The Second Life of Food: An Assessment of the Social Impact of Food Redistribution Activities in Emilia Romagna, Italy. Sustainability 2017, 9, 1817. [Google Scholar] [CrossRef] [Green Version]
- Richter, B.; Bokelmann, W. Approaches of the German food industry for addressing the issue of food losses. Waste Manag. 2016, 48, 423–429. [Google Scholar] [CrossRef] [PubMed]
- Sakaguchi, L.; Pak, N.; Potts, M.D. Tackling the issue of food waste in restaurants: Options for measurement method, reduction and behavioral change. J. Clean. Prod. 2018, 180, 430–436. [Google Scholar] [CrossRef] [Green Version]
- Gomes, F.C.B.; Arakaki, F.F.S.; de Antunes, R.M.M.S.; Silva, J.P.S.S.O. Ordenamento Jurídico Brasileiro no Combate ao Desperdício de alImentos: Um Comparativo com a Legislação Estrangeira e um Estudo de Caso Sobre Manhuaçu-MG; UNIFACIG: Manhuaçu, Brazil, 2019; Available online: http://pensaracademico.unifacig.edu.br/index.php/semiariocientifico/article/viewFile/1135/1068 (accessed on 20 January 2020).
- OrganicsNet. Rede Save Food Brasil: Uma Iniciativa Contra o Desperdício de Alimentos. Available online: http://www.organicsnet.com.br/2017/01/rede-save-food-brasil-uma-iniciativa-contra-o-desperdicio-de-alimentos/ (accessed on 20 January 2020).
- Iniciativa Sem desperdício. Available online: http://www.semdesperdicio.org/ (accessed on 20 January 2020).
- Roe, B.E.; Qi, D.; Bender, K.E. Some issues in the ethics of food waste. Physiol. Behav. 2020, 219, 112860. [Google Scholar] [CrossRef]
- Moreira, J.C.; Jacob, S.C.; Peres, F.; Lima, J.S.; Meyer, A.; Oliveira-Silva, J.J.; Sarcinelli, P.N.; Batista, D.F.; Egler, M.; Faria, M.V.C.; et al. Avaliação integrada do impacto do uso de agrotóxicos sobre a saúde humana em uma comunidade agrícola de Nova Friburgo, RJ. Cien. Saude Colet. 2002, 7, 299–311. [Google Scholar] [CrossRef]
- SEBRAE. Pesquisa com Produtores Orgânicos. 2018. Available online: https://www.sebrae.com.br/Sebrae/Portal%20Sebrae/Anexos/Pesquisa%20com%20Produtores%20Org%C3%A2nicos%202018%20Sebrae_21.6.2018.pdf (accessed on 10 October 2020).
- Ministério da Educação (MEC). Balanço MEC 2019; MEC: Brasília, Brazil, 2019. Available online: http://portal.mec.gov.br/images/Balanco-MEC-2019.pdf (accessed on 5 February 2020).
- Derqui, B.; Fernandez, V.; Fayos, T. Towards more sustainable food systems. Addressing food waste at school canteens. Appetite 2018, 129, 1–11. [Google Scholar] [CrossRef]
- Aschemann-Witzel, J.; de Hooge, I.; Amani, P.; Bech-Larsen, T.; Oostindjer, M. Consumer-related food waste: Causes and potential for action. Sustainability 2015, 7, 6457–6477. [Google Scholar] [CrossRef] [Green Version]
- Brasil, Ministerio do Turismo (MTUR). Segmentação do Turismo: Marcos conceituais. Brasília, Brazil, 2012. [Google Scholar]
- Brasil, M.S.; Ufrgs, C. Guia de Instruções das Ferramentas para as Boas Práticas na Alimentação Escolar; 2013. Available online: https://www.fnde.gov.br/index.php/centrais-de-conteudos/publicacoes/category/116-alimentacao-escolar?download=12363:guia-de-instrucoes-ferramenta-bp (accessed on 8 February 2020).
- Pedraza, D.F.; de Melo, N.L.S.; Araujo, E.M.N.; Silva, F.A.O. Programa Nacional de Alimentação Escolar em Escolas Públicas Municipais. Rev. Bras. Promoção Saúde 2017, 30, 161–169. [Google Scholar] [CrossRef]


| Economic dimension | ||||
|---|---|---|---|---|
| Item | Definition | Reference | Parameter evaluated in the restaurant | Classification |
| Cost of raw material in food waste (%) | The proportion of the cost of wasted raw material. | Best considered values are below 3% [25]. | Value of acquisition of each ingredient used. |
|
| Gas consumption | Volume of the gas cylinder and frequency of its change. | Fare range for industrial and commercial clients—conventional consumption made available by a Brazilian company [26]. Consumption ranges are considered low, medium, or high by the local company. | Information provided by the evaluated establishment (m3 LPG/day). |
|
| Energy | Energy consumption during food production. | Values provided by the electricity company where the restaurant is located [18]. | Record of the connected devices, daily operating time for each device, and the average consumption declared by the manufacturer. |
|
| Salary of food handlers | Food handlers’ mean wage per day. | Distributed in low, medium, and high according to the last classification made by IBGE [27]. | The daily mean wage of a food handler wasted. |
|
| Environmental Dimension | ||||
| Water footprint (WF) | Water volume used directly or indirectly in the production of food for Ely formula, the WF of the wasted food. | Animal ingredients [20]. Vegetal ingredients [21,28]. | Cutoff points are defined by terciles (pilot study). |
|
| Cleaning material | Proper use of the product according to the manufacturer’s recommendation (dilution, exposure time). | Product manufacturer. | Proper use during food production |
|
| Food production waste | Food Shavings/gross weight × 100 | Considered best values below 3% [25] and acceptable up to a maximum of 10% of what was produced [29]. | The amount of food discarded during production (food shavings). |
|
| Amount of rest-intake | Amount (in kg) of food discarded after consumption in the plates of consumers. | For the amount of rest-intake and distribution leftover, we used the same categorization as food production waste. | Direct weighing of rest-intake and distribution leftover. |
|
| Amount of distribution leftover | Amount (in kg) of leftover food after distribution that was not in consumers’ plates. |
| ||
| Social dimension | ||||
| The energy density (ED) of rest- intake | ED = Kcal of rest-intake/Kg of rest-intake | Defined as a low, medium, and high ED, defined by the Centers for Disease Control and Prevention (2005) [23]. | Calculation of ED of the menu served by the restaurant. |
|
| The energy density (ED) of distribution leftover | ED = Kcal of distribution leftover/Kg of distribution leftover | Defined as a low, medium, and high ED, defined by the Centers for Disease Control and Prevention (2005) [23]. | Calculation of ED of the menu served by the restaurant. |
|
| Organic food use | Organic foods or other types of sustainable production that favor the health of consumers and producers. | It is considered a sustainable restaurant with more than 50% of fruits and vegetables with an organic seal [24]. | Identify the percentage of foods on the menu that have organic certification or sustainable production. |
|
| Food donation | Considered when the donation of food is allowed under adequate conditions of human consumption, it can be donated to people in vulnerable situations. | Law 14.016, of 23 June 2020, which provides for combating food waste and the donation of surplus food for human consumption [30]. | Disposal of food surpluses under conditions of human consumption (leftover food) |
|
| Dimension | ITEM | School 1 | School 2 | School 3 | School 4 | ||||||||
|---|---|---|---|---|---|---|---|---|---|---|---|---|---|
| Score | Total by Dimension | % | Score | Total by Dimension | % | Score | Total by Dimension | % | Score | Total by Dimension | % | ||
| Economic | Raw material cost | 0.77 ± 0.05 | 2.48 | 62 | 0.80 ± 0.07 | 2.53 | 63.3 | 0.68 ± 0.09 | 1.91 | 47.8 | 0.73 ± 0.08 | 2.24 | 56 |
| Electricity | 0.77 ± 0.09 | 0.71 ± 0.09 | 0.57 ± 0.11 | 0.73 ± 0.07 | |||||||||
| Liquefied petroleum gas | 0.47 ± 0.09 | 0.51 ± 0.13 | 0.33 ± 0.12 | 0.39 ± 0.12 | |||||||||
| Handler’s salary | 0.47 ± 0.09 | 0.51 ± 0.13 | 0.33 ± 0.12 | 0.39 ± 0.12 | |||||||||
| Environmental | Water footprint | 0.68 ± 0.09 | 3.67 | 73.4 | 0.71 ± 0.12 | 3.73 | 74.6 | 0.57 ± 0.25 | 3.18 | 63.9 | 0.39 ± 0.20 | 3.20 | 64 |
| Cleaning material | 0.77 ± 0.05 | 0.80 ± 0.07 | 0.68 ± 0.09 | 0.68 ± 0.09 | |||||||||
| Food shavings | 0.68 ± 0.19 | 0.71 ± 0.04 | 0.57 ± 0.21 | 0.73 ± 0.25 | |||||||||
| %Rest-intake | 0.77 ± 0.05 | 0.80 ± 0.07 | 0.68 ± 0.09 | 0.62 ± 0.13 | |||||||||
| %Distribution leftover | 0.77 ± 0.05 | 0.71 ± 0.13 | 0.68 ± 0.15 | 0.73 ± 0.14 | |||||||||
| Social | Energy density of rest-intake | 0.47 ± 0.09 | 2.48 | 62 | 0.51 ± 0.13 | 2.62 | 65.5 | 0.33 ± 0.12 | 2.02 | 50.5 | 0.39 ± 0.12 | 2.24 | 56 |
| Energy density of distribution leftover | 0.47 ± 0.09 | 0.51 ± 0.13 | 0.33 ± 0.12 | 0.39 ± 0.12 | |||||||||
| Organic food | 0.77 ± 0.05 | 0.80 ± 0.07 | 0.68 ± 0.09 | 0.73 ± 0.08 | |||||||||
| Food donation | 0.77 ± 0.05 | 0.80 ± 0.07 | 0.68 ± 0.09 | 0.73 ± 0.08 | |||||||||
Publisher’s Note: MDPI stays neutral with regard to jurisdictional claims in published maps and institutional affiliations. |
© 2021 by the authors. Licensee MDPI, Basel, Switzerland. This article is an open access article distributed under the terms and conditions of the Creative Commons Attribution (CC BY) license (https://creativecommons.org/licenses/by/4.0/).
Share and Cite
Lins, M.; Zandonadi, R.P.; Strasburg, V.J.; Nakano, E.Y.; Botelho, R.B.A.; Raposo, A.; Ginani, V.C. Eco-Inefficiency Formula: A Method to Verify the Cost of the Economic, Environmental, and Social Impact of Waste in Food Services. Foods 2021, 10, 1369. https://doi.org/10.3390/foods10061369
Lins M, Zandonadi RP, Strasburg VJ, Nakano EY, Botelho RBA, Raposo A, Ginani VC. Eco-Inefficiency Formula: A Method to Verify the Cost of the Economic, Environmental, and Social Impact of Waste in Food Services. Foods. 2021; 10(6):1369. https://doi.org/10.3390/foods10061369
Chicago/Turabian StyleLins, Maísa, Renata Puppin Zandonadi, Virgílio José Strasburg, Eduardo Yoshio Nakano, Raquel Braz Assunção Botelho, António Raposo, and Veronica Cortez Ginani. 2021. "Eco-Inefficiency Formula: A Method to Verify the Cost of the Economic, Environmental, and Social Impact of Waste in Food Services" Foods 10, no. 6: 1369. https://doi.org/10.3390/foods10061369