
Is Ultra-High Temperature Processed Milk Safe in Terms of Heterocyclic Aromatic Amines?

 , , ,
, , , 
Abstract
:
1. Introduction
2. Materials and Methods
2.1. Chemicals and Reagents
2.2. Sample Collection
2.3. Dry Matter and pH
2.4. Sample Preparation for Determination of Heterocyclic Aromatic Amine
2.5. HPLC Analysis
2.6. Method Validation
2.7. Statistical Analyses
3. Results
3.1. Dry Matter and pH Values of Milk Samples
3.2. Method Validation
3.3. Heterocyclic Aromatic Amines Content of Milk Samples
3.4. Correlation
3.5. Discrimination of UHT Milk Samples Using PCA
4. Conclusions
Supplementary Materials
Author Contributions
Funding
Institutional Review Board Statement
Informed Consent Statement
Data Availability Statement
Conflicts of Interest
References
- Pereira, P.C. Milk nutritional composition and its role in human health. Nutrition 2014, 30, 619–627. [Google Scholar] [CrossRef] [PubMed]
- Jensen, R.G. CHAPTER 1—Introduction. In Handbook of Milk Composition; Jensen, R.G., Ed.; Academic Press: San Diego, CA, USA, 1995; pp. 1–3. [Google Scholar]
- Marangoni, F.; Pellegrino, L.; Verduci, E.; Ghiselli, A.; Bernabei, R.; Calvani, R.; Cetin, I.; Giampietro, M.; Perticone, F.; Piretta, L.; et al. Cow’s Milk Consumption and Health: A Health Professional’s Guide. J. Am. Coll. Nutr. 2019, 38, 197–208. [Google Scholar] [CrossRef]
- Palmquist, D.L. Great discoveries of milk for a healthy diet and a healthy life. J. Rev. Bras. Zootec. 2010, 39, 465–477. [Google Scholar] [CrossRef] [Green Version]
- Sipple, L.R.; Barbano, D.M.; Drake, M. Invited review: Maintaining and growing fluid milk consumption by children in school lunch programs in the United States. J. Dairy Sci. 2020, 103, 7639–7654. [Google Scholar] [CrossRef] [PubMed]
- Muehlhoff, E.; Bennett, A.; McMahon, D. Milk and Dairy Products in Human Nutrition; Food and Agriculture Organization of the United Nations (FAO): Rome, Italy, 2013. [Google Scholar]
- Akkerman, M.; Johansen, L.B.; Rauh, V.; Sørensen, J.; Larsen, L.B.; Poulsen, N.A. Relationship between casein micelle size, protein composition and stability of UHT milk. Int. Dairy J. 2021, 112, 104856. [Google Scholar] [CrossRef]
- Troise, A.D.; Bandini, E.; De Donno, R.; Meijer, G.; Trezzi, M.; Fogliano, V. The quality of low lactose milk is affected by the side proteolytic activity of the lactase used in the production process. Food Res. Int. 2016, 89, 514–525. [Google Scholar] [CrossRef] [Green Version]
- Chavan, R.S.; Chavan, S.R.; Khedkar, C.D.; Jana, A.H. UHT Milk Processing and Effect of Plasmin Activity on Shelf Life: A Review. Compr. Rev. Food Sci. Food Saf. 2011, 10, 251–268. [Google Scholar] [CrossRef]
- Aktağ, I.G.; Hamzalıoğlu, A.; Gökmen, V. Lactose hydrolysis and protein fortification pose an increased risk for the formation of Maillard reaction products in UHT treated milk products. J. Food Compos. Anal. 2019, 84, 103308. [Google Scholar] [CrossRef]
- Sunds, A.V.; Rauh, V.M.; Sørensen, J.; Larsen, L.B. Maillard reaction progress in UHT milk during storage at different temperature levels and cycles. Int. Dairy J. 2018, 77, 56–64. [Google Scholar] [CrossRef]
- Bottiroli, R.; Dario Troise, A.; Aprea, E.; Fogliano, V.; Vitaglione, P.; Gasperi, F. Chemical and sensory changes during shelf-life of UHT hydrolyzed-lactose milk produced by “in batch” system employing different commercial lactase preparations. Food Res. Int. 2020, 136, 109552. [Google Scholar] [CrossRef]
- Barzegar, F.; Kamankesh, M.; Mohammadi, A. Heterocyclic aromatic amines in cooked food: A review on formation, health risk-toxicology and their analytical techniques. Food Chem. 2019, 280, 240–254. [Google Scholar] [CrossRef]
- Oz, F.; Kaya, M. Heterocyclic Aromatic Amines in Meat. J. Food Process. Preserv. 2011, 35, 739–753. [Google Scholar] [CrossRef]
- International Agency for Research on Cancer (IARC). Some naturally occurring substances: Food items and constituents, heterocyclic aromatic amines and mycotoxins. IARC Monogr. Eval. Carcinog. Risk Chem. Huma. 1993, 56, 599. [Google Scholar]
- Alaejos, M.S.; Afonso, A.M. Factors That Affect the Content of Heterocyclic Aromatic Amines in Foods. Compr. Rev. Food Sci. Food Saf. 2011, 10, 52–108. [Google Scholar] [CrossRef]
- Karpavičiūtė, D.; Murkovic, M.; Vinauskienė, R.; Venskutonis, R. Determination of non-polar heterocyclic aromatic amines in roasted coffee by SPE-HPLC-FLD. Chem. Pap. 2017, 71, 67–70. [Google Scholar] [CrossRef]
- Herraiz, T. Relative exposure to β-carbolines norharman and harman from foods and tobacco smoke. Food Addit. Contam. 2004, 21, 1041–1050. [Google Scholar] [CrossRef]
- Gonzalo-Lumbreras, R.; Rosales-Conrado, N.; León-González, M.E.; Pérez-Arribas, L.V.; Polo-Díez, L.M. Capillary liquid chromatography with diode array and mass spectrometry detection for heterocyclic aromatic amine determination in ready-to-eat food treated with electron-beam irradiation. J. Chromatogr. A 2010, 1217, 6778–6784. [Google Scholar] [CrossRef] [PubMed]
- Lan, C.M.; Chen, B.H. Effects of soy sauce and sugar on the formation of heterocyclic amines in marinated foods. Food Chem. Toxicol. 2002, 40, 989–1000. [Google Scholar] [CrossRef]
- Scott, K.A.; Turesky, R.J.; Wainman, B.C.; Josephy, P.D. Hplc/electrospray ionization mass spectrometric analysis of the heterocyclic aromatic amine carcinogen 2-amino-1-methyl-6-phenylimidazo[4,5-b] pyridine in human milk. Chem. Res. Toxicol. 2007, 20, 88–94. [Google Scholar] [CrossRef]
- Oz, E. The presence of polycyclic aromatic hydrocarbons and heterocyclic aromatic amines in barbecued meatballs formulated with different animal fats. Food Chem. 2021, 352, 129378. [Google Scholar] [CrossRef] [PubMed]
- AOAC. Official Methods of Analysis of the Association of Analytical Chemists International; Horwitz, W., Ed.; AOAC International: Gaithersburg, MD, USA, 2005. [Google Scholar]
- Oz, F.; Kızıl, M.; Çelık, T. Preservation. Effects of different cooking methods on the formation of heterocyclic aromatic amines in goose meat. J. Food Process. Preserv. 2016, 40, 1047–1053. [Google Scholar] [CrossRef]
- Oz, E. The impact of fat content and charcoal types on quality and the development of carcinogenic polycyclic aromatic hydrocarbons and heterocyclic aromatic amines formation of barbecued fish. Int. J. Food Sci. Technol. 2021, 56, 954–964. [Google Scholar] [CrossRef]
- Dursun, A.; Guler, Z.; Sekerli, Y. Characterization of Volatile Compounds And Organic Acids In UHT (Ultra-High- Temperature) Milk Packaged In Tetra Brik Cartons. Int. J. Food Prop. 2016, 20, 1511–1521. [Google Scholar] [CrossRef] [Green Version]
- Keleş, L. Changes in Organoleptic Features of UHT Milk Stored in Fridges as Being Opened. Master’s Thesis, Ondokuz Mayıs University, Samsun, Turkey, 2006. [Google Scholar]
- Correa, F.T.; Haddad, F.F.; de Oliveira, J.H. Simplification of the analysis of dry matter in fluid milk. Arq. Ciênc. Vet. Zool. UNIPAR 2019, 22. [Google Scholar] [CrossRef]
- Oz, E. Effects of smoke flavoring using different wood chips and barbecuing on the formation of polycyclic aromatic hydrocarbons and heterocyclic aromatic amines in salmon fillets. PLoS ONE 2020, 15, e0227508. [Google Scholar] [CrossRef] [Green Version]
- Unal, K.; Karakaya, M.; Oz, F. The effects of different spices and fat types on the formation of heterocyclic aromatic amines in barbecued sucuk. J. Sci. Food Agric. 2018, 98, 719–725. [Google Scholar] [CrossRef]
- Pouzou, J.G.; Costard, S.; Zagmutt, F.J. Probabilistic assessment of dietary exposure to heterocyclic amines and polycyclic aromatic hydrocarbons from consumption of meats and breads in the United States. Food Chem. Toxicol. 2018, 114, 361–374. [Google Scholar] [CrossRef]
- Rohrmann, S.; Becker, N. Dietary intake of heterocyclic aromatic amines in Germany. Ernährungs Umsch. 2001, 48, 447–450. [Google Scholar]
- Klapec, T.; Periš, D. Quick estimation of dietary exposure to heterocyclic aromatic amines and acrylamide in a Croatian female population. J. Food Nutr. Res. 2014, 53, 251–259. [Google Scholar]
- Zeng, M.; Wang, J.; Zhang, M.; Chen, J.; He, Z.; Qin, F.; Xu, Z.; Cao, D.; Chen, J. Inhibitory effects of Sichuan pepper (Zanthoxylum bungeanum) and sanshoamide extract on heterocyclic amine formation in grilled ground beef patties. Food Chem. 2018, 239, 111–118. [Google Scholar] [CrossRef]
- Robbana-Barnat, S.; Rabache, M.; Rialland, E.; Fradin, J. Heterocyclic amines: Occurrence and prevention in cooked food. Environ. Health Perspect. 1996, 104, 280–288. [Google Scholar] [CrossRef] [PubMed]
- Nilsson, L.; Övervik, E.; Fredholm, L.; Levin, Ö.; Nord, C.-E.; Gustafsson, J.-Å. Influence of frying fat on mutagenic activity in lean pork meat. Mutat. Res./Genet. Toxicol. 1986, 171, 115–121. [Google Scholar] [CrossRef]
- Brands, C.M.J.; Alink, G.M.; van Boekel, M.A.J.S.; Jongen, W.M.F. Mutagenicity of Heated Sugar−Casein Systems: Effect of the Maillard Reaction. J. Agric. Food Chem. 2000, 48, 2271–2275. [Google Scholar] [CrossRef] [PubMed]
- Brands, C.M.J.; Wedzicha, B.L.; van Boekel, M.A.J.S. Quantification of Melanoidin Concentration in Sugar−Casein Systems. J. Agric. Food Chem. 2002, 50, 1178–1183. [Google Scholar] [CrossRef]
- Tossavainen, O.; Kallioinen, H. Proteolytic changes in lactose hydrolysed UHT milks during storage. Milchwissenschaft 2007, 62, 410–414. [Google Scholar]
- Jansson, T.; Clausen, M.; Sundekilde, U.; Eggers, N.; Nyegaard, S.; Larsen, L.; Ray, C.; Sundgren, A.; Andersen, H.; Bertram, H. Lactose-Hydrolyzed Milk Is More Prone to Chemical Changes during Storage than Conventional Ultra-High-Temperature (UHT) Milk. J. Agric. Food Chem. 2014, 62. [Google Scholar] [CrossRef]
- Messia, M.C.; Candigliota, T.; Marconi, E. Assessment of quality and technological characterization of lactose-hydrolyzed milk. Food Chem. 2007, 104, 910–917. [Google Scholar] [CrossRef]
- Zamora, R.; Lavado-Tena, C.M.; Hidalgo, F.J. Reactive carbonyls and the formation of the heterocyclic aromatic amine 2-amino-3,4-dimethylimidazo(4,5-f)quinoline (MeIQ). Food Chem. 2020, 324, 126898. [Google Scholar] [CrossRef] [PubMed]
- Polak, T.; Došler, D.; Žlender, B.; Gašperlin, L. Heterocyclic amines in aged and thermally treated pork longissimus dorsi muscle of normal and PSE quality. LWT Food Sci. Technol. 2009, 42, 504–513. [Google Scholar] [CrossRef]


| Brand | Type | n | Protein Content | Carbohydrate Content | Sugar Content | Fat Content |
|---|---|---|---|---|---|---|
| A | Growing up milk | 3 | 2.1 | 7.8 | 5.3 | 2.8 |
| B | Growing up milk | 3 | 2.1 | 7.5 | 4.9 | 2.9 |
| C | Growing up milk | 3 | 1.9 | 8.1 | 7.9 | 3 |
| D | Growing up milk | 3 | 2.3 | 8 | 7.4 | 3 |
| B | Lactose free-semi skimmed | 3 | 2.9 | 4.7 | 4.7 | 1.5 |
| D | Lactose free-semi skimmed | 3 | 3 | 4.7 | 4.7 | 1.5 |
| B | Protein-fortified coffee-flavored milk • | 3 | 6 | 5.4 | 5.4 | 0.1 |
| D | Protein-fortified cocoa-flavored milk • | 3 | 5.2 | 6.5 | 5.6 | 0.3 |
| B | Protein-fortified cocoa-flavored milk • | 3 | 6 | 5 | 5 | 0.1 |
| D | Protein-fortified vanilla-flavored milk • | 3 | 5.2 | 5.8 | 5.8 | 0.3 |
| B | Protein-fortified vanilla-flavored milk • | 3 | 6 | 5.8 | 5.8 | 0.1 |
| E | Whole milk | 3 | 3 | 5.6 | 3.9 | 3 |
| B | Whole milk | 3 | 3 | 4.7 | 4.7 | 3 |
| D | Whole milk | 3 | 3 | 4.5 | 4.5 | 3.3 |
| F | Whole milk | 3 | 3 | 4.6 | 4.6 | 2.5 |
| G | Whole milk | 3 | 2.9 | 4.8 | 3.4 | 3.3 |
| B | Organic milk | 3 | 3 | 4.7 | 4.7 | 3 |
| D | Organic milk | 3 | 3 | 4.6 | 4.6 | 3 |
| B | Skimmed milk | 3 | 2.9 | 4.7 | 4.7 | 0.1 |
| D | Skimmed milk | 3 | 3.1 | 5 | 5 | 0.1 |
| A | Semi-skimmed milk | 3 | 2.9 | 4.7 | 2.7 | 1.7 |
| H | Semi-skimmed milk | 3 | 2.9 | 4.7 | 4.7 | 1.5 |
| F | Semi-skimmed milk | 3 | 3 | 4.7 | 4.7 | 1.5 |
| G | Semi-skimmed milk | 3 | 2.9 | 4.8 | 3.5 | 1.5 |
| Type | Dry Matter (%) | pH |
|---|---|---|
| Growing up milk | 13.92 ± 0.27 a | 6.91 ± 0.05 a |
| Lactose free - semi skimmed | 9.69 ± 0.18 f | 6.74 ± 0.03 d,e |
| Protein-fortified coffee-flavored milk• | 11.92 ± 0.02 b | 6.82 ± 0.01 b |
| Protein-fortified cocoa-flavored milk• | 11.86 ± 1.42 b | 6.66 ± 0.08 g |
| Protein-fortified vanilla-flavored milk• | 11.63 ± 0.57 c | 6.69 ± 0.16 f |
| Whole milk | 11.19 ± 0.54 d | 6.76 ± 0.03d |
| Organic milk | 11.57 ± 0.16 c | 6.80 ± 0.03 c |
| Skimmed milk | 8.56 ± 0.35 g | 6.73 ± 0.02 e |
| Semi skimmed milk | 9.93 ± 0.21 e | 6.74 ± 0.03 d,e |
| Sig. | ** | ** |
| HAA | LOD (ng/g) | LOQ (ng/g) | Linear Equation | R2 |
|---|---|---|---|---|
| IQx | 0.004 | 0.013 | y = 2.3138x − 0.1007 | 0.9996 |
| IQ | 0.009 | 0.029 | y = 1.0272x + 0.0226 | 0.9999 |
| MeIQx | 0.024 | 0.081 | y = 1.6509x − 0.0574 | 0.9998 |
| MeIQ | 0.014 | 0.047 | y = 1.3127x − 0.0060 | 0.9999 |
| 7,8-DiMeIQx | 0.005 | 0.018 | y = 2.5318x − 0.0799 | 0.9999 |
| 4,8-DiMeIOx | 0.008 | 0.025 | y = 1.9723x − 0.0627 | 0.9997 |
| PhIP | 0.025 | 0.085 | y = 0.1777x − 0.0032 | 0.9999 |
| AαC | 0.012 | 0.039 | y = 0.4733x − 0.0151 | 0.9999 |
| MeAαC | 0.010 | 0.035 | y = 0.3473x − 0.0499 | 0.9999 |
| HAAs | Concentration (ng/mL) | IQx | IQ | MeIQx | MeIQ | 7,8-DiMeIQx | 4,8-DiMeIQx | PhIP | AαC | MeAαC |
|---|---|---|---|---|---|---|---|---|---|---|
| Intra-day RSD % (n = 8) | 10 | 3.14 | 3.23 | 2.16 | 1.71 | 1.97 | 1.78 | 1.43 | 0.88 | 0.65 |
| 7.5 | 1.71 | 1.97 | 0.99 | 1.78 | 1.24 | 1.72 | 1.63 | 1.28 | 1.21 | |
| 5 | 0.91 | 0.84 | 1.04 | 1.31 | 1.1 | 1.04 | 1.12 | 0.88 | 0.77 | |
| 2.5 | 1.37 | 1.72 | 1.45 | 1.54 | 0.91 | 2.11 | 1.16 | 1.28 | 1.40 | |
| 1 | 1.47 | 1.97 | 1.60 | 1.07 | 1.78 | 3.01 | 1.05 | 1.11 | 3.11 | |
| 0.5 | 1.18 | 1.56 | 1.32 | 1.36 | 1.04 | 1.46 | 2.34 | 1.91 | 2.38 | |
| Inter-day RSD % (n = 8) | 10 | 8.37 | 3.98 | 7.84 | 5.01 | 7.91 | 6.79 | 7.98 | 6.23 | 4.34 |
| 7.5 | 9.92 | 4.33 | 8.91 | 5.62 | 8.87 | 7.48 | 9.00 | 7.53 | 4.40 | |
| 5 | 9.21 | 3.38 | 8.27 | 4.29 | 8.04 | 7.79 | 8.13 | 6.39 | 2.98 | |
| 2.5 | 10.02 | 5.12 | 9.47 | 6.66 | 8.87 | 8.52 | 9.27 | 6.93 | 3.16 | |
| 1 | 9.75 | 4.18 | 9.14 | 4.42 | 8.99 | 8.42 | 9.4 | 6.89 | 4.63 | |
| 0.5 | 10.94 | 5.57 | 9.87 | 5.96 | 9.95 | 7.68 | 9.57 | 5.18 | 7.48 |
| HAAs | Concentration (ng/mL) | Intra-Day (n = 4) | Inter-Day (n = 4) | Recovery (%) |
|---|---|---|---|---|
| RSD% | RSD% | |||
| IQx | 10 | 1.01 | 2.04 | 89.78 |
| 5 | 3.90 | 6.65 | 91.36 | |
| 1 | 1.09 | 1.25 | 86.91 | |
| IQ | 10 | 6.39 | 6.38 | 84.28 |
| 5 | 2.73 | 7.02 | 87.47 | |
| 1 | 1.88 | 1.83 | 84.41 | |
| MeIQx | 10 | 2.73 | 2.73 | 93.64 |
| 5 | 3.75 | 6.15 | 94.59 | |
| 1 | 2.07 | 2.07 | 89.80 | |
| MeIQ | 10 | 5.72 | 5.72 | 94.01 |
| 5 | 3.27 | 6.71 | 96.23 | |
| 2.5 | 2.59 | 2.92 | 89.82 | |
| 7,8-DiMeIQx | 10 | 3.24 | 3.24 | 91.84 |
| 5 | 3.46 | 5.57 | 93.26 | |
| 1 | 1.54 | 1.54 | 87.51 | |
| 4,8-DiMeIQx | 10 | 3.04 | 5.19 | 92.05 |
| 5 | 3.52 | 3.52 | 90.70 | |
| 1 | 0.59 | 2.58 | 84.65 | |
| PhIP | 10 | 4.03 | 5.41 | 94.40 |
| 5 | 1.97 | 1.97 | 96.20 | |
| 1 | 0.80 | 0.80 | 91.96 | |
| AαC | 10 | 2.21 | 2.15 | 85.65 |
| 5 | 12.23 | 9.54 | 87.33 | |
| 1 | 9.04 | 9.04 | 82.79 | |
| MeAαC | 10 | 3.16 | 3.16 | 85.65 |
| 5 | 14.44 | 12.17 | 82.92 | |
| 1 | 12.48 | 12.47 | 72.76 |
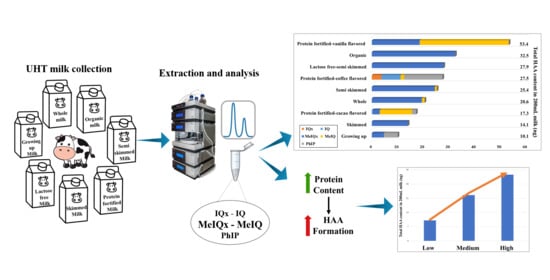
| Milk Types | IQx | IQ | MeIQx | MeIQ | PhIP | Total | Portion ° |
|---|---|---|---|---|---|---|---|
| Growing up | nd-nq | nd–nq | 0.06 ± 0.09 e (nd–0.24) | nd | 0.07 ± 0.11 b (nd–0.39) | 0.13 ± 0.12 c | 10.10 ± 9.97 c |
| Lactose free—semi skimmed | nd | nd–nq | 0.35 ± 0.11 b (0.17–0.46) | nd | nd | 0.35 ± 0.11 b,c | 27.93 ± 8.64 b,c |
| Protein-fortified coffee-flavored • | 0.05 ± 0.02 a (0.03–0.06) | 0.09 ± 0.01 a (0.09–0.1) | nd | 0.02 ± 0.03 b (nq–0.05) | 0.19 ± 0.02 a (0.17–0.2) | 0.34 ± 0.03 b,c | 27.53 ± 2.41 b,c |
| Protein-fortified cocoa-flavored • | nd-nq | 0.01 ± 0.01 b (nd–0.03) | 0.03 ± 0.05 e (nd–0.1) | 0.16 ± 0.16 b (nq–0.37) | 0.02 ± 0.05 b (nd–0.12) | 0.22 ± 0.19 b,c | 17.26 ± 15.30 b,c |
| Protein-fortified vanilla-flavored • | nd | nq | 0.23 ± 0.22 c,d (nd–0.55) | 0.43 ± 0.77 a (nd–1.97) | nd–nq | 0.67 ± 0.65 a | 53.35 ± 51.79 a |
| Whole | nd | nd–nq | 0.24 ± 0.13 c,d (nd–0.47) | 0.01 ± 0.04 b (nd–0.12) | nd | 0.26 ± 0.13 b,c | 20.59 ± 10.73 b,c |
| Organic | nd | nd–nq | 0.41 ± 0.16 a (0.19–0.49) | nd | nd–nq | 0.41 ± 0.16 b | 32.48 ± 13.19 b |
| Skimmed | nd | nd–nq | 0.18 ± 0.17 d (nq–0.41) | nd | nd | 0.18 ± 0.17 b,c | 14.07 ± 13.35 b,c |
| Semi skimmed | nd | nd–nq | 0.31 ± 0.21 b,c (nd–0.52) | 0.01 ± 0.02 b (nd–0.06) | nd | 0.32 ± 0.21 b,c | 25.36 ± 16.84 b,c |
| Sig. | ** | ** | ** | ** | ** | ** | ** |
| Milk Groups * | Protein | Carbohydrate | Fat | |||
|---|---|---|---|---|---|---|
| Total HAA | Portion ° | Total HAA | Portion ° | Total HAA | Portion ° | |
| 1 | 0.13 ± 0.04 c | 10.44 ± 3.08 c | 0.31 ± 0.02 a | 24.40 ± 1.93 a | 0.37 ± 0.12 a | 29.38 ± 9.91 a |
| 2 | 0.29 ± 0.03 b | 23.56 ± 2.76 b | 0.35 ± 0.27 a | 28.24 ± 21.81 a | 0.33 ± 0.11 a | 26.22 ± 9.11 a |
| 3 | 0.42 ± 0.08 a | 33.75 ± 6.39 a | 0.20 ± 0.12 a | 15.79 ± 9.91 a | 0.23 ± 0.10 a | 18.25 ± 7.99 a |
| Sig. | ** | ** | ns | ns | ns | ns |
Publisher’s Note: MDPI stays neutral with regard to jurisdictional claims in published maps and institutional affiliations. |
© 2021 by the authors. Licensee MDPI, Basel, Switzerland. This article is an open access article distributed under the terms and conditions of the Creative Commons Attribution (CC BY) license (https://creativecommons.org/licenses/by/4.0/).
Share and Cite
Oz, F.; Oz, E.; Aoudeh, E.; Abd El-Aty, A.M.; Zeng, M.; Varzakas, T. Is Ultra-High Temperature Processed Milk Safe in Terms of Heterocyclic Aromatic Amines? Foods 2021, 10, 1247. https://doi.org/10.3390/foods10061247
Oz F, Oz E, Aoudeh E, Abd El-Aty AM, Zeng M, Varzakas T. Is Ultra-High Temperature Processed Milk Safe in Terms of Heterocyclic Aromatic Amines? Foods. 2021; 10(6):1247. https://doi.org/10.3390/foods10061247
Chicago/Turabian StyleOz, Fatih, Emel Oz, Eyad Aoudeh, A. M. Abd El-Aty, Maomao Zeng, and Theodoros Varzakas. 2021. "Is Ultra-High Temperature Processed Milk Safe in Terms of Heterocyclic Aromatic Amines?" Foods 10, no. 6: 1247. https://doi.org/10.3390/foods10061247