
Appetite and Satiety Effects of the Acute and Regular Consumption of Green Coffee Phenols and Green Coffee Phenol/Oat β-Glucan Nutraceuticals in Subjects with Overweight and Obesity


 and
and
Abstract
:
1. Introduction
2. Materials and Methods
2.1. Subjects
2.2. Nutraceutical
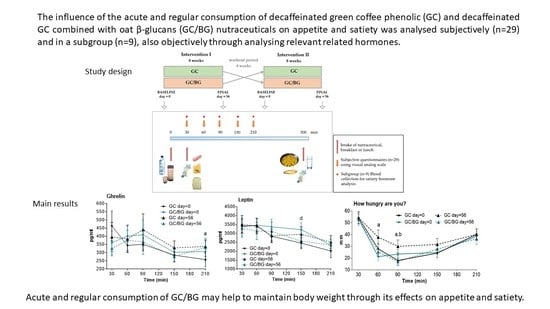
2.3. Study Design
2.4. Subjective Satiety and Food Intake Measurements. Dietary Assessment
2.5. Objective Satiety Evaluation: Hormone Measurements
2.6. Statistical Analysis
3. Results
3.1. Subjective Satiety/Appetite and Food Intake Measurements
3.2. Body Weight. Dietary Assessment. Physical Activity
3.3. Hormone Analysis
4. Discussion
5. Conclusions
Author Contributions
Funding
Institutional Review Board Statement
Informed Consent Statement
Data Availability Statement
Acknowledgments
Conflicts of Interest
References
- World Health Organization (WHO). Fact Sheets: Obesity and Overweight. Available online: https://www.who.int/en/news-room/fact-sheets/detail/obesity-and-overweight (accessed on 1 July 2021).
- Boix-Castejón, M.; Herranz-López, M.; Pérez Gago, A.; Olivares-Vicente, M.; Caturla, N.; Roche, E.; Micol, V. Hibiscus and lemon verbena polyphenols modulate appetite-related biomarkers in overweight subjects: A randomized controlled trial. Food Funct. 2018, 9, 3173–3184. [Google Scholar] [CrossRef] [PubMed] [Green Version]
- Stuby, J.; Gravestock, I.; Wolfram, E.; Pichierri, G.; Steurer, J.; Burgstaller, J.M. Appetite-suppressing and satiety-increasing bioactive phytochemicals: A systematic review. Nutrients 2019, 11, 2238. [Google Scholar] [CrossRef] [PubMed] [Green Version]
- Méndez-del Villar, M.; González-Ortiz, M.; Martínez-Abundis, E.; Pérez-Rubio, K.G.; Lizárraga-Valdez, R. Effect of resveratrol administration on metabolic syndrome, insulin sensitivity, and insulin secretion. Metab. Syndr. Relat. Disord. 2014, 12, 497–501. [Google Scholar] [CrossRef]
- Capomolla, A.S.; Janda, E.; Paone, S.; Parafati, M.; Sawicki, T.; Mollace, R.; Ragusa, S.; Mollace, V. Atherogenic index reduction and weight loss in metabolic syndrome patients treated with a novel pectin-enriched formulation of bergamot polyphenols. Nutrients 2019, 11, 1271. [Google Scholar] [CrossRef] [PubMed] [Green Version]
- Yuliana, N.D.; Jahangir, M.; Korthout, H.; Choi, Y.H.; Kim, H.K.; Verpoorte, R. Comprehensive review on herbal medicine for energy intake suppression. Obes. Rev. Off. J. Int. Assoc. Study Obes. 2011, 12, 499–514. [Google Scholar] [CrossRef]
- Cho, A.S.; Jeon, S.M.; Kim, M.J.; Yeo, J.; Seo, K.I.; Choi, M.S.; Lee, M.K. Chlorogenic acid exhibits anti-obesity property and improves lipid metabolism in high-fat diet-induced-obese mice. Food Chem. Toxicol. 2010, 48, 937–943. [Google Scholar] [CrossRef]
- Asbaghia, O.; Sadeghianb, M.; Rahmanid, S.; Mardania, M.; Khodadoste, M.; Malekig, V.; Pirouzih, A.; Talebii, S.; Sadeghi, O. The effect of green coffee extract supplementation on anthropometric measures in adults: A comprehensive systematic review and dose-response meta-analysis of randomized clinical trials. Complement. Ther. Med. 2020, 51, 102424. [Google Scholar] [CrossRef]
- Pan, M.H.; Tung, Y.C.; Yang, G.; Li, S.; Ho, C.T. Molecular mechanisms of the anti-obesity effect of bioactive compounds in tea and coffee. Food Funct. 2016, 7, 4481–4491. [Google Scholar] [CrossRef]
- Panickar, K.S. Effects of dietary polyphenols on neuroregulatory factors and pathways that mediate food intake and energy regulation in obesity. Mol. Nutr. Food Res. 2013, 57, 34–47. [Google Scholar] [CrossRef]
- Timper, K.; Brüning, J.C. Hypothalamic circuits regulating appetite and energy homeostasis: Pathways to obesity. Dis. Models Mech. 2017, 10, 679–689. [Google Scholar] [CrossRef] [Green Version]
- Crespo, M.A.; González Matías, L.C.; Lozano, M.G.; Paz, S.F.; Pérez, M.R.; Gago, E.V.; Ferrer, F.M. Gastrointestinal hormones in food intake control. Endocrinol. Nutr. Organ Span. Soc. Endocrinol. Nutr. 2009, 56, 317–330. [Google Scholar]
- McCarty, M.F. A chlorogenic acid-induced increase in GLP-1 production may mediate the impact of heavy coffee consumption on diabetes risk. Med. Hypotheses 2005, 64, 848–853. [Google Scholar] [CrossRef]
- Greenberg, J.A.; Geliebter, A. Coffee, hunger, and peptide YY. J. Am. Coll. Nutr. 2012, 31, 160–166. [Google Scholar] [CrossRef]
- Ueno, H.; Yamaguchi, H.; Mizuta, M.; Nakazato, M. The role of PYY in feeding regulation. Regul. Pept. 2008, 145, 12–16. [Google Scholar] [CrossRef]
- Chaudhri, O.B.; Salem, V.; Murphy, K.G.; Bloom, S.R. Gastrointestinal satiety signals. Annu. Rev. Physiol. 2008, 70, 239–255. [Google Scholar] [CrossRef]
- Johnston, K.L.; Clifford, M.N.; Morgan, L.M. Coffee acutely modifies gastrointestinal hormone secretion and glucose tolerance in humans: Glycemic effects of chlorogenic acid and caffeine. Am. J. Clin. Nutr. 2003, 78, 728–733. [Google Scholar] [CrossRef]
- Gavrieli, A.; Yannakoulia, M.; Fragopoulou, E.; Margaritopoulos, D.; Chamberland, J.P.; Kaisari, P.; Kavouras, S.A.; Mantzoros, C.S. Caffeinated coffee does not acutely affect energy intake, appetite, or inflammation but prevents serum cortisol concentrations from falling in healthy men. J. Nutr. 2011, 141, 703–707. [Google Scholar] [CrossRef] [Green Version]
- Roshan, H.; Nikpayam, O.; Sedaghat, M.; Sohrab, G. Effects of green coffee extract supplementation on anthropometric indices, glycaemic control, blood pressure, lipid profile, insulin resistance and appetite in patients with the metabolic syndrome: A randomised clinical trial. Br. J. Nutr. 2018, 119, 250–258. [Google Scholar] [CrossRef] [PubMed] [Green Version]
- Sarriá, B.; Sierra-Cinos, J.L.; García-Diz, L.; Martínez-López, S.; Mateos, R.; Bravo-Clemente, L. Green/roasted coffee may reduce cardiovascular risk in hypercholesterolemic subjects by decreasing body weight, abdominal adiposity and blood pressure. Foods 2020, 9, 1191. [Google Scholar] [CrossRef] [PubMed]
- Basu, A.; Sanchez, K.; Leyva, M.U.; Wu, M.; Betts, N.M.; Aston, C.E.; Lyons, T.J. Green tea supplementation affects body weight, lipids, and lipid peroxidation in obese subjects with metabolic syndrome. J. Am. Coll. Nutr. 2010, 29, 31–40. [Google Scholar] [CrossRef] [PubMed]
- Rebello, C.J.; O’Neil, C.E.; Greenway, F.L. Dietary fiber and satiety: The effects of oats on satiety. Nutr. Rev. 2016, 74, 131–147. [Google Scholar] [CrossRef] [PubMed] [Green Version]
- Barber, T.M.; Kabisch, S.; Pfeiffer, A.; Weickert, M.O. The health benefits of dietary fibre. Nutrients 2020, 12, 3209. [Google Scholar] [CrossRef] [PubMed]
- Müller, M.; Canfora, E.E.; Blaak, E.E. Gastrointestinal Transit Time, Glucose Homeostasis and Metabolic Health: Modulation by Dietary Fibers. Nutrients 2018, 10, 275. [Google Scholar] [CrossRef] [Green Version]
- Kristensen, M.; Jensen, M.G. Dietary fibres in the regulation of appetite and food intake. Importance of viscosity. Appetite 2011, 56, 65–70. [Google Scholar] [CrossRef] [PubMed]
- Zaremba SM, M.; Gow, I.F.; Drummond, S.; McCluskey, J.T.; Steinert, R.E. Effects of oat β-glucan consumption at breakfast on ad libitum eating, appetite, glycemia, insulinemia and GLP-1 concentrations in healthy subjects. Appetite 2018, 128, 197–204. [Google Scholar] [CrossRef]
- Wanders, A.J.; van den Borne, J.J.; de Graaf, C.; Hulshof, T.; Jonathan, M.C.; Kristensen, M.; Mars, M.; Schols, H.A.; Feskens, E.J. Effects of dietary fibre on subjective appetite, energy intake and body weight: A systematic review of randomized controlled trials. Obes. Rev. Off. J. Int. Assoc. Study Obes. 2011, 12, 724–739. [Google Scholar] [CrossRef]
- Dikeman, C.L.; Fahey, G.C. Viscosity as related to dietary fiber: A review. Crit. Rev. Food Sci. Nutr. 2006, 46, 649–663. [Google Scholar] [CrossRef]
- Juvonen, K.R.; Purhonen, A.K.; Salmenkallio-Marttila, M.; Lähteenmäki, L.; Laaksonen, D.E.; Herzig, K.H.; Uusitupa, M.I.; Poutanen, K.S.; Karhunen, L.J. Viscosity of oat bran-enriched beverages influences gastrointestinal hormonal responses in healthy humans. J. Nutr. 2009, 139, 461–466. [Google Scholar] [CrossRef] [Green Version]
- Beck, E.J.; Tapsell, L.C.; Batterham, M.J.; Tosh, S.M.; Huang, X.F. Increases in peptide Y-Y levels following oat beta-glucan ingestion are dose-dependent in overweight adults. Nutr. Res. 2009, 29, 705–709. [Google Scholar] [CrossRef] [Green Version]
- Vitaglione, P.; Lumaga, R.B.; Stanzione, A.; Scalfi, L.; Fogliano, V. Beta-glucan-enriched bread reduces energy intake and modifies plasma ghrelin and peptide YY concentrations in the short term. Appetite 2009, 53, 338–344. [Google Scholar] [CrossRef]
- Mateos, R.; García-Cordero, J.; Bravo-Clemente, L.; Sarriá, B. Evaluation of novel nutraceuticals based on combination of oat beta-glucans and a green coffee phenolic extract to combat obesity and its comorbidities. A randomized, dose-response, parallel trial. Food Funct. under review.
- Hassanzadeh-Rostami, Z.; Faghih, S. Effect of Dietary Fiber on Serum Leptin Level: A Systematic Review and Meta-Analysis of Randomized Controlled Trials. Exp. Clin. Endocrinol. Diabetes Off. J. Ger. Soc. Endocrinol. Ger. Diabetes Assoc. 2021, 129, 322–333. [Google Scholar] [CrossRef]
- Wren, A.M.; Seal, L.J.; Cohen, M.A.; Brynes, A.E.; Frost, G.S.; Murphy, K.G.; Dhillo, W.S.; Ghatei, M.A.; Bloom, S.R. Ghrelin enhances appetite and increases food intake in humans. J. Clin. Endocrinol. Metab. 2001, 86, 5992. [Google Scholar] [CrossRef]
- Cummings, D.E.; Weigle, D.S.; Frayo, R.S.; Breen, P.A.; Ma, M.K.; Dellinger, E.P.; Purnell, J.Q. Plasma ghrelin levels after diet-induced weight loss or gastric bypass surgery. N. Engl. J. Med. 2002, 346, 1623–1630. [Google Scholar] [CrossRef]
- Weickert, M.O.; Spranger, J.; Holst, J.J.; Otto, B.; Koebnick, C.; Möhlig, M.; Pfeiffer, A.F. Wheat-fibre-induced changes of postprandial peptide YY and ghrelin responses are not associated with acute alterations of satiety. Br. J. Nutr. 2006, 96, 795–798. [Google Scholar] [CrossRef]
- Hussein, G.M.; Matsuda, H.; Nakamura, S.; Hamao, M.; Akiyama, T.; Tamura, K.; Yoshikawa, M. Mate tea (Ilex paraguariensis) promotes satiety and body weight lowering in mice: Involvement of glucagon-like peptide-1. Biol. Pharm. Bull. 2011, 34, 1849–1855. [Google Scholar] [CrossRef] [PubMed] [Green Version]
- Gómez-Juaristi, M.; Martínez-López, S.; Sarria, B.; Bravo, L.; Mateos, R. Absorption and metabolism of yerba mate phenolic compounds in humans. Food Chem. 2018, 240, 1028–1038. [Google Scholar] [CrossRef] [PubMed] [Green Version]
- Bergmann, N.C.; Lund, A.; Gasbjerg, L.S.; Meessen, E.; Andersen, M.M.; Bergmann, S.; Hartmann, B.; Holst, J.J.; Jessen, L.; Christensen, M.B.; et al. Effects of combined GIP and GLP-1 infusion on energy intake, appetite and energy expenditure in overweight/obese individuals: A randomised, crossover study. Diabetologia 2019, 62, 665–675. [Google Scholar] [CrossRef] [Green Version]
- Anini, Y.; Brubaker, P.L. Role of leptin in the regulation of glucagon-like peptide-1 secretion. Diabetes 2003, 52, 252–259. [Google Scholar] [CrossRef] [PubMed] [Green Version]
- Olthof, M.R.; van Dijk, A.E.; Deacon, G.F.; Heine, R.J.; van Dam, R.M. Acute effects of decaffeinated coffee and the major coffee components chlorogenic acid and trigonelline on incretin hormones. Nutr. Metab. 2011, 8, 8–10. [Google Scholar] [CrossRef] [Green Version]


| Proteins | Carbohydrates | Fats | Dietary Fibre | Energy Value (Kcal) | |
|---|---|---|---|---|---|
| Standarized breakfast | |||||
| Natural yogurt, 250 g | 10 | 14 | 7 | 0 | 154 |
| Sugar, 16 g | 0 | 16 | 0 | 0 | 64 |
| Gouda cheese, 20 g | 5 | 0 | 5 | 0 | 60 |
| Ham, 60 g | 18 | 6 | 9 | 0 | 182 |
| White bread, 50 g | 4 | 25 | 2 | 2 | 136 |
| Standardized lunch | |||||
| Paella, 750 g | 26 | 173 | 39 | 3 | 1162 |
| White bread, 90 g | 8 | 46 | 1 | 3 | 235 |
| Yogurt, 125 g | 5 | 7 | 3 | 0 | 77 |
| GC | GC/BG | p | GC | GC/BG | p | ||
|---|---|---|---|---|---|---|---|
| Energy (Kcal) | PUFA (g) | ||||||
| Baseline | 2019 ± 100 | 2023 ± 112 | N.S. | Baseline | 12.4 ± 1.1 | 12.8 ± 1.2 | N.S. |
| Final | 2115 ± 118 | 2128 ± 115 | N.S. | Final | 11.9 ± 0.9 | 11.8 ± 0.7 | N.S. |
| Rate of change | 8.3 ± 5.7 | 8.5 ± 5.6 | N.S. | Rate of change | 1.9 ± 9.0 | 10.4 ± 8.0 | N.S. |
| Protein (g) | PUFA/SFA | ||||||
| Baseline | 82.8 ± 4.1 | 79.7 ± 3.6 | N.S. | Baseline | 0.50 ± 0.04 | 0.48 ± 0.04 | N.S. |
| Final | 82.6 ± 4.7 | 86.9 ± 4.5 | N.S. | Final | 0.42 ± 0.03 | 0.46 ± 0.04 | N.S. |
| Rate of change | 5.4 ± 7.1 | 12.2 ± 6.1 | N.S. | Rate of change | 3.9 ± 9.6 | 4.0 ± 8.2 | N.S. |
| CHO (g) | [PUFA + MUFA]/SFA | ||||||
| Baseline | 199 ± 11 | 205 ± 14 | N.S. | Baseline | 1.8 ± 0.1 | 1.8 ± 0.1 | N.S. |
| Final | 204 ± 11 | 200 ± 13 | N.S. | Final | 1.9 ± 0.1 | 1.9 ± 0.1 | N.S. |
| Rate of change | 9.8 ± 7.2 | 6.3 ± 8.7 | N.S. | Rate of change | 14.0 ± 8.3 | 15.1 ± 8.3 | N.S. |
| Fibre (g) | Cholesterol (mg) | ||||||
| Baseline | 24.0 ± 1.7 | 23.8 ± 1.7 | N.S. | Baseline | 316 ± 25 | 331 ± 23 | N.S. |
| Final | 22.1 ± 1.9 | 22.2 ± 1.3 | N.S. | Final | 295 ± 28 | 359 ± 34 | N.S. |
| Rate of change | −5.5 ± 8.3 | 2.8 ± 5.8 | N.S. | Rate of change | 6.4 ± 10.8 | 25.4 ± 15.0 | N.S. |
| Fat (g) | Calcium (mg) | ||||||
| Baseline | 84.7 ± 5.8 | 86.5 ± 6.3 | N.S. | Baseline | 743 ± 42 | 14.3 ± 0.8 | N.S. |
| Final | 93.6 ± 6.8 | 96.9 ± 7.2 | N.S. | Final | 703 ± 61 | 16.0 ± 1.0 | N.S. |
| Rate of change | 16.4 ± 7.9 | 18.0 ± 7.6 | N.S. | Rate of change | −1.3 ± 6.4 | 12.2 ± 6.6 | N.S. |
| SFA (g) | Iron (mg) | ||||||
| Baseline | 28.0 ± 2.2 | 28.5 ± 2.0 | N.S. | Baseline | 13.6 ± 0.7 | 86.4 ± 2.4 | N.S. |
| Final | 30.9 ± 2.8 | 31.5 ± 2.7 | N.S. | Final | 13.4 ± 0.7 | 86.8 ± 2.4 | N.S. |
| Rate of change | 18.2 ± 10.0 | 19.3 ± 10.4 | N.S. | Rate of change | 11.1 ± 9.4 | 0.4 ± 0.3 | N.S. |
| MUFA (g) | BW (Kg) | ||||||
| Baseline | 34.5 ± 2.4 | 34.7 ± 2.2 | N.S. | Baseline | 86.8 ± 2.4 | 86.4 ± 2.4 | N.S. |
| Final | 41.9 ± 3.2 | 42.8 ± 3.2 | N.S. | Final | 86.4 ± 2.3 | 86.8 ± 2.4 | N.S. |
| Rate of change | 30.9 ± 10.0 | 29.3 ± 8.9 | N.S. | Rate of change | −0.4 ± 0.3 | 0.4 ± 0.3 | N.S. |
| GC | GC/BG | |||||||||||
|---|---|---|---|---|---|---|---|---|---|---|---|---|
| pg/mL | Time (min) | 30 | 60 | 90 | 150 | 210 | 30 | 60 | 90 | 150 | 210 | p *1 |
| PYY | Day = 0 | 1615 ± 275 | 1543 ± 277 | 1528 ± 277 | 1532 ± 289 | 1542 ± 284 | 1636 ± 282 | 1584 ± 274 | 1557 ± 259 | 1577 ± 293 | 1568 ± 286 | N.S. |
| Day = 56 | 1638 ± 298 | 1593 ± 298 | 1564 ± 304 | 1537 ± 290 | 1539 ± 300 | 1620 ± 281 | 1591 ± 287 | 1531 ± 268 | 1509 ± 256 | 1527 ± 293 | N.S. | |
| p *2 | N.S. | N.S. | N.S. | N.S. | N.S. | N.S. | N.S. | N.S. | N.S. | N.S. | ||
| CCK | Day = 0 | 566 ± 65 | 550 ± 42 | 549 ± 47 | 541 ± 55 | 535 ± 50 | 576 ± 48 | 557 ± 49 | 552 ± 44 | 589 ± 49 | 552 ± 45 | N.S. |
| Day = 56 | 581 ± 56 | 570 ± 48 | 591 ± 51 | 531 ± 45 | 557 ± 60 | 593 ± 50 | 582 ± 49 | 582 ± 48 | 576 ± 57 | 570 ± 62 | N.S. | |
| p *2 | N.S. | N.S. | N.S. | N.S. | N.S. | N.S. | N.S. | N.S. | N.S. | N.S. | ||
| Ghrelin | Day = 0 | 464 ± 91 | 344 ± 40 | 351 ± 40 | 285 ± 42 | 258 ± 42 | 361 ± 71 | 401 ± 60 | 409 ± 92 | 302 ± 35 | 308 ± 59 | N.S. |
| Day = 56 | 395 ± 89 | 385 ± 83 | 440 ± 97 | 330 ± 42 | 338 ± 40 | 325 ± 44 | 376 ± 62 | 366 ± 77 | 278 ± 33 | 332 ± 56 | N.S. | |
| p *2 | N.S. | N.S. | N.S. | N.S. | 0.027 | N.S. | N.S. | N.S. | N.S. | N.S. | ||
| Leptin | Day = 0 | 3419 ± 409 | 3446 ± 414 | 2844 ± 303 | 2458 a ± 315 | 2016 ± 374 | 3375 ± 517 | 3471 ± 345 | 3372 ± 427 | 3216 b ± 390 | 2341 ± 308 | 0.025 |
| Day = 56 | 3518 ± 491 | 3414 ± 440 | 2863 ± 388 | 2961 ± 411 | 2512 ± 367 | 3290 ± 510 | 3136 ± 481 | 3117 ± 528 | 2568 ± 366 | 2350 ± 339 | N.S. | |
| p *2 | N.S. | N.S. | N.S. | N.S. | N.S. | N.S. | N.S. | N.S. | N.S. | N.S. | ||
| GLP-1 | Day = 0 | 208 ± 20 | 200 ± 24 | 222 ± 26 | 194 ± 18 | 176 ± 18 | 165 ± 21 | 199 ± 16 | 208 ± 23 | 201 ± 13 | 165 ± 14 | N.S. |
| Day = 56 | 174 ± 17 | 178 ± 15 | 209 ± 20 | 226 ± 18 | 192 ± 19 | 191 ± 20 | 183 ± 22 | 213 ± 24 | 197 ± 28 | 203 ± 23 | N.S. | |
| p *2 | N.S. | N.S. | N.S. | N.S. | N.S. | N.S. | N.S. | N.S. | N.S. | N.S. | ||
| AUC (pg/mL*h) | CMAX (pg/mL) | TMAX (h) | |||||||||
|---|---|---|---|---|---|---|---|---|---|---|---|
| GC | GC/BG | p AUC | GC | GC/BG | p CMAX | GC | GC/BG | p TMAX | |||
| PYY | Day = 0 | 4624 ± 843 | 4730 ± 835 | N.S. | 1644 ± 283 | 1673 ± 280 | N.S. | 0.7 ± 0.4 | 0.8 ± 0.3 | N.S. | |
| Day = 56 | 4686 ± 888 | 4621 ± 815 | N.S. | 1664 ± 295 | 1636 ± 282 | N.S. | 0.2 ± 0.1 | 0.3 ± 0.1 | N.S. | ||
| p *2 | N.S. | N.S. | N.S. | N.S. | N.S. | N.S. | |||||
| CCK | Day = 0 | 1637 ± 146 | 1701 ± 137 | N.S. | 617 ± 63 | 609 ± 46 | N.S. | 0.8 ± 0.3 | 0.8 ± 0.3 | N.S. | |
| Day = 56 | 1682 ± 147 | 1736 ± 159 | N.S. | 615 ± 58 | 616 ± 54 | N.S. | 0.7 ± 0.3 | 1.2 ± 0.4 | N.S. | ||
| p *2 | N.S. | N.S. | N.S. | N.S. | N.S. | N.S. | |||||
| Ghrelin | Day = 0 | 966 ± 117 | 1054 ± 175 | N.S. | 501 ± 85 | 471 ± 80 | N.S. | 0.4 ± 0.2 | 0.6 ± 0.1 | N.S. | |
| Day = 56 | 1120 ± 182 | 988 ± 153 | N.S. | 494 ± 88 | 407 ± 75 | 0.038 | 1.6 ± 0.3 | 1.4 ± 0.4 | N.S. | ||
| p *2 | N.S. | N.S. | N.S. | N.S. | 0.03 | N.S. | |||||
| Leptin | Day = 0 | 8177 ± 937 | 9495 ± 994 | N.S. | 3699 ± 411 | 4176 ± 417 | N.S. | 0.2 ± 0.1 | 1.0 ± 0.3 | N.S. | |
| Day = 56 | 8950 ± 1072 | 8472 ± 1165 | N.S. | 3779 ± 480 | 3769 ± 555 | N.S. | 0.7 ± 0.4 | 0.5 ± 0.3 | N.S. | ||
| p *2 | N.S. | N.S. | N.S. | N.S. | N.S. | N.S. | |||||
| GLP-1 | Day = 0 | 601 ± 53 | 580 ± 41 | N.S. | 250 ± 18 | 232 ± 15 | N.S. | 0.8 ± 0.3 | 1.0 ± 0.2 | N.S. | |
| Day = 56 | 612 ± 47 | 598 ± 69 | N.S. | 241 ± 18 | 234 ± 22 | N.S. | 1.7 ± 0.2 | 1.4 ± 0.3 | N.S. | ||
| p *2 | N.S. | N.S. | N.S. | N.S. | N.S. | N.S. | |||||
Publisher’s Note: MDPI stays neutral with regard to jurisdictional claims in published maps and institutional affiliations. |
© 2021 by the authors. Licensee MDPI, Basel, Switzerland. This article is an open access article distributed under the terms and conditions of the Creative Commons Attribution (CC BY) license (https://creativecommons.org/licenses/by/4.0/).
Share and Cite
Redondo-Puente, M.; Mateos, R.; Seguido, M.A.; García-Cordero, J.; González, S.; Tarradas, R.M.; Bravo-Clemente, L.; Sarriá, B. Appetite and Satiety Effects of the Acute and Regular Consumption of Green Coffee Phenols and Green Coffee Phenol/Oat β-Glucan Nutraceuticals in Subjects with Overweight and Obesity. Foods 2021, 10, 2511. https://doi.org/10.3390/foods10112511
Redondo-Puente M, Mateos R, Seguido MA, García-Cordero J, González S, Tarradas RM, Bravo-Clemente L, Sarriá B. Appetite and Satiety Effects of the Acute and Regular Consumption of Green Coffee Phenols and Green Coffee Phenol/Oat β-Glucan Nutraceuticals in Subjects with Overweight and Obesity. Foods. 2021; 10(11):2511. https://doi.org/10.3390/foods10112511
Chicago/Turabian StyleRedondo-Puente, Mónica, Raquel Mateos, Miguel A. Seguido, Joaquín García-Cordero, Susana González, Rosa M. Tarradas, Laura Bravo-Clemente, and Beatriz Sarriá. 2021. "Appetite and Satiety Effects of the Acute and Regular Consumption of Green Coffee Phenols and Green Coffee Phenol/Oat β-Glucan Nutraceuticals in Subjects with Overweight and Obesity" Foods 10, no. 11: 2511. https://doi.org/10.3390/foods10112511