
Digital Shade Matching in Dentistry: A Systematic Review


Abstract
:
1. Introduction
2. Materials and Methods
2.1. Protocol
2.2. Eligibility Criteria for Systematic Review
2.2.1. Inclusion Criteria
- Articles using digital colour analyses (for example, XYZ tristimulus, RGB, CIELAB, ∆E) for the head and neck region with or without measurable outcomes;
- Articles investigating digital shade taking used in dentistry and characterised according to the following MeSH terms [23]:
- Colourimetry in dentistry;
- Endodontics and dental aesthetics;
- Prosthodontics;
- Maxillofacial prostheses;
- Periodontics and oral pathology;
- Orthodontics;
- Studies using computerised digital photography for dental and facial skin colour matching/analyses (see below Section 2.2.2, Exclusion Criteria No 4);
- Research articles, clinical trials, clinical case reports and case series, dental techniques, and short communications describing the implementation of digital photography to carry out dental shade matching (see below Section 2.2.2, Exclusion Criteria no 5).
2.2.2. Exclusion Criteria
- Studies that used only visual methods for shade taking;
- Studies that used spectrophotometric or colourimetric methods but did not include digital photography;
- Articles that described only the use of dental clinical photography;
- Studies describing only the development of cosmetic beauty products;
- Editorials, opinions, review articles, reports on lectures, book chapters, conference proceedings, non-peer-reviewed articles, non-English articles, and patent files.
2.3. Information Sources
2.4. Search Keywords
2.5. Data Collection Process
2.6. Risk of Bias and Applicability
2.7. Data Items and Summary Measures
- 0
- Articles that did not compare non-proximity digital methods with measurements from a spectrophotometer or colourimeter or that used conventional visual methods;
- 1
- Studies that did not adequately define the characteristics of the PICO comparison group;
- 2
- Studies that did define group characteristics but compared only non-proximity methods with contact or conventional visual methods but without quantitative measurements;
- 3
- Studies that compared non-proximity digital methods for shade matching with measurements from a spectrophotometer, colourimeter, and conventional visual methods using quantitative measurements.
- Population: studies reporting dental aesthetic treatment;
- Intervention: studies that used non-proximity devices for shade taking;
- Comparison: dental shades from non-proximity devices compared with the Criterion Standards we adopted (viz measurements from spectrophotometers and colourimeters, and conventional visual methods);
- Outcome: whether shades obtained with non-proximity devices had better clinical outcomes than those obtained with the use of spectrophotometers, colourimeters, or conventional visual methods.
2.8. Updated Searches
3. Results
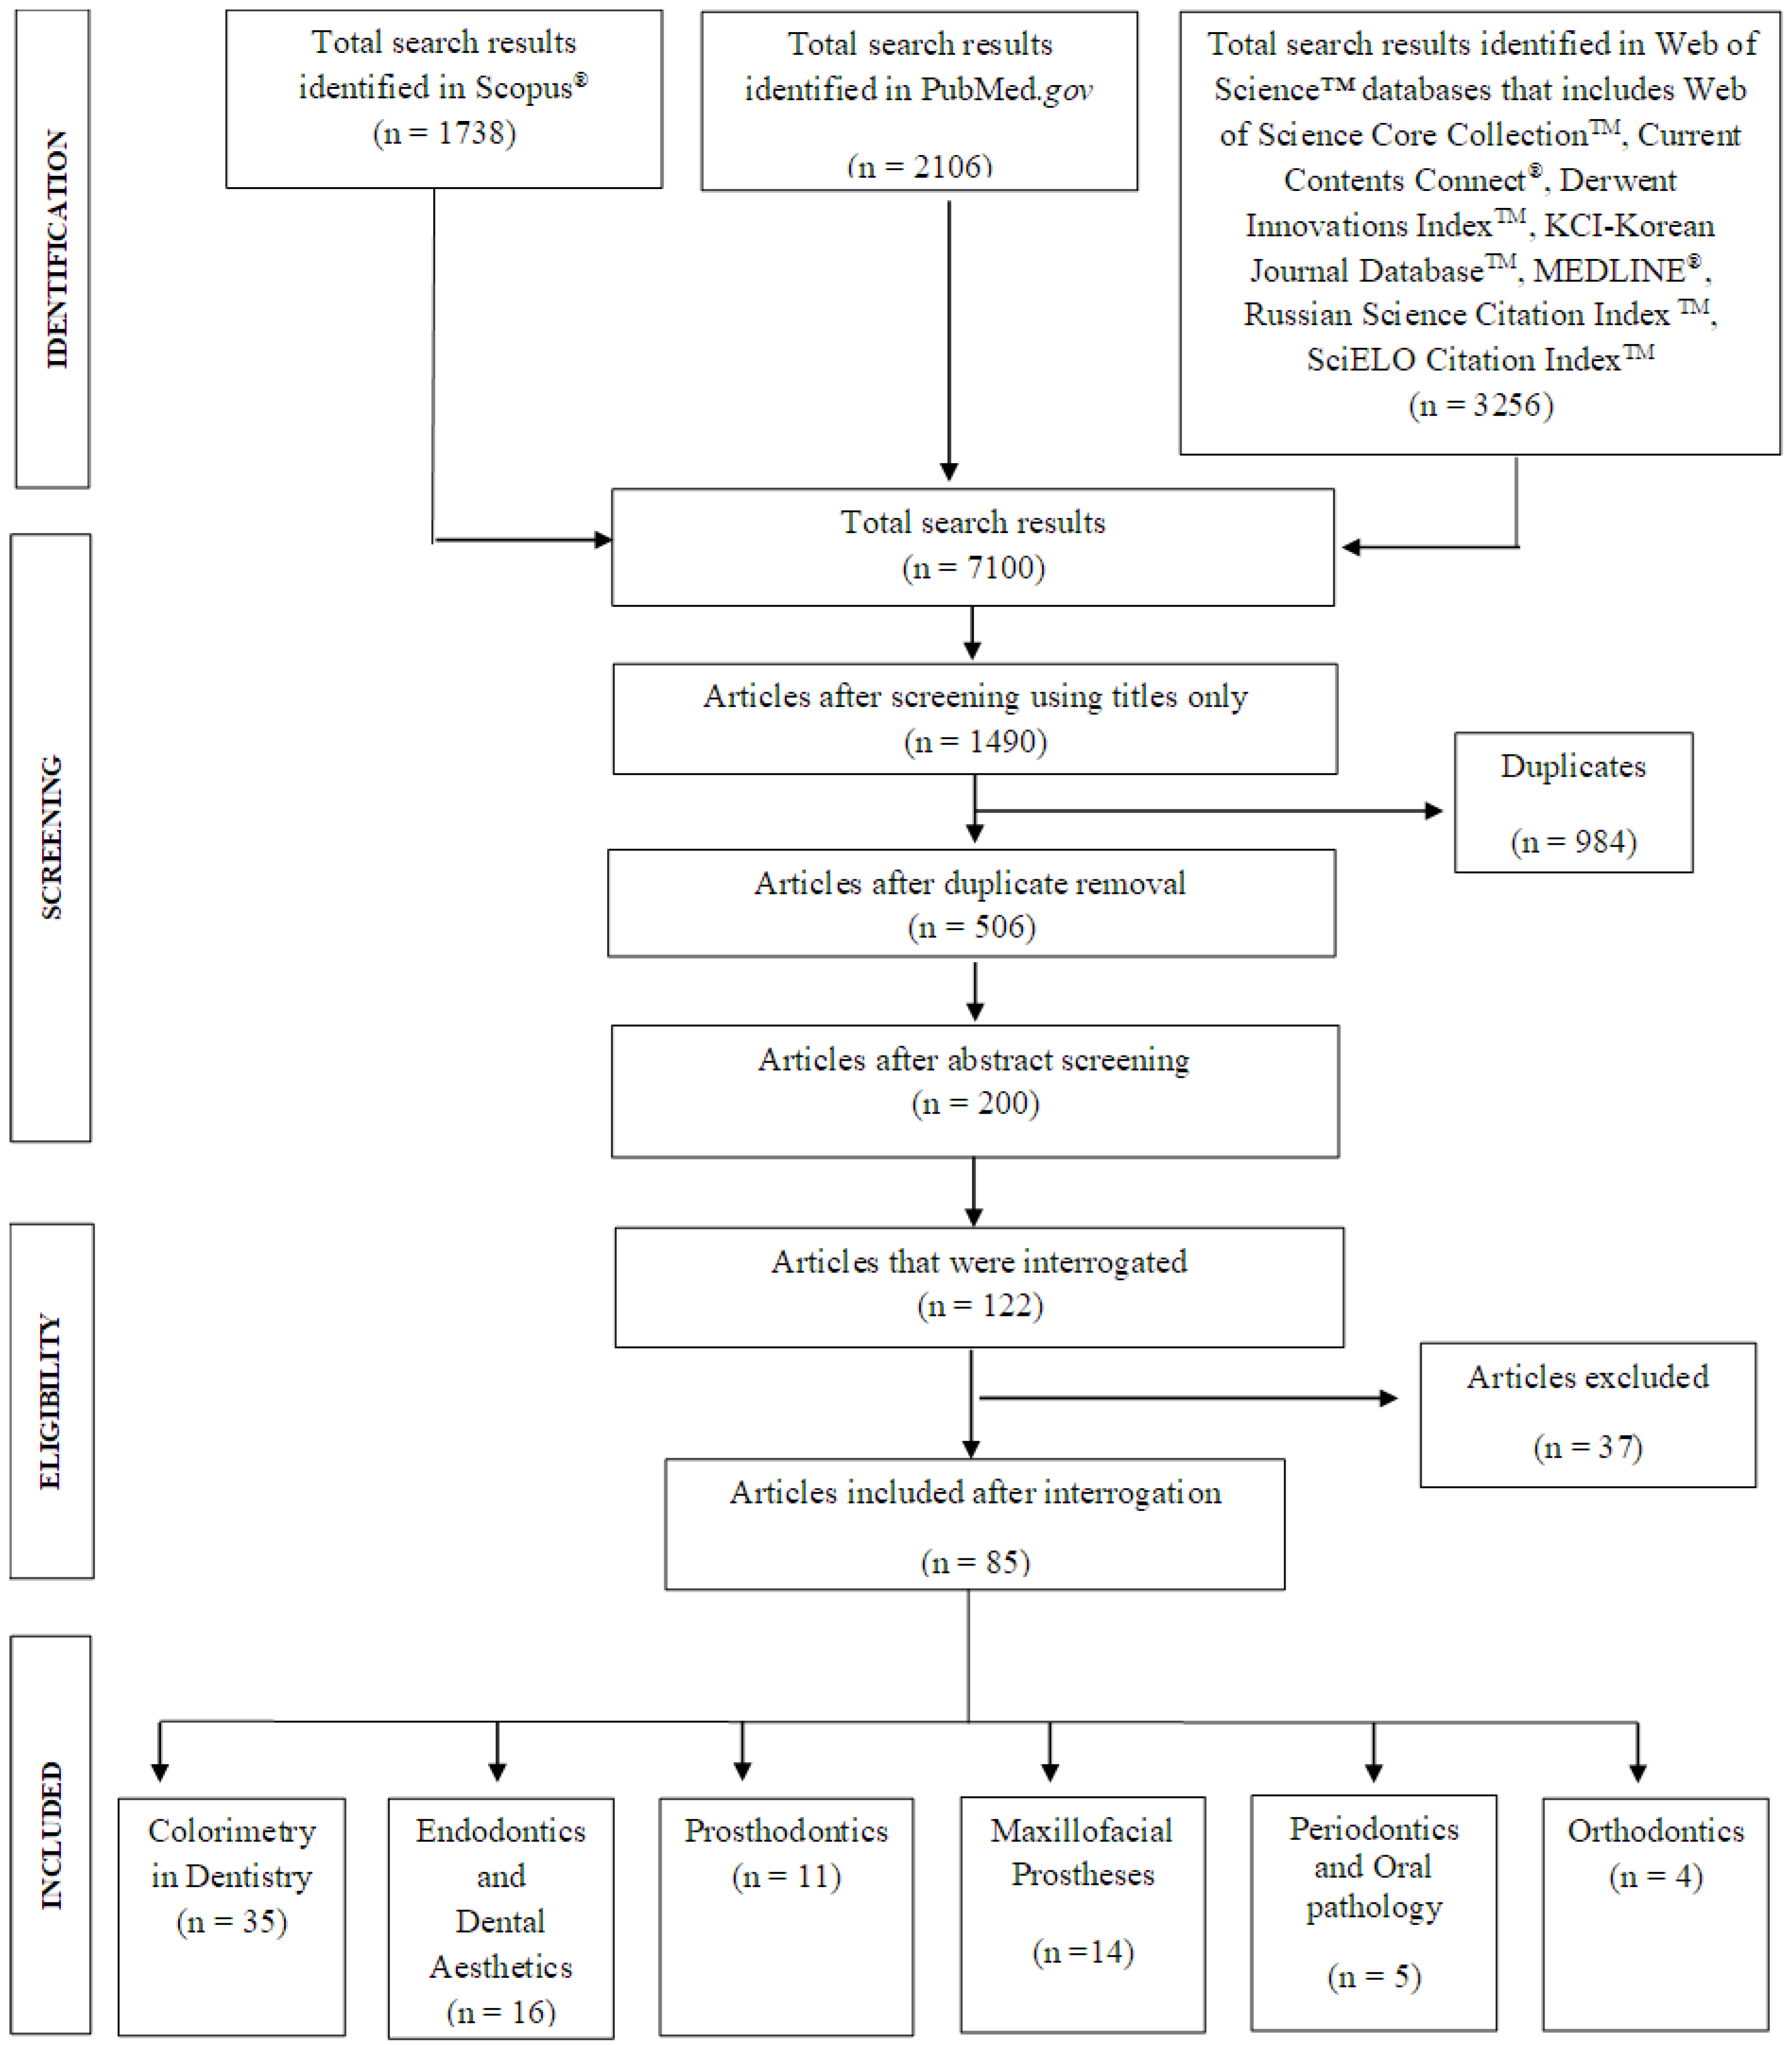
3.1. Literature Search and Quality of the Papers
- (1)
- (2)
- (3)
- (4)
- (5)
- (6)
3.2. Do Digital Systems Have Better Clinical Outcomes Than a Spectrophotometer, Colourimeter, or Conventional Visual Methods?
- The study in [15] compared the colour agreements for 50 maxillary incisor teeth recorded in a dental clinic during the daytime using calibrated digital photographs, measurements from a spectrophotometer, and visual methods using commercially available shade tabs (VITAPAN® classical shade guide). The average colour differences (∆E) against the spectrophotometer measurements were 1.69, and statistical Z-test (raw scores above the mean, where a score of 0 indicates that the raw score is identical to the mean score) scores were similar (Z = −3.2) for both the spectrophotometry and the digital photography, yet the kappa agreement between visual shade matching and spectrophotometry was very low (K = 0.2).
- The investigation in [11] recruited three independent observers who compared photographs obtained using an intraoral camera, a visual method using a commercial shade guide (Vita 3D-Master), and a spectrophotometer. Measurements from intraoral cameras were significantly correlated (p < 0.01), with conventional visual analyses at 1650 Lux light intensity and colour temperature (6500K and 3800K), although measurements from spectrophotometers showed only weak correlations when compared with both intra-oral cameras and conventional visual methods.
- In the study in [5], all three methods were used to record restoration shades. The findings suggest that lighter shades produced lower colour differences (∆E = 2.60) when measurements were taken using photographs and a spectrophotometer. In contrast, darker shades of restorations produced larger colour differences for all methods (∆E = 7.7 to 8.2).
- The study in [47] compared the effectiveness of camera white balance in determining the accuracy of selecting the shade tab with measurements from a spectrophotometer and the visual method. In a blinded test (visual method), the ability of practitioners to colour match improved significantly (p < 0.05) when the camera’s white balance was calibrated. In addition, they also found high correlations (r > 0.96, (p < 0.001)) between the measurements from a spectrophotometer and the use of digital photography.
- Finally, the study in [21] compared 3D scanning to visual analysis and the use of a spectrophotometer. The authors reported that spectrophotometers more accurately captured shades compared to 3D scanning and visual analysis.
- There were significant correlations observed for L* (lightness: r = 0.85) and b* values (yellow/blue axis: r = 0.96), but a* values (red/green axis: r = 0.58) showed a weaker correlation when measurements were compared with those from photographs and a colourimeter [16].
- There was no correlation when comparisons were made for visual analysis (using the Social Appeal Scale (p < 0.01) and the geometric asymmetric index (p = 0.02)) and digital photography [97]. However, one article reported [38] that observers’ shade-matching ability improved significantly (p < 0.04) when digital photographs were shown on a computer screen.
- The following eight studies reported ∆E value measurements from a spectrophotometer or colourimeter, digital camera, or visual methods, but not all three:
- i.
- ∆E = 0.09 (∆E = < 1.0 are colour differences that are not perceptible to the human eye) when predicted colour values were generated from a photograph using a regression model compared with colour values extracted directly from a photographed shade guide (Vident Inc., Brea, CA, USA) and software (Adobe Photoshop 7.0, San Jose, CA, USA) [49];
- ii.
- ∆E = 1.69 when comparisons were made for measurements from a spectrophotometer and digital photographs of maxillary incisor teeth [15];
- iii.
- ∆E = 2.3 (∆E = 2–10 are colour differences perceptible at a glance) when one set of digital CIELAB values was extracted directly from a computer screen and compared with the colour values measured with a colourimeter [75];
- iv.
- ∆E = 3.2 when CIELAB values were extracted using in-house software (Toodent, Babes-Bolyai University, Cluj-Napoca, Romania) from photographs of a shade guide (VITA Toothguide 3D-MASTER®, Bad Säckingen, Germany) and compared with spectrophotometer-generated values [31];
- v.
- ∆E = 6.94 when colour measurements were recorded from a 3D-printed custom shade guide, compared with measurements from a spectrophotometer [48];
- vi.
- ∆E = 7.35 when comparisons were made between visual analysis of maxillary central incisors and measurements from a spectrophotometer [7];
- vii.
- ∆E = 8.20 when comparisons were made between visual analysis and digital photographs of a reference tooth restored with resin composite shade A3 and a test tooth restored with composite shades DA4 and DA3.5 [5];
- viii.
- ∆E = 14.60 ± 5.20 for CIELAB values of carious tooth surfaces when photographed digitally compared with measurements from a colourimeter [94].
- Conventional visual methods for colour matching were also influenced by ill-defined observer opinions [3,4,43,44,84,89,103,104], training [4], gender [3,4], eye fatigue [43], and, strangely, observer monthly income [4]. With respect to monthly income, it was reported that observers with higher incomes preferred lighter tooth shades, whereas those from lower income groups preferred darker shades.
- Colour selection for ceramic restorations using photographs was shown to produce significantly different a* values (red to green) compared with colours matched using conventional shade tabs, resulting in the restoration appearing darker, with a greenish-yellow tint. Furnace-firing temperature of the ceramic, underlying coping materials, thickness of the restoration, and ceramic product brands also resulted in shade mismatches [70].
- Machine learning algorithms such as support-vector machines were used to enhance digital colour spaces [10,46] because they can mitigate inconsistency in ambient lighting when used in conjunction with digital or intra-oral cameras. Although there were minor shifts in a* (reddish tint) and b* (yellowish tint) values [46], there was good inter-device reliability.
3.3. Results from the Updated Search
4. Discussion
4.1. An Absence of a Gold Standard When Matching Shades
4.2. Measurements Used in Visual Shade Matching
4.3. Why Is There an Increasing Use of Non-Proximity Digital Recording Instruments for Shade Matching?
4.4. Factors That Influence the Accuracy of Shades Taken Using Digital Photography
4.5. Other Factors Affecting Shade Matching
4.6. The Future of Digital Shade Matching in Dentistry
4.7. Limitations
- To ensure a focused approach and manage the extensive data sources available, this article search was confined to specific databases and tailored research questions.
- Recognising the complexity of summarising comparisons between non-proximity digital shade-matching instruments, spectrophotometers (considered a high standard), and visual shade assessment (considered a low standard), this systematic review acknowledges the need for additional approaches. To address various aspects within this research field, further investigations are required, such as considering the number and type of specimens (e.g., natural tooth, shade tab, restorative material), the study design (in vitro or in vivo), colour measurement conditions, experiment type, and reported accuracy and precision.
- This systematic review did not include any brand-specific non-proximity or contact colour-measuring instruments, which allowed for a more generalised assessment of the field, considering a wider range of devices and their overall performance rather than specific brand characteristics.
5. Conclusions
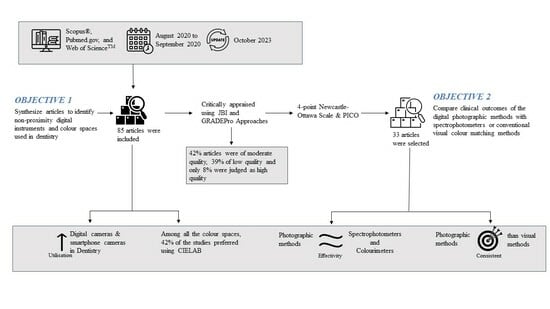
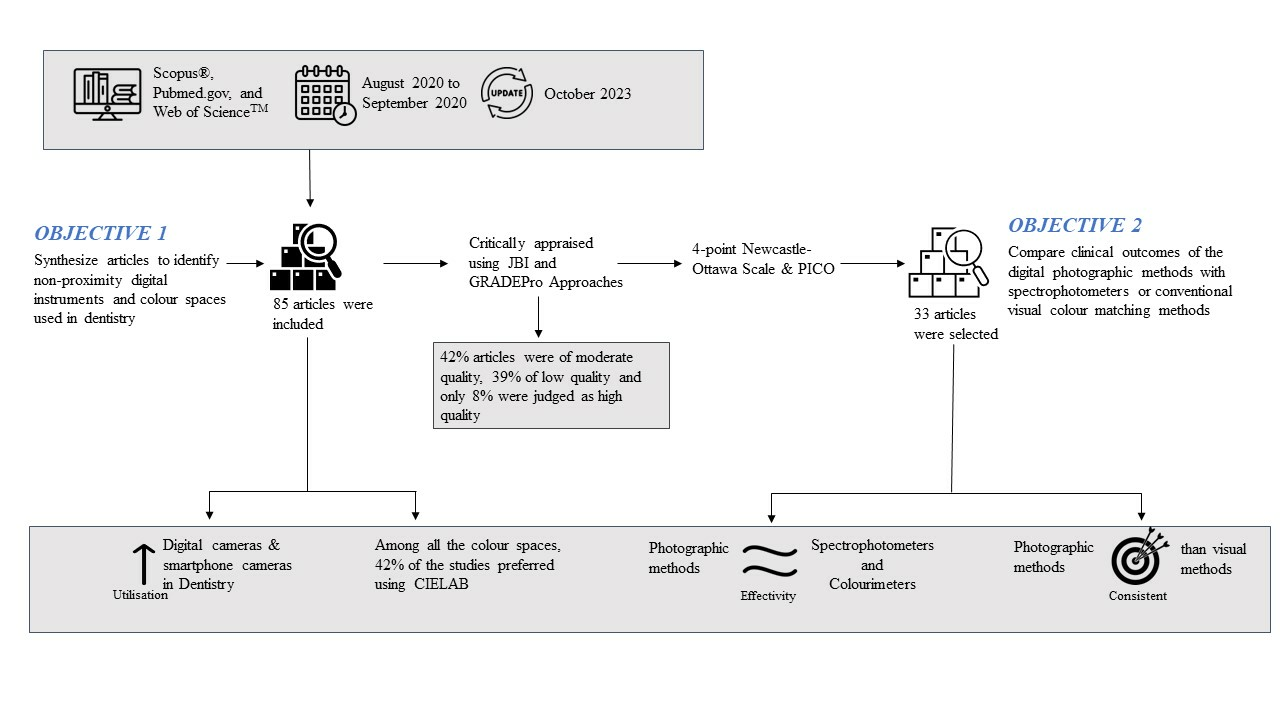
- In recent decades, the utilisation of digital cameras and smartphones for recording tooth shades has witnessed a significant increase. Among the studies examined (n = 85), 42% (n = 35) opted to use the CIELAB (International Commission on Illumination) colour space for their analyses.
- Under controlled conditions, non-proximity digital instruments consistently demonstrated more reliable clinical outcomes compared to conventional visual tooth shade-matching methods.
- Under controlled environments, digital instruments were found to be equally effective when compared to the use of spectrophotometers and colourimeters.
- There is no universally accepted gold standard for tooth shade matching due to the multitude of variables involved.
Supplementary Materials
Author Contributions
Funding
Institutional Review Board Statement
Informed Consent Statement
Data Availability Statement
Acknowledgments
Conflicts of Interest
References
- Nielsen, R.K.; Schrøder, K.C. The relative importance of social media for accessing, finding, and engaging with news: An eight-country cross-media comparison. Digit. J. 2014, 2, 472–489. [Google Scholar] [CrossRef]
- Kaplan, A.M.; Haenlein, M. Users of the world, unite! The challenges and opportunities of Social Media. Bus. Horiz. 2010, 53, 59–68. [Google Scholar] [CrossRef]
- Montero, J.; Gómez-Polo, C.; Santos, J.A.; Portillo, M.; Lorenzo, M.C.; Albaladejo, A. Contributions of dental colour to the physical attractiveness stereotype. J. Oral Rehabil. 2014, 41, 768–782. [Google Scholar] [CrossRef] [PubMed]
- Labban, N.; Al-Otaibi, H.; Alayed, A.; Alshankiti, K.; Al-Enizy, M.A. Assessment of the influence of gender and skin col-or on the preference of tooth shade in Saudi population. Saudi Dent. J. 2017, 29, 102–110. [Google Scholar] [CrossRef]
- Rauber, G.B.; Bernardon, J.K.; Vieira, L.C.C.; Baratieri, L.N. Evaluation of a technique for color correction in restoring anterior teeth. J. Esthet. Restor. Dent. 2017, 29, 309–316. [Google Scholar] [CrossRef]
- Paolone, G.; Orsini, G.; Manauta, J.; Devoto, W.; Putignano, A. Composite shade guides and color matching. Int. J. Esthet. Dent. 2014, 9, 164–182. [Google Scholar]
- Mahn, E.; Tortora, S.C.; Olate, B.; Cacciuttolo, F.; Kernitsky, J.; Jorquera, G. Comparison of visual analog shade matching, a digital visual method with a cross-polarized light filter, and a spectrophotometer for dental color matching. J. Prosthet. Dent. 2021, 125, 511–516. [Google Scholar] [CrossRef]
- Lam, W.Y.; Hsung, R.T.; Cheng, L.Y.; Pow, E.H. Mapping intraoral photographs on virtual teeth model. J. Dent. 2018, 79, 107–110. [Google Scholar] [CrossRef]
- Lazar, R.; Culic, B.; Gasparik, C.; Lazar, C.; Dudea, D. The accuracy of dental shade matching using cross-polarization photography. Int. J. Comput. Dent. 2019, 22, 343–351. [Google Scholar]
- Kim, M.; Kim, B.; Park, B.; Lee, M.; Won, Y.; Kim, C.-Y.; Lee, S. A Digital Shade-Matching Device for Dental Color Determination Using the Support Vector Machine Algorithm. Sensors 2018, 18, 3051. [Google Scholar] [CrossRef]
- Lasserre, J.-F.; Pop-Ciutrila, I.-S.; Colosi, H.-A. A comparison between a new visual method of colour matching by in-traoral camera and conventional visual and spectrometric methods. J. Dent. 2011, 39, e29–e36. [Google Scholar] [CrossRef] [PubMed]
- Albert, C.J.; Da Silva, E.N.; Penteado, M.M.; De Lima, D.R.; Kimpara, E.T.; Uemura, E.S. Color assessment in dental prostheses: The use of smartphones as process tools. Braz. Dent. Sci. 2019, 22, 573–577. [Google Scholar] [CrossRef]
- Sampaio, C.S.; Atria, P.J.; Hirata, R.; Jorquera, G. Variability of color matching with different digital photography tech-niques and a gray reference card. J. Prosthet. Dent. 2019, 121, 333–339. [Google Scholar] [CrossRef] [PubMed]
- Rashid, F.; Barman, A.; Farook, T.H.; Bin Jamayet, N.; Bin Yhaya, M.F.; Alam, M.K. Factors affecting color stability of maxillofacial prosthetic silicone elastomer: A systematic review and meta-analysis. J. Elastomers Plast. 2020, 53, 698–754. [Google Scholar] [CrossRef]
- Patankar, A.H.; Miyajiwala, J.S.; Kheur, M.G.; Lakha, T. Comparison of photographic and conventional methods for tooth shade selection: A clinical evaluation. J. Indian Prosthodont. Soc. 2017, 17, 273–281. [Google Scholar] [CrossRef]
- Yoon, H.-I.; Bae, J.-W.; Park, J.-M.; Chun, Y.-S.; Kim, M.-A.; Kim, M. A Study on Possibility of Clinical Application for Color Measurements of Shade Guides Using an Intraoral Digital Scanner. J. Prosthodont. 2016, 27, 670–675. [Google Scholar] [CrossRef]
- Jones, D.S.; Podolsky, S.H. The history and fate of the gold standard. Lancet 2015, 385, 1502–1503. [Google Scholar] [CrossRef]
- Brodsky, S.L.; Lichtenstein, B. The Gold Standard and the Pyrite Principle: Toward a Supplemental Frame of Reference. Front. Psychol. 2020, 11, 562. [Google Scholar] [CrossRef]
- AMA Manual of Style Committee. AMA Manual of Style: A Guide for Authors and Editors; Oxford University Press: Oxford, UK, 2020. [Google Scholar]
- Shih, P.; Liu, C. Comparative assessment of content-based face image retrieval in different color spaces. Int. J. Pattern Recognit. Artif. Intell. 2005, 19, 873–893. [Google Scholar] [CrossRef]
- Mehl, A.; Bosch, G.; Fischer, C.; Ender, A. In vivo tooth-color measurement with a new 3D intraoral scanning system in comparison to conventional digital and visual color determination methods. Int. J. Comput. Dent. 2017, 20, 343–361. [Google Scholar]
- Hoffmann, G. CIE Color Space. 2000. Available online: http://docs-hoffmann.de/howww41a.html (accessed on 24 October 2023).
- Yang, H.; Lee, H.J. Research Trend Visualization by MeSH Terms from PubMed. Int. J. Environ. Res. Public Health 2018, 15, 1113. [Google Scholar] [CrossRef] [PubMed]
- Aromataris, E.; Riitano, D. Constructing a search strategy and searching for evidence. Am. J. Nurs. 2014, 114, 49–56. [Google Scholar] [CrossRef] [PubMed]
- Schunemann, H. GRADE Handbook for Grading Quality of Evidence and Strength of Recommendation. Version 3.2. 2008. Available online: http://www.cc-ims.net/gradepro (accessed on 24 October 2023).
- Awad, S.; Varadhan, K.K.; Ljungqvist, O.; Lobo, D.N. A meta-analysis of randomised controlled trials on preoperative oral carbohydrate treatment in elective surgery. Clin. Nutr. 2013, 32, 34–44. [Google Scholar] [CrossRef] [PubMed]
- Furuya-Kanamori, L.; Xu, C.; Hasan, S.S.; Doi, S.A. Quality versus Risk-of-Bias assessment in clinical research. J. Clin. Epidemiol. 2021, 129, 172–175. [Google Scholar] [CrossRef]
- Barman, A.; Rashid, F.; Farook, T.H.; Jamayet, N.B.; Dudley, J.; Yhaya, M.F.B.; Alam, M.K. The Influence of Filler Particles on the Mechanical Properties of Maxillofacial Prosthetic Silicone Elastomers: A Systematic Review and Meta-Analysis. Polymers 2020, 12, 1536. [Google Scholar] [CrossRef]
- Wells, G.A. The Newcastle-Ottawa Scale (NOS) for assessing the quality of nonrandomised studies in meta-analyses. In Proceedings of the 3rd Symposium on Systematic Reviews: Beyond the Basics, Oxford, UK, 3–5 July 2000. [Google Scholar]
- Cal, E.; Sonugelen, M.; Guneri, P.; Kesercioglu, A.; Kose, T. Application of a digital technique in evaluating the reliability of shade guides. J. Oral Rehabil. 2004, 31, 483–491. [Google Scholar] [CrossRef]
- Culic, B.; Prejmerean, V.; Gasparik, C.; Culic, C.; Dragos, C.; Dudea, D. In Vitro Evaluation of New Dental Software for Shade Matching. Key Eng. Mater. 2014, 587, 360–365. [Google Scholar] [CrossRef]
- Carney, M.N.; Johnston, W.M. A novel regression model from RGB image data to spectroradiometric correlates opti-mized for tooth colored shades. J. Dent. 2016, 51, 45–48. [Google Scholar] [CrossRef]
- Denissen, H.; Dozic, A. Photometric assessment of tooth color using commonly available software. Eur. J. Esthet. Dent. 2010, 5, 204–215. [Google Scholar]
- Di Murro, B.; Gallusi, G.; Nardi, R.; Libonati, A.; Angotti, V.; Campanella, V. The relationship of tooth shade and skin tone and its influence on the smile attractiveness. J. Esthet. Restor. Dent. 2020, 32, 57–63. [Google Scholar] [CrossRef]
- Gurrea, J.; Gurrea, M.; Bruguera, A.; Sampaio, C.; Janal, M.; Bonfante, E.; Coelho, P.; Hirata, R. Evaluation of Dental Shade Guide Variability Using Cross-Polarized Photography. Int. J. Periodontics Restor. Dent. 2016, 36, e76–e81. [Google Scholar] [CrossRef] [PubMed]
- He, W.; Park, C.J.; Byun, S.; Tan, D.; Lin, C.Y.; Chee, W. Evaluating the relationship between tooth color and enamel thickness, using twin flash photography, cross-polarization photography, and spectrophotometer. J. Esthet. Restor. Dent. 2020, 32, 91–101. [Google Scholar] [CrossRef] [PubMed]
- Hein, S.; Zangl, M. The use of a standardized gray reference card in dental photography to correct the effects of five commonly used diffusers on the color of 40 extracted human teeth. Int. J. Esthet. Dent. 2016, 11, 246–259. [Google Scholar]
- Jarad, F.D.; Russell, M.D.; Moss, B.W. The use of digital imaging for colour matching and communication in restorative dentistry. Br. Dent. J. 2005, 199, 43–49. [Google Scholar] [CrossRef] [PubMed]
- Lindsey, D.; Wee, A. Assessing Tooth Color Differences in Digital Facial Portraits. J. Dent. Res. 2010, 89, 1254–1258. [Google Scholar] [CrossRef] [PubMed]
- Luo, W.; Naeeni, M.; Platten, S.; Wang, J.; Sun, J.N.; Westland, S.; Joiner, A. The in vitro and in vivo reproducibility of a video-based digital imaging system for tooth colour measurement. J. Dent. 2017, 67, S15–S19. [Google Scholar] [CrossRef] [PubMed]
- Maddula, R.T.; Abraham, A.; Ariga, P.; Jain, A.R. Comparison of shade matching photos taken with gray card and without gray card. Drug Invent. Today 2018, 10, 1632–1634. [Google Scholar]
- Sampaio, C.S.; Gurrea, J.; Gurrea, M.; Bruguera, A.; Atria, P.J.; Janal, M.; Bonfante, E.A.; Coelho, P.G.; Hirata, R. Dental shade guide variability for hues B, C, and D using cross-polarized photography. Int. J. Periodontics Restor. Dent. 2018, 38, 113–118. [Google Scholar] [CrossRef]
- Schropp, L. Shade Matching Assisted by Digital Photography and Computer Software. J. Prosthodont. Implant. Esthet. Reconstr. Dent. 2009, 18, 235–241. [Google Scholar] [CrossRef]
- Smith, R.N.; Collins, L.Z.; Naeeni, M.; Joiner, A.; Philpotts, C.J.; Hopkinson, I.; Jones, C.; Lath, D.L.; Coxon, T.; Hibbard, J.; et al. The in vitro and in vivo validation of a mobile non-contact camera-based digital imaging system for tooth colour measurement. J. Dent. 2008, 36, 15–20. [Google Scholar] [CrossRef]
- Tam, W.; Lee, H. Dental shade matching using a digital camera. J. Dent. 2012, 40, e3–e10. [Google Scholar] [CrossRef] [PubMed]
- Tam, W.-K.; Lee, H.-J. Accurate shade image matching by using a smartphone camera. J. Prosthodont. Res. 2017, 61, 168–176. [Google Scholar] [CrossRef] [PubMed]
- Tung, O.-H.; Lai, Y.-L.; Ho, Y.-C.; Chou, I.-C.; Lee, S.-Y. Development of digital shade guides for color assessment using a digital camera with ring flashes. Clin. Oral Investig. 2011, 15, 49–56. [Google Scholar] [CrossRef]
- Liu, Y.; Zhang, R.; Ye, H.; Wang, S.; Wang, K.P.; Liu, Y.; Zhou, Y. The development of a 3D colour reproduction system of digital impressions with an intraoral scanner and a 3D printer: A preliminary study. Sci. Rep. 2019, 9, 20052. [Google Scholar] [CrossRef] [PubMed]
- Wee, A.G.; Lindsey, D.T.; Kuo, S.; Johnston, W.M. Color accuracy of commercial digital cameras for use in dentistry. Dent. Mater. 2006, 22, 553–559. [Google Scholar] [CrossRef]
- Justiawan, D.A.W.; Hadi, R.P.; Nurhayati, A.P.; Prayogo, K.; Sigit, R.; Arief, Z. Comparative Analysis of Color Match-ing System for Teeth Recognition Using Color Moment. Med. Devices 2019, 12, 497. [Google Scholar] [CrossRef]
- Lin, T.-L.; Chuang, C.-H.; Chen, S.-L.; Lin, N.-H.; Miaou, S.-G.; Lin, S.-Y.; Chen, C.-A.; Liu, H.-W.; Villaverde, J.F. An efficient image processing methodology based on fuzzy decision for dental shade matching. J. Intell. Fuzzy Syst. 2019, 36, 1133–1142. [Google Scholar] [CrossRef]
- Caglar, A.; Yamanel, K.; Gulsahi, K.; Bagis, B.; Özcan, M. Could digital imaging be an alternative for digital colorimeters? Clin. Oral Investig. 2010, 14, 713–718. [Google Scholar] [CrossRef]
- Bentley, C.; Leonard, R.H.; Nelson, C.F.; Bentley, S.A. Quantitation of Vital Bleaching by Computer Analysis of Photographic Images. J. Am. Dent. Assoc. 1999, 130, 809–816. [Google Scholar] [CrossRef]
- Lath, D.L.; Johnson, C.; Smith, R.N.; Brook, A.H. Measurement of stain removal in vitro: A comparison of two instru-mental methods. Int. J. Dent. Hyg. 2006, 4, 129–132. [Google Scholar] [CrossRef]
- Lee, K.-Y.; Setchell, D.J.; Stokes, A.N.; Frankel, N.T.; Moles, D.R. Subjective and photometric determination of bleaching outcomes. Quintessence Int. 2007, 38, e41–e47. [Google Scholar] [PubMed]
- Athanasiou, A.E. Sensitivity of digital dental photo CIE L*a*b* analysis compared to spectrophotometer clinical assess-ments over 6 months. J. Dent. 2011, 24, 300–304. [Google Scholar]
- Takatsui, F.; de Andrade, M.F.; Neisser, M.P.; Barros, L.A.B.; Loffredo, L.d.C.M. CIE L*a*b*: Comparison of digital images obtained photographically by manual and automatic modes. Braz. Oral Res. 2012, 26, 578–583. [Google Scholar] [CrossRef] [PubMed]
- Tsuzuki, T.; Ueno, A.; Kajiwara, M.; Hanaoka, Y.; Uchiyama, H.; Agawa, Y.; Takagi, T.; Sato, Y. Evaluation of intraoral CCD camera for dental examination in forensic inspection. Leg. Med. 2002, 4, 40–46. [Google Scholar] [CrossRef]
- Yamanel, K.; Caglar, A.; Özcan, M.; Gulsah, K.; Bagis, B. Assessment of Color Parameters of Composite Resin Shade Guides Using Digital Imaging versus Colorimeter. J. Esthet. Restor. Dent. 2010, 22, 379–388. [Google Scholar] [CrossRef] [PubMed]
- de Almeida, C.V.V.B.; Pintado-Palomino, K.; Fortes, J.H.P.; da Motta, R.J.G.; de Freitas, B.N.; Matsumoto, W.; de Oliveira Cavalcanti, M.T.M.; Alves, J.; Tirapelli, C. Digital photography vs. clinical assessment of resin composite restorations. Odontology 2021, 109, 184–192. [Google Scholar] [CrossRef] [PubMed]
- Gadhia, K.; Shah, R.; Swaminathan, D.; Wetton, S.; Moran, J. Development of a stain shade guide to aid the measurement of extrinsic dental stain. Int. J. Dent. Hyg. 2006, 4, 98–103. [Google Scholar] [CrossRef]
- Garg, S.A.; Chavda, S. Color Masking White Fluorotic Spots by Resin Infiltration and Its Quantitation by Computerized Photographic Analysis: A 12-month Follow-up Study. Oper. Dent. 2020, 45, 1–9. [Google Scholar] [CrossRef]
- Guan, Y.H.; Lath, D.L.; Lilley, T.H.; Willmot, D.R.; Marlow, I.; Brook, A.H. The measurement of tooth whiteness by image analysis and spectrophotometry: A comparison. J. Oral Rehabil. 2005, 32, 7–15. [Google Scholar] [CrossRef]
- Irawan, B.; Masudi, S.M.; Han, H.X.; Othman, N.F.; Alam, M.K. In-Vitro Computer Analysis of Digital Images on Tooth-Colored Restorative Material Using L*a*b* Values. Int. Med. J. 2013, 20, 623–625. [Google Scholar]
- Jarad, F.D.; Albadri, S.; Mair, L.H. The use of objective digital matching to achieve an esthetic composite restoration. J. Clin. Dent. 2008, 19, 9–13. [Google Scholar] [PubMed]
- Kim, B.-R.; Kang, S.-M.; Kim, G.-M.; Kim, B.-I. Differences in the intensity of light-induced fluorescence emitted by resin composites. Photodiagn. Photodyn. Ther. 2016, 13, 114–119. [Google Scholar] [CrossRef] [PubMed]
- Kuzekanani, M.; Walsh, L.J. Quantitative Analysis of KTP Laser Photodynamic Bleaching of Tetracycline-Discolored Teeth. Photomed. Laser Surg. 2009, 27, 521–525. [Google Scholar] [CrossRef] [PubMed]
- Yousof, Y.; Salleh, N.; Yusof, F. Quantitative Evaluation of Masticatory Performance with Two-Color Mixing Ability Test: Development of a New Digital Method. Int. J. Prosthodont. 2020, 33, 224–228. [Google Scholar] [CrossRef] [PubMed]
- McCarty, G.A. Intraoral infrared color photography of radiotherapy patients. J. Prosthet. Dent. 1976, 35, 327–331. [Google Scholar] [CrossRef]
- Sam, P.; Suresh, V.; Ganapathy, D. Evaluation of variation in shade in metal-ceramic restoration from the shade Table. Drug Invent. Today 2019, 11, 2100–2103. [Google Scholar]
- Sadek, S.A.; Dehis, W.M.; Hassan, H. Different Materials Used as Denture Retainers and Their Colour Stability. Open Access Maced. J. Med. Sci. 2018, 6, 2173–2179. [Google Scholar] [CrossRef]
- Lakhanpal, S.; Neelima, M.S. Accuracy of Three Shade-matching Devices in Replicating the Shade of Metal Ceramic Restorations: An in vitro Study. J. Contemp. Dent. Pract. 2016, 17, 1003–1008. [Google Scholar] [CrossRef]
- Van Der BILT, A.; Speksnijder, C.M.; de Liz Pocztaruk, R.; Abbink, J.H. Digital image processing versus visual assess-ment of chewed two-colour wax in mixing ability tests. J. Oral Rehabil. 2012, 39, 11–17. [Google Scholar] [CrossRef]
- Vafaii, F.; Soltani, F.; Kadkhodaza, M.; Moshiri, Z.; Khoshhal, M. Evaluation of Color and Contour Matching Accuracy with Digital Photography and Direct Vision. Res. J. Med. Sci. 2012, 6, 46–50. [Google Scholar] [CrossRef]
- Oh, W.-S.; Pogoncheff, J.; O’brien, W.J. Digital Computer Matching of Tooth Color. Materials 2010, 3, 3694–3699. [Google Scholar] [CrossRef]
- Cal, E.; Güneri, P.; Kose, T. Digital analysis of mouthrinses? staining characteristics on provisional acrylic resins. J. Oral Rehabil. 2007, 34, 297–303. [Google Scholar] [CrossRef] [PubMed]
- Wozniak, W.T.; Muller, T.P.; Silverman, R.; Moser, J.B. Photographic assessment of colour changes in cold and heat-cure resins. J. Oral Rehabil. 1981, 8, 333–339. [Google Scholar] [CrossRef]
- Lagouvardos, P.; Spyropoulou, N.; Polyzois, G. Perceptibility and acceptability thresholds of simulated facial skin color differences. J. Prosthodont. Res. 2018, 62, 503–508. [Google Scholar] [CrossRef] [PubMed]
- Mulcare, D.C.; Coward, T.J. Suitability of a Mobile Phone Colorimeter Application for Use as an Objective Aid when Matching Skin Color during the Fabrication of a Maxillofacial Prosthesis. J. Prosthodont. 2019, 28, 934–943. [Google Scholar] [CrossRef] [PubMed]
- Delalleau, A.; Lagarde, J.-M.; George, J. An a priori Shading Correction Technique for Contact Imaging Devices. IEEE Trans. Image Process. 2011, 20, 2876–2885. [Google Scholar] [CrossRef]
- Jain, S.; Makkar, S.; Gupta, S.; Bhargava, A. Prosthetic Rehabilitation of Ocular Defect Using Digital Photography: A Case Report. J. Indian Prosthodont. Soc. 2010, 10, 190–193. [Google Scholar] [CrossRef]
- Pladellorens, J.; Pinto, A.; Segura, J.; Cadevall, C.; Anto, J.; Pujol, J.; Vilaseca, M.; Coll, J. A device for the color measurement and detection of spots on the skin. Ski. Res. Technol. 2008, 14, 65–70. [Google Scholar] [CrossRef]
- Wang, T.; Bu, J.-J.; Chen, C. A color based face detection system using multiple templates. J. Zhejiang Univ.-Sci. A 2003, 4, 162–165. [Google Scholar] [CrossRef]
- Sohaib, A.; Amano, K.; Xiao, K.; Yates, J.M.; Whitford, C.; Wuerger, S. Colour quality of facial prostheses in additive manufacturing. Int. J. Adv. Manuf. Technol. 2018, 96, 881–894. [Google Scholar] [CrossRef]
- Pricop, M.; Balescu, H.; Rosu, S.; Urechescu, H.; Crainiceanu, Z. Original Alternative Technique of Iris Fabrication for Ocular Prostheses. Mater. Plast. 2016, 53, 79–81. [Google Scholar]
- Grant, G.T.; Aita-Holmes, C.; Liacouras, P.; Garnes, J.; Wilson, W.O. Digital capture, design, and manufacturing of a facial prosthesis: Clinical report on a pediatric patient. J. Prosthet. Dent. 2015, 114, 138–141. [Google Scholar] [CrossRef] [PubMed]
- Xiao, K.; Zardawi, F.; van Noort, R.; Yates, J.M. Developing a 3D colour image reproduction system for additive manu-facturing of facial prostheses. Int. J. Adv. Manuf. Technol. 2014, 70, 2043–2049. [Google Scholar] [CrossRef]
- Buzayan, M.M.; Ariffin, Y.T.; Yunus, N.; Mahmood, W.A.A.B. Ocular Defect Rehabilitation Using Photography and Digital Imaging: A Clinical Report. J. Prosthodont. 2015, 24, 506–510. [Google Scholar] [CrossRef]
- Tan, K.W.; Stephen, I.D. Colour Detection Thresholds in Faces and Colour Patches. Perception 2013, 42, 733–741. [Google Scholar] [CrossRef]
- Xiao, K.; Zardawi, F.; van Noort, R.; Yates, J.M. Color reproduction for advanced manufacture of soft tissue prostheses. J. Dent. 2013, 41, e15–e23. [Google Scholar] [CrossRef]
- Seo, S.H.; Kim, J.H.; Kim, J.W.; Kye, Y.C.; Ahn, H.H. Better understanding of digital photography for skin color meas-urement: With a special emphasis on light characteristics. Ski. Res. Technol. 2011, 17, 20–25. [Google Scholar] [CrossRef]
- Ghanoum, M.; Ali, A.M.; Elshazly, S.; Alkabbany, I.; Farag, A.A. Frame stitching in human oral cavity environment us-ing intraoral camera. In Proceedings of the 2019 IEEE International Conference on Image Processing (ICIP), Taipei, Taiwan, 22–25 September 2019; pp. 1327–1331. [Google Scholar]
- Mayer, Y.; Ginesin, O.; Machtei, E.E. Photometric CIELAB Analysis of the Gingiva: A Novel Approach to Assess Response to Periodontal Therapy. J. Periodontol. 2017, 88, 854–859. [Google Scholar] [CrossRef]
- Iwami, Y.; Hayashi, N.; Yamamoto, H.; Hayashi, M.; Takeshige, F.; Ebisu, S. Evaluating the objectivity of caries removal with a caries detector dye using color evaluation and PCR. J. Dent. 2007, 35, 749–754. [Google Scholar] [CrossRef]
- Berdouses, E.D.; Koutsouri, G.D.; Tripoliti, E.E.; Matsopoulos, G.K.; Oulis, C.J.; Fotiadis, D.I. A computer-aided auto-mated methodology for the detection and classification of occlusal caries from photographic color images. Comput. Biol. Med. 2015, 62, 119–135. [Google Scholar] [CrossRef]
- Torlakovic, L.; Olsen, I.; Petzold, C.; Tiainen, H.; Øgaard, B. Clinical color intensity of white spot lesions might be a better predictor of enamel demineralization depth than traditional clinical grading. Am. J. Orthod. Dentofac. Orthop. 2012, 142, 191–198. [Google Scholar] [CrossRef] [PubMed]
- Berssenbrügge, P.; Lingemann-Koch, M.; Abeler, A.; Runte, C.; Jung, S.; Kleinheinz, J.; Denz, C.; Dirksen, D. Measuring facial symmetry: A perception-based approach using 3D shape and color. Biomed. Eng. Tech. 2015, 60, 39–47. [Google Scholar] [CrossRef] [PubMed]
- Jayaratne, Y.S.N.; Zwahlen, R.A.; Lo, J.; Cheung, L.K. Three-dimensional color maps: A novel tool for assessing cranio-facial changes. Surg. Innov. 2010, 17, 198–205. [Google Scholar] [CrossRef] [PubMed]
- Jayaratne, Y.S.N.; McGrath, C.P.J.; Zwahlen, R.A. How accurate are the fusion of cone-beam CT and 3-D stereopho-tographic images? PLoS ONE 2010, 7, e49585. [Google Scholar]
- Brough, E.; Donaldson, A.N.; Naini, F.B. Canine substitution for missing maxillary lateral incisors: The influence of ca-nine morphology, size, and shade on perceptions of smile attractiveness. Am. J. Orthod. Dentofac. Orthop. 2010, 138, 705.e1–705.e9. [Google Scholar] [CrossRef]
- Landis, J.R.; Koch, G.G. The Measurement of Observer Agreement for Categorical Data. Biometrics 1977, 33, 159–174. [Google Scholar] [CrossRef]
- Institute, J.B. Checklist of Joanna Briggs Critical Appraisal Tools for Use in JBI Systematic Reviews. 2017. Available online: https://jbi.global/sites/default/files/2019-05/JBI_Critical_Appraisal-Checklist_for_Systematic_Reviews2017_0.pdf (accessed on 24 October 2023).
- Kim, D.; Ahn, S.-Y.; Kim, J.; Park, S.-H. Interrater and intrarater reliability of FDI criteria applied to photographs of pos-terior tooth-colored restorations. J. Prosthet. Dent. 2017, 118, 18–25. [Google Scholar] [CrossRef]
- Newton, J.T.; Subramanian, S.S.; Westland, S.; Gupta, A.K.; Luo, W.; Joiner, A. The impact of tooth colour on the per-ceptions of age and social judgements. J. Dent. 2021, 112, 103771. [Google Scholar] [CrossRef]
- de Abreu, J.L.B.; Sampaio, C.S.; Jalkh, E.B.B.; Hirata, R. Analysis of the color matching of universal resin composites in anterior restorations. J. Esthet. Restor. Dent. 2021, 33, 269–276. [Google Scholar] [CrossRef]
- Soldo, M.; Illeš, D.; Ćelić, R.; Zlatarić, D.K. Assessment of Color Parameters on Maxillary Right Central Incisors Using Spectrophotometer and RAW Mobile Photos in Different Light Conditions. Acta Stomatol. Croat. 2020, 54, 353–362. [Google Scholar] [CrossRef]
- Kalman, L. Development of a novel dental shade determination application. J. Dent. Res. Dent. Clin. Dent. Prospect. 2020, 14, 73–76. [Google Scholar] [CrossRef] [PubMed]
- Bhat, V.; Kelkar, K.C.; Dogra, E.S.; Prasad, D.K.; Hegde, C. A comparison between visual, digital photography and polarizing filter photography for shade selection. Indian J. Dent. Res. 2020, 31, 712–717. [Google Scholar] [CrossRef]
- Suganya, S.P.; Manimaran, P.; Saisadan, D.; Kumar, C.D.; Abirami, D.; Monnica, V. Spectrophotometric evaluation of shade selection with digital and visual methods. J. Pharm. Bioallied Sci. 2020, 12, S319–S323. [Google Scholar] [CrossRef] [PubMed]
- Rutkūnas, V.; Dirsė, J.; Bilius, V. Accuracy of an intraoral digital scanner in tooth color determination. J. Prosthet. Dent. 2020, 123, 322–329. [Google Scholar] [CrossRef]
- Rashid, F.; Bin Jamayet, N.; Farook, T.H.; Al-Rawas, M.; Barman, A.; Johari, Y.; Noorani, T.Y.; Abdullah, J.Y.; Eusufzai, S.Z.; Alam, M.K. Color variations during digital imaging of facial prostheses subjected to unfiltered ambient light and image calibration techniques within dental clinics: An in vitro analysis. PLoS ONE 2022, 17, e0273029. [Google Scholar] [CrossRef] [PubMed]
- Ginesin, O.; Zigdon-Giladi, H.; Gabay, E.; Machtei, E.E.; Mijiritsky, E.; Mayer, Y. Digital photometric analysis of gingival response to periodontal treatment. J. Dent. 2022, 127, 104331. [Google Scholar] [CrossRef]
- Chung, H.-J.; Lim, S.-A.; Lim, H.-K.; Jung, S.-K. Perceptual and quantitative analysis of discoloration of orthodontic elas-tomeric chains by food. BMC Oral Health 2023, 23, 124. [Google Scholar] [CrossRef]
- Duong, D.L.; Kabir, M.H.; Kuo, R.F. Automated caries detection with smartphone color photography using machine learning. Health Inform. J. 2021, 27, 14604582211007530. [Google Scholar] [CrossRef]
- Ebeid, K.; Sabet, A.; Della Bona, A. Accuracy and repeatability of different intraoral scanners on shade determination. J. Esthet. Restor. Dent. 2021, 33, 844–848. [Google Scholar] [CrossRef]
- Hein, S.; Modrić, D.; Westland, S.; Tomeček, M. Objective shade matching, communication, and reproduction by combining dental photography and numeric shade quantification. J. Esthet. Restor. Dent. 2021, 33, 107–117. [Google Scholar] [CrossRef]
- Ulloa, J.J.; Salazar-Gamarra, R.; Mesquita, A.M.M.; Aguirre, F.; Dib, L.L. A Digital Method to Fabricate the Ocular Portion of an Orbital Prosthesis with a Smartphone Camera, Color Calibration and Digital Printing. J. Prosthodont. 2021, 30, 91–94. [Google Scholar] [CrossRef] [PubMed]
- Jorquera, G.J.; Atria, P.J.; Galán, M.; Feureisen, J.; Imbarak, M.; Kernitsky, J.; Cacciuttolo, F.; Hirata, R.; Sampaio, C.S. A comparison of ceramic crown color difference between different shade selection methods: Visual, digi-tal camera, and smartphone. J. Prosthet. Dent. 2022, 128, 784–792. [Google Scholar] [PubMed]
- Bakhtiari, F.; Mohammadi, A.; Bakhtiari, Z.; Mighani, F. Validity and reliability of tooth color selection by smartphone photography and software applications. J. Indian Prosthodont. Soc. 2021, 21, 281–286. [Google Scholar] [CrossRef]
- Raza, F.B.; Kumar, V.A.; Jacob, A.; Ali, A. Assessment of a smartphone-based software application as a potential digital tool in tooth shade selection: A prospective clinical study. Quintessence Int. 2021, 52, 608–617. [Google Scholar] [CrossRef]
- Shehadeh, S.; Levi, L.; Shamir, D. Clinical evaluation of a novel radiofrequency-based toothbrush for teeth whitening and reduction of teeth stains: A pilot study. Clin. Exp. Dent. Res. 2021, 7, 1096–1102. [Google Scholar] [CrossRef]
- Garner, H.R. Combating unethical publications with plagiarism detection services. In Urologic Oncology: Seminars and Original Investigations; Elsevier: Amsterdam, The Netherlands, 2011; pp. 95–99. [Google Scholar]
- Blue Jay. Forest Preserve District Will County. 2019. Available online: https://www.reconnectwithnature.org/news-events/the-buzz/nature-curiosity-why-are-blue-jays-blue (accessed on 24 October 2023).
- Duggan, P.F. Time to abolish ‘gold standard’. BMJ Br. Med. J. 1992, 304, 1568. [Google Scholar]
- He, Y.; Xue, G.-H.; Fu, J.-Z. Fabrication of low cost soft tissue prostheses with the desktop 3D printer. Sci. Rep. 2014, 4, 6973. [Google Scholar] [CrossRef]
- Jirsa, P. SLRLounge/Ambient Light. Available online: https://www.slrlounge.com/glossary/ambient-light-definition/ (accessed on 24 October 2023).


| Author (Year) | Digital Method Examined | Method Evaluated against | Analysis Performed | Study Outcomes | Associations and Correlations | Funding Sources |
|---|---|---|---|---|---|---|
| Mahn, 2020 [7] | Photographs of maxillary central incisor with cross-polarising filters (60 observers) | Spectrophotometer | ∆E | ∆E = 6.12 | Not reported | Not stated |
| He, 2020 [36] | Photographs with and without cross-polarisation filter of maxillary incisor teeth | Spectrophotometer | CIELAB | Not reported | Highly significant correlations (p < 0.0001) were observed. | Not stated |
| Liu, 2019 [48] | 3D-printed custom colour chart | Manufacturer-provided colour chart | ∆E | ∆E = 2.19–11.23 for teeth and gingival shades | Not reported |
|
| Lagouvardos, 2018 [78] | Digital photographs of facial skin colour (81 skin specimens) | Visual analysis | CIELAB | Δa* and Δb* values (2.0–2.5 units) that were judged acceptable | Not reported | Not stated |
| Yoon, 2018 [16] | Digitally scanned images | Colourimeter | CIELAB | Significant differences (p < 0.001) were observed for all three (L* a* b*) values. | L* (p < 0.05) and b* (p < 0.05) values were strongly correlated to each other but a* values (p < 0.05) showed a weaker correlation. | Not stated |
| Labban, 2017 [4] | Digital photographs | Visual Analysis | Acceptability Test | Shade preferences varied significantly (p ≤ 0.05) between male and female observers. Female observers preferred lighter tooth shades (p < 0.05). | Associations were found between observers’ preferred shade tabs and their education level (p = 0.036) and monthly income (p = 0.009). | King Saud University, Saudi Arabia |
| Mehl, 2017 [21] | Tooth shades obtained by the 3D scanner |
| ∆E | Spectrophotometer was more accurate than 3D scanner and visual method | Not reported | Not stated |
| Miyajiwala, 2017 [15] | Digital photographs of tooth shades |
| ∆E | ∆E = 1.69 for the spectrophotometer | Significant agreement on tooth shade selection (kappa = 0.20; p < 0.01) for spectrophotometer and visual methods | Not stated |
| Kim, 2017 [103] | Digital photographs of dental restorations one month following placement (2 observers) | Visual analysis | Agreement | Significant differences (p < 0.001) between methods were found. | Observer 1 showed higher proportions of agreement (Pa = 0.58–0.97) than Observer 2 (Pa = 0.53–0.73). | The Ministry of Health and Welfare, Republic of Korea (HI16C-0272-010016) |
| Rauber, 2017 [5] | Digital photographs of restorations with different shades (GA3.5, GA4) placed at different cavity depths (0.5 mm, 0.7 mm, 1 mm) |
| ∆E | GA3.5: ∆E = 2.60 GA4 at 0.7 mm: ∆E = 7.7 GA4 at 0.5 mm: ∆E = 8.2 | Laypeople identified colours a little more accurately (87%) than dentists (83%). Lighter shades of restoration were more acceptable for cavity depths of 0.5 mm and 0.7 mm. Darker shades of restoration were more acceptable for 1.0 mm-deep cavities. | Funding was not stated (but materials were donated by Ivoclar Vivadent Inc.). |
| Lakhanpal, 2016 [72] | Digital photographs of extracted premolar teeth | Spectrophotometer | CIELAB | L* and a* values produced significantly different outcomes (p < 0.001), whereas no difference was observed for b* values (p > 0.05). | Not reported | Not stated |
| Berssenbrügge, 2015 [97] | Digital photography | Visual analysis (asymmetry index) | Correlation | Not reported | Colour asymmetry index and geometric asymmetric index showed significant correlation (r = 0.43, (p = 0.017)) | Deutsche Krebshilfe (German Cancer Aid) |
| Culic, 2014 [31] | In-house software (TooDent) | Spectrophotometer | ∆E | In-house software-generated photograph in ∆E < 3.20 for 81% of readings | Strong correlation (r = 0.91; p < 0.001) observed between in-house software -generated photographs and spectrophotometry | UMF internal Grant (27020/18/2011) |
| Montero, 2014 [3] | Digital photographs of teeth with different shades | Visual analysis (Dental students) | ∆E | ∆E values for darker tooth colours were 8.5 for females and 6.4 for males. ∆E values for lighter tooth colours were 9.9 for females and 8.6 for males | Social Appeal Scale was correlated with psychological competences (r = 0.87), relationship satisfaction (r = 0.84), and social abilities (r = 0.83; (p < 0.01)) | Department of Surgery of the University of Salamanca |
| Xiao, 2014 [87] | Camera photogrammetry to create 3D skin colour chart | Spectrophotometer | ∆E | ΔE = 3–4 | Not reported | Wellcome trust Translational Research Award UK—Automated Rapid Manufacture of Facial Soft Tissue Protheses and Fripp Design Limited, UK |
| Xiao, 2013 [90] | 3D-printed colour chart for skin colour | Spectrophotometer | ∆E | ∆E < 3.0 | Not reported | Wellcome trust Translational Research Award UK—Automated Rapid Manufacture of Facial Soft Tissue Protheses and Fripp Design Limited, UK |
| Tam, 2012 [45] | Digital photographs of shade guide | Visual analysis | Accuracy of RGB, HSV, XYZ, and CIELAB | Increased accuracy with both CIELAB and HSV (0.75 and 0.67) compared with RGB (0.55) and XYZ (0.50) | Not reported | Not stated |
| Lasserr, 2011 [11] | Photography using an intraoral camera | Direct visual analysis | Chroma (L, M, R) | Not reported | Significant agreement (p < 0.05) for intraoral photography compared with direct visual analysis for shades of canines and central incisor teeth | Not stated |
| Direct visual analysis | Spectrophotometer | Not reported | Correlation co-efficient was lower when comparing direct visual analysis with spectrophotometer | |||
| Indirect and direct visual analysis | Spectrophotometer | Not reported | Correlation coefficient was higher (p < 0.01) when comparing direct visual analyses and intraoral photographs | |||
| Athanasios, 2011 [56] | 18% grey card-calibrated digital photographs | Spectrophotometer | CIELAB | Spectrophotometer errors were greater (L* = 1.44, a* = 0.43 and b* = 0.62) than those of calibrated digital photographs: (L* = 0.97, a* = 0.67, and b* = 1.25). | Not reported | Not stated |
| Delalleau, 2011 [88] | Digital photography and software calibration to measure skin colour | Colourimeter | ∆E | ∆E < 3.0 | Not reported | Not stated |
| Tung, 2010 [47] | Shade tabs generated in CWB (Camera White Balance) and AWB (Auto White Balance) setups | Spectrophotometer and visual analysis (observers were asked to compare photographs generated using CWB and AWB) | Correlation | Colour -matching abilities of operators improved significantly (p < 0.05) from 67% in AWB to 93% when using CWB | Significantly high correlation was found, (r > 0.96, (p < 0.001)) between CWB and spectrophotometer. No significant correlation was found (r = 0.04, (p = 0.483)) for a* values when all three methods were compared. | Taipei Veterans General Hospital, Taipei, Taiwan (V96C1-045) |
| Lindsey, 2010 [39] | Digital photographs of maxillary incisors | Visual analysis | ∆E | ∆E = 1.45–2.90 | Not reported |
|
| Yamanel, 2010 [59] | Digital photographs of dental composite resin | Colourimeter | ∆E | Significant differences were observed for L* (p < 0.05) and a* (p < 0.05) values, whereas b* (p > 0.05) showed no significant difference | Not reported | Not stated |
| Won-suk Oh, 2010 [75] | Multiple photographs of shade tabs were quantified using the photo colourimetric method (PCM). | Visual analysis: Observers were asked to choose the best matched shade tabs from a computer screen. | ∆E | ∆E = 2.3 | Not reported | Not stated |
| Caglar, 2009 [52] | Digital photographs of dental shade tabs | Colourimeter | ∆E | Colourimeter showed lower L* values (p < 0.01) than standard digital photographs | Not reported | Not stated |
| Digital photographs taken at different colour temperatures | Colourimeter | ∆E | At 2700 K, a* and b* values for digital images exhibited no significant colour differences (p > 0.01). At 2700K to 6500K and beyond, there were significant colour differences in a* and b* (p < 0.01 and p < 0.001, respectively). | L* and b* values obtained from colourimeter and digital photographs showed high levels of correlation. | ||
| Schrop, 2009 [43] | Software-calibrated photographs | Visual analysis performed in clinic | HSV | When viewing on a computer screen, observers showed significantly better (p < 0.02) tooth colour-matching capabilities for software-calibrated images compared with visual analysis. | Not reported | Not stated |
| Digital photographs of teeth | Visual analysis | HSV | No significant difference (p > 0.02) was found between digital photographs and visual analysis. | There was a significant correlation (p = 0.01) between the times taken to perform the computer screen-based colour analysis procedure and the visual analysis method. | ||
| Jarad, 2008 [65] | Digitally measured colour values of shade tabs | Manufacturer-provided colour values of shade tabs | ∆E | Not reported | Significant correlation (r = 0.97, (p < 0.01)) was observed between the digital and manufacturer-provided colour values. | Not stated |
| Iwami, 2007 [94] | Digital photographs of caries following application of a detector dye | Colourimeter | ∆E | ∆E ranged from 4.70 ± 2.90 to 14.60 ± 5.20 | Not reported |
|
| Gadhia, 2006 [61] | Observers used photographs with a custom-made shade guide | Visual analysis (using the Lobene Stain Index) | Agreement | Not reported | Photographs of custom-made shade guide showed better agreement among observers (K = 0.57 to 0.93) than use of the Lobene Stain Index (K = 0.38 to 0.79) | Not stated |
| Lath, 2006 [54] | Digital photographs of stained teeth before and after removal of stains | Spectrophotometer | Only L* value measured | Not reported | Strong negative correlation coefficient (r = 0.98) | Not stated |
| Wee, 2006 [49] | Photographs of dental shade tabs taken with various digital cameras calibrated using an in-house algorithm | Manufacturer-provided colour values | ∆E | All cameras showed significant differences (p = < 0.0001). | High correlation was observed (r = 0.98) between digitally evaluated and manufacturer-provided colour values. | USPHS grant from the National Institutes of Health (R15 EY013527) |
| Jarad, 2005 [38] | Software-based colour calibration (Adobe Photoshop©) | Visual analysis | ∆E | Significant (p < 0.001) differences between software-based colour calibration (Adobe Photoshop©) and visual analysis | Not reported | Not stated |
| Guan, 2005 [63] | Digital photographs of teeth during bleaching | Spectrophotometer | Effect of brushing time on tooth whitening using a toothbrush | Not reported | Intervention had little effect on either image (p < 0.31) or spectrophotometer (p < 0.22) | Not stated |
| Whitening effect of 43% hydrogen peroxide bleaching agent | Not reported | Significant (p < 0.05) whitening effect for both regimens |
Disclaimer/Publisher’s Note: The statements, opinions and data contained in all publications are solely those of the individual author(s) and contributor(s) and not of MDPI and/or the editor(s). MDPI and/or the editor(s) disclaim responsibility for any injury to people or property resulting from any ideas, methods, instructions or products referred to in the content. |
© 2023 by the authors. Licensee MDPI, Basel, Switzerland. This article is an open access article distributed under the terms and conditions of the Creative Commons Attribution (CC BY) license (https://creativecommons.org/licenses/by/4.0/).
Share and Cite
Rashid, F.; Farook, T.H.; Dudley, J. Digital Shade Matching in Dentistry: A Systematic Review. Dent. J. 2023, 11, 250. https://doi.org/10.3390/dj11110250
Rashid F, Farook TH, Dudley J. Digital Shade Matching in Dentistry: A Systematic Review. Dentistry Journal. 2023; 11(11):250. https://doi.org/10.3390/dj11110250
Chicago/Turabian StyleRashid, Farah, Taseef Hasan Farook, and James Dudley. 2023. "Digital Shade Matching in Dentistry: A Systematic Review" Dentistry Journal 11, no. 11: 250. https://doi.org/10.3390/dj11110250