Article

Quantum Yield Enhancement of Carbon Quantum Dots Using Chemical-Free Precursors for Sensing Cr (VI) Ions

1
Institute of Sustainable Industries and Livable Cities (ISILC), Victoria University, Melbourne, VIC 3011, Australia
2
School of Engineering, RMIT University, Melbourne, VIC 3000, Australia
3
Department of Chemical and Biological Engineering, Monash University, Clayton, VIC 3800, Australia
*
Author to whom correspondence should be addressed.
Inorganics 2024, 12(4), 96; https://doi.org/10.3390/inorganics12040096
Submission received: 9 February 2024 / Revised: 14 March 2024 / Accepted: 25 March 2024 / Published: 28 March 2024
(This article belongs to the Special Issue Synthesis and Application of Luminescent Materials)

Abstract

:
Quantum yield illustrates the efficiency that a fluorophore converts the excitation light into fluorescence emission. The quantum yield of carbon quantum dots (CQDs) can be altered via precursors, fabrication conditions, chemical doping, and surface modifications. In this study, CQDs were first fabricated from whole-meal bread using a chemical-free hydrothermal route, and a low quantum yield (0.81%) was obtained. The combination of whole-meal bread, soybean flour, and lemon juice generated CQDs with almost four folds of enhancement in quantum yield. Detailed characterization suggested that these CQDs were subjected to more complete hydrothermal reactions and had zwitterionic surfaces. The CQDs could selectively detect Cr (VI) ions with a limit of detection (LOD) of 8 ppm. This study shows that the enhancement of the quantum yield of CQDs does not need chemicals, and it is achievable with food precursors.

1. Introduction

Clean water is crucial for human health and well-being, and water pollution leads to illness and even deaths. Any contamination of water with chemicals or other hazardous substances is called water pollution. Nowadays, urbanization is one of the main causes of water pollution. Industries involving dyes, wood preservation, leather tanning, and chrome plating release heavy metal ions into the environment [1,2]. Chromium (VI) is the most common pollutant among many possibly toxic trace elements in industrial wastewater [3,4,5]. Chromium pollution can cause liver and kidney damage; however, the risk depends on the dose and duration of exposure [6]. Continuous exposure to chromium, even at low concentrations, can damage the skin, eyes, blood, and respiratory and immune systems [7,8]. Moreover, on a cellular level, the genotoxic effect of chromium can lead to oxidative stress, DNA damage, and tumor development [9,10]. Identifying polluted water is an essential measure to prevent Cr exposure and its consequences.
Several analytical techniques, such as atomic absorption spectrometry (AAS), inductively coupled plasma optical mass spectrometry (ICP-MS), and X-ray fluorescence spectroscopy (XRF) are used for the determination of Cr (VI). However, these techniques require bulky, non-portable, and expensive instruments, highly skilled operators, and long analysis times. In contrast, the use of fluorescent sensing materials can achieve fast analysis, low cost, portability, and high sensitivity. Carbon quantum dots (CQDs) are promising candidates for sensing Cr (VI) [11,12,13,14]. These fluorescent carbon nanoparticles can be synthesized via various simple methods using sustainable precursors. They possess remarkable optical, physical, biological, and catalytic properties, making them valuable for applications in environmental treatment, analytical techniques, sensing, biomedical devices, and energy regenerations. Quantum confinement effect, surface state and molecule state are three prevailing mechanisms to explain the photoluminescence of CQDs. Quantum confinement splits the energy levels and creates size-dependent bandgaps. When this nanomaterial is illuminated by a photon with sufficient energy, an electron will be excited and move from the valence band to the conduction band, creating an electron-hole pair termed an exciton [15]. When this exciton recombines, the energy will be released as fluorescence. For the surface-state mechanism, functional groups on CQD surfaces have various energy levels and result in a series of emissive traps. A high level of surface oxidation or other effective modifications can increase surface defects, altering emission features of the CQDs [16]. For the molecular state mechanism, the photoluminescence center is an organic fluorophore connected on the surface or interior of the carbon backbone, which exhibits emissions directly [17]. This tunable photoluminescence, along with alterable quantum yield and versatile surface functionalization routes, are some of the major appealing characteristics of CQDs. These features allow a diverse range of sensing applications for CQDs. The quantum yield (QY) of CQD is a substantial feature for fluorometric sensing, and it is defined as the ratio of the number of photons emitted to the number of photons absorbed [18] by the nanomaterial. The variation in precursors, fabrication routes, additives, and doping techniques could change the QY of CQDs.
Most CQDs derived from chemical precursors show comparatively high QYs. For example, anthracite and dimethylformamide produced CQDs with a QY of 47% [19]. In another instance, 80% of QY was obtained for the CQDs derived from citric acid and ethylenediamine [20]. Chang et al. produced CQDs from o-phenylenediamine that exhibited 68% of QY [21]. Generally, CQDs obtained from natural resources have very low QYs because of their complex composition and the difficulty of eliminating impurities. Many efforts have been made to improve the QY, and heteroatom doping and surface modification are the two most effective methods [22,23]. Liu et al. reported that the QY of CQDs from fresh tomatoes was 1.77%, and when they were modified with EDA and urea, the QY increased to 7.9% and 8.5%, respectively [24]. A few chemicals are commonly used to enhance the QY of CQDs. The chemicals with amine groups, such as ethylenediamine, are used as precursors for nitrogen dopants [25] to obtain the expected QY. Likewise, the usage of acids also produced CQDs with higher yields. Phosphoric acid, nitric acid, and citric acid are generally included during the synthesis or after the synthesis as surface passivation agents [26] to enhance the QY. However, when the CQDs derived from natural precursors are treated with chemicals to improve the QY, their biocompatibility is curtailed. These processes contested their safety in many applications.
In our previous research [27], CQDs were fabricated from three types of breads (white bread, whole-meal bread, and multigrain bread) using hydrothermal routes for bioimaging. All obtained CQDs were fluorescent in the absence of any additional surface modification techniques or doping materials. The CQDs prepared from whole-meal bread possessed higher QY (0.81%) than those derived from the other two types of precursors (0.33% and 0.63%, respectively). To further enhance the QY of the bread-derived CQDs without introducing any chemicals, we employed amine-rich soybean flour as a nitrogen source and concentrated lemon juice as an acidic medium for surface modification. Both soybean flour and concentrated lemon juice are easily accessible and cheap, showing great potential to replace harsh chemicals for producing biocompatible CQDs. The obtained chemical-free CQDs were extensively characterized to study the QY enhancement mechanism. The correlations between the physicochemical properties of the CQDs and their QYs were investigated. This study aimed to derive CQDs from edible precursors with enhanced QY and use them to selectively sense chromium (VI) ions.

2. Results and Discussion

2.1. Fabrication of CQD Samples

This study aims to produce CQDs with an enhanced QY using natural resources. Soybean flour and lemon juice are relevant for this purpose. Soybean flour contains more than 50% protein (56% on a moisture-free basis) [28]. Lemon juice is a natural acid source with 1.44 g of citric acid per ounce [29]. The CQDs were prepared by hydrothermal methods, which were very convenient for adding two or more precursors, and the process can be repeated as required. The reproducibility of the synthesis was good, and consistent characterization and sensing results were obtained from CQDs from different batches.

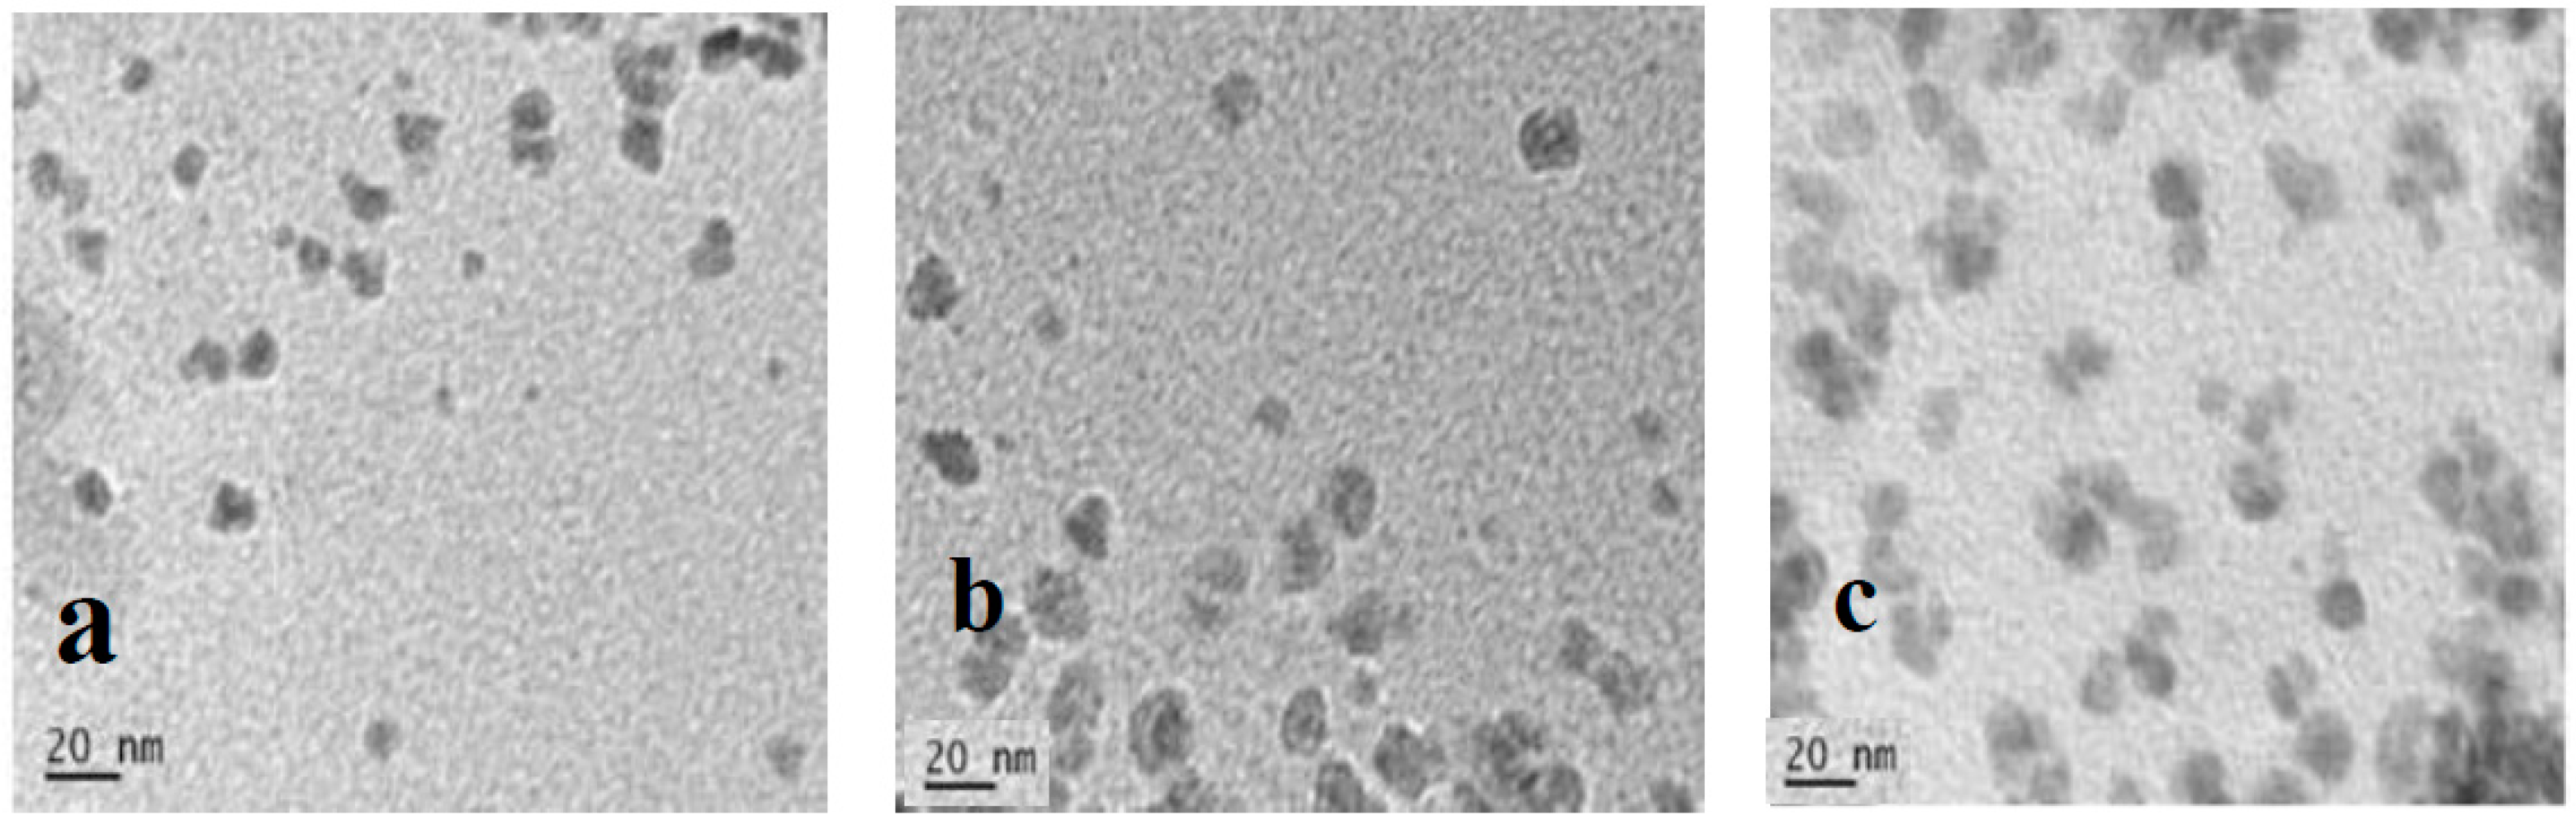
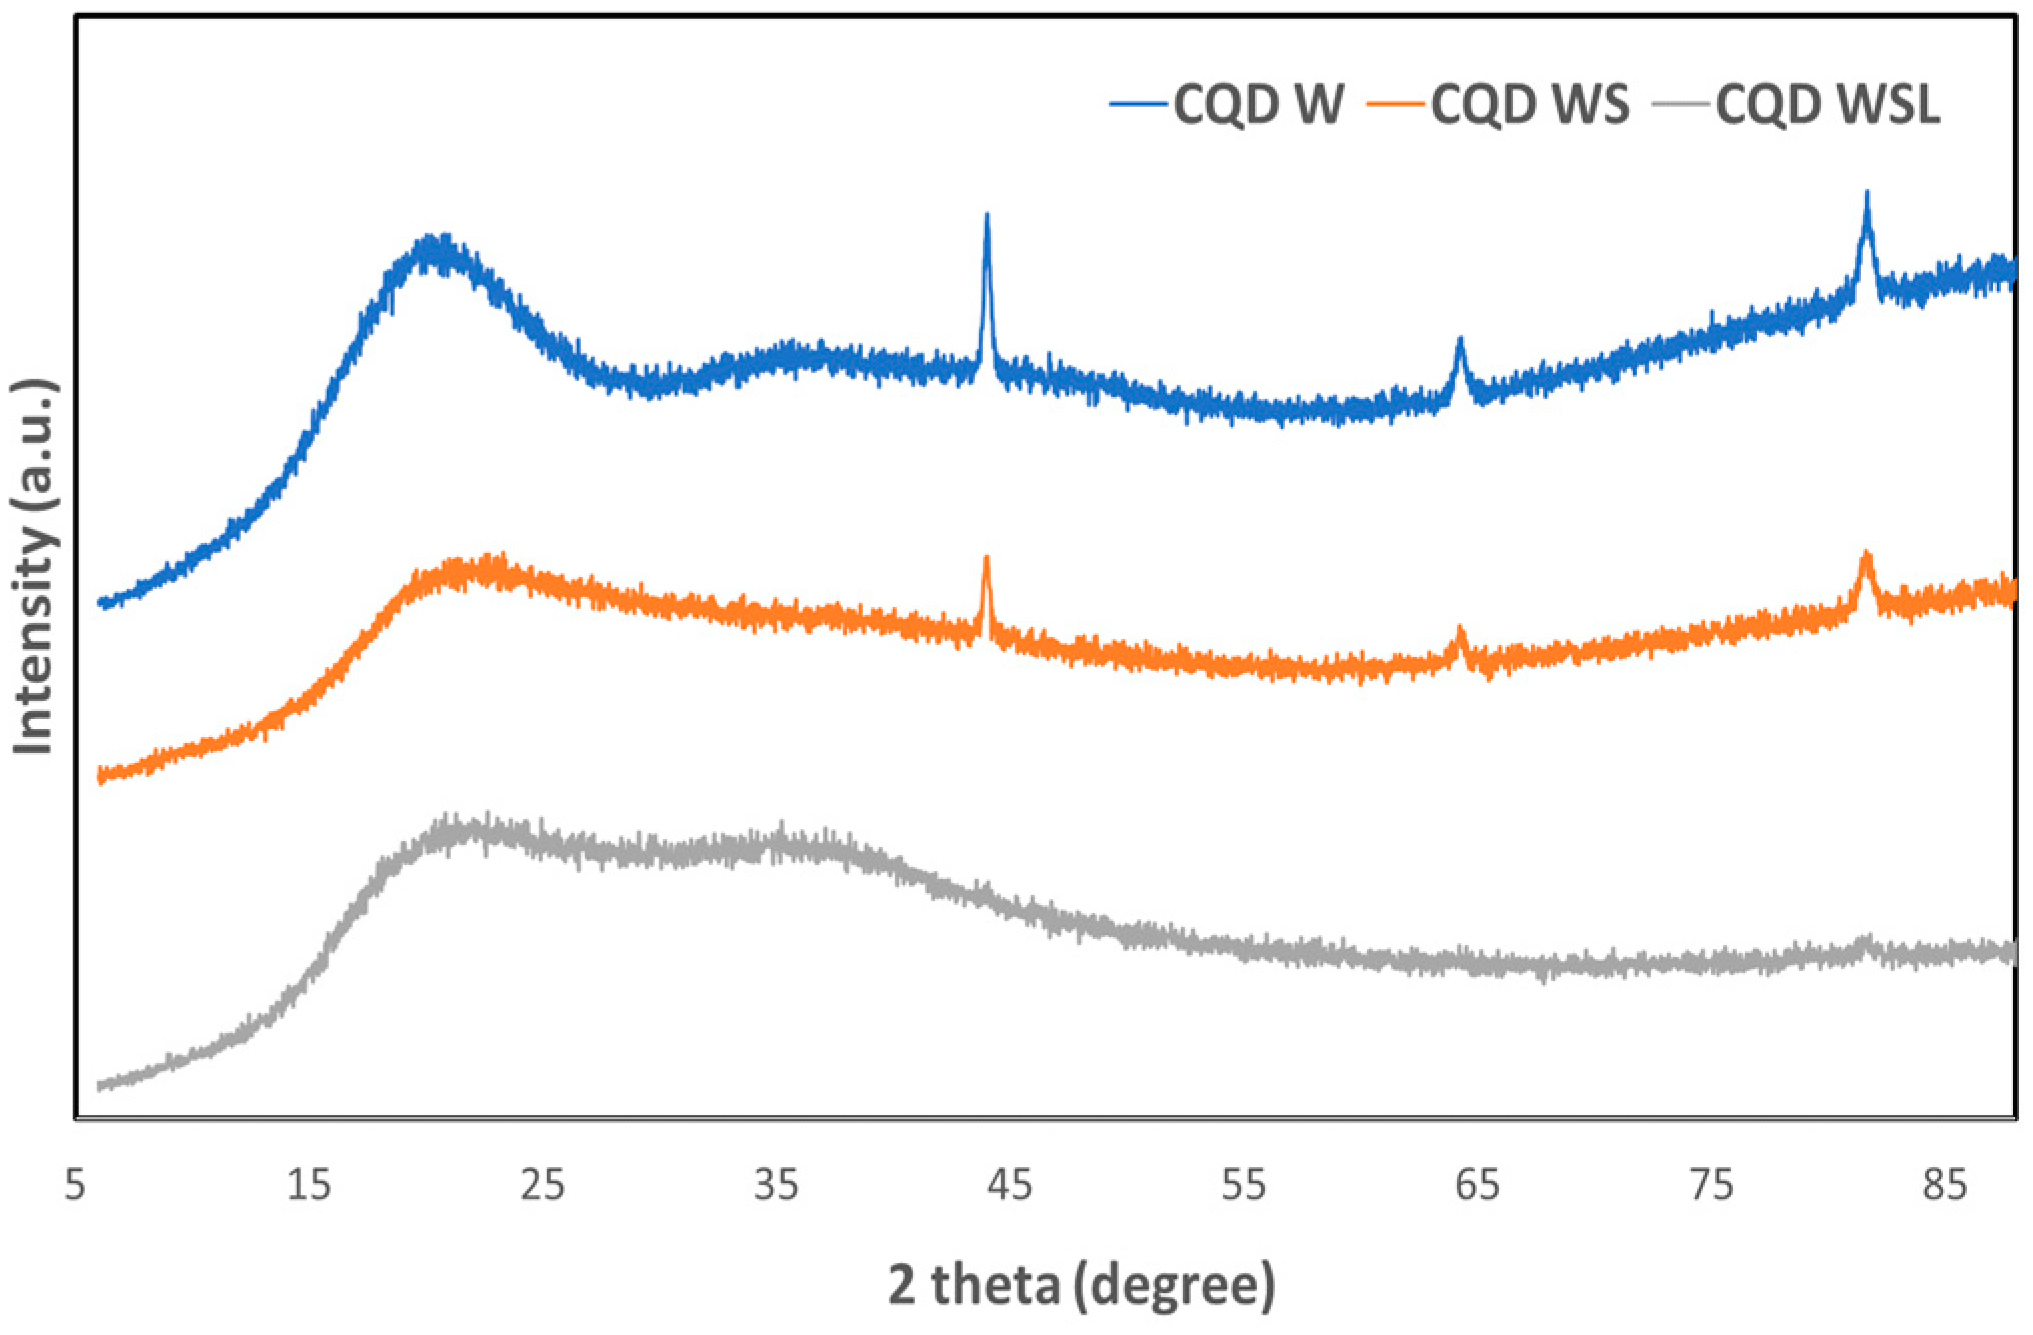
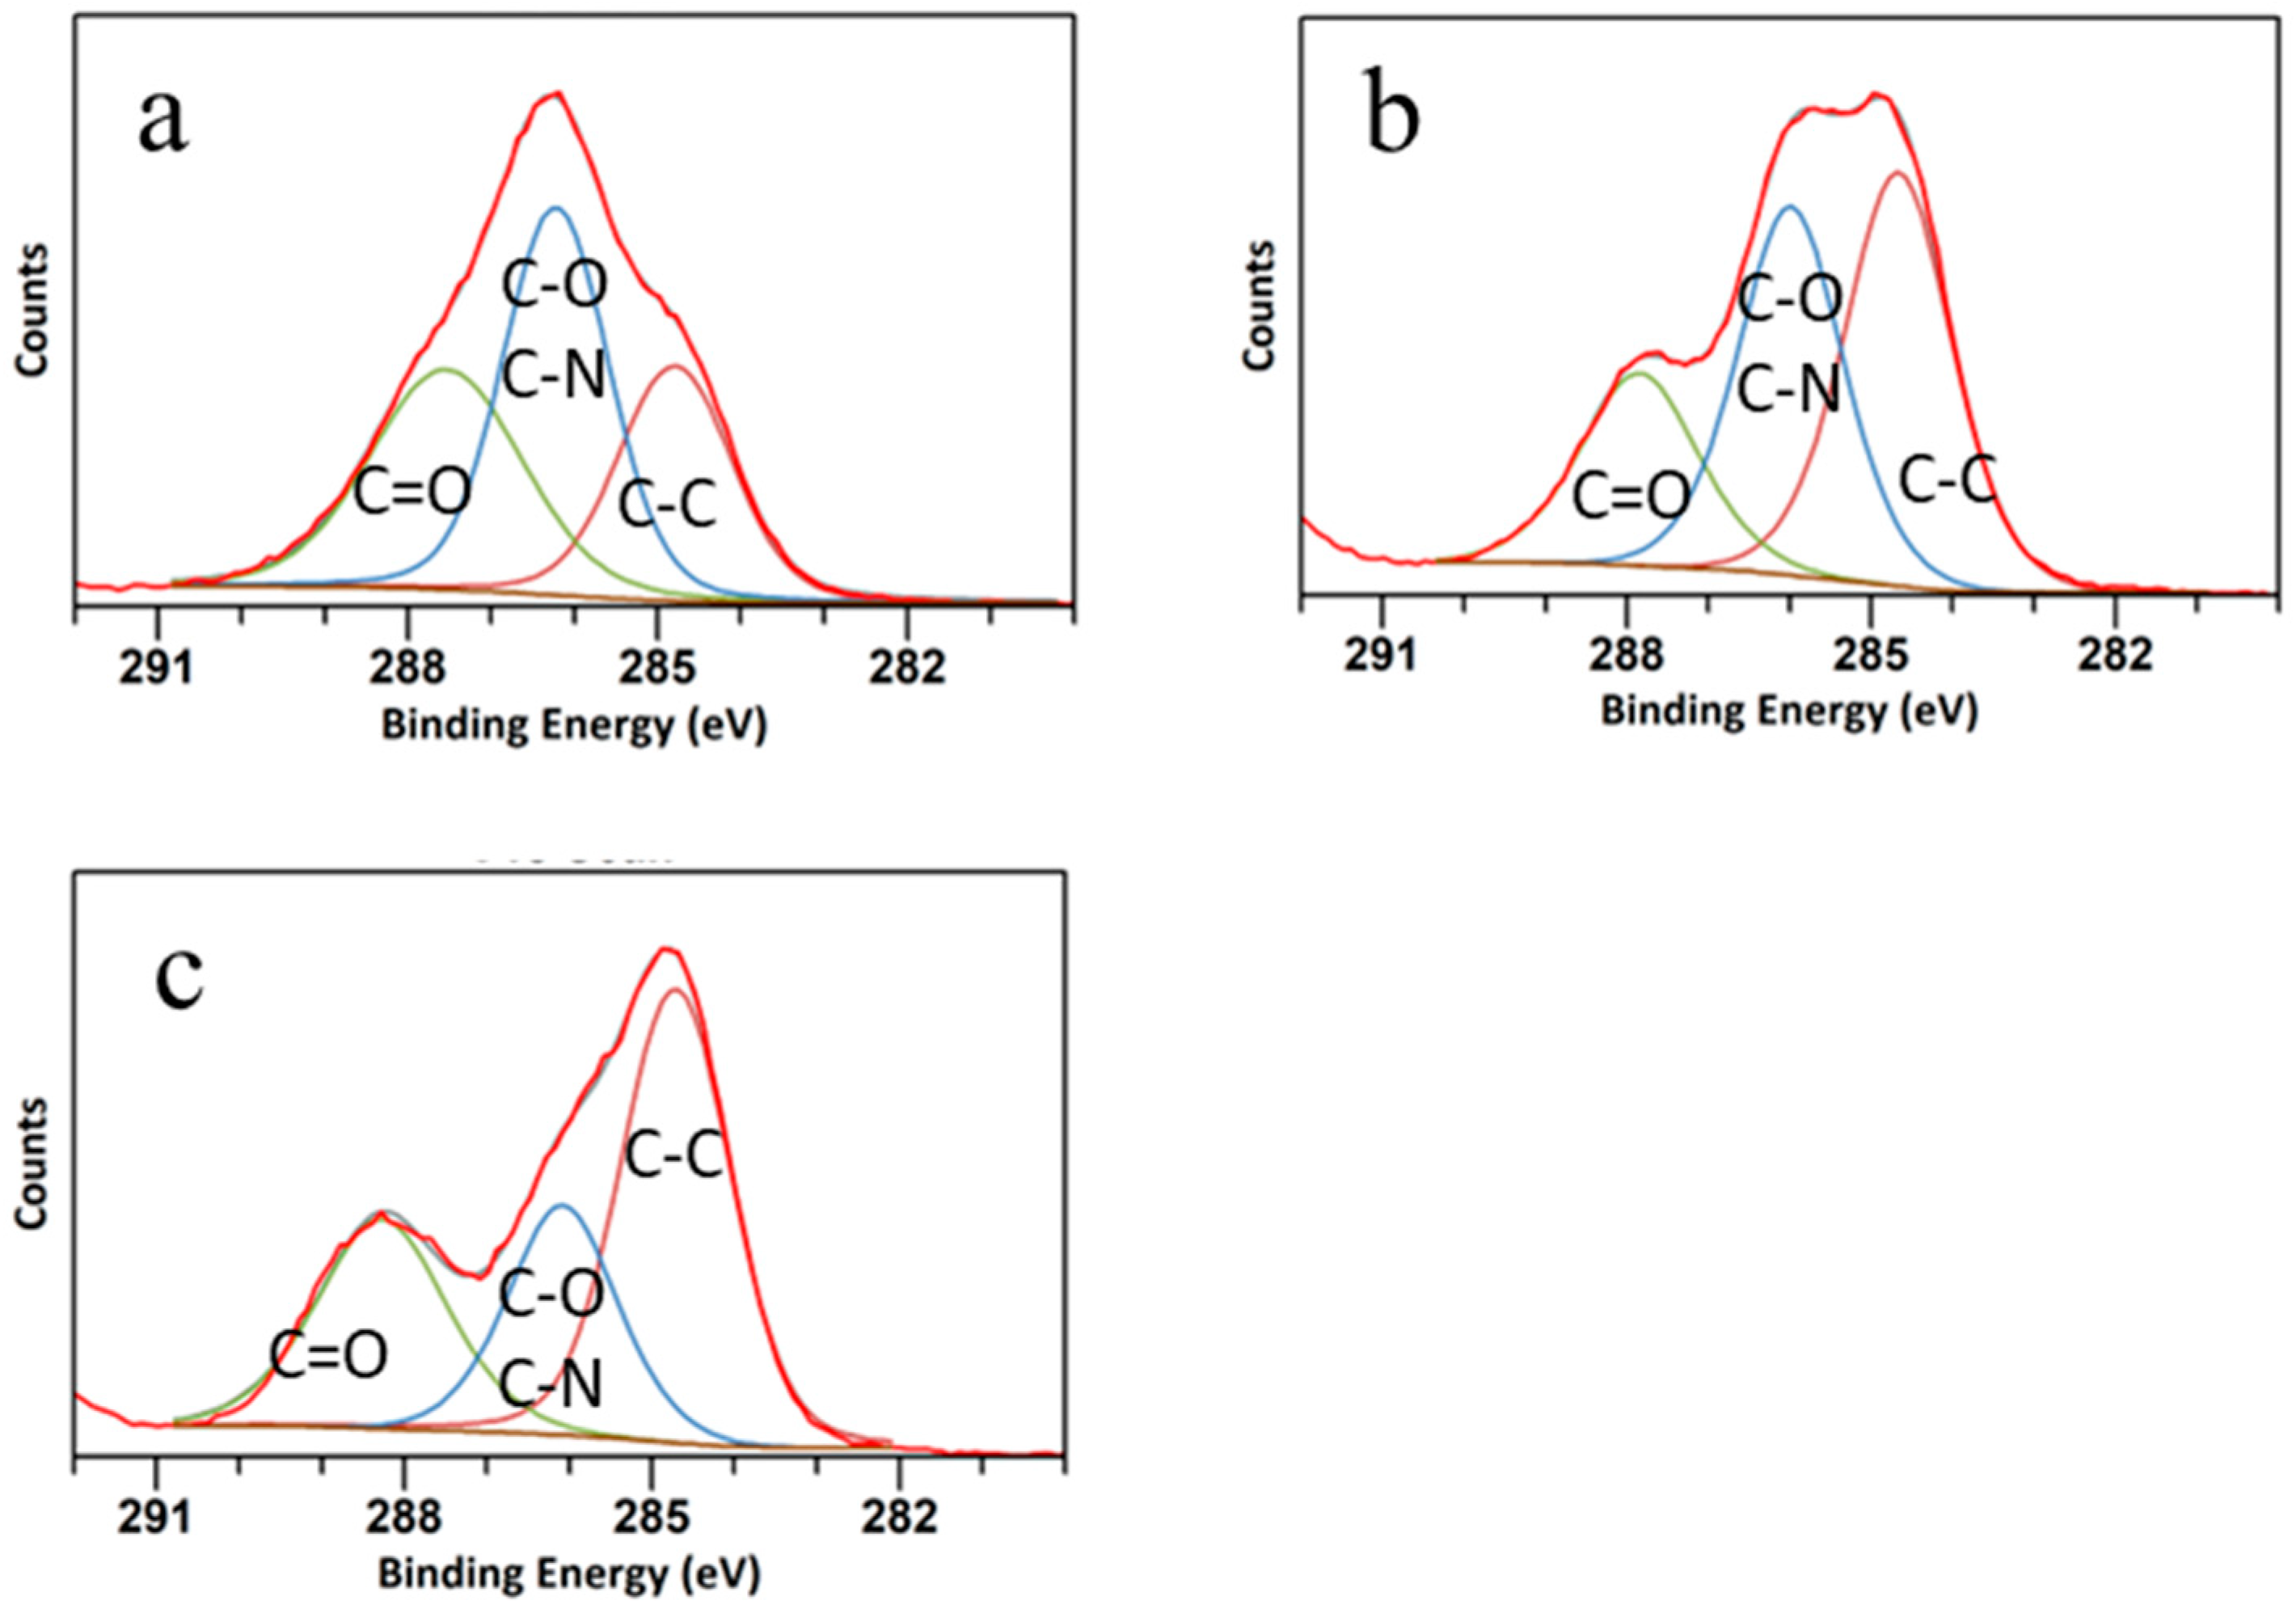
2.2. Characterization Results of the CQDs

Fluorescence QY is a characteristic property that is used to determine the brightness of the nanomaterial. This QY can be measured using two methods: the relative method and the absolute method. In a relative method, the QY is calculated by comparing its fluorescence intensity with another sample with a known QY. For this process, a conventional fluorescence spectrometer with a standard cell holder is sufficient [30]. However, a fluorescence spectrophotometer with an integrated sphere is essential to obtain the absolute QY. This integrating sphere allows the instrument to calculate the number of photons emitted by the sample. Then, the QY is calculated using a comparison between the total number of emitted photons and the total number of absorbed photons. In this method, the QY can be calculated using a single measurement without the need of a reference or absorbance data [31,32]. This absolute method is used in this study to gather QYs for the three samples.
As shown in Table 1, the absolute QY of CQD W derived from whole-meal bread was low (0.81%). Mixing soybean flour with whole-meal bread generated a higher QY (1.42%) in CQD WS. Then, the yield was further enhanced when concentrated lemon juice was used instead of Milli-Q water during the fabrication. The sample derived from whole-meal bread, soybean flour, and lemon juice (CQD WSL) exhibited an improved QY of 2.31%. To understand the reason for the enhanced QY, CQD W, CQD WS, and CQD WSL were extensively characterized.
The morphology and size of the CQDs were observed using TEM and the images are shown in Figure 1. The nanoparticles of all three samples look nearly identical. Despite the different precursors, all three CQDs had the same morphology, as they were produced under the same physical conditions. However, the CQD WSL tended to agglomerate more significantly than the other two samples. Tang et al. reported higher photoluminescence efficiency of nanoparticles in the aggregated state than in solution [33]. This enhancement occurred where aggregation limited intramolecular rotation and intramolecular vibration, or highly twisted aggregated structures weakened intermolecular π–π stacking [34]. The aggregation-induced emission (AIE) was also reported for various carbon dots [35], and this could be related to the high QY of CQD WSL.
The XRD patterns of the CQD W, CQD WS, and CQD WSL are shown in Figure 2. All CQDs had a broad peak, suggesting their amorphous structures. Unlike CQD WSL, CQD W and CQD WS also displayed diffraction peaks at 2θ = 44, 64, and 81 degrees. The crystalline structure might be related to the small components from whole meal bread, such as dietary fiber [36], salt or nutrients containing Ca. With the addition of soybean flour, the intensity of these sharp peaks decreased; lemon juice could completely remove the crystalline impurities [37]. In addition, the peak of the amorphous carbon was further broadened by introducing soybean flour and lemon juice, suggesting that these additional precursors promoted the hydrothermal reaction.
FTIR spectroscopy was used to determine the functional groups attached to the CQDs derived from different precursors. The FTIR spectra of CQD W, CQD WS, and CQD WSL are shown in Figure 3. In the fingerprint region, the strong peaks around 850–1150 cm−1 corresponded to the C-O groups in the bread. The intensity of these peaks decreased in the order of CQD W > CQD WS > CQD WSL, suggesting that the carbohydrates were decomposed more significantly in the presence of soybean flour and lemon juice. The broad band at 3265 cm−1 was related to the stretching vibrations of the hydroxyl group. The shape and position of this peak changed for CQD WS and CQD WSL, implying the presence of NH groups in addition to the -OH groups. The stretching vibration at 1650 cm−1 was related to the amide group, indicating that proteins were involved in the hydrothermal process. The peak at 1150 cm−1 attributed to the C-N bond was found in CQD W and decreased in CQD WS, while this peak disappeared in CQD WSL. Instead, a new peak at 1190 emerged, which might be the C-N bond generated under the action of lemon juice. The C=O stretching at 1701 cm−1 was only identified in the CQD WSL, related to the acid added as a precursor. The co-presence of amide and carboxylic groups in CQD WLS might lead to a zwitterionic surface, which will be further discussed in the zeta potential results.
XPS was used to analyze the surface chemistry of the CQDs. The XPS results indicated that all three CQDs mainly consisted of C, O, and N. The atomic compositions of the CQD surface are shown in Table 2. N was successfully doped in the CQDs. The energy states of CQDs changed with N-doping, and the new surface-emissive trap states created by N could promote the radiative recombination of excitons [38,39,40]. The photoluminescence of N-doped CQDs emerged from the radiative recombination of photo-induced electrons in the surface trap states, and holes at the highest occupied molecular orbitals (HOMO) [41,42]. Due to this, CQDs with the least N doping (CQD W) had the lowest QY. However, CQD WS with the highest N content did not show the highest QY, suggesting that the QY was not solely dependent on N-doping.
The high-resolution C 1s spectra are shown in Figure 4. The C peak was deconvoluted into three peaks at 288.32 eV, 283.9 eV, and 286 eV, attributed to C=O, C-O/C-N, and C-C bonds, respectively [43]. The peak related to C=O was more distinct in the CQD WSL, and the ratio between C=O and C-O/C-N increased from CQD W to CQD WS to CQD WSL, suggesting that C-O was gradually oxidized to form ester bonds or carboxylic bonds. It was reported that strong oxidizing acids carbonized small organic molecules to carbonaceous materials, which could be further cut into small sheets by controlled oxidation [44]. As shown in Figure 5, O 1s spectra exhibited two peaks at around 531 eV and 533 eV, related to the C=O and C-O bonds, respectively. The C=O peak gradually grew, and the ratio between C=O/C-O increased significantly for CQD WSL. It was consistent with the C 1s spectra and confirmed that lemon juice promoted the hydrothermal reaction of carbohydrates and achieved a more complete reaction towards small active carbon materials with a high QY.
Figure 6 illustrates the pH dependence of zeta potential. CQD WSL had the smallest absolute values of zeta potential with the increasing pH. The small surface charge might induce more aggregation because of the weaker repulsive force between individual particles to separate them. This observation is consistent with the TEM image of CQD WSL. The pH-independent low (absolute) zeta potential also suggested that the CQD WSL had a zwitterionic surface, which is characterized by the presence of equal amounts of cationic and anionic groups and a net surface charge of zero. Radchanka et al. reported that the net charge density within the slipping plane around the quantum dots affected the nonradiative recombination processes. As a general trend, QDs with zwitterionic surface groups and low surface charges demonstrated a high QY due to effective passivation from surface-related nonradiative processes [45].
According to the characterization results, nitrogen was doped in the CQDs by soybean flour. The acid in lemon juice further promoted the hydrothermal reaction. The CQD WSL derived from whole-meal bread + soybean flour + lemon juice had the highest QY (2.31%). This high QY might be due to its complete reaction promoted by the lemon juice, and its zwitterionic surface containing carboxylic acid group (from lemon) and amide groups (from soy flour).
Figure 7a shows the fluorescence spectra of CQD W, CQD WS, and CQD WSL. All spectra exhibited a broad peak from 400 to 500 nm. The peak intensity followed the order of CQD W < CQD WS < CQD WSL, consistent with the trend of QY. The CQDs were used to sense various heavy metal ions in aqueous solutions. As shown in Figure 7b–d, the fluorescence intensity changed insignificantly in the presence of nine potentially toxic ions, except for Cr (VI) ions. Adding 100 ppm of Cr (VI) could quench the fluorescence of CQD W, CQD WS, and CQD WSL, showing their unique responses to Cr ions. The CQD WSL sample showed the most significant fluorescence quenching in terms of intensity loss, i.e., (F0 − F)/F0, where F0 and F are the fluorescence of CQD WSL in the absence and presence of 100 ppm Cr (VI) ions. As shown in Figure 7e, the fluorescence of CQD WSL decreased with the increasing concentration of Cr (VI) ions. The fluorescence quenching followed a linear relationship from 2.5 to 50 ppm (Figure 7f). The limit of detection (LOD) was estimated as 8 ppm based on 3σ/slope. The LOD of the CQD WSL derived from 100% edible precursors was significantly lower than the LOD of gold nano-double cone @ silver nanorods (1.69 µM, i.e., 80 ppm). Table 3 compares the Cr (VI) sensing performance (LOD and linear range) of reported CQDs and the CQDs synthesized in this study. Considering that the lowest permissible level in dischargeable water set by the World Health Organization (WHO) is 1 ppm, future work will need to focus on reducing the LOD by enhancing the fluorescence QY, potentially through introducing more N-containing precursors. In addition, the sensing selectivity of CQD WSL was assessed by measuring the fluorescence quenching of CQD WSL in the presence of 100 ppm of various heavy metal ions (Figure 7g) and in the co-presence of 100 ppm of Cr (VI) and 100 ppm of other heavy metal ions. (Figure 7h). The quenching remained high when Cr (VI) ions co-existed with various interfering heavy metal ions, suggesting the high selectivity of the CQD WSL sensor.

3. Materials and Methods

3.1. Fabrication of CQDs

Firstly, the CQDs were fabricated from whole-meal bread. Every serving of the whole-meal bread (approximately 35 g) contained 3.86 g of protein, 2.48 g of fat, 23.64 g of carbohydrates, 2.8 g of fiber, and 0.3 g of sodium and potassium. After analyzing its QY, soybean flour was mixed with whole-meal bread in the second attempt. Lemon juice was also included in the next attempt to further enhance the QY. The samples were labeled in relation to the type of precursors (Table 4).
To prepare CQD W, 5 g (±0.1 mg) of whole-meal bread (purchased from the local supermarket) was dispersed in 30 mL of Milli-Q water by sonicating (Soniclean, LABOUIP Technologies, Bayswater, Australia) for 5 min and then the solution was transferred into a 50 mL autoclave chamber (Robotdigg equip makers, HK, China). This chamber was heated at 180 °C for 4 h in an oven (RHTOV2HP, Russell Hobbs, Spectrum brands, Victoria, Australia). After heating, the chamber was allowed to cool to room temperature overnight. The resulting sample was transferred into a centrifuge tube and centrifuged (MSE centrifuge, Thomas Scientific, Swedesboro, NJ, USA) for 5 min at 3000 rpm. The collected supernatant was filtered using a number 1 (90 mm) filter paper (Whatman, GE Healthcare UK Limited, Amersham, UK) and a 0.22 µm syringe filter membrane (Millex®, Merck Millipore, Merck KGaA, Darmstadt, Germany), sequentially. The sample was labelled CQD W (whole-meal bread) and stored in a refrigerator at 4 °C.
CQD WS was prepared by dispersing 1 g (±0.1 mg) of whole-meal bread and 4 g (±0.1 mg) of soybean flour (purchased from the local supermarket) in 30 mL of Milli-Q water using sonication for 5 min. The solution was heated at 180 °C for 4 h followed by centrifuge and filtration. The procedure was the same as the preparation of CQD W. For the preparation of CQD WSL, 1 g (±0.1 mg) of whole-meal bread and 4 g (±0.1 mg) of soybean flour were dispersed in 30 mL of freshly squeezed pulp-free lemon juice instead of in Milli-Q water. The precursors were dispersed using sonication for 5 min. The rest of the procedures, including heating, centrifugation, and filtration, were the same as the preparation of CQD W.

3.2. Characterization of CQDs

3.2.1. QY Measurement

Fluorescence QY was obtained on a photoluminescence spectrometer FT300 (PicoQuant GmbH, Berlin, Germany) using an integrated sphere. The quartz cuvette (1 cm × 1 cm × 5 cm) containing the sample solution was positioned in ‘IN mode’ with 20-degree tilting, where the 423 nm excitation laser directly transmitted through the cuvette. For the measurement of low QY values, an emission attenuator (attenuation level at 100) was applied for less than 445 nm, and the correction factors were included in the QY calculation.

3.2.2. Transmission Electron Microscopy (TEM)

TEM images were captured using a JEOL 1010 TEM 868 (JEOL, Sydney, Australia) operated at an accelerating voltage of 100 kV. The CQDs were sonicated for 20 min, and the resulting supernatant was drop-casted on a carbon grid and dried overnight under ambient conditions for analysis.

3.2.3. X-ray Diffraction (XRD)

XRD patterns were collected on a Bruker AXS D8 Discover diffractometer (Bruker, Melbourne, Australia) equipped with a Cu Kα radiation source (λ = 1.5418 Å) operating at 40 kV and 35 mA.

3.2.4. Fourier-Transform Infrared Spectroscopy (FTIR)

FTIR spectra were recorded using an FTIR spectrometer (PerkinElmer, Waltham, MA, USA) with an average of 16 scans per sample and a resolution of 4 cm−1 in the range of 4000–500 cm−1.

3.2.5. X-ray Photoelectron Spectroscopy (XPS)

XPS was performed using a Thermo Scientific K-Alpha XPS system with a monochromate Al 1487 eV Kα source. CasaXPS 2.3.23 software was used for peak fitting and background signal subtraction.

3.2.6. Zeta Potential Measurement

A Malvern Zetasizer Nano Z system was used for zeta-potential measurements. Briefly, 10 mg of each CQD sample was placed in a plastic cuvette containing 3 mL of dispersion medium. The dispersion medium was prepared in advance based on deionized water with the pH (pH = 2, 4, 6, 8, and 10) adjusted by adding 0.1 M HCl or 0.1 M NaOH. The cuvette was placed in an ultrasonic bath for 10 s and then shaken manually to ensure good dispersion. The temperature of all measurements was maintained at 25 °C. The cuvette was thoroughly washed with deionized water before and after each measurement.

3.3. Heavy Metal Ion Sensing

CQD solution (1 mg/mL, 100 µL) was transferred into a 96-well plate with a clear glass bottom. Then, 100 µL of various metal ion solutions with a known concentration was added into each well and mixed thoroughly. The fluorescence spectra before and after adding metal ions were recorded using a SpectraMax Paradigm Plate Reader (Molecular Devices, San Jose, CA, USA) with an excitation wavelength of 360 nm. For measuring the dependence of fluorescence of CQD WSL on the Cr (VI) concentration, CQD WSL solution (100 µL) was transferred into a 96-well plate with a clear glass bottom. Then, 100 µL Cr (VI) solution with a known concentration was added into each well and mixed thoroughly. The fluorescence spectra before and after adding Cr (VI) solution were recorded.

4. Conclusions

This study fabricated CQDs from whole-meal bread and successfully improved their QY using natural and edible additives, such as soy flour and lemon juice. Despite the different precursors, all CQDs had the same morphology as they were produced under the same physical conditions. CQD WSL tended to agglomerate more significantly than the other two samples, possibly because of its neutral surface charge. According to the characterization results, nitrogen was doped in the CQDs. Compared to the QY of CQD W (0.81%), the CQDs derived from whole-meal bread + soybean flour + lemon juice (CQD WSL) had the highest QY (2.31%). FTIR, XRD, and XPS results confirmed that the bread precursors were subjected to more complete hydrothermal reactions in the presence of soy flour and lemon juice, which enhanced the QYs. Evidenced by zeta potential measurements, CQD WSL had a zwitterionic surface, containing a carboxylic acid group (from lemon) and amide groups (from soy flour), which was also responsible for its high QY. The fluorescent CQDs were tested for metal ion sensing, and the emission intensities followed the order of CQD W < CQD WS < CQD WSL, consistent with the trend of QY. CQD WSL was able to sense Cr (VI) selectively with an LOD of 8 ppm. As these CQDs were derived entirely from edible resources, they are extremely safe for sensing applications. Also, the fabrication of CQD is quick and efficient, providing a sustainable method to identify Cr (VI)-polluted water and support health and well-being.

Author Contributions

Methodology, K.A., H.Y. and D.T.H.L.; Resources, H.Y. and T.Z.; Supervision, I.C. and D.T.H.L.; Writing—original draft, K.A. and H.Y.; Writing—review and editing, K.A., H.Y., I.C. and D.T.H.L. All authors have read and agreed to the published version of the manuscript.

Funding

This work was possible through the funding support of a Defense Science Institute (DSI) Collaborative Research Grant (#CR-0030) and RMIT Innovation Proof of Concept Fund 2022 (TIS00066).

Data Availability Statement

The raw data supporting the conclusions of this article will be made available by the authors on request.

Acknowledgments

The authors acknowledge the facilities and the scientific and technical assistance of the RMIT Microscopy & Microanalysis Facility (RMMF), a linked laboratory of Microscopy Australia and the RMIT Micro Nano Research Facility (MNRF).

Conflicts of Interest

The authors declare that the research was conducted in the absence of any commercial or financial relationships that could be construed as potential conflicts of interest. The funders had no role in the design of the study; in the collection, analyses, or interpretation of data; in the writing of the manuscript; or in the decision to publish the results.

References

  1. International Agency for Research on Cancer. IARC Monographs on the Evaluation of Carcinogenic Risks to Humans: Occupational Exposures in Insecticide Application, and Some Pesticides; IARC: Lyon, France, 1991; Volume 53. [Google Scholar]
  2. Wilbur, S.B. Toxicological Profile for Chromium; Agency for Toxic Substances and Disease Registry: Atlanta, GA, USA, 2000. [Google Scholar]
  3. Shanker, A.; Venkateswarlu, B.; Nriagu, J. Encyclopedia of Environmental Health; Elsevier: Amsterdam, The Netherlands, 2011. [Google Scholar]
  4. Yan, B.-Z.; Chen, Z.-F. Influence of pH on Cr(VI) reduction by organic reducing substances from sugarcane molasses. Appl. Water Sci. 2019, 9, 61. [Google Scholar] [CrossRef]
  5. Wu, M.; Li, G.; Jiang, X.; Xiao, Q.; Niu, M.; Wang, Z.; Wang, Y. Non-biological reduction of Cr(vi) by reacting with humic acids composted from cattle manure. RSC Adv. 2017, 7, 26903–26911. [Google Scholar] [CrossRef]
  6. Pellerin, C.; Booker, S.M. Reflections on hexavalent chromium: Health hazards of an industrial heavyweight. Environ. Health Perspect. 2000, 108, A402–A407. [Google Scholar] [CrossRef] [PubMed]
  7. Zhang, R.; Xiang, Y.; Ran, Q.; Deng, X.; Xiao, Y.; Xiang, L.; Li, Z. Involvement of Calcium, Reactive Oxygen Species, and ATP in Hexavalent Chromium-Induced Damage in Red Blood Cells. Cell. Physiol. Biochem. 2014, 34, 1780–1791. [Google Scholar] [CrossRef]
  8. Wilbur, S.; Abadin, H.; Fay, M.; Yu, D.; Tencza, B.; Ingerman, L.; Klotzbach, J.; James, S. Health effects. In Toxicological Profile for Chromium; Agency for Toxic Substances and Disease Registry (US): Atlanta, GA, USA, 2012. [Google Scholar]
  9. Wise, J.T.; Wang, L.; Xu, J.; Zhang, Z.; Shi, X. Oxidative stress of Cr (III) and carcinogenesis. In The Nutritional Biochemistry of Chromium (III); Elsevier: Amsterdam, The Netherlands, 2019; pp. 323–340. [Google Scholar]
  10. Mishra, S.; Bharagava, R.N. Toxic and genotoxic effects of hexavalent chromium in environment and its bioremediation strategies. J. Environ. Sci. Health Part C 2015, 34, 1–32. [Google Scholar] [CrossRef] [PubMed]
  11. Nghia, N.N.; Huy, B.T.; Lee, Y.-I. Colorimetric detection of chromium(VI) using graphene oxide nanoparticles acting as a peroxidase mimetic catalyst and 8-hydroxyquinoline as an inhibitor. Microchim. Acta 2018, 186, 36. [Google Scholar] [CrossRef]
  12. Huang, Q.; Bao, Q.; Wu, C.; Hu, M.; Chen, Y.; Wang, L.; Chen, W. Carbon dots derived from Poria cocos polysaccharide as an effective “on-off” fluorescence sensor for chromium (VI) detection. J. Pharm. Anal. 2021, 12, 104–112. [Google Scholar] [CrossRef]
  13. Babazadeh, S.; Bisauriya, R.; Carbone, M.; Roselli, L.; Cecchetti, D.; Bauer, E.M.; Sennato, S.; Prosposito, P.; Pizzoferrato, R. Colorimetric Detection of Chromium(VI) Ions in Water Using Unfolded-Fullerene Carbon Nanoparticles. Sensors 2021, 21, 6353. [Google Scholar] [CrossRef] [PubMed]
  14. Wang, H.; Liu, S.; Xie, Y.; Bi, J.; Li, Y.; Song, Y.; Cheng, S.; Li, D.; Tan, M. Facile one-step synthesis of highly luminescent N-doped carbon dots as an efficient fluorescent probe for chromium(vi) detection based on the inner filter effect. New J. Chem. 2018, 42, 3729–3735. [Google Scholar] [CrossRef]
  15. Zhang, Z.; Sung, J.; Toolan, D.T.W.; Han, S.; Pandya, R.; Weir, M.P.; Xiao, J.; Dowland, S.; Liu, M.; Ryan, A.J.; et al. Ultrafast exciton transport at early times in quantum dot solids. Nat. Mater. 2022, 21, 533–539. [Google Scholar] [CrossRef]
  16. Ding, H.; Yu, S.-B.; Wei, J.-S.; Xiong, H.-M. Full-Color Light-Emitting Carbon Dots with a Surface-State-Controlled Luminescence Mechanism. ACS Nano 2015, 10, 484–491. [Google Scholar] [CrossRef] [PubMed]
  17. Krysmann, M.J.; Kelarakis, A.; Dallas, P.; Giannelis, E.P. Formation Mechanism of Carbogenic Nanoparticles with Dual Photoluminescence Emission. J. Am. Chem. Soc. 2011, 134, 747–750. [Google Scholar] [CrossRef] [PubMed]
  18. Sommer, M.E.; Elgeti, M.; Hildebrand, P.W.; Szczepek, M.; Hofmann, K.P.; Scheerer, P. Structure-based biophysical analysis of the interaction of rhodopsin with G protein and arrestin. In Methods in Enzymology; Elsevier: Amsterdam, The Netherlands, 2015; pp. 563–608. [Google Scholar]
  19. Li, M.; Yu, C.; Hu, C.; Yang, W.; Zhao, C.; Wang, S.; Zhang, M.; Zhao, J.; Wang, X.; Qiu, J. Solvothermal conversion of coal into nitrogen-doped carbon dots with singlet oxygen generation and high quantum yield. Chem. Eng. J. 2017, 320, 570–575. [Google Scholar] [CrossRef]
  20. Zhu, S.; Meng, Q.; Wang, L.; Zhang, J.; Song, Y.; Jin, H.; Zhang, K.; Sun, H.; Wang, H.; Yang, B. Highly Photoluminescent Carbon Dots for Multicolor Patterning, Sensors, and Bioimaging. Angew. Chem. Int. Ed. 2013, 52, 4045–4049. [Google Scholar] [CrossRef]
  21. Chang, C.-Y.; Venkatesan, S.; Herman, A.; Wang, C.-L.; Teng, H.; Lee, Y.-L. Carbon quantum dots with high quantum yield prepared by heterogeneous nucleation processes. J. Alloys Compd. 2023, 938, 168654. [Google Scholar] [CrossRef]
  22. Lou, Y.; Hao, X.; Liao, L.; Zhang, K.; Chen, S.; Li, Z.; Ou, J.; Qin, A.; Li, Z. Recent advances of biomass carbon dots on syntheses, characterization, luminescence mechanism, and sensing applications. Nano Sel. 2021, 2, 1117–1145. [Google Scholar] [CrossRef]
  23. de Oliveira, B.P.; da Silva Abreu, F.O.M. Carbon quantum dots synthesis from waste and by-products: Perspectives and challenges. Mater. Lett. 2021, 282, 128764. [Google Scholar] [CrossRef]
  24. Liu, W.; Li, C.; Sun, X.; Pan, W.; Yu, G.; Wang, J. Highly crystalline carbon dots from fresh tomato: UV emission and quantum confinement. Nanotechnology 2017, 28, 485705. [Google Scholar] [CrossRef] [PubMed]
  25. Zheng, J.; Xie, Y.; Wei, Y.; Yang, Y.; Liu, X.; Chen, Y.; Xu, B. An Efficient Synthesis and Photoelectric Properties of Green Carbon Quantum Dots with High Fluorescent Quantum Yield. Nanomaterials 2020, 10, 82. [Google Scholar] [CrossRef]
  26. Wu, M.; Wang, Y.; Wu, W.; Hu, C.; Wang, X.; Zheng, J.; Li, Z.; Jiang, B.; Qiu, J. Preparation of functionalized water-soluble photoluminescent carbon quantum dots from petroleum coke. Carbon 2014, 78, 480–489. [Google Scholar] [CrossRef]
  27. Anpalagan, K.; Karakkat, J.V.; Jelinek, R.; Kadamannil, N.N.; Zhang, T.; Cole, I.; Nurgali, K.; Yin, H.; Lai, D.T.H. A Green Synthesis Route to Derive Carbon Quantum Dots for Bioimaging Cancer Cells. Nanomaterials 2023, 13, 2103. [Google Scholar] [CrossRef] [PubMed]
  28. Porter, M.A.; Jones, A.M. Variability in soy flour composition. J. Am. Oil Chem. Soc. 2003, 80, 557–562. [Google Scholar] [CrossRef]
  29. Penniston, K.L.; Nakada, S.Y.; Holmes, R.P.; Assimos, D.G. Quantitative Assessment of Citric Acid in Lemon Juice, Lime Juice, and Commercially-Available Fruit Juice Products. J. Endourol. 2008, 22, 567–570. [Google Scholar] [CrossRef] [PubMed]
  30. Würth, C.; Grabolle, M.; Pauli, J.; Spieles, M.; Resch-Genger, U. Relative and absolute determination of fluorescence quantum yields of transparent samples. Nat. Protoc. 2013, 8, 1535–1550. [Google Scholar] [CrossRef] [PubMed]
  31. Faulkner, D.O.; McDowell, J.J.; Price, A.J.; Perovic, D.D.; Kherani, N.P.; Ozin, G.A. Measurement of absolute photoluminescence quantum yields using integrating spheres—Which way to go? Laser Photonics Rev. 2012, 6, 802–806. [Google Scholar] [CrossRef]
  32. Porrès, L.; Holland, A.; Pålsson, L.-O.; Monkman, A.P.; Kemp, C.; Beeby, A. Absolute Measurements of Photoluminescence Quantum Yields of Solutions Using an Integrating Sphere. J. Fluoresc. 2006, 16, 267–273. [Google Scholar] [CrossRef]
  33. Luo, J.; Xie, Z.; Xie, Z.; Lam, J.W.Y.; Cheng, L.; Chen, H.; Qiu, C.; Kwok, H.S.; Zhan, X.; Liu, Y.; et al. Aggregation-Induced Emission of 1-Methyl-1,2,3,4,5-Pentaphenylsilole. Chem. Commun. 2001, 18, 1740–1741. [Google Scholar] [CrossRef] [PubMed]
  34. Zhang, H.; Zhao, Z.; Turley, A.T.; Wang, L.; McGonigal, P.R.; Tu, Y.; Li, Y.; Wang, Z.; Kwok, R.T.K.; Lam, J.W.Y.; et al. Aggregate Science: From Structures to Properties. Adv. Mater. 2020, 32, e2001457. [Google Scholar] [CrossRef] [PubMed]
  35. Gao, M.X.; Liu, C.F.; Wu, Z.L.; Zeng, Q.L.; Yang, X.X.; Wu, W.B.; Li, Y.F.; Huang, C.Z. A surfactant-assisted redox hydrothermal route to prepare highly photoluminescent carbon quantum dots with aggregation-induced emission enhancement properties. Chem. Commun. 2013, 49, 8015–8017. [Google Scholar] [CrossRef]
  36. Kaur, B.; Panesar, P.S.; Thakur, A. Extraction and evaluation of structural and physicochemical properties of dietary fiber concentrate from mango peels by using green approach. Biomass-Convers. Biorefin. 2021, 1–10. [Google Scholar] [CrossRef]
  37. Chaudhary, S.; Kumar, S.; Kaur, B.; Mehta, S.K. Potential prospects for carbon dots as a fluorescence sensing probe for metal ions. RSC Adv. 2016, 6, 90526–90536. [Google Scholar] [CrossRef]
  38. Tang, L.; Ji, R.; Cao, X.; Lin, J.; Jiang, H.; Li, X.; Teng, K.S.; Luk, C.M.; Zeng, S.; Hao, J.; et al. Deep Ultraviolet Photoluminescence of Water-Soluble Self-Passivated Graphene Quantum Dots. ACS Nano 2012, 6, 5102–5110. [Google Scholar] [CrossRef]
  39. Kwon, W.; Do, S.; Lee, J.; Hwang, S.; Kim, J.K.; Rhee, S.-W. Freestanding Luminescent Films of Nitrogen-Rich Carbon Nanodots toward Large-Scale Phosphor-Based White-Light-Emitting Devices. Chem. Mater. 2013, 25, 1893–1899. [Google Scholar] [CrossRef]
  40. Liu, Q.; Guo, B.; Rao, Z.; Zhang, B.; Gong, J.R. Strong Two-Photon-Induced Fluorescence from Photostable, Biocompatible Nitrogen-Doped Graphene Quantum Dots for Cellular and Deep-Tissue Imaging. Nano Lett. 2013, 13, 2436–2441. [Google Scholar] [CrossRef]
  41. Liu, J.; Liu, X.; Luo, H.; Gao, Y. One-step preparation of nitrogen-doped and surface-passivated carbon quantum dots with high quantum yield and excellent optical properties. RSC Adv. 2014, 4, 7648–7654. [Google Scholar] [CrossRef]
  42. Liao, J.; Cheng, Z.; Zhou, L. Nitrogen-Doping Enhanced Fluorescent Carbon Dots: Green Synthesis and Their Applications for Bioimaging and Label-Free Detection of Au3+ Ions. ACS Sustain. Chem. Eng. 2016, 4, 3053–3061. [Google Scholar] [CrossRef]
  43. Huang, H.; Li, S.; Chen, B.; Wang, Y.; Shen, Z.; Qiu, M.; Pan, H.; Wang, W.; Wang, Y.; Li, X. Endoplasmic reticulum-targeted polymer dots encapsulated with ultrasonic synthesized near-infrared carbon nanodots and their application for in vivo monitoring of Cu2+. J. Colloid Interface Sci. 2022, 627, 705–715. [Google Scholar] [CrossRef]
  44. Wang, Y.; Hu, A. Carbon quantum dots: Synthesis, properties and applications. J. Mater. Chem. C 2014, 2, 6921–6939. [Google Scholar] [CrossRef]
  45. Radchanka, A.; Hrybouskaya, V.; Iodchik, A.; Achtstein, A.W.; Artemyev, M. Zeta Potential-Based Control of CdSe/ZnS Quantum Dot Photoluminescence. J. Phys. Chem. Lett. 2022, 13, 4912–4917. [Google Scholar] [CrossRef]
  46. Wang, Y.; Hu, X.; Li, W.; Huang, X.; Li, Z.; Zhang, W.; Zhang, X.; Zou, X.; Shi, J. Preparation of boron nitrogen co-doped carbon quantum dots for rapid detection of Cr(VI). Spectrochim. Acta Part A Mol. Biomol. Spectrosc. 2020, 243, 118807. [Google Scholar] [CrossRef]
  47. Zhang, J.; Jing, C.; Wang, B. A label-free fluorescent sensor based on Si, N-codoped carbon quantum dots with enhanced sensitivity for the determination of Cr (VI). Materials 2022, 15, 1733. [Google Scholar] [CrossRef] [PubMed]
Figure 1. TEM images of (a) CQD W, (b) CQD WS, and (c) CQD WSL.
Inorganics 12 00096 g001
Figure 2. X-ray diffraction patterns of CQD W, CQD WS, and CQD WSL.
Inorganics 12 00096 g002
Figure 3. FTIR spectra of CQD W, CQD WS, and CQD WSL.
Inorganics 12 00096 g003
Figure 4. C 1s spectra of (a) CQD W, (b) CQD WS, and (c) CQD WSL. Lines in different colors represent the fitting results of C=O (green), C-O and C-N (blue), and C-C (maroon).
Inorganics 12 00096 g004
Figure 5. O 1s spectra of (a) CQD W, (b) CQD WS, and (c) CQD WSL.
Inorganics 12 00096 g005
Figure 6. pH-dependent zeta potentials of CQD W, CQD WS, and CQD WSL.
Inorganics 12 00096 g006
Figure 7. Fluorescence spectra of (a) CQD W, CQD WS, and CQD WSL; (b) CQD W after adding various heavy metal ion solutions (100 ppm), (c) CQD WS after adding various heavy metal ion solutions (100 ppm), and (d) CQD WSL after adding various heavy metal ion solutions (100 ppm). (e) Fluorescence spectra of CQD WSL in presence of Cr solutions of various concentrations, (f) fluorescence quenching of CQD WSL vs. Cr concentration, (g) fluorescence quenching of CQD WSL in the presence of 100 ppm of various heavy metal ions, and (h) fluorescence quenching of CQD WSL in the presence of 100 ppm of Cr (VI) and 100 ppm of other heavy metal ions.
Inorganics 12 00096 g007
Table 1. QY measurement of CQD W, CQD WS, and CQD WSL.
Sample NamePrecursorsAbsolute QY (%)
CQD WWhole-meal bread (5 g)0.81
CQD WSWhole-meal bread (1 g) + soybean flour (4 g)1.42
CQD WSLWhole-meal bread (1 g) + soybean flour (4 g)
+ lemon juice (30 mL)
2.31
Table 2. Atomic composition of CQD W, CQD WS, and CQD WSL.
CQDO (%)C (%)N (%)
CQD W56.7637.915.32
CQD WS49.7639.3510.88
CQD WSL52.9132.997.87
Table 3. Comparison of CQDs used for Cr (VI) sensing.
PrecursorsLODLinearity RangeReference
Citric acid and glycine4.16 μmol L−15 to 200 μmol L−1[14]
Fullerene, H2O2, and NH4OH300 nM1–100 µM[13]
Poria cocos polysaccharide0.25 μM1–100 μM[12]
Ammonium citrate and bis(pinacolato) diboron0.24 μM0.3–500 μM[46]
Diacetone acrylamide and 3-aminopropyltriethoxysilane0.995 μM0–200 μM[47]
Whole-meal bread, soybean flour, and lemon juice8 ppm2.5–50 ppmThis article
Table 4. Details of the CQDs prepared from different precursors.
Sample NamePrecursors
CQD WWhole-meal bread (5 g)
CQD WSWhole-meal bread (1 g) + soybean flour (4 g)
CQD WSLWhole-meal bread (1 g) + soybean flour (4 g) + lemon juice (30 mL)
Disclaimer/Publisher’s Note: The statements, opinions and data contained in all publications are solely those of the individual author(s) and contributor(s) and not of MDPI and/or the editor(s). MDPI and/or the editor(s) disclaim responsibility for any injury to people or property resulting from any ideas, methods, instructions or products referred to in the content.

