Article

Preparation and Application of Fe-Al-SiO2 Poly-Coagulants for Removing Microcystis aeruginosa from Water

1
School of Hydraulic and Environmental Engineering, Changsha University of Science and Technology, Changsha 410114, China
2
Key Laboratory of Dongting Lake Aquatic Eco-Environmental Control and Restoration of Hunan Province, Changsha 410114, China
3
Engineering and Technical Center of Hunan Provincial Environmental Protection for River-Lake Dredging Pollution Control, Changsha 410114, China
*
Author to whom correspondence should be addressed.
Inorganics 2023, 11(5), 210; https://doi.org/10.3390/inorganics11050210
Submission received: 10 March 2023 / Revised: 25 April 2023 / Accepted: 10 May 2023 / Published: 13 May 2023

Abstract

:
Novel Fe-Al-SiO2 (FAS) poly-coagulants were prepared by the ball milling method using ferrous sulfate, aluminum sulfate, hydrophobic silica, and sodium carbonate as raw materials. The optimal preparation conditions and effects of preparation parameters on removal efficiencies were obtained by Response Surface Methodology (RSM) and Analysis of Variance (ANOVA). Removal efficiencies were investigated by employing FAS as the poly-coagulant for algae-laden water. Furthermore, obtained FAS samples were characterized by SEM, FTIR, XRD, and TGA. Results showed that the optimal preparation conditions were n(Fe):n(Al) of 2:1, m(Si):m(Fe+Al) of 1:2, and n(CO32−):n(Fe+Al) of 1.75:1, and the most significant influencing factor was n(CO32−):n(Fe+Al). FAS13 prepared under the above condition had the highest coagulation efficiency for simulated algae-laden water. Removal efficiencies for OD680, TP, and residual Al and Fe concentrations were 92.86%, 90.55%, 0.142 mg/L, and 0.074 mg/L, respectively. Nano-sized spherical particles, excellent thermal stability, and functional groups such as Al–O–Si, Fe–O–Si, and Fe–OH, corresponding to Al2Si2O5(OH)4, Fe7Si8O22(OH)2, and Fe2(OH)2CO3, were observed in FAS13. The coagulation performance of FAS13 was splendid when applied in real algae-laden water. The removal rates of TP, OD680, turbidity, and Chl-α were above 93.87%. The residual Al concentration was at the range of 0.057–0.128 mg/L.

1. Introduction

Lakes, reservoirs, and rivers in China have suffered from different degrees of Cyanobacterial harmful algal blooms (CyanoHABs) due to nutrient loadings, intensified anthropogenic activities, and meteorological factors [1,2,3]. Microcystis aeruginosa is one of the most pervasive bloom-forming species within the phylum Cyanobacteria, distributed in freshwater [4]. The distribution density of CyanoHABs threatens the biodiversity and function of the water ecosystem and deteriorates water quality for subsequent uses [5,6]. Additionally, Microcystins (MCs) produced by Microcystis aeruginosa are hepatotoxic, nephrotoxic, reproductive toxic, and neurotoxic, endangering human health through exposure routes such as drinking, skin contact, and inhalation [4,5]. The unicellular Microcystis aeruginosa has a spherical cell with a 3–7 µm diameter, and the cell density can be adjusted by gas vacuoles to lower than that of water [7,8]. Enwrapped by extracellular organic matter (EOM), a polymer containing various organics and charged functional groups, the Microcystis aeruginosa cell has steric hindrance, hydrophilicity, and surface electronegativity [7,9]. Consequently, the Microcystis aeruginosa cells are homogeneously dispersed in water and are difficult to separate. Therefore, maximizing the aggregation and separation of the Microcystis aeruginosa cells from water is of great significance for controlling CyanoHABs to ensure water ecological security and drinking water safety.
Chemical coagulation has been widely used for algae removal due to its convenient operation, excellent efficiency, and low risk of secondary contamination. Aluminum salts such as aluminum sulfate and iron salts such as ferrous sulfate are common coagulants. Although aluminum-based coagulants are highly efficient for turbidity and chromaticity removal, and flocs of iron-based coagulants are compact, there are some shortcomings. Many studies have used pre-hydrolyzed aluminum–iron polymeric inorganic coagulants to alleviate the problems of large dosages of aluminum or iron salts and unstable hydrolysates affected by pH [10]. It was reported that polymeric aluminum ferric chloride (PAFC) had a removal efficiency of over 90% for Cylindrospermopsis raciborskii (106 cells/mL) at a dosage of 10 mg/L [11], and the coagulation performance was slightly affected by the solution’s pH [12]. However, these studies did not consider the effects of residual Al and Fe concentrations resulting from PAFC. Residual Al has a strong chemical activity and bioavailability, and its accumulation could induce diseases of the gastrointestinal, nervous, skeletal, hematopoietic, and respiratory systems [13,14]. Excessive residual Fe aggravates the chromaticity of the water bodies and corrodes the pipelines [15,16]. Therefore, composite organic and inorganic coagulants have received much attention for solving these problems. Polymeric aluminum chloride (PAC) combined with chitosan decreased residual Al concentration to 0.15 mg/L and realized removal efficiencies of 82%, 63%, and 87% for UV-radiation at 254 nm (UV254), dissolved organic carbon (DOC), and turbidity, respectively [17]. The aggregation of algae cells, efficient turbidity removal, and reduction of residual metal salts concentrations were achieved by integrating cationic polyacrylamide (CPAM) and metal salt coagulants [18]. Although chitosan and CPAM benefit coagulation performance, their applications have limitations. Chitosan, a natural organic polymer, is not cost-saving due to the complex extraction and purification processes [8]. Acrylamide (AM), a monomer of the synthetic organic polymer CPAM, is toxic to aquatic species and contributes to forming the disinfection by-products (DBPs) [8]. Moreover, the coagulation performance could be limited because of the weak interactions, which are intermolecular forces or ionic bonds, between the inorganic and organic coagulants [19]. Therefore, extensive attention has been given to explore a stronger chemical bonding between the inorganic and organic coagulants. A covalently bonded poly-coagulant CAFM was synthesized by combining CPAM and PAFC with triethoxyvinylsilane (VTES, a silane coupling agent) through ultraviolet (UV) initiation for algae removal [20]. CAFM with the Si/(Al + Fe) molar ratio of 0.6 at a dosage of 40 mg/L removed 96% of chlorophyll α (Chl-α) and 87% of turbidity. Additionally, concentrations of residual Al and residual Fe were 12.47 and 9.64 µg/L, respectively, which were much lower than their threshold of 0.200 and 0.300 mg/L in National Standard of the People’s Republic of China for drinking water quality standards (GB 5749–2022), respectively. It was due to the enhanced interactions and contaminant-adsorption sites provided by the stable covalent bonds Si–O–Al and Si–O–Fe. Therefore, integrating silicon with iron- and aluminum-based coagulants for the removal of residual metal salts is worth investigating. However, the process of preparing CAFM is cumbersome, and introducing various organic substances such as AM is harmful to aquatic ecology. Therefore, the following criteria are worth considering for obtaining an efficient poly-coagulant for a cost-effective and environmentally friendly method of algae removal: (1) method to synthesize the poly-coagulant, (2) method to test the effectiveness of the poly-coagulant and obtain optimal operating conditions, (3) functional groups that are effective for algae removal in the poly-coagulant, and (4) feasibility of the poly-coagulant for real algae-laden water.
This study aims to prepare Fe-Al-SiO2 (FAS) poly-coagulants using ball milling for applications in the removal of Microcystis aeruginosa. The Response Surface Methodology (RSM) and Analysis of Variance (ANOVA) were used to investigate the effects of preparation parameters on removal efficiency and to obtain optimum preparation conditions. The surface morphology, chemical structure, and thermal stability of the FAS poly-coagulants were characterized by scanning electron microscopy (SEM), Fourier transform infrared (FTIR) spectroscopy, x-ray diffraction (XRD), and thermogravimetric/derivative thermogravimetric-differential scanning calorimetry (TG/DTG-DSC). Additionally, removal efficiencies of FAS poly-coagulants for real algae-laden water were also explored through water quality parameters such as pH, optical density at 680 nm (OD680), Chl-α, turbidity, total phosphorus (TP), residual Al, and residual Fe.

2. Results and Discussion

2.1. Evaluation of Fitted Model

The experimental and predicted output responses obtained from BBD for the 17 runs were recorded in Table S1. The prediction was calculated using the quadratic polynomial equation. There was little discrepancy between the experimental and predicted values, indicating that the quadratic model was valid [21]. The final quadratic polynomial equations, in terms of the coded variables, are expressed in Equations (1)–(4). The linear and the quadratic terms denote the effects of only one variable and interactions, respectively. A positive term means a synergistic effect and vice versa. Furthermore, the effect is more considerable for a larger coefficient [22,23].
R1 = 0.1656 − 0.0172 A − 0.0042 B + 0.0510 C − 0.0020 AB + 0.0035 AC + 0.0015 BC − 0.0093 A2 − 0.0153 B2 + 0.0612 C2
R2 = 0.1156 − 0.0127 A + 0.0280 B − 0.3138 C − 0.0035 AB + 0.0350 AC − 0.0445 BC + 0.0087 A2 − 0.0398 B2 + 0.7717 C2
R3 = 87.69 + 0.3012 A − 0.5772 B − 31.65 C − 0.1702 AB − 1.53 AC + 2.17 BC − 1.40 A2 − 1.16 B2 − 37.52 C2
R4 = 91.10 − 0.1362 A + 1.26 B − 46.36 C + 2.25 AC + 1.05 BC + 5.04 A2 − 0.5806 B2 − 54.65 C2
where R1 and R2 denote the residual Al and Fe (in mg/L), respectively. R3 and R4 denote the removal rates of TP and OD680 (in %), respectively.
Additionally, ANOVA was applied to test the hypotheses of the quadratic model. As shown in Tables S2–S5, the results of ANOVA for the quadratic model demonstrated that the output responses were well-fitted to the quadratic model with a 95% confidence level. Large F-values and p-values less than 0.05 were acceptable. R1–R4 showed a p-value of less than 0.05 and the F-values of 16.21, 236.22, 197.38, and 432.19, respectively, implying that the model was significant. Moreover, the F- and p-values could predict the effects of the linear, quadratic, and interactive variables on the output responses [24]. A, C, B2, and C2 were significant model terms for R1. In the single-variable experiment, hydrophobic silica proved effectiveness in decreasing residual Al. However, B, with a p-value greater than 0.10, was not significant for R1 in the three-variable and three-level experiment, which might be affected by other variables. C and C2 were the significant influencing model terms for R2, followed by B, BC, and B2. C and C2 were significant model terms for R3, while the effects of other variables and interactions were insignificant. C, A2, and C2 were the significant model terms for R4. These results showed that the linear terms had superior effects on the output responses than the quadratic and interactive terms, and C was the most significant linear term. Additionally, the non-significant lack of fit (p-value exceeding 0.05) was admirable [23]. The lack of fit values for R1–R4 were 0.9454, 0.0983, 0.1412, and 0.0971, respectively, indicating their insignificance relative to the pure error.
Fit statistics of the quadratic model for the output responses are listed in Table 1. The coefficient of variation percent (C.V. %) is defined as the ratio of the standard deviation to the mean. Furthermore, the model is rendered precise for CV % below 10% [22]. The CV % values for R1–R4 are 9.05%, 8.52%, 4.09%, and 4.11%, respectively. R2 greater than 0.80 [25] and a difference less than 0.2 between the predicted and adjusted R2 are acceptable for verifying the suitability of the model. As shown in Table 1, R2 values for R1–R4 are 0.9542, 0.9967, 0.9961, and 0.9982, respectively. The predicted R2 values for R1–R4 were in reasonable agreement with the corresponding adjusted R2 values, and the differences were all below 0.2. The adequate precision measured the signal-to-noise ratio, and a ratio of more than four is desirable. An adequate signal is validated by the adequate precision values of 12.9763, 39.8968, 33.3209, and 51.6408 for R1–R4, respectively. Therefore, the quadratic model can be used to navigate the design space.
Diagnostics for output responses, including normal plots of residuals and predicted vs. actual plots, were conducted to reinforce the model validation. As shown in Figure S4, all the residuals laid on or were evenly distributed on both sides of the normality line, indicating minimal errors in experiments and the reliability of the model [21]. Furthermore, as shown in Figure S5, in the predicted vs. actual plots, most data points were located on the y = x line, indicating that the quadratic model adequately depicted the correlation between the predicted and the actual values [22,24]. Therefore, in general, the fitted quadratic model was acceptable.

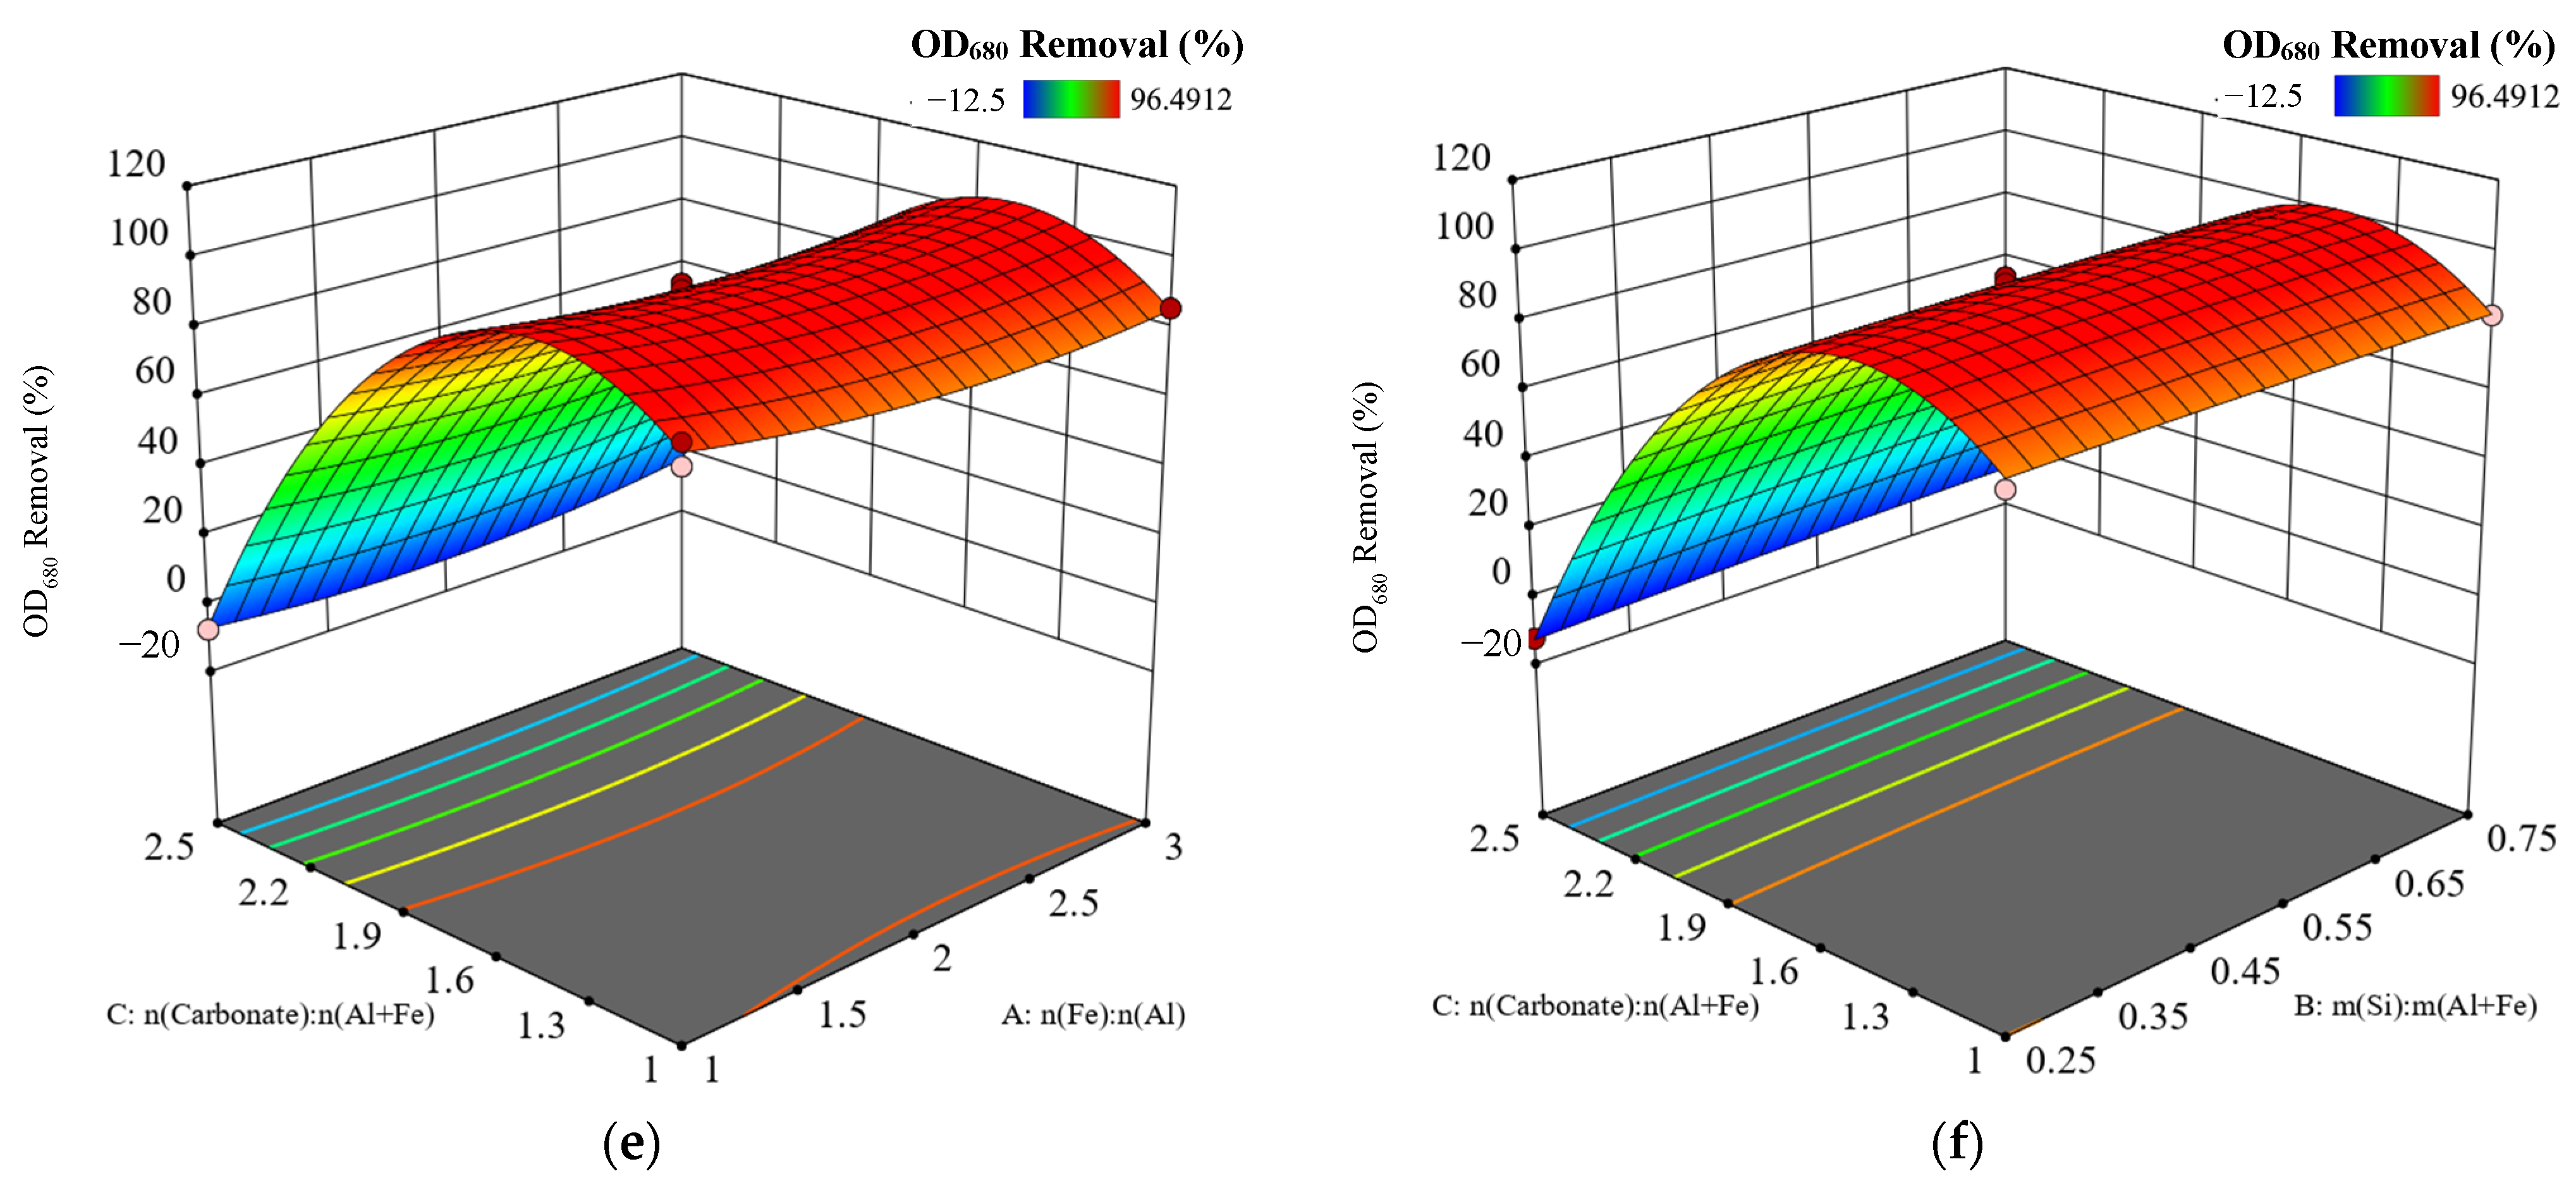
2.2. Effects of Input Variables

The three-dimensional (3D) response surface plots were used to reflect the interactions among input variables and the effects on output responses. Referring to Figure 1a–c, the residual Al concentration decreased slightly as n(Fe):n(Al) increased from 1 to 3. However, it was little affected by m(Si):m(Al+Fe). Although residual Al concentration was stably below 0.20 mg/L when n(CO32−):n(Al+Fe) was no greater than 1.75, it increased evidently for the ratio greater than 1.75. The significance of the effect of n(CO32−):n(Al+Fe) was in agreement with its p-value of less than 0.05. Aluminum hydrolysates could be in the dissolved state for n(CO32−):n(Al+Fe) above 1.75. Under this condition, carbonate and hydrophobic silica were negatively charged and competed with the positively charged aluminum hydrolysates, hindering the formation of aluminosilicate sites and Al–O–Si covalent bonds and resulting in higher residual Al concentration in the supernatant [20,26,27].
Referring to Figure 1d–f, the increase in n(Fe):n(Al) from one to three led to a slight decrease in residual Fe concentration. This was probably attributed to the predominance of sweep flocculation and the formation of denser flocs as the ferrous iron increased, which favors flocs settling at a high velocity by gravity [28,29] and decreasing residual Fe concentration. The effect of m(Si):m(Al+Fe) on residual Fe concentration was closely correlated to n(CO32−):n(Al+Fe). The residual Fe concentration was much below 0.3 mg/L in the whole range of m(Si):m(Al+Fe) for n(CO32−):n(Al+Fe) approximately 1.75. However, the effect of m(Si):m(Al+Fe) on residual Fe concentration was negligible when n(CO32−):n(Al+Fe) was below or above 1.75, indicating the efficiency of hydrophobic silica for reducing residual Fe concentration at a moderate n(CO32−):n(Al+Fe). The significant effect of n(CO32−):n(Al+Fe) on residual Fe concentration corresponded to its p-value of less than 0.05. Stable chemical bonds were difficult to form due to the lack of carbonates and excess hydrolyzed ferrous iron for n(CO32−):n(Al+Fe) below 1.75, leading to more Fe residues. Additionally, the reaction between carbonates and ferrous iron was hindered by the electrostatic repulsion of carbonates for n(CO32−):n(Al+Fe) above 1.75, also resulting in higher residual Fe concentration.
As shown in Figure 2, for the removal efficiency of TP and OD680, the effects of n(Fe):n(Al) and m(Si):m(Al+Fe) were insignificant for the same n(CO32−):n(Al+Fe), corresponding to p-values greater than 0.05. The removal efficiency for TP and OD680 was enhanced when n(CO32−):n(Al+Fe) increased from 1 to 1.75. The removal efficiency for TP was up to the optimum of 90.55% when n(CO32−):n(Al+Fe) reached 1.75, and the pH was neutral, which was in good agreement with the previous study [30]. Moreover, the pH value increased as n(CO32−): n(Al+Fe) increased from 1.75 to 2.5, but the removal rates of TP and OD680 decreased. The solubility of the precipitates such as metal phosphates was increased, and the surface charge was reduced due to the higher pH, hindering the process of chemical precipitation [31]. In alkaline conditions, the hydroxyl ions probably competed with the phosphate ions of the precipitates through ligand exchange, releasing phosphorus from the precipitates [32]. Excess carbonates possibly unfavored the interactions among raw materials and coagulation after that. Furthermore, more negatively charged hydroxyl ions were generated by the hydrolysis of carbonates for n(CO32−):n(Al+Fe) above 1.75, which competed with the anionic functional groups such as carboxyl (–COOH) and amino (–NH2) on the surface of the algal cells for the positive charge carried by FAS poly-coagulants [33], decreasing the removal efficiency for OD680.

2.3. Characterization of Fe-Al-SiO2 Poly-Coagulants

The results of ANOVA showed that n(CO32−):n(Fe+Al), the preparation parameter of FAS poly-coagulants, most significantly influenced the removal efficiency. Thus, the characterization results of FAS5, FAS13, and FAS7 with n(CO32−): n(Al+Fe) of 1:1, 1.75:1, and 2.5:1, respectively, were selected and analyzed.

2.3.1. SEM Analysis

The SEM micrographs of the selected FAS samples and raw materials are shown in Figure 3 and Figure S6. Figure S6 shows that the ferrous sulfate heptahydrate was in columnar crystals, aluminum sulfate octadecahydrate was in lamellar crystals, sodium carbonate was stacked by angular strips, and hydrophobic silica was dense and smooth. Significant morphological changes are observed in Figure 3. The morphology of the sodium carbonate was hardly observed in the selected FAS samples. Many clustered nanoparticles of different sizes were irregularly distributed on the surfaces of the columnar or lamellar crystals. Only the morphology of hydrophobic silica had little change, indicating that almost all sodium carbonate reacted with the surface layer of the ferrous sulfate heptahydrate and aluminum sulfate octadecahydrate crystals. The crystals of ferrous sulfate heptahydrate and aluminum sulfate octadecahydrate were observed more in FAS5 and FAS7 than in FAS13. FAS13 had more agglomerated nanoparticles on the surface of columnar and lamellar crystals, suggesting that n(CO32−):n(Al+Fe) of 1.75:1 favored the reaction between the raw materials and the generation and attachment of nanoparticles.

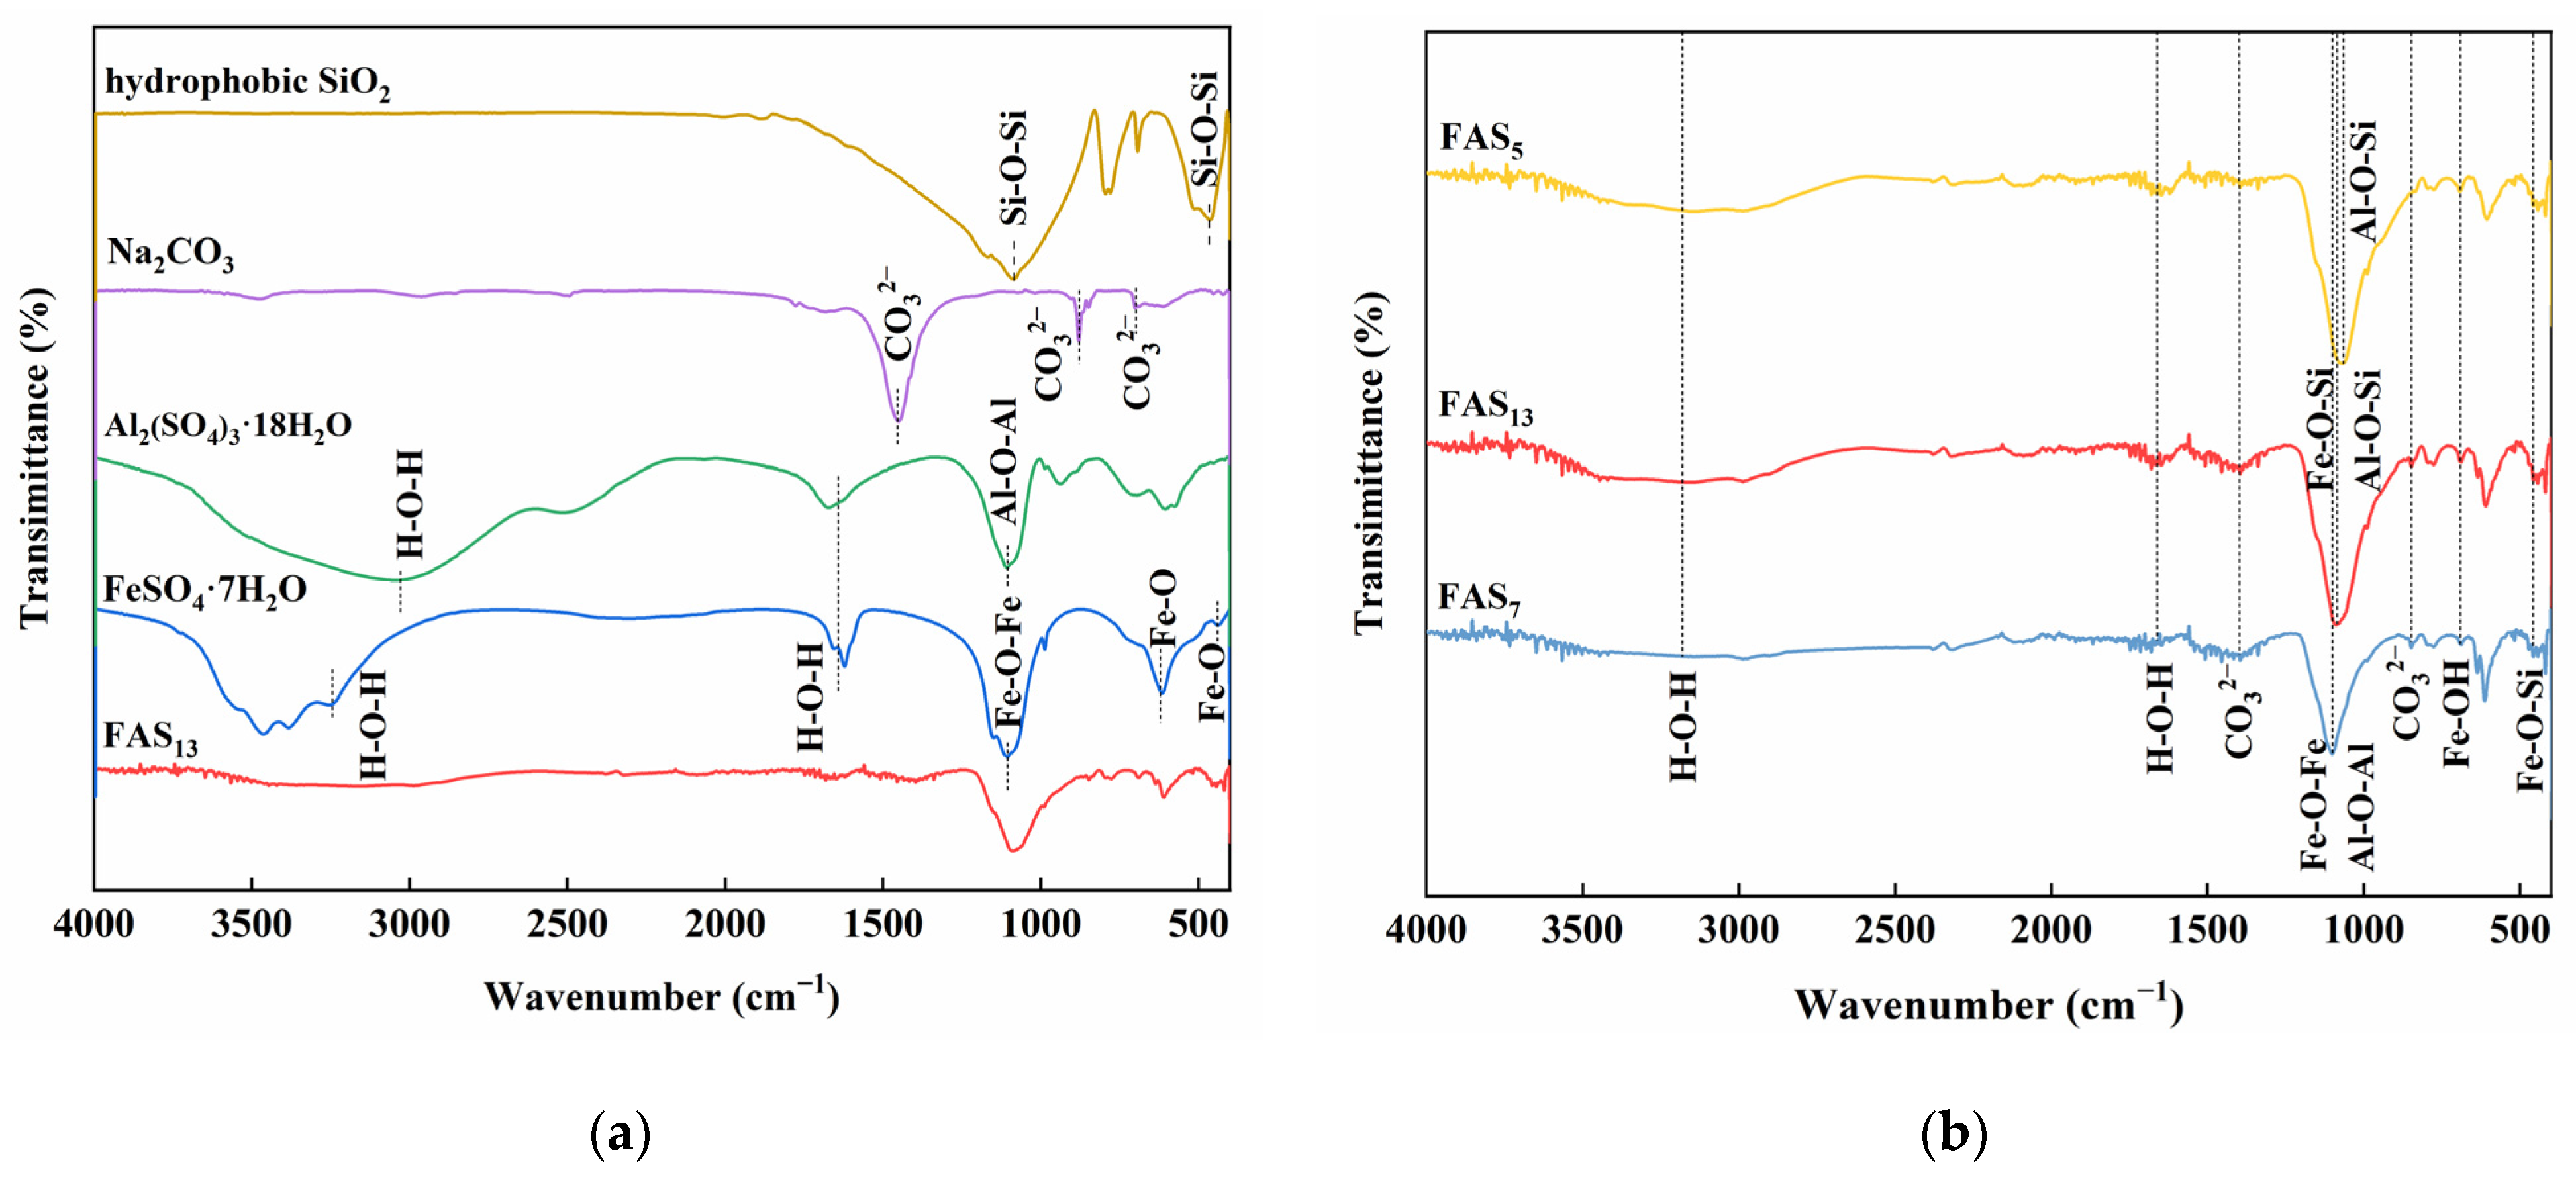
2.3.2. FTIR Analysis

FTIR spectra of the four raw materials and the selected FAS samples are presented in Figure 4. The bending vibrations of crystal water [34] around 3181 cm−1 and 1659 cm−1 for ferrous sulfate heptahydrate and aluminum sulfate octadecahydrate almost disappeared in the selected FAS samples. The characteristic peaks at 1448 cm−1 and 877 cm−1 corresponding to the vibrations of carbonates [35] after red shifting to 1390 cm−1 and 850 cm−1 were observed in the selected FAS samples, and the peaks were weakened evidently. Therefore, this implied that the crystal water and carbonates of raw materials were involved in the generation reaction of FAS samples. The absorption peaks of the ferrous sulfate heptahydrate at 615 cm−1 and sodium carbonates at 695 cm−1 were due to the vibrations of Fe–O [20] and carbonates [35], respectively. The characteristic band of the selected FAS samples at 691 cm−1 corresponding to the Fe–OH vibration [36] proved the occurrence of the local hydrolysis reaction between ferrous sulfate heptahydrate and sodium carbonates. The spectrum of hydrophobic silica displayed a wide absorption peak at 1080 cm−1 and a narrow peak at 461 cm−1, which were assigned to the Si–O–Si vibrations [19,37]. The strong peak of ferrous sulfate heptahydrate and aluminum sulfate octadecahydrate at 1109 cm−1 was ascribed to the vibrations of Fe–O–Fe and Al–O–Al [38], and the peak at 435 cm−1 was attributed to the Fe–O vibration [36]. These peaks were weakened and shifted in the selected FAS samples. The peak of FAS13 at 1090 cm−1 was attributed to the combination of Fe–O–Si and Al–O–Si [39]. However, the peak of FAS5 at 1065 cm−1 belonged to Al–O–Si [19], and the peak of FAS7 at 1100 cm−1 was more likely the combination of Fe–O–Fe and Al–O–Al [38]. The peak at 457 cm−1, assigned to the Fe–O–Si vibrations [40], was observed for all FAS samples.

2.3.3. XRD Analysis

XRD spectra of the four raw materials and selected FAS samples are shown in Figure 5. Characteristic peaks of ferrous sulfate heptahydrate, aluminum sulfate octadecahydrate, and sodium carbonates especially could not be observed in the selected FAS samples. Characteristic peaks of the hydrophobic silica were shifted to the right and weakened substantially, resulting in some new diffraction peaks appearing in the selected FAS samples. Furthermore, the results identified that the new functional groups, such as Fe–O–Si, Al–O–Si, and Fe–OH, were generated by the interactions among raw materials rather than simple physical blending. The diffraction peaks of Al2Si2O5(OH)4 were observed at 19.9° (020), 22.4° (−112), and 30.4° (−114) for all FAS samples, which were consistent with JCPDS No. 10–0446. According to JCPDS No. 44–1401, the diffraction peaks at 32.4° (330) and 34.0° (061) were attributed to Fe7Si8O22(OH)2. The new phase compositions of Al2Si2O5(OH)4 and Fe7Si8O22(OH)2 were in accordance with the covalent bonds of Al–O–Si and Fe–O–Si in FTIR spectra, respectively. Additionally, the characteristic peaks at 29.1°, 42.7°, and 49.0° corresponding to the (080), (271), and (520) planes of Fe2(OH)2CO3 (JCPDS No. 33–0650) were observed, which coincided with the aforementioned functional group of Fe–OH. The peaks at 20.9°, 26.6°, 50.1°, 60.0°, and 68. 1° were due to the (100), (101), (112), (211), and (212) planes of quartz (JCPDS No. 46–1045).
As shown in Figure 5b, the peak intensity of Al2Si2O5(OH)4 for FAS7 was weaker than that for FAS13 and FAS5. Additionally, the peak intensity of Fe7Si8O22(OH)2 for FAS5 was the weakest, which was in good agreement with the removal efficiency for residual Al and Fe and verified the binding effects of Al–O–Si and Fe–O–Si. On the other hand, FAS13 had a stronger peak intensity of Fe2(OH)2CO3, corresponding to the intensity of Fe–OH than the FAS7. It should be noted that the removal efficiency of FAS13 for TP was the highest at 90.55%. However, it was the lowest for FAS7 at 20.16%.

2.3.4. TG/DTG-DSC Analysis

The thermal characteristics of the selected FAS samples are shown in Figure 6. Additionally, the weight loss (WL) and corresponding temperature details are summarized in Table S6 of Supplementary Materials.
As shown in Figure 6a–c, the TG/DTG-DSC curves underwent WL in at least four steps. In the first stage, the WL of 24.33% for FAS13, 23.63% for FAS5, and 17.29% for FAS7 was observed in the 22.75–243.89 °C, 24.99–241.06 °C, and 20.81–244.07 °C ranges, respectively. The DSC curves of all FAS poly-coagulants in the first stage were composed of several consecutive and overlapping endothermic peaks, which were attributed to the loss of hydroxyl and water molecules bonded in different intensities [20,41]. Furthermore, the higher WL of FAS13 proved the participation of more crystalline water of raw materials in the reactions to form new functional groups. The second stage of WL for FAS13, FAS5, and FAS7 occurred in the 243.89–442.98 °C, 241.06–453.88 °C, and 244.07–449.67 °C ranges, respectively. Only a tiny WL of 1.37–1.87% was observed, corresponding to a slight exothermic peak around 330 °C, which may be ascribed to a recrystallization process [41]. In the third stage of the thermal behaviors, WL of 8.36% for FAS13, 10.86% for FAS5, and 6.21% for FAS7 was observed in the 442.98–733.79 °C, 453.88–788.18 °C, and 449.67–775.33 °C ranges, respectively. Thermal events were small in the DSC curves, suggesting that exothermic and endothermic reactions occurred simultaneously, probably the thermal decomposition and oxidation of Fe2(OH)2CO3 and its gaseous product such as carbon dioxide [41]. The WL of FAS13 was greater than that of FAS7, indicating a larger content of Fe2(OH)2CO3 in FAS13 and corresponding higher removal efficiency for TP. However, the interactions between ferrous sulfate heptahydrate and sodium carbonate were weakened due to the low carbonate content in FAS5. The WL of 10.86% for FAS5 was caused by the synergistic thermal decomposition and oxidation of Fe2(OH)2CO3 and ferrous sulfate heptahydrate. In the last stage, a WL of 8.11% for FAS13, 5.64% for FAS5, and 11.11% for FAS7 was observed, associated with a sharp endothermic peak around 822 °C. The WL of FAS13 and FAS5 was ascribed to the breakdown of the covalent bonds Fe–O–Si and Al–O–Si [20]. The smaller WL for FAS5 verified the less covalent bonds, especially Fe–O–Si, and it was in accordance with its poor removal efficiency for residual Fe. However, the WL is more likely to be dominated by the thermal decomposition of unreacted functional groups, such as Fe–O–Fe and Al–O–Al, in FAS7. The final residual mass of the three FAS poly-coagulants maintained above 50%, implying excellent thermal stability.

2.3.5. Speculative Mechanisms of Fe-Al-SiO2 Poly-Coagulants

According to the preparation procedure, coagulation efficiencies, influencing factors, and characterizations of physiochemical properties, the speculative mechanisms of FAS poly-coagulants during coagulations are shown in Figure 7.
Fe7Si8O22(OH)2 and Al2Si2O5(OH)4, corresponding to the covalent bonds Fe–O–Si and Al–O–Si, provide binding sites for hydrolysates of Fe/Al and other contaminants. The covalent bonds could strengthen chemical connections between Fe/Al and Si [20], thereby reducing residual Fe/Al concentrations to below the limits, minimizing risks caused by residual Fe/Al. Fe2(OH)2CO3, corresponding to Fe–OH, could be converted into FeOOH during coagulations [42]. FeOOH is dispersed in solution with the help of binding sites provided by Fe–O–Si and Al–O–Si to avoid aggregation on its own, promoting TP and algae removal by adsorption and sedimentation in the form of algae-phosphorus flocs [43]. Therefore, the occurrence of Fe7Si8O22(OH)2, Al2Si2O5(OH)4, and Fe2(OH)2CO3 was conducive for FAS poly-coagulants to reduce residual Fe/Al concentrations and improve removal efficiencies of TP, which coincide with coagulation efficiencies in Table S1.

2.4. Applications in Real Algae-Laden Water

Results of RSM showed that the optimal condition for preparing FAS poly-coagulants were n(Fe):n(Al) of 2:1, m(Si):m(Fe+Al) of 1:2, and n(CO32−):n(Fe+Al) of 1.75:1. FAS13, which was prepared under the above condition, had the highest coagulation efficiency for simulated algae-laden water. Thus, FAS13 was used as a poly-coagulant for real algae-laden water treatment. The removal efficiency of FAS13 for pollutants (TP, OD680, turbidity, and Chl-α), pH of the supernatant, and concentrations of residual Al and Fe under different dosages are shown in Figure 8.
As shown in Figure 8a,c,e, removal rates of TP, OD680, turbidity, and Chl-α increased as the dosage increased from 0.175 to 0.613 mmol/L (in terms of Fe and Al) for real algae-laden water samples. The removal efficiency for the target pollutants tended to grow slowly or stay stable when dosages higher than 0.613 mmol/L. As shown in Figure 8b,d,f, the pH values of supernatant maintained at the range of 7.5–8.0, indicating that FAS13 had little effect on the pH values of real algae-laden water. For three samples, concentrations of residual Al and Fe in supernatants were less than the limit values of GB 5749–2022 at the dosage of 0.350 mmol/L and remained at lower levels with increased dosage. As shown in Figure 8, the optimum dosages for the three real algae-laden water samples were 0.525, 0.613, and 0.613 mmol/L, respectively. Removal rates of TP, OD680, turbidity, and Chl-α were 93.87%, 97.83%, 97.61%, and 94.76%, respectively, for the water sample of Yanghu Wetland Park. For the water sample of Liuyang River, the removal rate of TP was 95.14%, and the residual TP concentration was 0.043 mg/L, which was lower than 0.070 mg/L, and the algal bloom probability was reduced to less than 40% [44]. The removal efficiency for the target pollutants was excellent for the water sample from the Laodao River. The residual TP concentration was only 0.023 mg/L, less than 0.030 mg/L, decreasing the algal bloom possibility to less than 10% [44]. The removal rate of TP increased by 3.32%–12.32% when FAS13 was used for real algae-laden water. The coagulation performance of FAS13 in the real algae-laden water was superior to that in the simulated algae-laden water.
In general, FAS13 performed well in the coagulation treatment of real algae-laden water, especially for removal efficiencies of TP and residual Al.

3. Materials and Methods

3.1. Reagents and Algae-Laden Water

Ferrous sulfate heptahydrate (99%), aluminum sulfate octadecahydrate (99%), sodium carbonate (99.8%), hydrophobic silica (99%), and other reagents of analytical reagent grade were purchased from Sinopharm Chemical Reagent Co., Ltd. (Shanghai, China). All reagents were used directly without further purification. The deionized water was obtained from a Milli-Q system (Smart2Pure 12 UV/UF water purification system, Thermo Scientific, Waltham, MA, USA).
Microcystis aeruginosa (strain FACHB-905) was purchased from the Freshwater Algae Culture Collection at the Institute of Hydrobiology, Chinese Academy of Sciences (Wuhan, China) and was cultured in BG-11 medium with a cycle of light (12 h) and dark (12 h) at 26 °C. Simulated algae-laden water was prepared by proportionally mixing deionized water with the stock solutions of Microcystis aeruginosa in the stationary growth phase (OD680 of 1.817) and dipotassium hydrogen phosphate. The cultured Microcystis aeruginosa cells were diluted to 0.98 × 10⁶–1.24 × 10⁶ cells/mL, and TP was controlled at 0.20 ± 0.02 mg/L, similar to that in eutrophic water [45].
Three samples of real algae-laden water were collected in August 2022 from the Yanghu Wetland Park, Liuyang River, and Laodao River at Changsha (27°51′–28°41′ N, 111°53′–114°15′ E) in the Hunan province of China. According to the microscopic examinations, Microcystis aeruginosa was the dominant algal species in the three water samples. The major water quality parameters of real algae-laden water are listed in Table 2.

3.2. Preparation of Fe-Al-SiO2 Poly-Coagulants

Ferrous sulfate heptahydrate, aluminum sulfate octadecahydrate, hydrophobic silica, and sodium carbonate were ground using a planetary ball mill (XQM-2, Changsha Tencan Powder Technology Co., Ltd., Hunan, China) with four agate grinding jars of 50 mL to prepare FAS poly-coagulants. The diameters of the agate grinding balls were 15, 10, and 6 mm. The gradation of the grinding media was 1:1:1. The mass ratio of the raw materials to the agate grinding balls was 1:4. The revolution and rotation speeds were 85 and 170 rpm, respectively. The grinding time of 2 h was divided into two stages. Ferrous sulfate heptahydrate, aluminum sulfate octadecahydrate, and sodium carbonate were milled for 1 h in the first stage, followed by adding hydrophobic silica and grinding for 1 h in the second stage. The grinding process, suspended every 15 min for 15 min, was operated at atmospheric pressure and 25 ± 1 °C temperature. The obtained FAS poly-coagulants were sealed and stored at room temperature. Thirteen FAS poly-coagulants samples were prepared and named FAS1–13. Numbers 1–13 corresponded to jar tests ranked 1–13 in Table S1, respectively. Parameters of input variables for jar tests ranked 1–12 were different but the same for jar tests ranked 13–17. The sample numbered 13 was thereby taken as the representative of 13–17.

3.3. Coagulation Test

The coagulation experiments were conducted using a programmed jar test apparatus with six square beakers (ZR4–6, Zhongrun Water Industry Technology Development Co., Ltd., Guangdong, China). The volume of the simulated or real algae-laden water in each beaker was 1000 mL. The coagulation procedure adopted was as follows: First, certain amounts of FAS poly-coagulants was added into each beaker under rapid stirring at 400 rpm for 30 s, medium stirring at 200 rpm for 1 min, and slow stirring at 50 rpm for 10 min. Subsequently, each beaker was kept still for 30 min. Finally, water samples 2 cm below the supernatant were collected. The dosage for simulated algae-laden water is 0.200 mmol/L, while the dosage for real algae-laden water is from 0.175 to 0.875 mmol/L, and the dosage is in terms of Fe and Al. The water quality indexes of the supernatant, such as pH, OD680, TP, residual Al, residual Fe, turbidity, and Chl-α, were directly determined without membrane filtration to avoid the interference of other treatment methods.

3.4. Analytical Methods

Turbidity was detected by a portable turbidimeter (2100P, HACH, USA). TP, OD680, residual Fe/Al, and Chl-α were measured by an ultraviolet–visible spectrophotometer (UV-1800, Shimadzu, Kyoto, Japan). The ammonium molybdate spectrophotometric method was used to determine the TP concentration. The phenanthroline and chrome azurol S spectrophotometric methods were used to determine the residual Fe and Al contents, respectively.
It is proven that the Microcystis aeruginosa cell concentration is positively correlated with OD680 and the Chl-α concentration [28]. Microcystis aeruginosa cultured in the laboratory was diluted in different concentration gradients to measure OD680. The algal cells were counted three times using a light biomicroscope (ECLIPSE E100, Nikon, Beijing, China) and a hemocytometer to determine the cell concentration. More than 20 sets of data were recorded. The correlation equation is listed in Equation (5).
Y = 24.0982 X − 0.3734
where Y represents cell concentrations (106 cells/mL), and X represents OD680. The square of the correlation coefficient was 0.9714, indicating a good correlation between Y and X.
The Chl-α concentration was obtained by the sonication-assisted anhydrous ethanol extraction. The detailed procedure was as follows: First, 10 mL of algae-laden water was vacuum filtered with a 0.45 µm membrane and washed three times with ultrapure water during filtration. Then, the filter membranes were cut up. Finally, the debris was shaken well with 10 mL of anhydrous ethanol, sonicated for 30 min at 360 W (JP-060S, Skymen, China), and centrifuged twice at 10,000 rpm for 10 min each time (TG16-WS, Cence, China). The temperature was kept constant at 21 °C, and the process was shaded from the light. The Chl-α concentration was calculated using Equation (6).
c = 11.084 (λ663 − λ750) − 3.914 (λ645 − λ750)
where c represents the Chl-α concentration (in mg/L). λ663, λ645, and λ750 represent the absorbances at 663, 645, and 750 nm, respectively.

3.5. Experimental Design

Box–Behnken design (BBD) of the RSM of the Design-Expert 12 software (State-Ease, USA) was utilized to investigate the relationship between the input variables and the output responses, obtain the fitted model, and generate optimal operating conditions of FAS poly-coagulants for algae removal [22,46]. In this study, the three input variables chosen were n(Fe):n(Al), m(Si):m(Al+Fe), and n(CO32−):n(Al+Fe). The residual Fe/Al and the removal rates of TP and OD680 were employed as the output responses. As shown in Table 3, the range of input variables was obtained based on the effects of pH, dosage (including hydrophobic silica and coagulants), and the molar ratio of Fe/Al on the coagulation performance of aluminum sulfate octadecahydrate to treat simulated algae-laden water (Figures S1–S3). The range of the actual input variables was depicted using coded values (−1 to +1) to simplify the design process. The low and high levels were represented by −1 and +1, respectively. Furthermore, the actual and coded variables are shown in Table 3. The coded variables from BBD for 17 runs of the jar test are listed in Table S1.
A quadratic model was chosen to ensure that the p-value was less than 0.05. The quadratic polynomial equation, expressed in Equation (7), was used for fitting the experimental data to assess the relationship among the variables and obtain the optimum condition.
y = b0 + ∑i=1−k bixi + ∑i=1−k biixi2 + ∑i=1−kj=(i+1)−k bijxixj
where y, x, and k denote the output response, input variable, and total jar tests, respectively. b0, bi, bii, and bij denote the constant, linear, quadratic, and interactive regression coefficients, respectively [24].

3.6. Characterization

The surface morphologies of raw materials and FAS poly-coagulants were studied using field emission scanning electron microscopy (FE-SEM, GeminiSEM 300, ZEISS, Oberkochen, Germany). The functional groups of raw materials and the FAS coagulants were recorded on KBr pellets in the 400–4000 cm−1 range in FTIR spectroscopy (Nicolet iS5, Thermo Scientific, USA). The phase compositions of the FAS coagulants were characterized using XRD (D8 Advance, BRUKER, Bremen, Germany). The thermal stability of FAS poly-coagulants was compared through the TG/DTG-DSC curves obtained by a simultaneous thermal analyzer (SDT Q600, TA Instruments, New Castle, DE, USA). The heating temperature range was from room temperature to 1000 °C at a heating rate of 10 °C/min in a dry air atmosphere.

4. Conclusions

This study prepared novel Fe-Al-SiO2 (FAS) poly-coagulants using the ball milling method for algae-laden water treatment. In the preparation parameters of the FAS poly-coagulants, the most significant effect of the n(CO32−):n(Al+Fe) on the removal efficiencies for the algae and related pollutants was validated by RSM and ANOVA. The optimal preparation condition of the FAS poly-coagulants was obtained when n(Fe):n(Al), m(Si):m(Fe+Al), and n(CO32−):n(Fe+Al) were 2:1, 1:2, and 1.75:1, respectively, which means that FAS13 was the optimal FAS poly-coagulant. The removal efficiencies for OD680, TP, and residual Al and Fe concentrations were 92.86%, 90.55%, 0.142 mg/L, and 0.074 mg/L, respectively, when FAS13 was used as a poly-coagulant for treating simulated algae-laden water. Interactions occurred among raw materials to produce FAS poly-coagulants. The agglomerated nanoparticles, excellent thermal stability, and functional groups such as Al–O–Si, Fe–O–Si, and Fe–OH corresponding to Al2Si2O5(OH)4, Fe7Si8O22(OH)2, and Fe2(OH)2CO3, respectively, were observed in the FAS13 sample. The occurrence of Fe7Si8O22(OH)2, Al2Si2O5(OH)4, and Fe2(OH)2CO3 was important for the FAS13 sample to improve its coagulation performance. Additionally, FAS13 was highly efficient for treating real algae-laden water with Microcystis aeruginosa as the dominant algal species. The coagulation performance of FAS13 was superior in real algae-laden water than that in simulated algae-laden water. The pH values of real algae-laden water were maintained within 7.5–8.0 after coagulation. The removal rates of TP, OD680, turbidity, and Chl-α were above 93.87%. The residual Al concentration was in the range of 0.057–0.128 mg/L, and residual Fe concentration was less than 0.300 mg/L. The removal rate of TP increased by 3.32%–12.32%, and the residual TP concentration was 0.023 mg/L. In general, this study could provide new insights into the application of coagulants for algae-laden water treatment.

Supplementary Materials

The following supporting information can be downloaded at: https://www.mdpi.com/article/10.3390/inorganics11050210/s1, Figure S1: Coagulation performance of aluminum sulfate octadecahydrate in (a,b) neutral conditions and (c,d) acid conditions; Figure S2: Coagulation performance of hydrophobic silica-assisted aluminum sulfate octadecahydrate in (a,b) neutral conditions and (c,d) acid conditions; Figure S3: Coagulation performance of different n(Fe):n(Al) in neutral conditions; Figure S4: Normal plots of residuals of diagnostics for (a) R1: Residual Al (in mg/L), (b) R2: Residual Fe (in mg/L), (c) R3: the removal rate of TP (in %), and (d) R4: the removal rate of OD680 (in %); Figure S5: Predicted vs. actual plots in diagnostics for (a) R1: Residual Al (in mg/L), (b) R2: Residual Fe (in mg/L), (c) R3: the removal rate of TP (in %), (d) R4: the removal rate of OD680 (in %); Figure S6: SEM images of raw materials: (a) FeSO4·7H2O, (b) Al2(SO4)3·18H2O, (c) Na2CO3, and (d) hydrophobic SiO2.; Table S1: Details from BBD for 17 runs of jar tests; Table S2: ANOVA for the regression coefficients and the significance test between the input variables and residual Al (R1); Table S3: ANOVA for the regression coefficients and the significance test between the input variables and residual Fe (R2); Table S4: ANOVA for the regression coefficients and the significance test between the input variables and the removal rate of TP (R3); Table S5: ANOVA for the regression coefficients and the significance test between the input variables and the removal rate of OD680 (R4); Table S6: Details of weight loss and corresponding temperature of FAS poly-coagulants.

Author Contributions

Conceptualization, J.W. and Y.Z.; methodology, J.W.; software, Y.Z.; validation, J.W., Y.Z., and X.N.; formal analysis, Y.Z.; investigation, J.W.; resources, X.N. and S.S.; data curation, Y.Z.; writing—original draft preparation, Y.Z.; writing—review and editing, J.W.; visualization, W.Z.; supervision, X.F.; project administration, X.N.; funding acquisition, X.N. and S.S. All authors have read and agreed to the published version of the manuscript.

Funding

This research was funded by the National Key R&D Program of China (2022YFE0105600), the Natural Science Foundation of Hunan Province (2022JJ40507 and 2020JJ4613), and the Special Fund for Building Chenzhou National Sustainable Development Agenda Innovation Demonstration Zone of Hunan Province (2021sfq15).

Institutional Review Board Statement

Not applicable.

Data Availability Statement

The data presented in this study are available on request from the corresponding author.

Conflicts of Interest

The authors declare no conflict of interest.

References

  1. Wang, Q.; Sun, L.; Zhu, Y.; Wang, S.; Duan, C.; Yang, C.; Zhang, Y.; Liu, D.; Zhao, L.; Tang, J. Hysteresis effects of meteorological variation-induced algal blooms: A case study based on satellite-observed data from Dianchi Lake, China (1988–2020). Sci. Total Environ. 2022, 812, 152558. [Google Scholar] [CrossRef] [PubMed]
  2. Huang, J.; Zhang, Y.; Arhonditsis, G.B.; Gao, J.; Chen, Q.; Peng, J. The magnitude and drivers of harmful algal blooms in China’s lakes and reservoirs: A national-scale characterization. Water Res. 2020, 181, 115902. [Google Scholar] [CrossRef]
  3. Tian, J.; Guo, S.; Wang, J.; Wang, H.; Pan, Z. Preemptive warning and control strategies for algal blooms in the downstream of Han River, China. Ecol. Indic. 2022, 142, 109190. [Google Scholar] [CrossRef]
  4. Harke, M.J.; Steffen, M.M.; Gobler, C.J.; Otten, T.G.; Wilhelm, S.W.; Wood, S.A.; Paerl, H.W. A review of the global ecology, genomics, and biogeography of the toxic cyanobacterium, Microcystis spp. Harmful Algae 2016, 54, 4–20. [Google Scholar] [CrossRef]
  5. Huisman, J.; Codd, G.A.; Paerl, H.W.; Ibelings, B.W.; Verspagen, J.M.H.; Visser, P.M. Cyanobacterial blooms. Nat. Rev. Microbiol. 2018, 16, 471–483. [Google Scholar] [CrossRef] [PubMed]
  6. Mikula, P.; Mlnarikova, M.; Nadres, E.T.; Takahashi, H.; Babica, P.; Kuroda, K.; Blaha, L.; Sovadinova, I. Synthetic Biomimetic Polymethacrylates: Promising Platform for the Design of Anti-Cyanobacterial and Anti-Algal Agents. Polymers 2021, 13, 1025. [Google Scholar] [CrossRef] [PubMed]
  7. Henderson, R.; Parsons, S.A.; Jefferson, B. The impact of algal properties and pre-oxidation on solid-liquid separation of algae. Water Res. 2008, 42, 1827–1845. [Google Scholar] [CrossRef] [PubMed]
  8. Ren, B.; Weitzel, K.A.; Duan, X.; Nadagouda, M.N.; Dionysiou, D.D. A comprehensive review on algae removal and control by coagulation-based processes: Mechanism, material, and application. Sep. Purif. Technol. 2022, 293, 116402. [Google Scholar] [CrossRef]
  9. Sun, F.; Zhang, H.; Qian, A.; Yu, H.; Xu, C.; Pan, R.; Shi, Y. The influence of extracellular polymeric substances on the coagulation process of cyanobacteria. Sci. Total Environ. 2020, 720, 137573. [Google Scholar] [CrossRef]
  10. Duan, J.; Gregory, J. Coagulation by hydrolysing metal salts. Adv. Colloid Interface Sci. 2003, 100–102, 475–502. [Google Scholar] [CrossRef]
  11. Li, H.; Pei, H.; Xu, H.; Jin, Y.; Sun, J. Behavior of Cylindrospermopsis raciborskii during coagulation and sludge storage—Higher potential risk of toxin release than Microcystis aeruginosa? J. Hazard. Mater. 2018, 347, 307–316. [Google Scholar] [CrossRef] [PubMed]
  12. Liu, X.; Graham, N.; Liu, T.; Cheng, S.; Yu, W. A comparison of the coagulation performance of PAFC and FeSO4 for the treatment of leach liquor from Stevia processing. Sep. Purif. Technol. 2021, 255, 117680. [Google Scholar] [CrossRef]
  13. Hao, W.; Hao, C.; Wu, C.; Xu, Y.; Jin, C. Aluminum induced intestinal dysfunction via mechanical, immune, chemical and biological barriers. Chemosphere 2022, 288, 132556. [Google Scholar] [CrossRef] [PubMed]
  14. D’haese, P.C.; Douglas, G.; Verhulst, A.; Neven, E.; Behets, G.J.; Vervaet, B.A.; Finsterle, K.; Lurling, M.; Spears, B. Human health risk associated with the management of phosphorus in freshwaters using lanthanum and aluminium. Chemosphere 2019, 220, 286–299. [Google Scholar] [CrossRef] [PubMed]
  15. Ma, J.; Xia, W.; Fu, X.; Ding, L.; Kong, Y.; Zhang, H.; Fu, K. Magnetic flocculation of algae-laden raw water and removal of extracellular organic matter by using composite flocculant of Fe3O4/cationic polyacrylamide. J. Clean. Prod. 2020, 248, 119276. [Google Scholar] [CrossRef]
  16. Wang, X.; Jiang, S.; Tan, S.; Wang, X.; Wang, H. Preparation and coagulation performance of hybrid coagulant polyacrylamide-polymeric aluminum ferric chloride. J. Appl. Polym. Sci. 2018, 135, 46355. [Google Scholar] [CrossRef]
  17. Zhang, Z.; Jing, R.; He, S.; Qian, J.; Zhang, K.; Ma, G.; Chang, X.; Zhang, M.; Li, Y. Coagulation of low temperature and low turbidity water: Adjusting basicity of polyaluminum chloride (PAC) and using chitosan as coagulant aid. Sep. Purif. Technol. 2018, 206, 131–139. [Google Scholar] [CrossRef]
  18. Xu, M.; Luo, Y.; Wang, X.; Zhou, L. Coagulation-ultrafiltration efficiency of polymeric Al-, Fe-, and Ti- coagulant with or without polyacrylamide composition. Sep. Purif. Technol. 2022, 280, 119957. [Google Scholar] [CrossRef]
  19. Zhao, H.; Peng, J.; Xue, A.; Ni, J. Distribution and transformation of Al species in organic silicate aluminum hybrid coagulants. Compos. Sci. Technol. 2009, 69, 1629–1634. [Google Scholar] [CrossRef]
  20. Ma, J.; Zhang, R.; Xia, W.; Kong, Y.; Nie, Y.; Zhou, Y.; Zhang, C. Coagulation performance of Al/Fe based covalently bonded composite coagulants for algae removal. Sep. Purif. Technol. 2022, 285, 120401. [Google Scholar] [CrossRef]
  21. Bakshi, A.; Verma, A.K.; Dash, A.K. Electrocoagulation for removal of phosphate from aqueous solution: Statistical modeling and techno-economic study. J. Clean. Prod. 2020, 246, 118988. [Google Scholar] [CrossRef]
  22. Lanan, F.A.B.M.; Selvarajoo, A.; Sethu, V.; Arumugasamy, S.K. Utilisation of natural plant-based fenugreek (Trigonella foenum-graecum) coagulant and okra (Abelmoschus escluentus) flocculant for palm oil mill effluent (POME) treatment. J. Environ. Chem. Eng. 2021, 9, 104667. [Google Scholar] [CrossRef]
  23. Dolatabadi, M.; Swiergosz, T.; Ahmadzadeh, S. Electro-Fenton approach in oxidative degradation of dimethyl phthalate—The treatment of aqueous leachate from landfills. Sci. Total Environ. 2021, 772, 145323. [Google Scholar] [CrossRef] [PubMed]
  24. Patel, P.; Gupta, S.; Mondal, P. Electrocoagulation process for greywater treatment: Statistical modeling, optimization, cost analysis and sludge management. Sep. Purif. Technol. 2022, 296, 121327. [Google Scholar] [CrossRef]
  25. Bello, M.M.; Nourouzi, M.M.; Abdullah, L.C.; Choong, T.S.; Koay, Y.S.; Keshani, S. POME is treated for removal of color from biologically treated POME in fixed bed column: Applying wavelet neural network (WNN). J. Hazard. Mater. 2013, 262, 106–113. [Google Scholar] [CrossRef] [PubMed]
  26. Lartiges, B.S.; Bottero, J.Y.; Derrendinger, L.S.; Humbert, B.; Tekely, P.; Suty, H. Flocculation of Colloidal Silica with Hydrolyzed Aluminum:  An 27Al Solid State NMR Investigation. Langmuir 1997, 13, 147–152. [Google Scholar] [CrossRef]
  27. Parneix, C.; Persello, J.; Schweins, R.; Cabane, B. How Do Colloidal Aggregates Yield to Compressive Stress? Langmuir 2009, 25, 4692–4707. [Google Scholar] [CrossRef]
  28. Song, Q.; Niu, X.; Zhang, D.; Song, X.; Li, Y.; Ma, J.; Lai, S.; Yang, Z.; Zhou, S. The behaviors of Microcystis aeruginosa and microcystins during the Fe2+/persulfate (PS) preoxidation-coagulation and flocs storage period. Environ. Res. 2020, 186, 109549. [Google Scholar] [CrossRef]
  29. Gonzalez-Torres, A.; Putnam, J.; Jefferson, B.; Stuetz, R.M.; Henderson, R.K. Examination of the physical properties of Microcystis aeruginosa flocs produced on coagulation with metal salts. Water Res. 2014, 60, 197–209. [Google Scholar] [CrossRef]
  30. El Samrani, A.G.; Lartiges, B.S.; Montargès-Pelletier, E.; Kazpard, V.; Barrès, O.; Ghanbaja, J. Clarification of municipal sewage with ferric chloride: The nature of coagulant species. Water Res. 2004, 38, 756–768. [Google Scholar] [CrossRef]
  31. Wang, X.; Xu, H.; Jiao, R.; Ma, G.; Wang, D. Coagulation removal of phosphorus from a southern China reservoir in different stages of algal blooms: Performance evaluation and Al-P matching principle analysis. Sci. Total Environ. 2021, 782, 146849. [Google Scholar] [CrossRef] [PubMed]
  32. Lu, J.; Yang, J.; Xu, K.; Hao, J.; Li, Y.-Y. Phosphorus release from coprecipitants formed during orthophosphate removal with Fe(III) salt coagulation: Effects of pH, Eh, temperature and aging time. J. Environ. Chem. Eng. 2016, 4, 3322–3329. [Google Scholar] [CrossRef]
  33. Tan, X.; Duan, Z.; Duan, P.; Parajuli, K.; Newman, J.; Shu, X.; Zhang, D.; Gao, L.; Li, M. Flocculation of Microcystis unicells induced by pH regulation: Mechanism and potential application. Chemosphere 2021, 263, 127708. [Google Scholar] [CrossRef] [PubMed]
  34. Zhuang, J.; Qi, Y.; Yang, H.; Li, H.; Shi, T. Preparation of polyaluminum zirconium silicate coagulant and its performance in water treatment. J. Water Process. Eng. 2021, 41. [Google Scholar] [CrossRef]
  35. Godugu, K.; Yadala, V.D.S.; Pinjari, M.K.M.; Gundala, T.R.; Sanapareddy, L.R.; Nallagondu, C.G.R. Natural dolomitic limestone-catalyzed synthesis of benzimidazoles, dihydropyrimidinones, and highly substituted pyridines under ultrasound irradiation. Beilstein J. Org. Chem. 2020, 16, 1881–1900. [Google Scholar] [CrossRef]
  36. Xu, M.; Zhou, W.; Zhu, Z.; Peng, C.; Peng, Y. Study on the preparation of polysilicate ferric flocculant and its treatment of high turbidity tailings water. J. Water Process. Eng. 2021, 44, 102457. [Google Scholar] [CrossRef]
  37. Zviagina, B.B.; Drits, V.A.; Dorzhieva, O.V. Distinguishing Features and Identification Criteria for K-Dioctahedral 1M Micas (Illite-Aluminoceladonite and Illite-Glauconite-Celadonite Series) from Middle-Infrared Spectroscopy Data. Minerals 2020, 10, 153. [Google Scholar] [CrossRef]
  38. Sun, T.; Liu, L.-L.; Wan, L.-L.; Zhang, Y.-P. Effect of silicon dose on preparation and coagulation performance of poly-ferric-aluminum-silicate-sulfate from oil shale ash. Chem. Eng. J. 2010, 163, 48–54. [Google Scholar] [CrossRef]
  39. Li, J.; Li, J.; Liu, X.; Du, Z.; Cheng, F. Effect of silicon content on preparation and coagulation performance of poly-silicic-metal coagulants derived from coal gangue for coking wastewater treatment. Sep. Purif. Technol. 2018, 202, 149–156. [Google Scholar] [CrossRef]
  40. Wan, J.; Ding, J.; Tan, W.; Gao, Y.; Sun, S.; He, C. Magnetic-activated carbon composites derived from iron sludge and biological sludge for sulfonamide antibiotic removal. Environ. Sci. Pollut. Res. Int. 2020, 27, 13436–13446. [Google Scholar] [CrossRef]
  41. Teixeira, J.A.; Fernandes, R.P.; Isquibola, G.; Gaspari, A.P.S.; Machado, A.E.H.; Caires, F.J.; Ionashiro, M. Synthesis, thermal behavior in oxidative and pyrolysis conditions, spectroscopic and DFT studies of some alkaline earth metals p-aminobenzoate complexes using TG-DTA, DSC, PXRD and EGA (TG-FTIR) techniques. Thermochim. Acta 2022, 711, 179184. [Google Scholar] [CrossRef]
  42. Azoulay, I.; Rémazeilles, C.; Refait, P. Oxidation of chukanovite (Fe2(OH)2CO3): Influence of the concentration ratios of reactants. Corros. Sci. 2015, 98, 634–642. [Google Scholar] [CrossRef]
  43. Tao, R.; Qu, M.; Zhang, S.; Quan, F.; Zhang, M.; Shen, W.; Mei, Y. Preparation of FeOOH supported by melamine sponge and its application for efficient phosphate removal. J. Environ. Chem. Eng. 2022, 10, 108064. [Google Scholar] [CrossRef]
  44. Downing, J.A.; Watson, S.B.; Mccauley, E. Predicting Cyanobacteria dominance in lakes. Can. J. Fish. Aquat. Sci. 2001, 58, 1905–1908. [Google Scholar] [CrossRef]
  45. Li, S.; Jiang, F.; Lei, T.; Ren, Z.; Wang, S.; Yang, X. Phosphorus removal by in situ sprayed ferric chloride in Dianchi Lake: Efficiency, stability, and mechanism. Process. Saf. Environ. Prot. 2019, 131, 320–328. [Google Scholar] [CrossRef]
  46. Iber, B.T.; Torsabo, D.; Chik, C.; Wahab, F.; Sheikh Abdullah, S.R.; Abu Hassan, H.; Kasan, N.A. Response Surface Methodology (RSM) Approach to Optimization of Coagulation-Flocculation of Aquaculture Wastewater Treatment Using Chitosan from Carapace of Giant Freshwater Prawn Macrobrachium rosenbergii. Polymers 2023, 15, 1058. [Google Scholar] [CrossRef] [PubMed]
Figure 1. 3D response surface plots of removal efficiencies of (ac) residual Al and (df) residual Fe.
Inorganics 11 00210 g001aInorganics 11 00210 g001b
Figure 2. 3D response surface plots for removal efficiencies of (ac) TP and (df) OD680.
Inorganics 11 00210 g002aInorganics 11 00210 g002b
Figure 3. SEM images of (a,b) FAS5, (c,d) FAS13, (e,f) FAS7.
Inorganics 11 00210 g003aInorganics 11 00210 g003b
Figure 4. FTIR spectra of (a) raw materials and (b) FAS poly-coagulants.
Inorganics 11 00210 g004
Figure 5. XRD spectra of (a) raw materials and (b) FAS poly-coagulants.
Inorganics 11 00210 g005
Figure 6. TG/DTG-DSC curves of (a) FAS5, (b) FAS13, (c) FAS7; and (d) comparison of TG curves.
Inorganics 11 00210 g006
Figure 7. The preparation procedure of FAS poly-coagulants and speculative mechanisms during coagulations.
Inorganics 11 00210 g007
Figure 8. Effects of dosage on removal efficiencies for water samples from (a,b) Yanghu wetland park, (c,d) Liuyang River, and (e,f) Laodao River with FAS13.
Inorganics 11 00210 g008
Table 1. ANOVA of fit statistics for output responses.
IndexR1R2R3R4
Std. Dev.0.01660.03962.812.77
Mean0.18280.464168.8367.49
C.V. %9.058.524.094.11
R20.95420.99670.99610.9982
Adjusted R20.89540.99250.99100.9959
Predicted R20.87510.95880.95360.9774
Adequate Precision12.976339.896833.320951.6408
Table 2. The major water quality parameters of real algae-laden water.
ParameterYanghu Wetland ParkLiuyang RiverLaodao River
pH7.897.717.54
T 1 (°C)23.527.325.9
Turbidity (NTU)313237428
TP (mg/L)0.7750.8751.145
DP 2 (mg/L)0.0250.0350.020
Chl-α (mg/L)1.2540.9531.260
OD680 (Abs)0.2770.2940.393
Fe (mg/L)1.4551.4801.690
Al (mg/L)0.1900.1400.140
1 Water temperature. 2 Dissolved phosphorus.
Table 3. The range of input variables for BBD.
Input VariablesSymbolLow Level (−1)Medium Level (0)High Level (+1)
n(Fe):n(Al)A123
m(Si):m(Fe+Al)B0.250.50.75
n(CO32−):n(Fe+Al)C11.752.5
Disclaimer/Publisher’s Note: The statements, opinions and data contained in all publications are solely those of the individual author(s) and contributor(s) and not of MDPI and/or the editor(s). MDPI and/or the editor(s) disclaim responsibility for any injury to people or property resulting from any ideas, methods, instructions or products referred to in the content.

