
Oxygen-Ion and Proton Transport of Origin and Ca-Doped La2ZnNdO5.5 Materials
 , , and
Abstract
:
1. Introduction
2. Results and Discussion
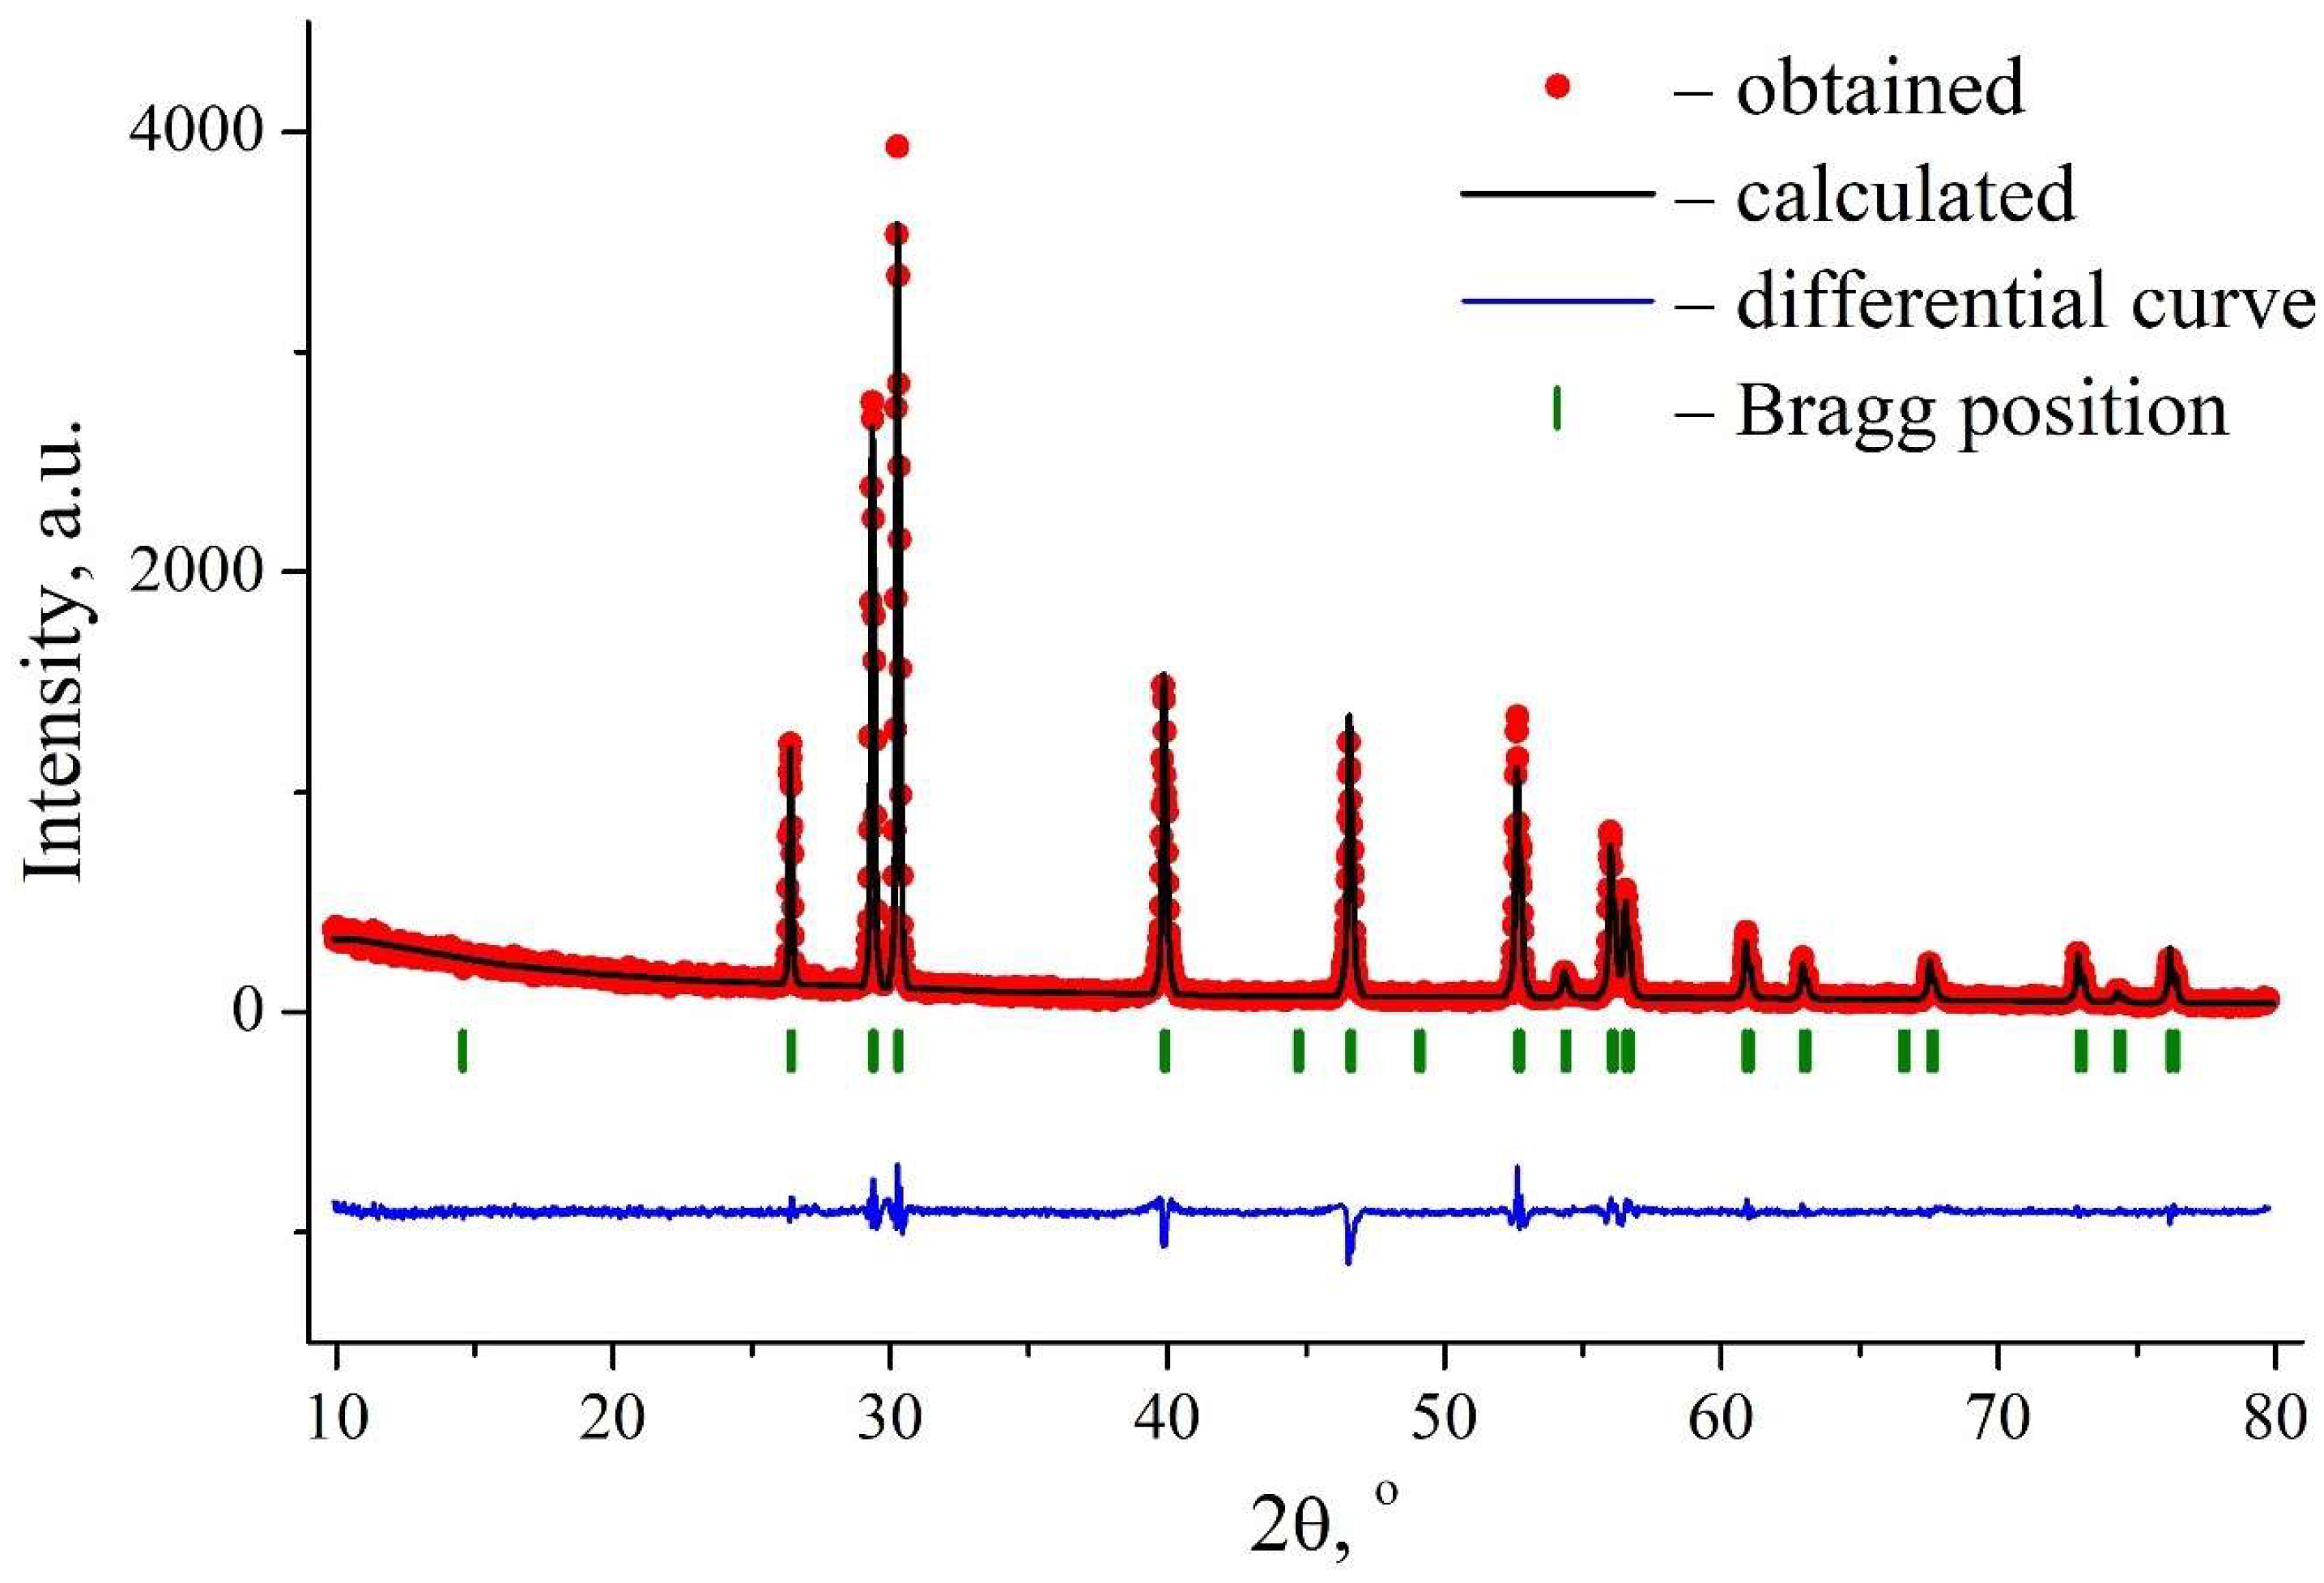
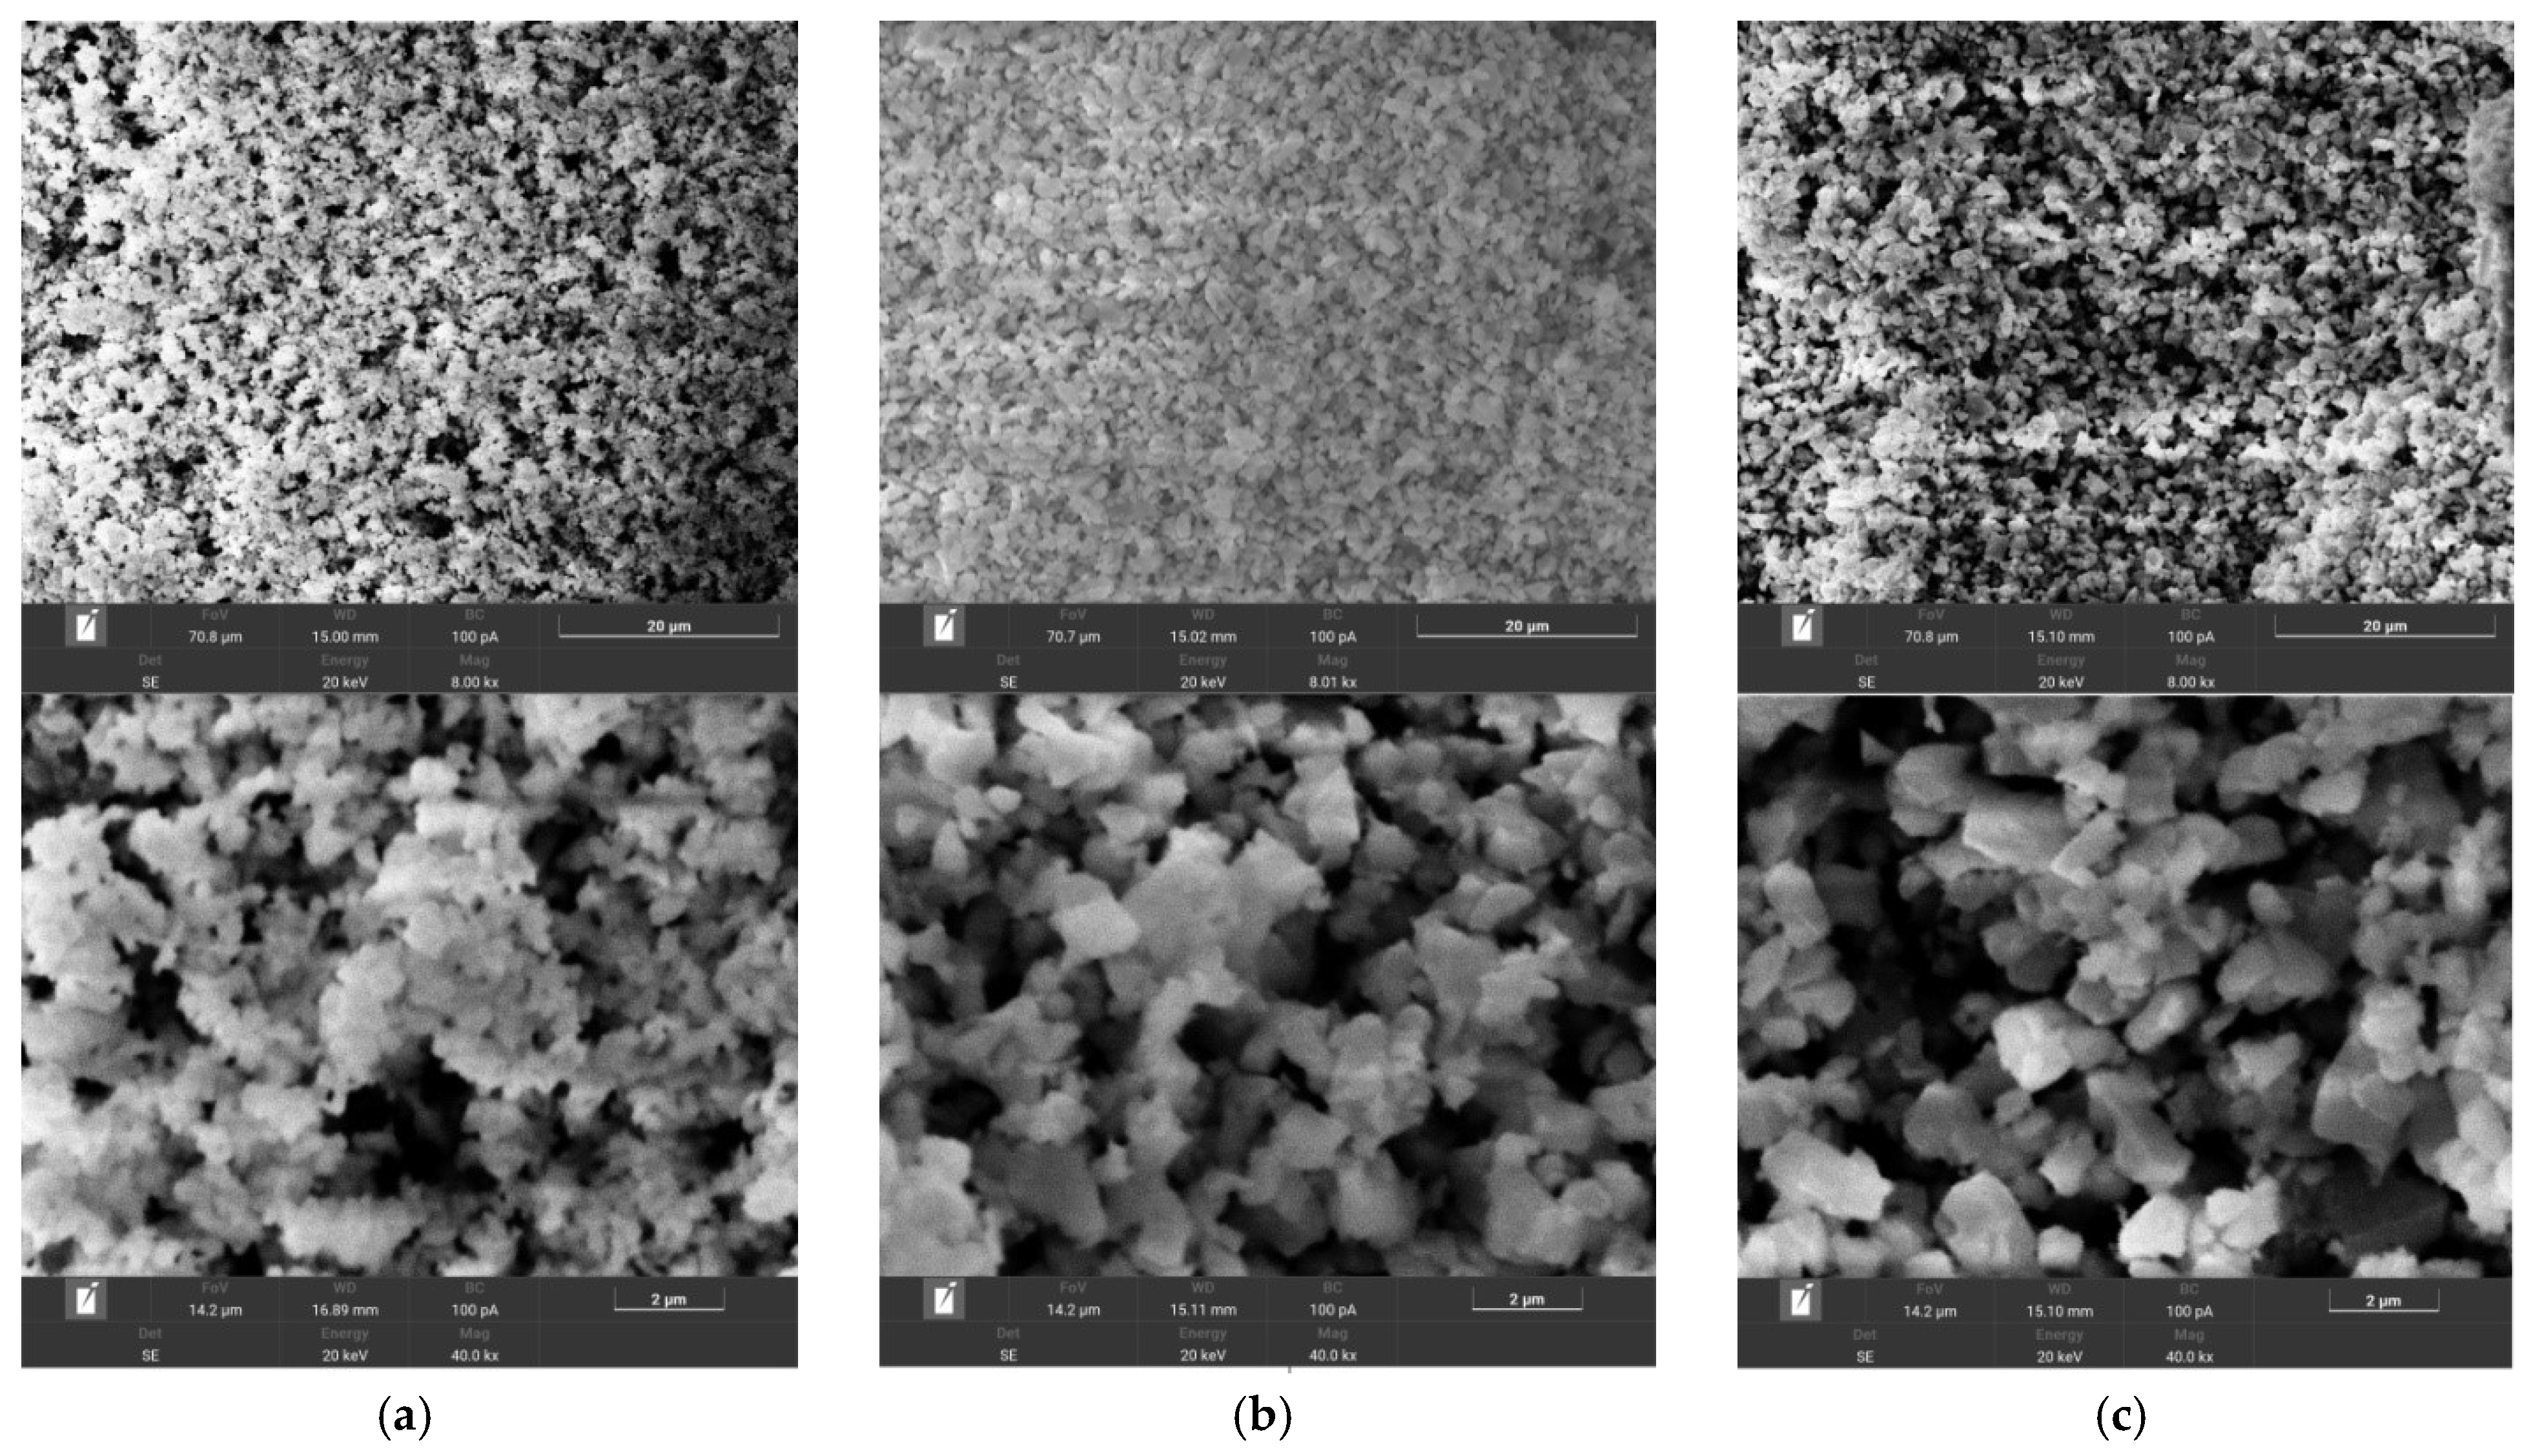
2.1. Structure Characterization
2.2. Hydration Properties
2.3. Conductivity Properties
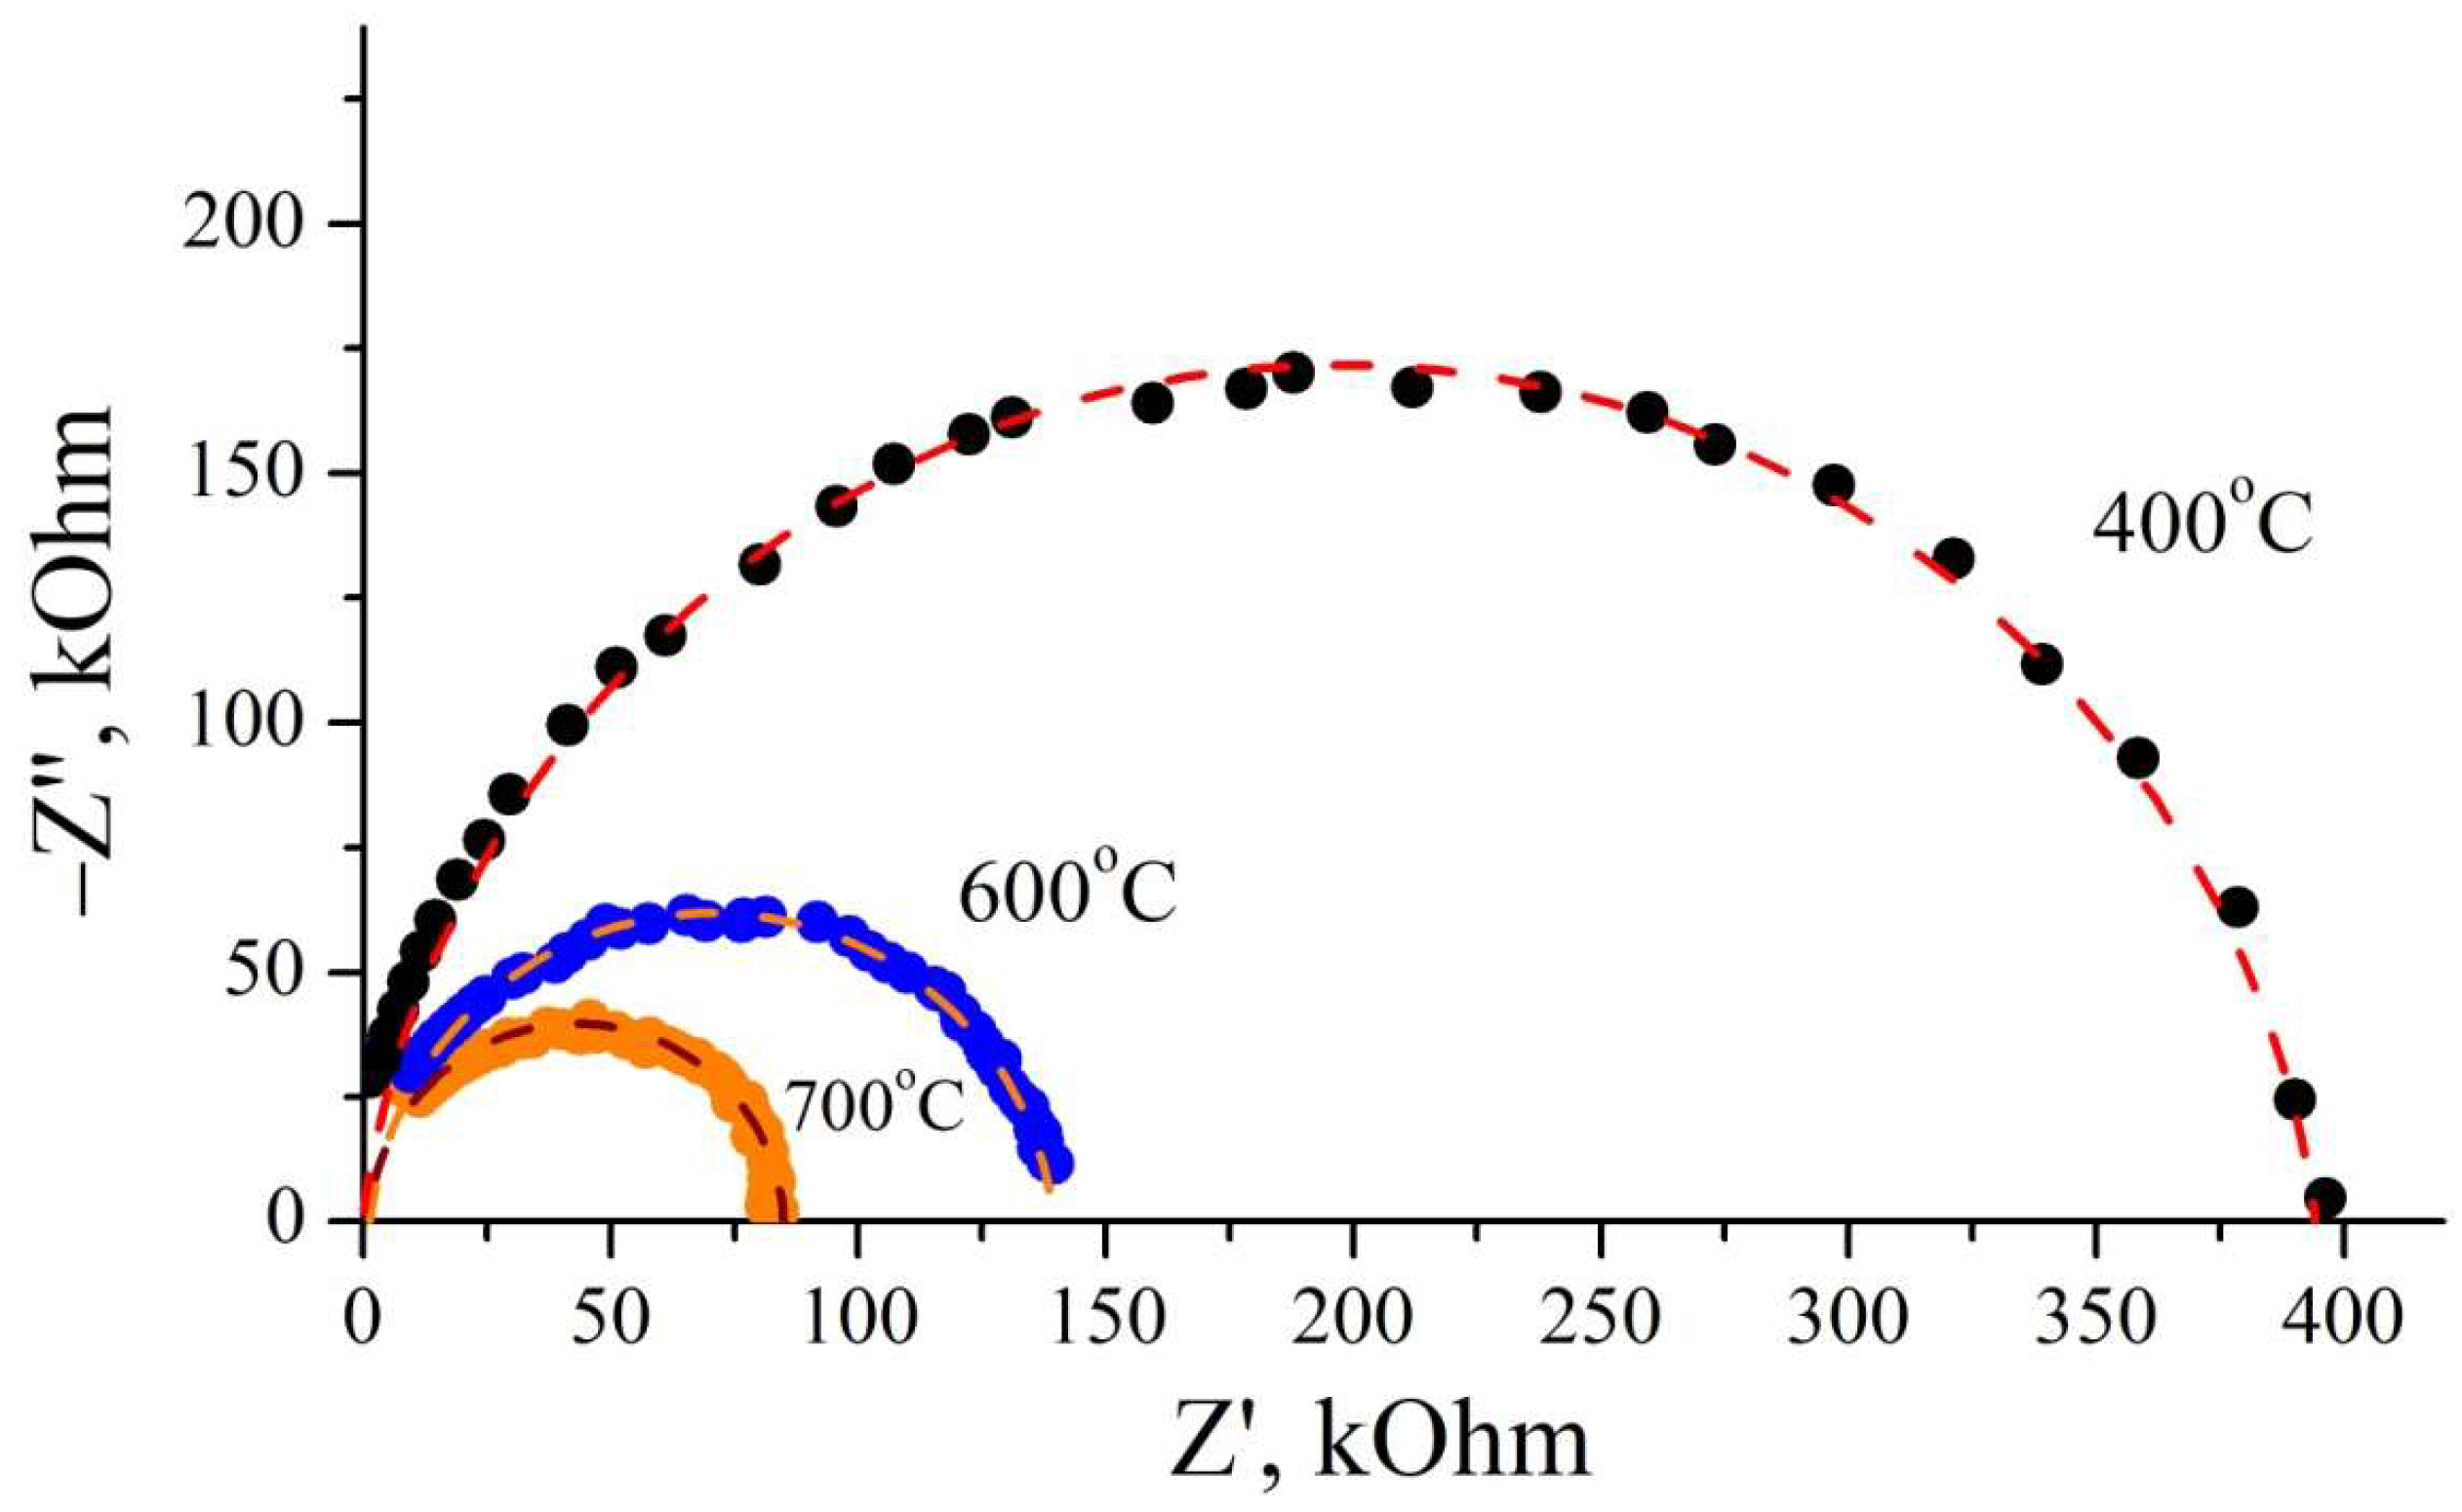
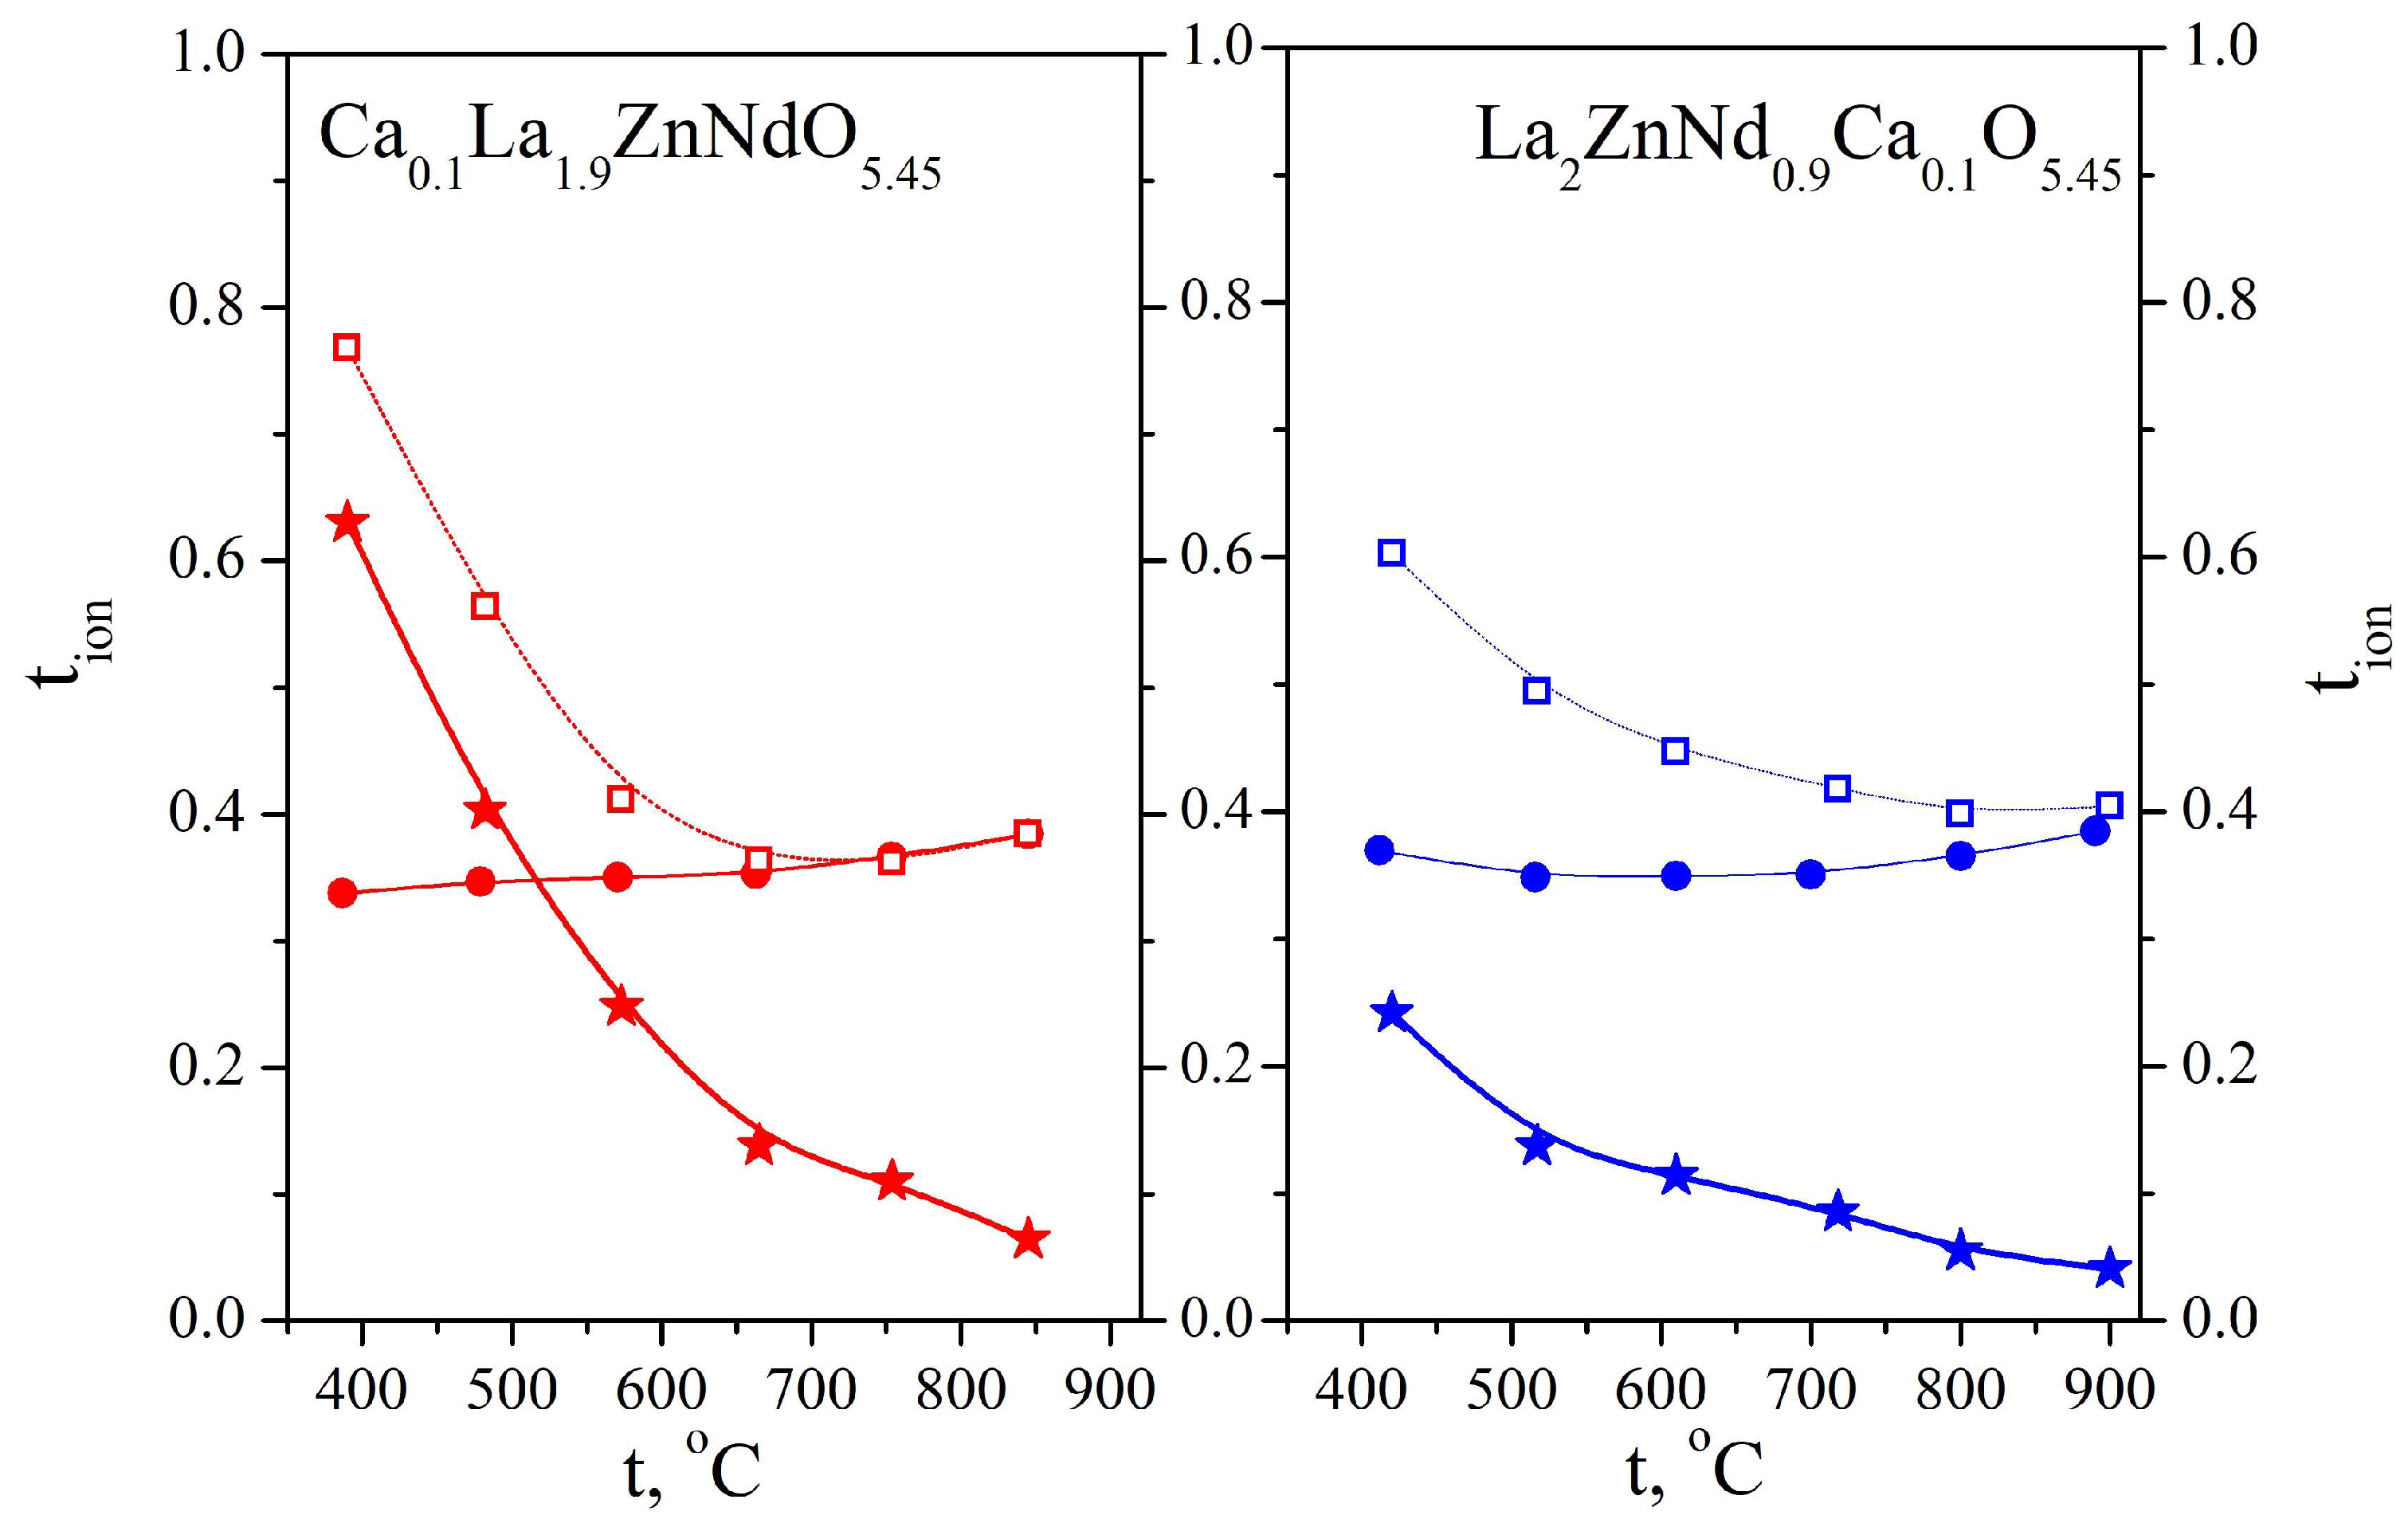
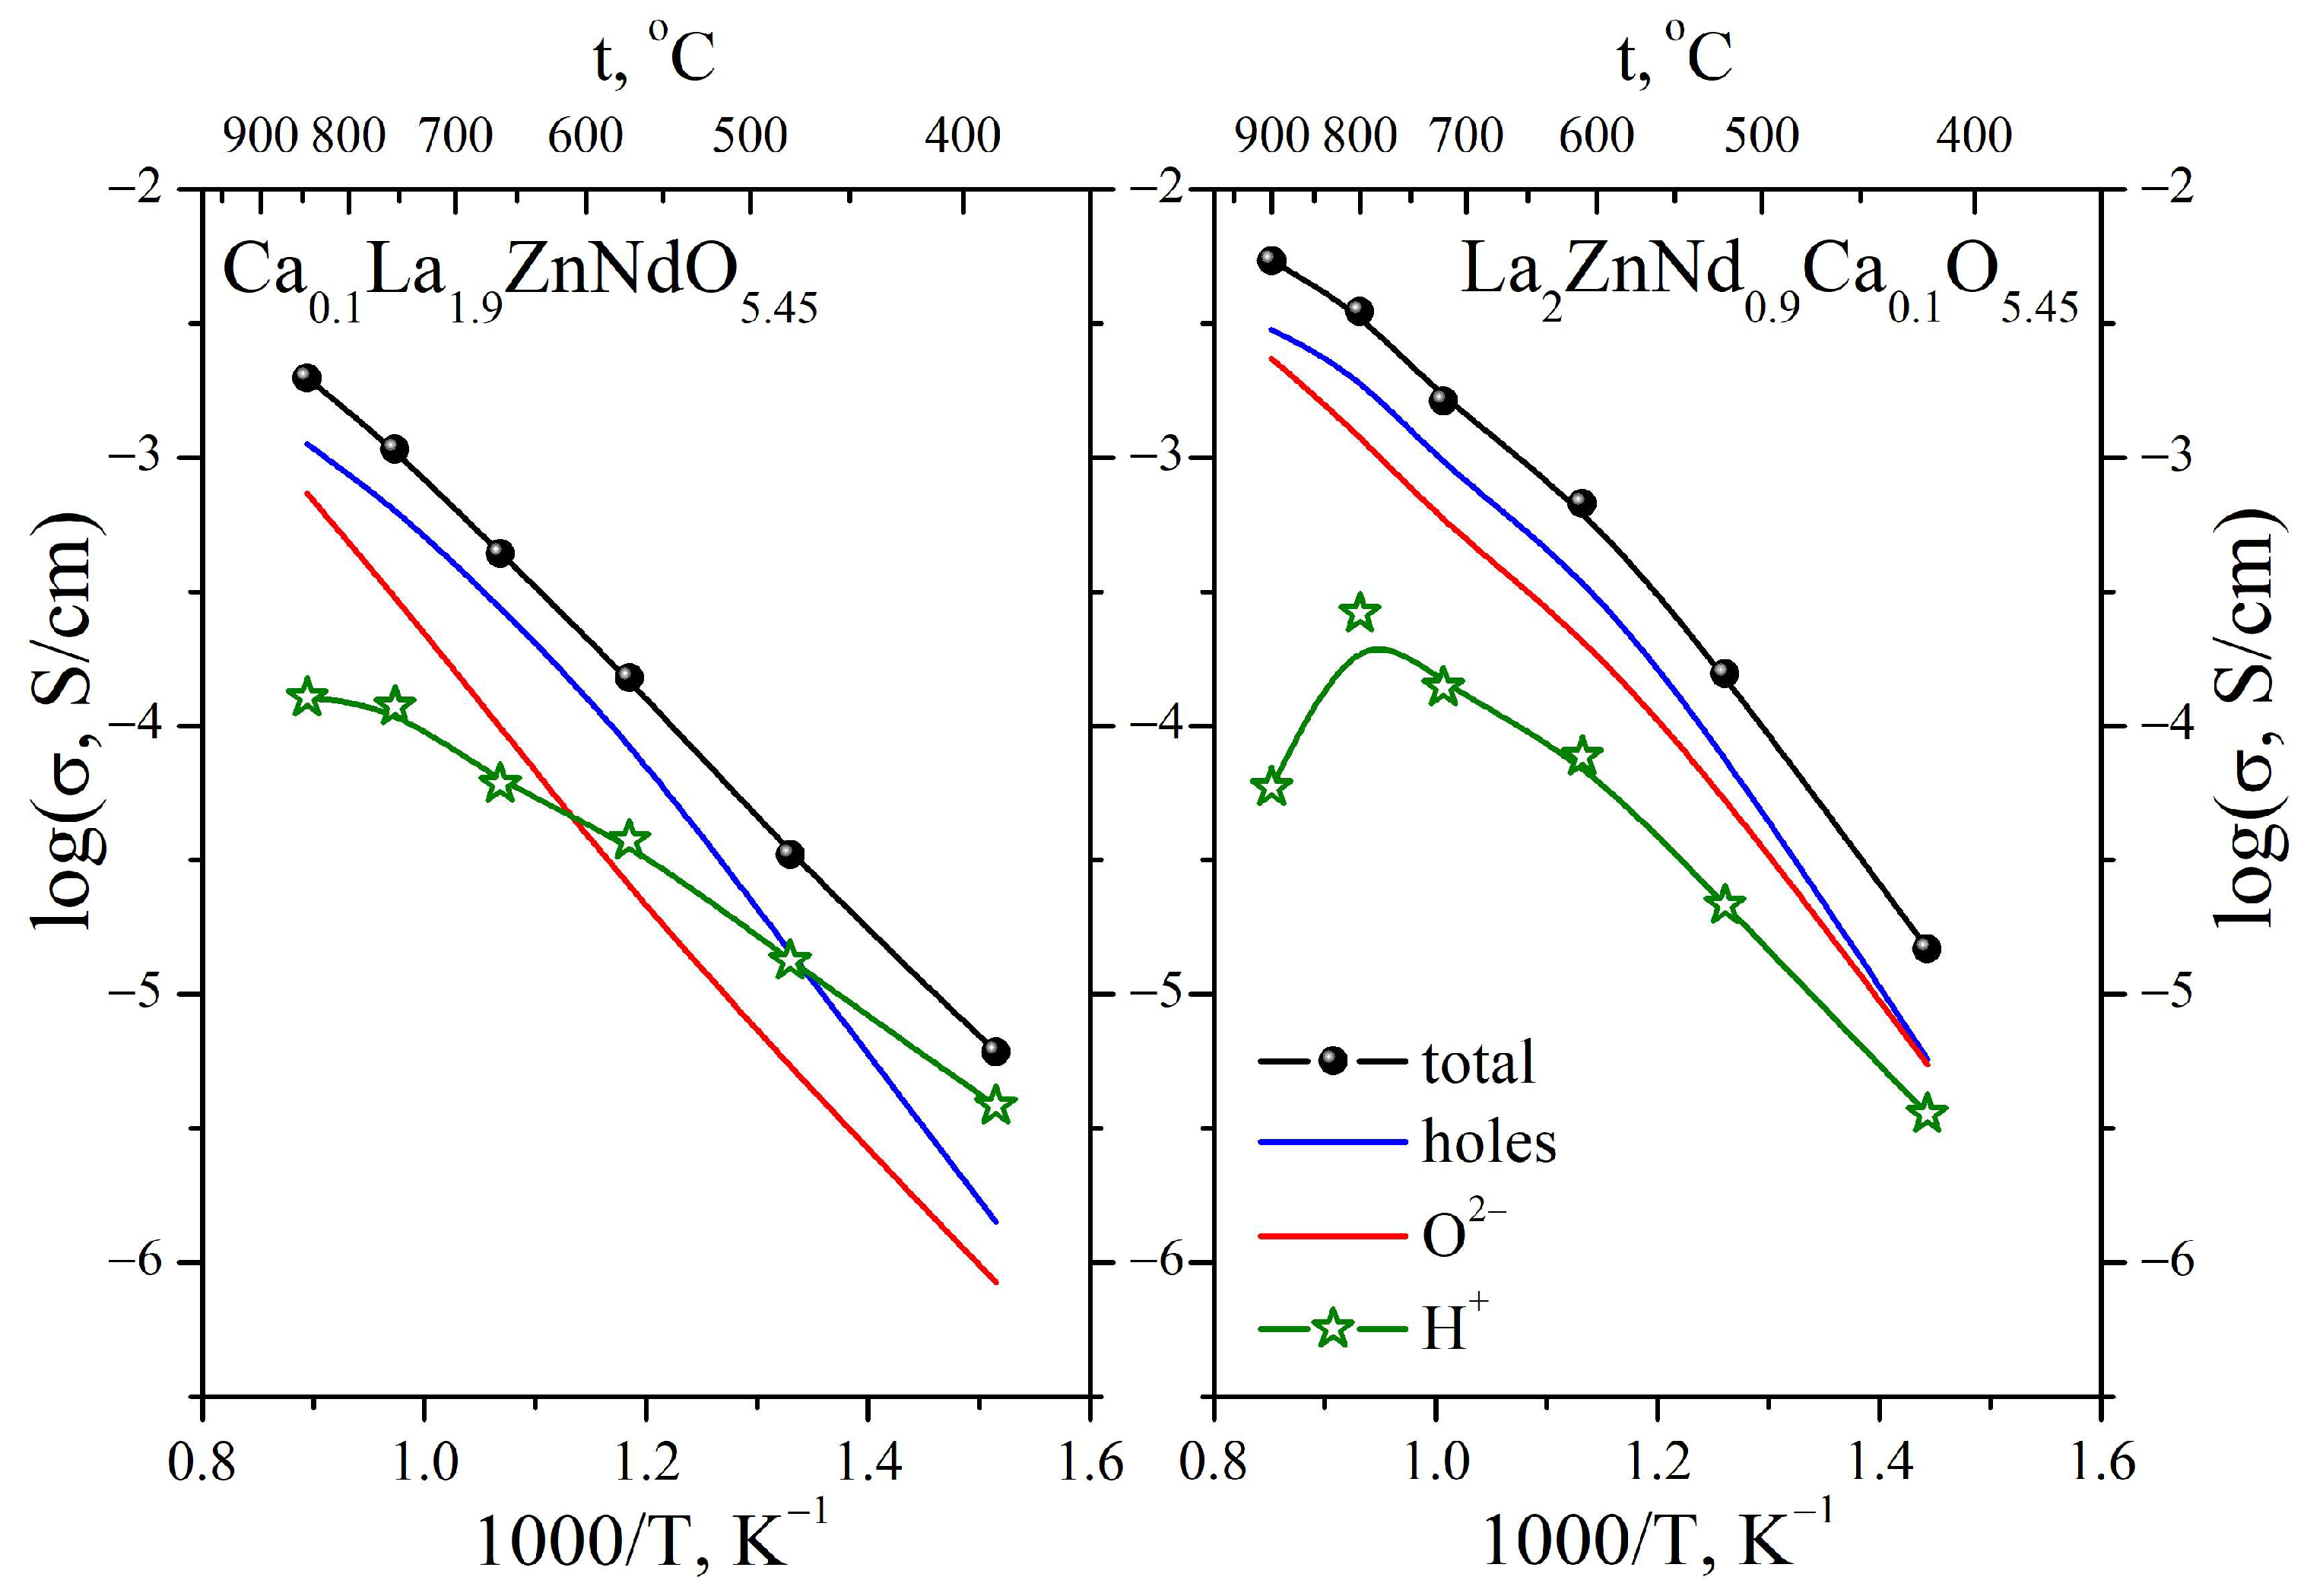
2.3.1. Conductivity Measurements as a Function of Temperature
2.3.2. Conductivity Measurements as a Function of Oxygen Partial Pressure
3. Materials and Methods
3.1. Synthesis of Perovskite La2NdZnO5.5 and Doped Samples
3.2. X-ray Diffraction
3.3. Thermogravimetric Analysis
3.4. Conductivity Measurements
4. Conclusions
Author Contributions
Funding
Data Availability Statement
Conflicts of Interest
References
- Kim, D.; Bae, K.T.; Kim, K.J.; Im, H.-N.; Jang, S.; Oh, S.; Lee, S.W.; Shin, T.H.; Lee, K.T. High-performance protonic ceramic electrochemical cells. ACS Energy Lett. 2022, 7, 2393–2400. [Google Scholar] [CrossRef]
- Liu, F.; Ding, D.; Duan, C. Protonic ceramic electrochemical cells for synthesizing sustainable chemicals and fuels. Adv. Sci. 2023, 2023, 2206478. [Google Scholar] [CrossRef]
- Tian, H.; Luo, Z.; Song, Y.; Zhou, Y.; Gong, M.; Li, W.; Shao, Z.; Liu, M.; Liu, X. Protonic ceramic materials for clean and sustainable energy: Advantages and challenges. Int. Mater. Rev. 2022, 2022, 1–29. [Google Scholar] [CrossRef]
- Corigliano, O.; Pagnotta, L.; Fragiacomo, P. On the technology of solid oxide fuel cell (SOFC) energy systems for stationary power generation: A review. Sustainability 2022, 14, 15276. [Google Scholar] [CrossRef]
- Zvonareva, I.; Fu, X.-Z.; Medvedev, D.; Shao, Z. Electrochemistry and energy conversion features of protonic ceramic cells with mixed ionic-electronic electrolytes. Energy Environ. Sci. 2022, 15, 439–465. [Google Scholar] [CrossRef]
- Zhang, W.; Hu, Y.H. Progress in proton-conducting oxides as electrolytes for low-temperature solid oxide fuel cells: From materials to devices. Energy Sci. Eng. 2021, 9, 984–1011. [Google Scholar] [CrossRef]
- Guo, R.; He, T. High-entropy perovskite electrolyte for protonic ceramic fuel cells operating below 600 °C. ACS Mater. Lett. 2022, 4, 1646–1652. [Google Scholar] [CrossRef]
- Wang, C.; Li, Z.; Zhao, S.; Xia, L.; Zhu, M.; Han, M.; Ni, M. Modelling of an integrated protonic ceramic electrolyzer cell (PCEC) for methanol synthesis. J. Power Sources 2023, 559, 232667. [Google Scholar] [CrossRef]
- Ji, H.I.; Lee, J.H.; Son, J.W.; Yoon, K.J.; Yang, S.; Kim, B.K. Protonic ceramic electrolysis cells for fuel production: A brief review. J. Korean Ceram. Soc. 2020, 57, 480–494. [Google Scholar] [CrossRef]
- Tarasova, N. Layered perovskites BaLnnInnO3n+1 (n = 1, 2) for electrochemical applications: A mini review. Membranes 2023, 13, 34. [Google Scholar] [CrossRef]
- Arsad, A.Z.; Hannan, M.A.; Al-Shetwi, A.Q.; Mansur, M.; Muttaqi, K.M.; Dong, Z.Y.; Blaabjerg, F. Hydrogen energy storage integrated hybrid renewable energy systems: A review analysis for future research directions. Int. J. Hydrogen Energy 2022, 47, 17285–17312. [Google Scholar] [CrossRef]
- Kumar, S.S.; Lim, H. An overview of water electrolysis technologies for green hydrogen production. Energy Rep. 2022, 8, 13793–13813. [Google Scholar] [CrossRef]
- Huang, L.; Huang, X.; Yan, J.; Liu, Y.; Jiang, H.; Zhang, H.; Tang, J.; Liu, Q. Research progresses on the application of perovskite in adsorption and photocatalytic removal of water pollutants. J. Hazard. Mater. 2023, 442, 130024. [Google Scholar] [CrossRef]
- Scovell, M.D. Explaining hydrogen energy technology acceptance: A critical review. Int. J. Hydrogen Energy 2022, 47, 10441–10459. [Google Scholar] [CrossRef]
- Buonomano, A.; Barone, G.; Forzano, C. Advanced energy technologies, methods, and policies to support the sustainable development of energy, water and environment systems. Energy Rep. 2022, 8, 4844–4853. [Google Scholar] [CrossRef]
- Syafkeena, M.A.N.; Zainor, M.L.; Hassan, O.H.; Baharuddin, N.A.; Othman, M.H.D.; Tseng, C.-J.; Osman, N. Review on the preparation of electrolyte thin films based on cerate-zirconate oxides for electrochemical analysis of anode-supported proton ceramic fuel cells. J. Alloys Compd. 2022, 918, 165434. [Google Scholar] [CrossRef]
- Rasaki, S.A.; Liu, C.; Lao, C. A review of current performance of rare earth metal-doped barium zirconate perovskite: The promising electrode and electrolyte material for the protonic ceramic fuel cells. Prog. Solid State Chem. 2021, 63, 100325. [Google Scholar] [CrossRef]
- Qiao, Z.; Li, S.; Li, Y.; Xu, N.; Xiang, K. Structure, mechanical properties, and thermal conductivity of BaZrO3 doped at the A-B site. Ceram. Int. 2022, 48, 12529–12536. [Google Scholar] [CrossRef]
- Guo, R.; Li, D.; Guan, R.; Kong, D.; Cui, Z.; Zhou, Z.; He, T. Sn–Dy–Cu triply doped BaZr0.1Ce0.7Y0.2O3−δ: A chemically stable and highly proton-conductive electrolyte for low-temperature solid oxide fuel cells. ACS Sustain. Chem. Eng. 2022, 10, 5352–5362. [Google Scholar] [CrossRef]
- Nayak, A.K.; Sasmal, A. Recent advance on fundamental properties and synthesis of barium zirconate for proton conducting ceramic fuel cell. J. Clean. Prod. 2023, 386, 135827. [Google Scholar] [CrossRef]
- Norby, T.; Dyrlie, O.; Kofstad, P. Protonic conduction in acceptor-doped cubic rare-earth sesquioxides. J. Am. Ceram. Soc. 1992, 75, 1176–1181. [Google Scholar] [CrossRef]
- Larring, Y.; Norby, T. Protons in rare-earth oxides. Solid State Ion. 1995, 77, 147–151. [Google Scholar] [CrossRef]
- Larring, Y.; Norby, T. The equilibrium between water vapor, protons, and oxygen vacancies in rare earth oxides. Solid State Ion. 1997, 97, 523–528. [Google Scholar] [CrossRef]
- Haugsrud, R.; Larring, Y.; Norby, T. Proton conductivity of Ca-doped Tb2O3. Solid State Ion. 2005, 176, 2957–2961. [Google Scholar] [CrossRef]
- Norby, T.; Wideroe, M.; Glockner, R.; Larring, Y. Hydrogen in oxides. Dalton Trans. 2004, 19, 3015. [Google Scholar] [CrossRef]
- Norby, T.; Oddvar, D.; Kofstad, P. Protons in Ca-doped La2O3, Nd2O3 and LaNdO3. Solid State Ion. 1992, 53–56, 446–452. [Google Scholar] [CrossRef]
- Kuzmin, A.V.; Lesnichyova, A.S.; Tropin, E.S.; Stroeva, A.Y.; Vorotnikov, V.A.; Solodyankina, D.M.; Belyakov, S.A.; Plekhanov, M.S.; Farlenkov, A.S.; Osinkin, D.A.; et al. LaScO3-based electrolyte for protonic ceramic fuel cells: Influence of sintering additives on the transport properties and electrochemical performance. J. Power Sources 2020, 466, 228255. [Google Scholar] [CrossRef]
- Chatzichristodoulou, C.; Norby, P.; Hendriksen, P.V.; Mogensen, M.B. Size of oxide vacancies in fluorite and perovskite structured oxides. J. Electroceram. 2015, 34, 100–107. [Google Scholar] [CrossRef]
- Shannon, R.D. Revised effective ionic radii and systematic studies of interatomic distances in halides and chalcogenides. Acta Crystallogr. Sect. A Found. Crystallogr. 1976, 32, 751–767. [Google Scholar] [CrossRef]
- Sammells, A.F.; Cook, R.L.; White, J.H.; Osborne, J.J.; MacDuff, R.C. Rational selection of advanced solid electrolytes for intermediate temperature fuel cells. Solid State Ion. 1992, 52, 111–123. [Google Scholar] [CrossRef]
- Richter, J.; Holtappels, P.; Graule, T.; Nakamura, T.; Gauckler, L.J. Materials design for perovskite SOFC cathodes. Monatsh. Chem. 2009, 140, 985–999. [Google Scholar] [CrossRef]
- Bakiz, B.; Guinneton, F.; Arab, M.; Benlhachemi, A.; Villain, S.; Satre, P.; Gavarri, J.-R. Carbonatation and decarbonatation kinetics in the La2O3-La2O2CO3 system under CO2 gas flows. Adv. Mater. Sci. Eng. 2010, 2010, 360597. [Google Scholar] [CrossRef]
- Rodríguez-Carvajal, J. Recent Developments of the Program FULLPROF In Commission on Powder Diffraction (IUCr). Newsletter 2001, 26, 12–19. Available online: http://journals.iucr.org/iucr-top/comm/cpd/Newsletters/ (accessed on 10 March 2023).
- Johnson, D. ZView: A Software Program for IES Analysis, Version 2.8; Scribner Associates: South Pines, NC, USA, 2002; p. 200. [Google Scholar]
- Zirconia Project. Available online: https://zirconiaproject.wordpress.com/devices/zirconiam/ (accessed on 2 April 2023).


| Compositions | a (Å) | c (Å) | V (Å3) |
|---|---|---|---|
| La2ZnNdO5.5 | 3.906 (6) | 6.091 (8) | 80.51 (451) |
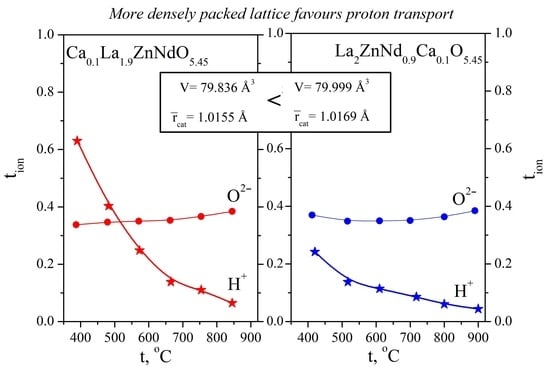
| La1.9Ca0.1ZnNdO5.45 | 3.895 (3) | 6.075 (6) | 79.83 (653) |
| La2ZnNd0.9Ca0.1O5.45 | 3.897 (4) | 6.081 (4) | 79.99 (893) |
| Element | Ca | La | Nd | Zn |
|---|---|---|---|---|
| Content, atomic % | 2.2 (2.5) | 48.1 (47.5) | 25.5 (25.0) | 24.2 (25.0) |
Disclaimer/Publisher’s Note: The statements, opinions and data contained in all publications are solely those of the individual author(s) and contributor(s) and not of MDPI and/or the editor(s). MDPI and/or the editor(s) disclaim responsibility for any injury to people or property resulting from any ideas, methods, instructions or products referred to in the content. |
© 2023 by the authors. Licensee MDPI, Basel, Switzerland. This article is an open access article distributed under the terms and conditions of the Creative Commons Attribution (CC BY) license (https://creativecommons.org/licenses/by/4.0/).
Share and Cite
Belova, K.; Egorova, A.; Pachina, S.; Animitsa, I.; Medvedev, D. Oxygen-Ion and Proton Transport of Origin and Ca-Doped La2ZnNdO5.5 Materials. Inorganics 2023, 11, 196. https://doi.org/10.3390/inorganics11050196
Belova K, Egorova A, Pachina S, Animitsa I, Medvedev D. Oxygen-Ion and Proton Transport of Origin and Ca-Doped La2ZnNdO5.5 Materials. Inorganics. 2023; 11(5):196. https://doi.org/10.3390/inorganics11050196
Chicago/Turabian StyleBelova, Ksenia, Anastasia Egorova, Svetlana Pachina, Irina Animitsa, and Dmitry Medvedev. 2023. "Oxygen-Ion and Proton Transport of Origin and Ca-Doped La2ZnNdO5.5 Materials" Inorganics 11, no. 5: 196. https://doi.org/10.3390/inorganics11050196