2.1. In Silico Evaluation: ADME Properties and Molecular Docking on Glutamate Receptors
The pharmacokinetic and physicochemical properties considered by the Lipinski Rule of Five, which were predicted with SwissADME for
BZQuin, its precursor quinolinate (Quin),
L-glutamate, and
D-aspartate, are presented in
Supplementary Table S1. It can be noted that the inhibition of the CYP2D6 or CYP3A4 cytochrome isoforms by
BZQuin or by any of the evaluated molecules was not likely. Therefore, they might not interfere with drug metabolism in the liver. Aside from this, none of the analyzed molecules violated the Lipinski Rule of Five. Despite this, they were very hydrophilic, as can be observed from their MLOGP, which were mostly less than zero except for
BZQuin.
This means that their passage through biological membranes could be compromised, especially for
L-glutamate,
D-aspartate, and to a lesser extent, Quin. It is also evident that, for
BZQuin, the incorporation of the boron atom with the two phenyl rings improved its lipophilicity and gastrointestinal (GI) absorption, which is a desirable feature for enteric administration. This can be clearly observed in
Supplementary Figure S1, which corresponds to the BOILED-Egg graph for the evaluated molecules. In this graph, the position of a molecule correlates its WLOGP and topological polar surface area (TPSA) while representing its ability to cross through biological membranes by passive diffusion. Additionally, it is shown that
BZQuin may not be a substrate of P-glycoprotein (P-gp), an ABC transporter widely expressed in the BBB, the latter acting as an efflux pump and preventing substances from entering the CNS [
28,
29].
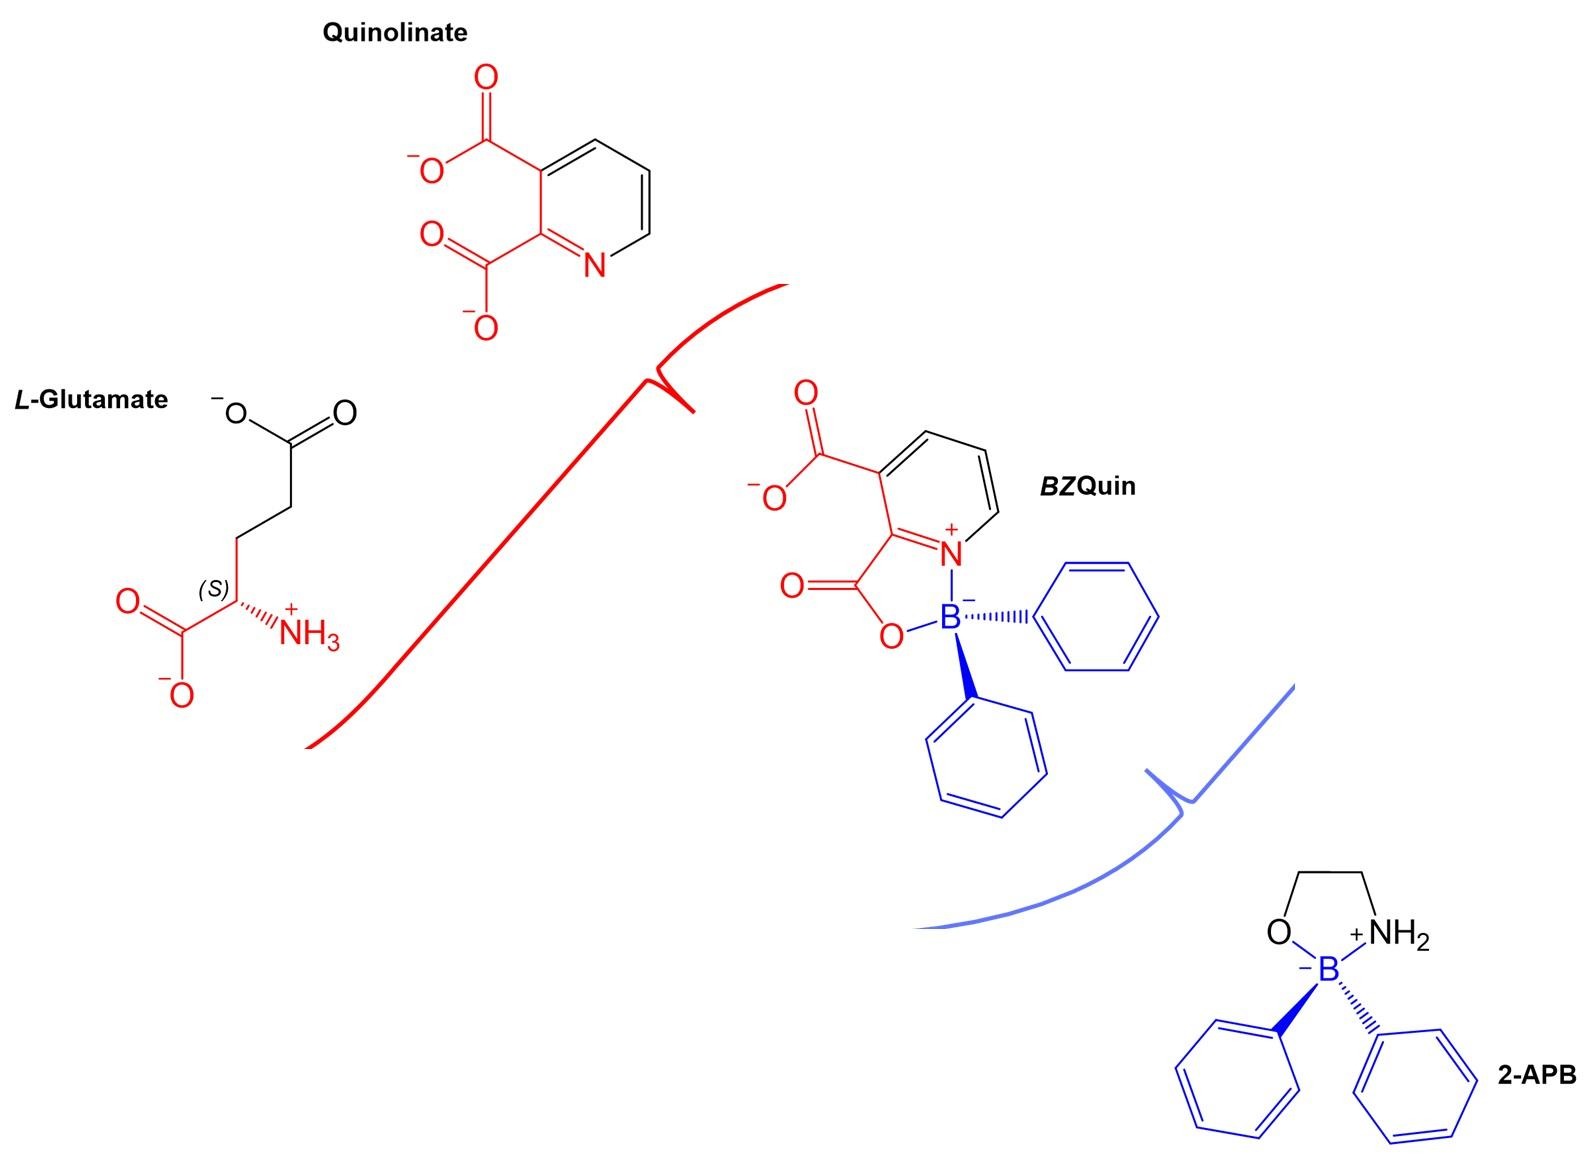
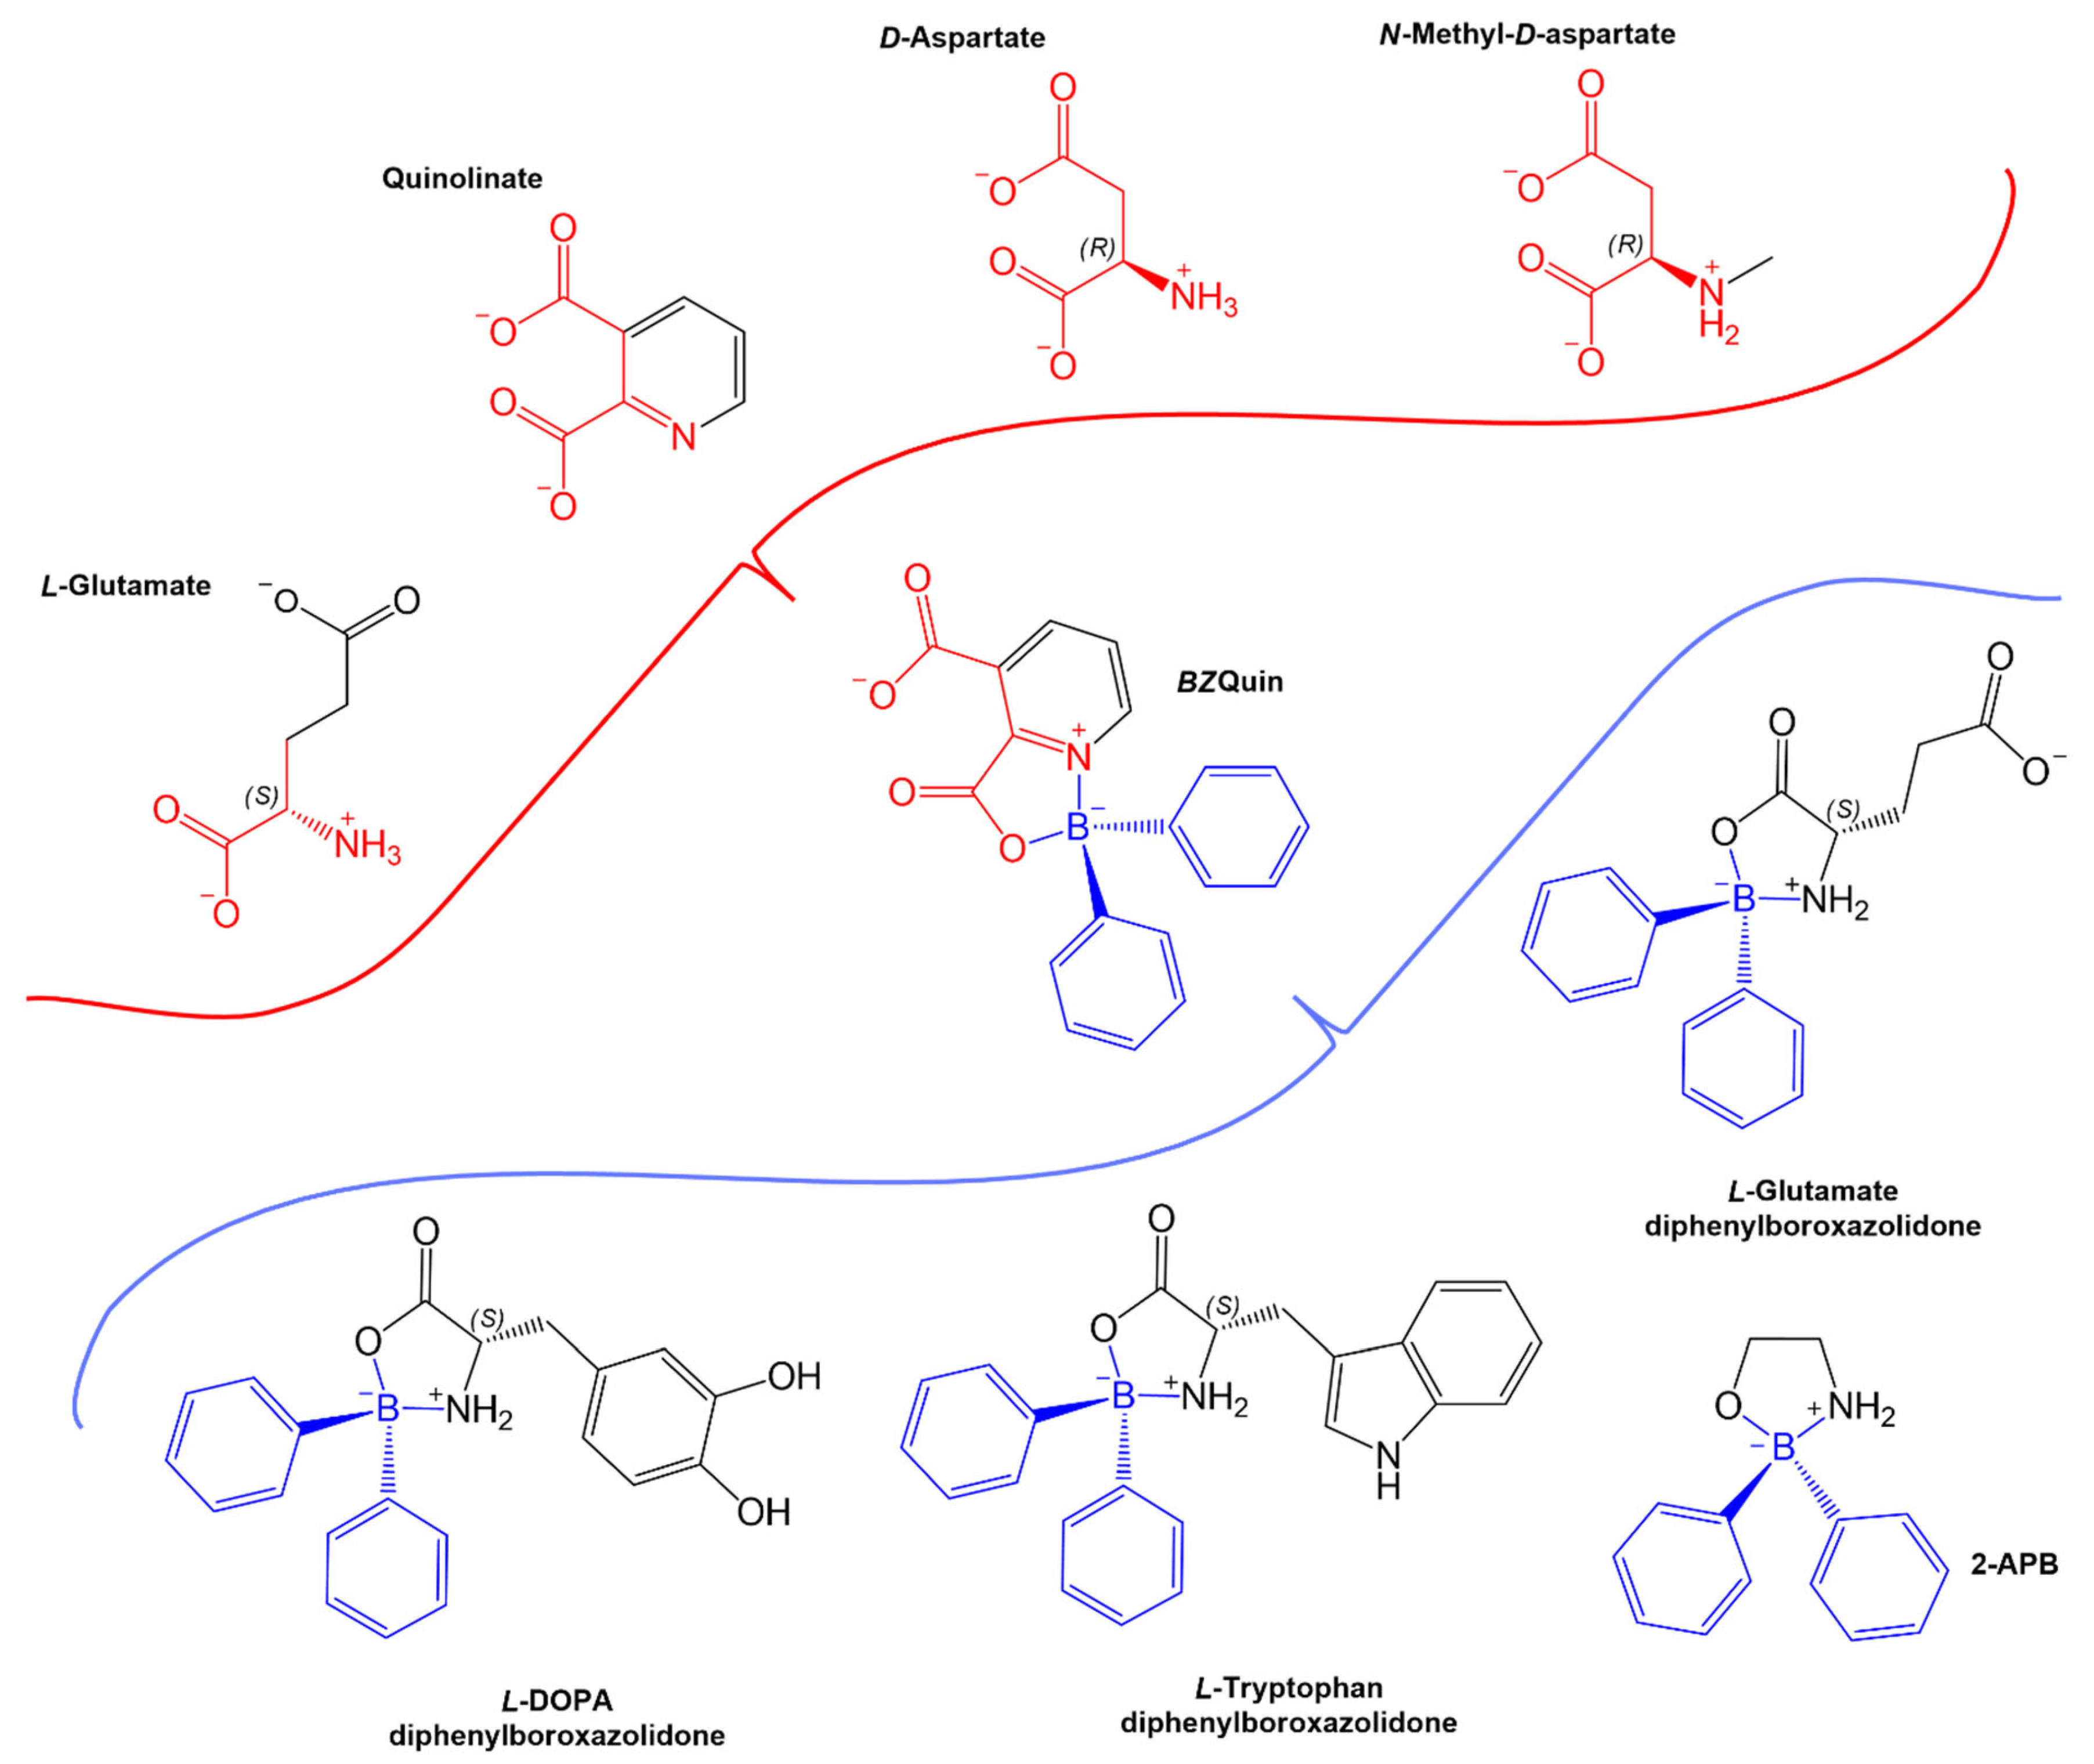
For a comprehensive in silico evaluation of the possible interactions between
BZQuin and glutamate receptors, six different metabotropic receptors, with two from each existing group, and two isoforms of the ionotropic NMDA receptor were evaluated as possible targets. The complete results obtained from each evaluated glutamate receptor and ligand are listed in
Supplementary Table S2. In these results, the endogenous ligands
L-glutamate and
D-aspartate bound to the
L-glutamate sites on all of the evaluated glutamate receptors, as expected. In contrast to this, Quin, which structurally resembled
D-aspartate, bound to the
L-glutamate site on the synaptic and extrasynaptic NMDA receptors, with more negative Gibbs binding energy (Δ
G) than
L-glutamate and
D-aspartate. This suggested higher affinity between Quin and the explored receptor. The results obtained for Quin are in accordance with its action as an agonist at the NMDA receptor, directly binding to its
L-glutamate site [
14]. Additionally, Quin bound to the metabotropic mGluR1, mGluR2, and mGluR3 receptors with higher affinities and higher probabilities than the two evaluated EAAs. When comparing the
BZQuin results against those of its precursor, it becomes clear that its affinity to the
L-glutamate sites on mGluR1, mGluR2, and mGluR7 was higher, but that it was completely lost at the same site on the synaptic and extrasynaptic NMDA receptors. In
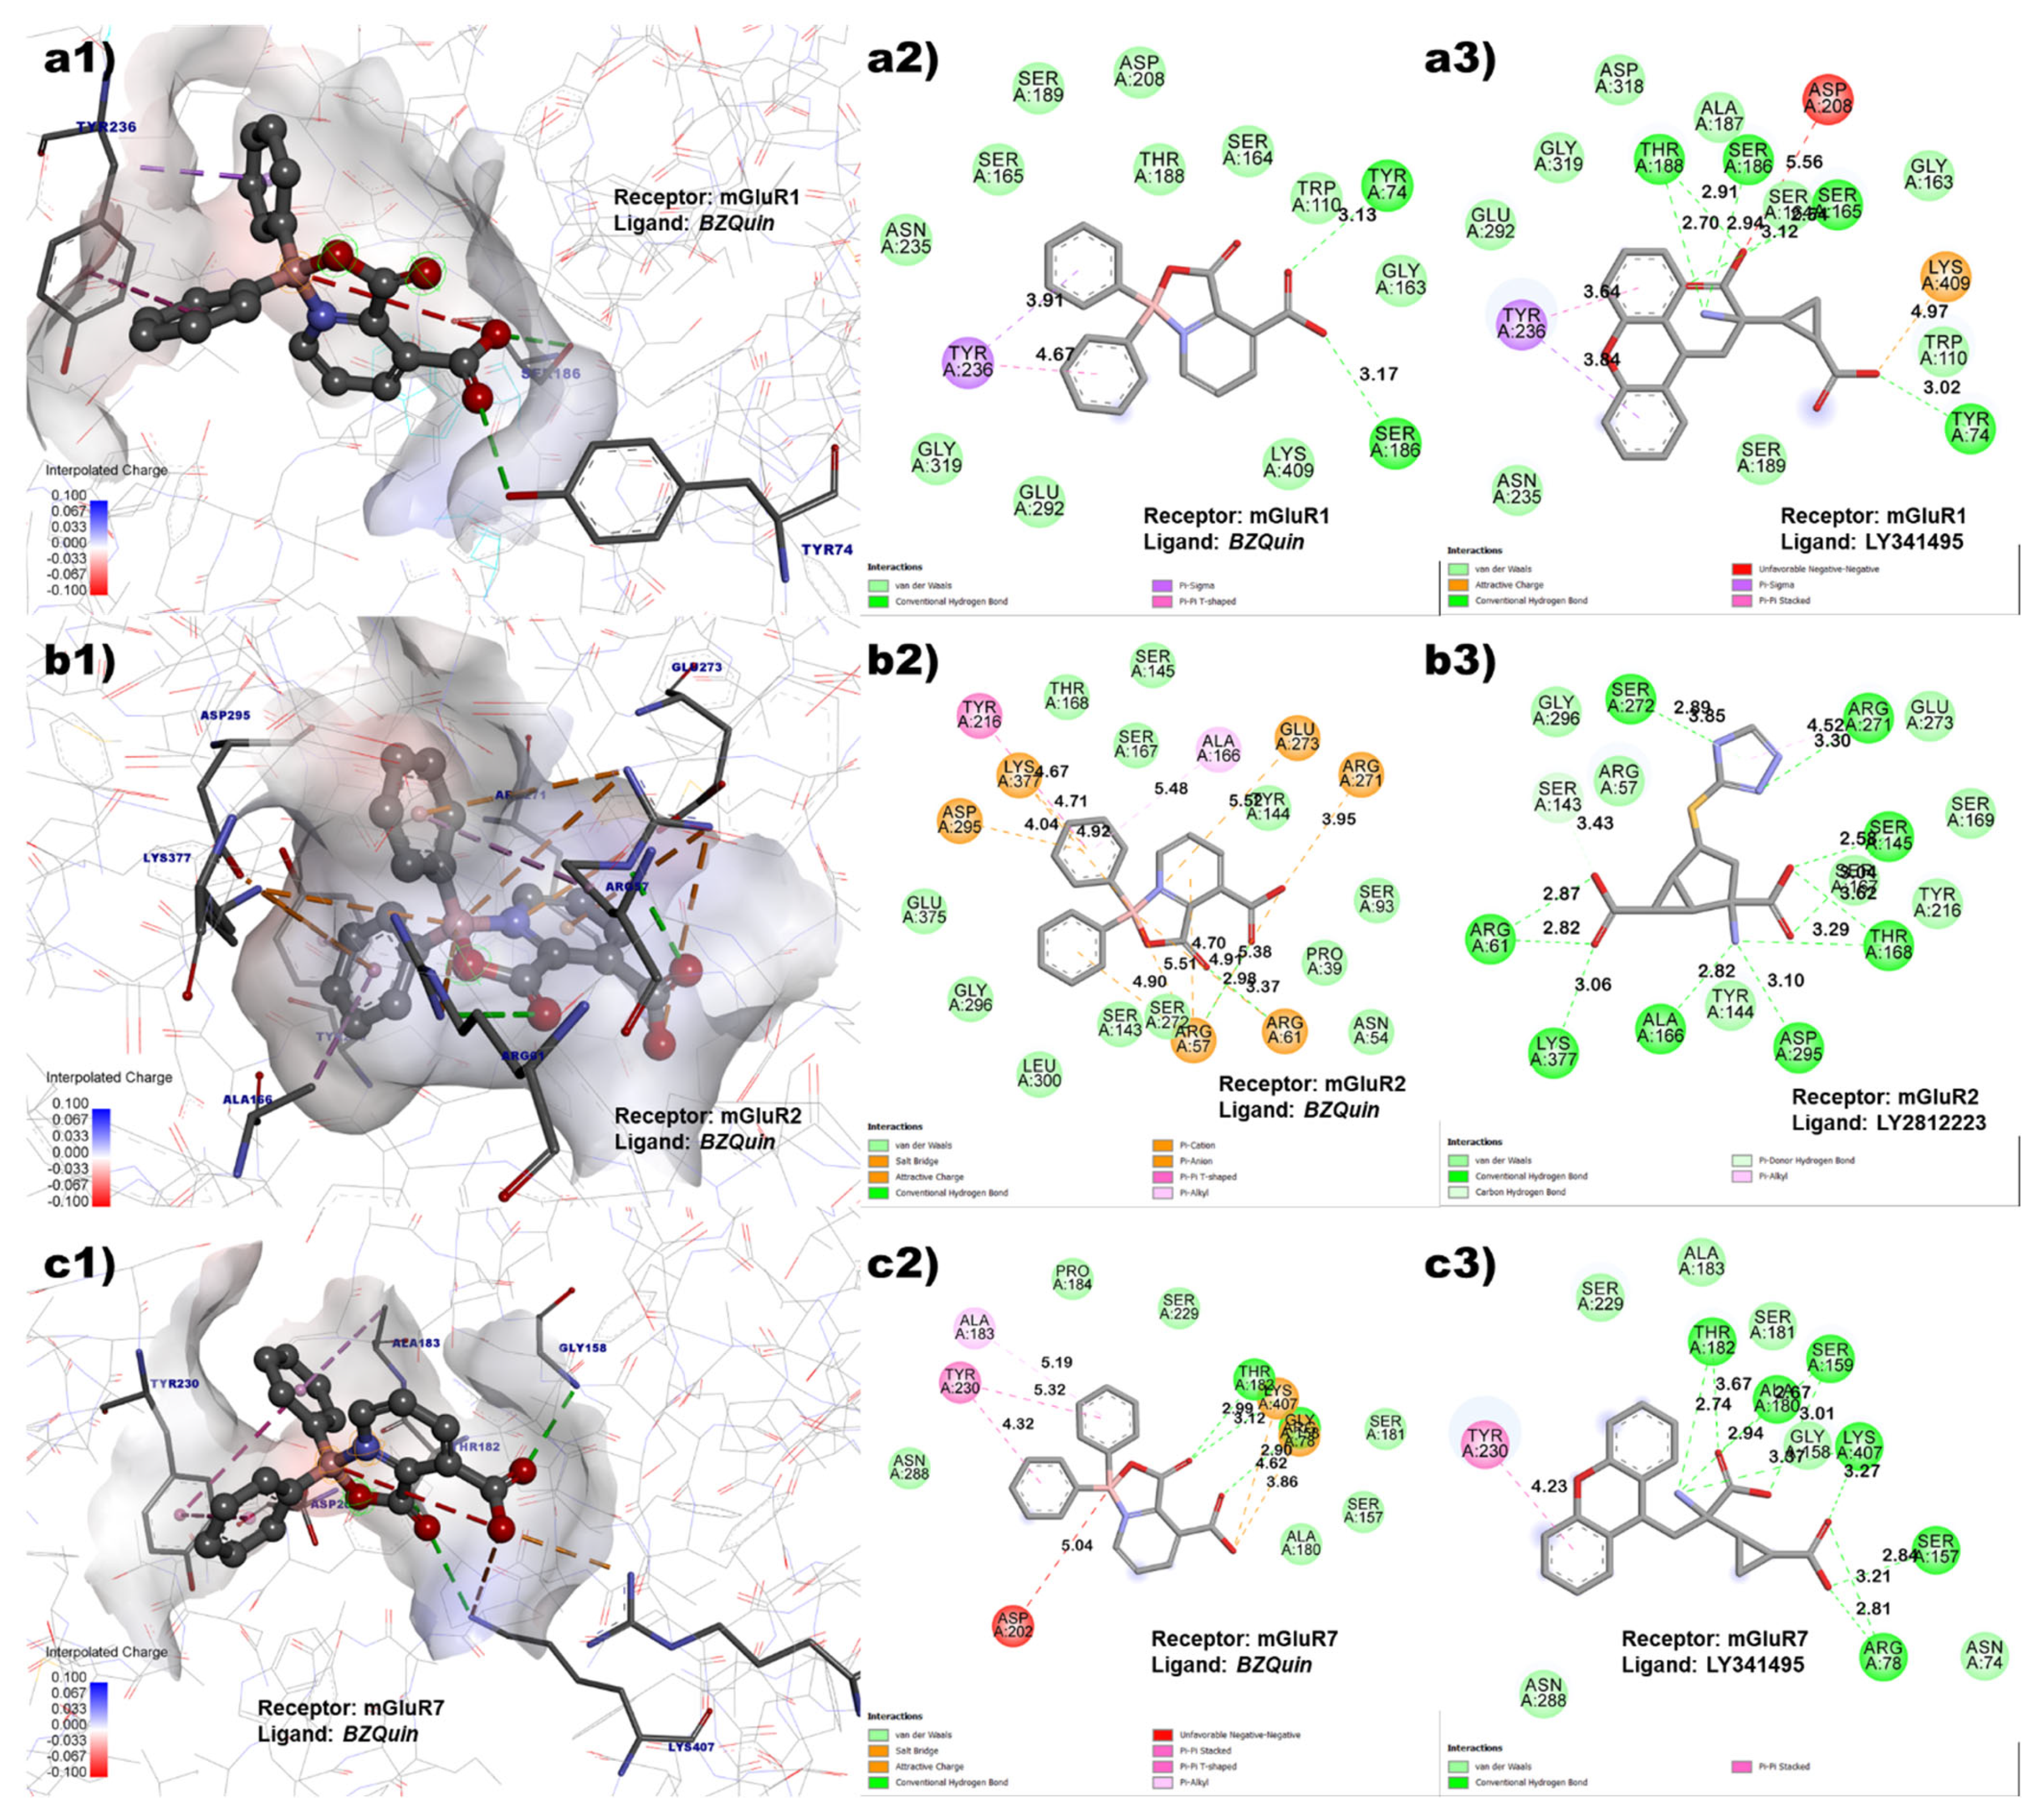
Figure 3, the binding affinities of the evaluated ligands to the
L-glutamate sites on mGluR1, mGluR2, and mGluR7 are plotted.
It should be noted that, although Quin had a higher affinity than the EAAs for mGluR1 and mGluR2, it did not possess affinity for mGluR7. However, the addition of the diphenylborinic moiety to the original structure appeared to be beneficial for affinity, and this was especially notable for mGluR2 and mGluR7. For the former, the ΔG changed from −6.8 kcal/mol to −10.49 kcal/mol after the structural modifications leading to BZQuin. For the latter, there was no affinity for Quin prior to the structural modifications.
For the mGluR1 receptor, improvement in Δ
G was also noticeable, but the remarkable feature is that the high binding probability (
p > 0.8) was preserved after the structural modification. This was unlike the cases of mGluR2 and mGluR7. In
Figure 4, the
BZQuin interactions with the amino acid residues of the
L-glutamate site on mGluR1, mGluR2, and mGluR7 are shown, along with the interactions of a cocrystallized ligand for comparative purposes. For the mGluR1 receptor, the interactions with the amino acid residues of TYR 236, SER 186, and TYR 74 were shared by the cocrystallized antagonist LY341495 and docked
BZQuin. Thus, this suggested a possible antagonist-like behavior from
BZQuin, which coincides with the structural resemblance between both the ligands.
However, the in vivo evaluation discussed later suggest the opposite. This is because the antagonism of the mGluR1 receptor contributed to neuron hyperpolarization and the absence of seizures. For the mGluR2 receptor, the interactions with amino acid residues that the cocrystallized agonist LY2812223 and docked BZQuin had in common were ARG 61, LYS 377, ASP 295, ALA 166, and ARG 271.
The number of interactions that both ligands had in common suggests that
BZQuin could be an agonist for the mGluR2 receptor. This may not be in accordance with the in vivo results. This is due to the activation of the mGluR2 receptor that could contribute to the slow repolarization of the neuron and, hence, to the absence of seizures. Finally, for the mGluR7 receptor, the interactions with amino acid residues that the cocrystallized antagonist LY341495 and docked
BZQuin had in common included TYR 230, THR 182, LYS 407, GLY 158, and ARG 78. The number of interactions that both ligands had in common suggests that
BZQuin could be an antagonist for the mGluR7 receptor. This result is in agreement with the in vivo results because the antagonism of the mGluR7 receptor could result in the inability to block voltage-gated Ca
2+ channels. This could promote
L-glutamate exocytosis and contribute to the occurrence of low-intensity seizures [
30,
31].
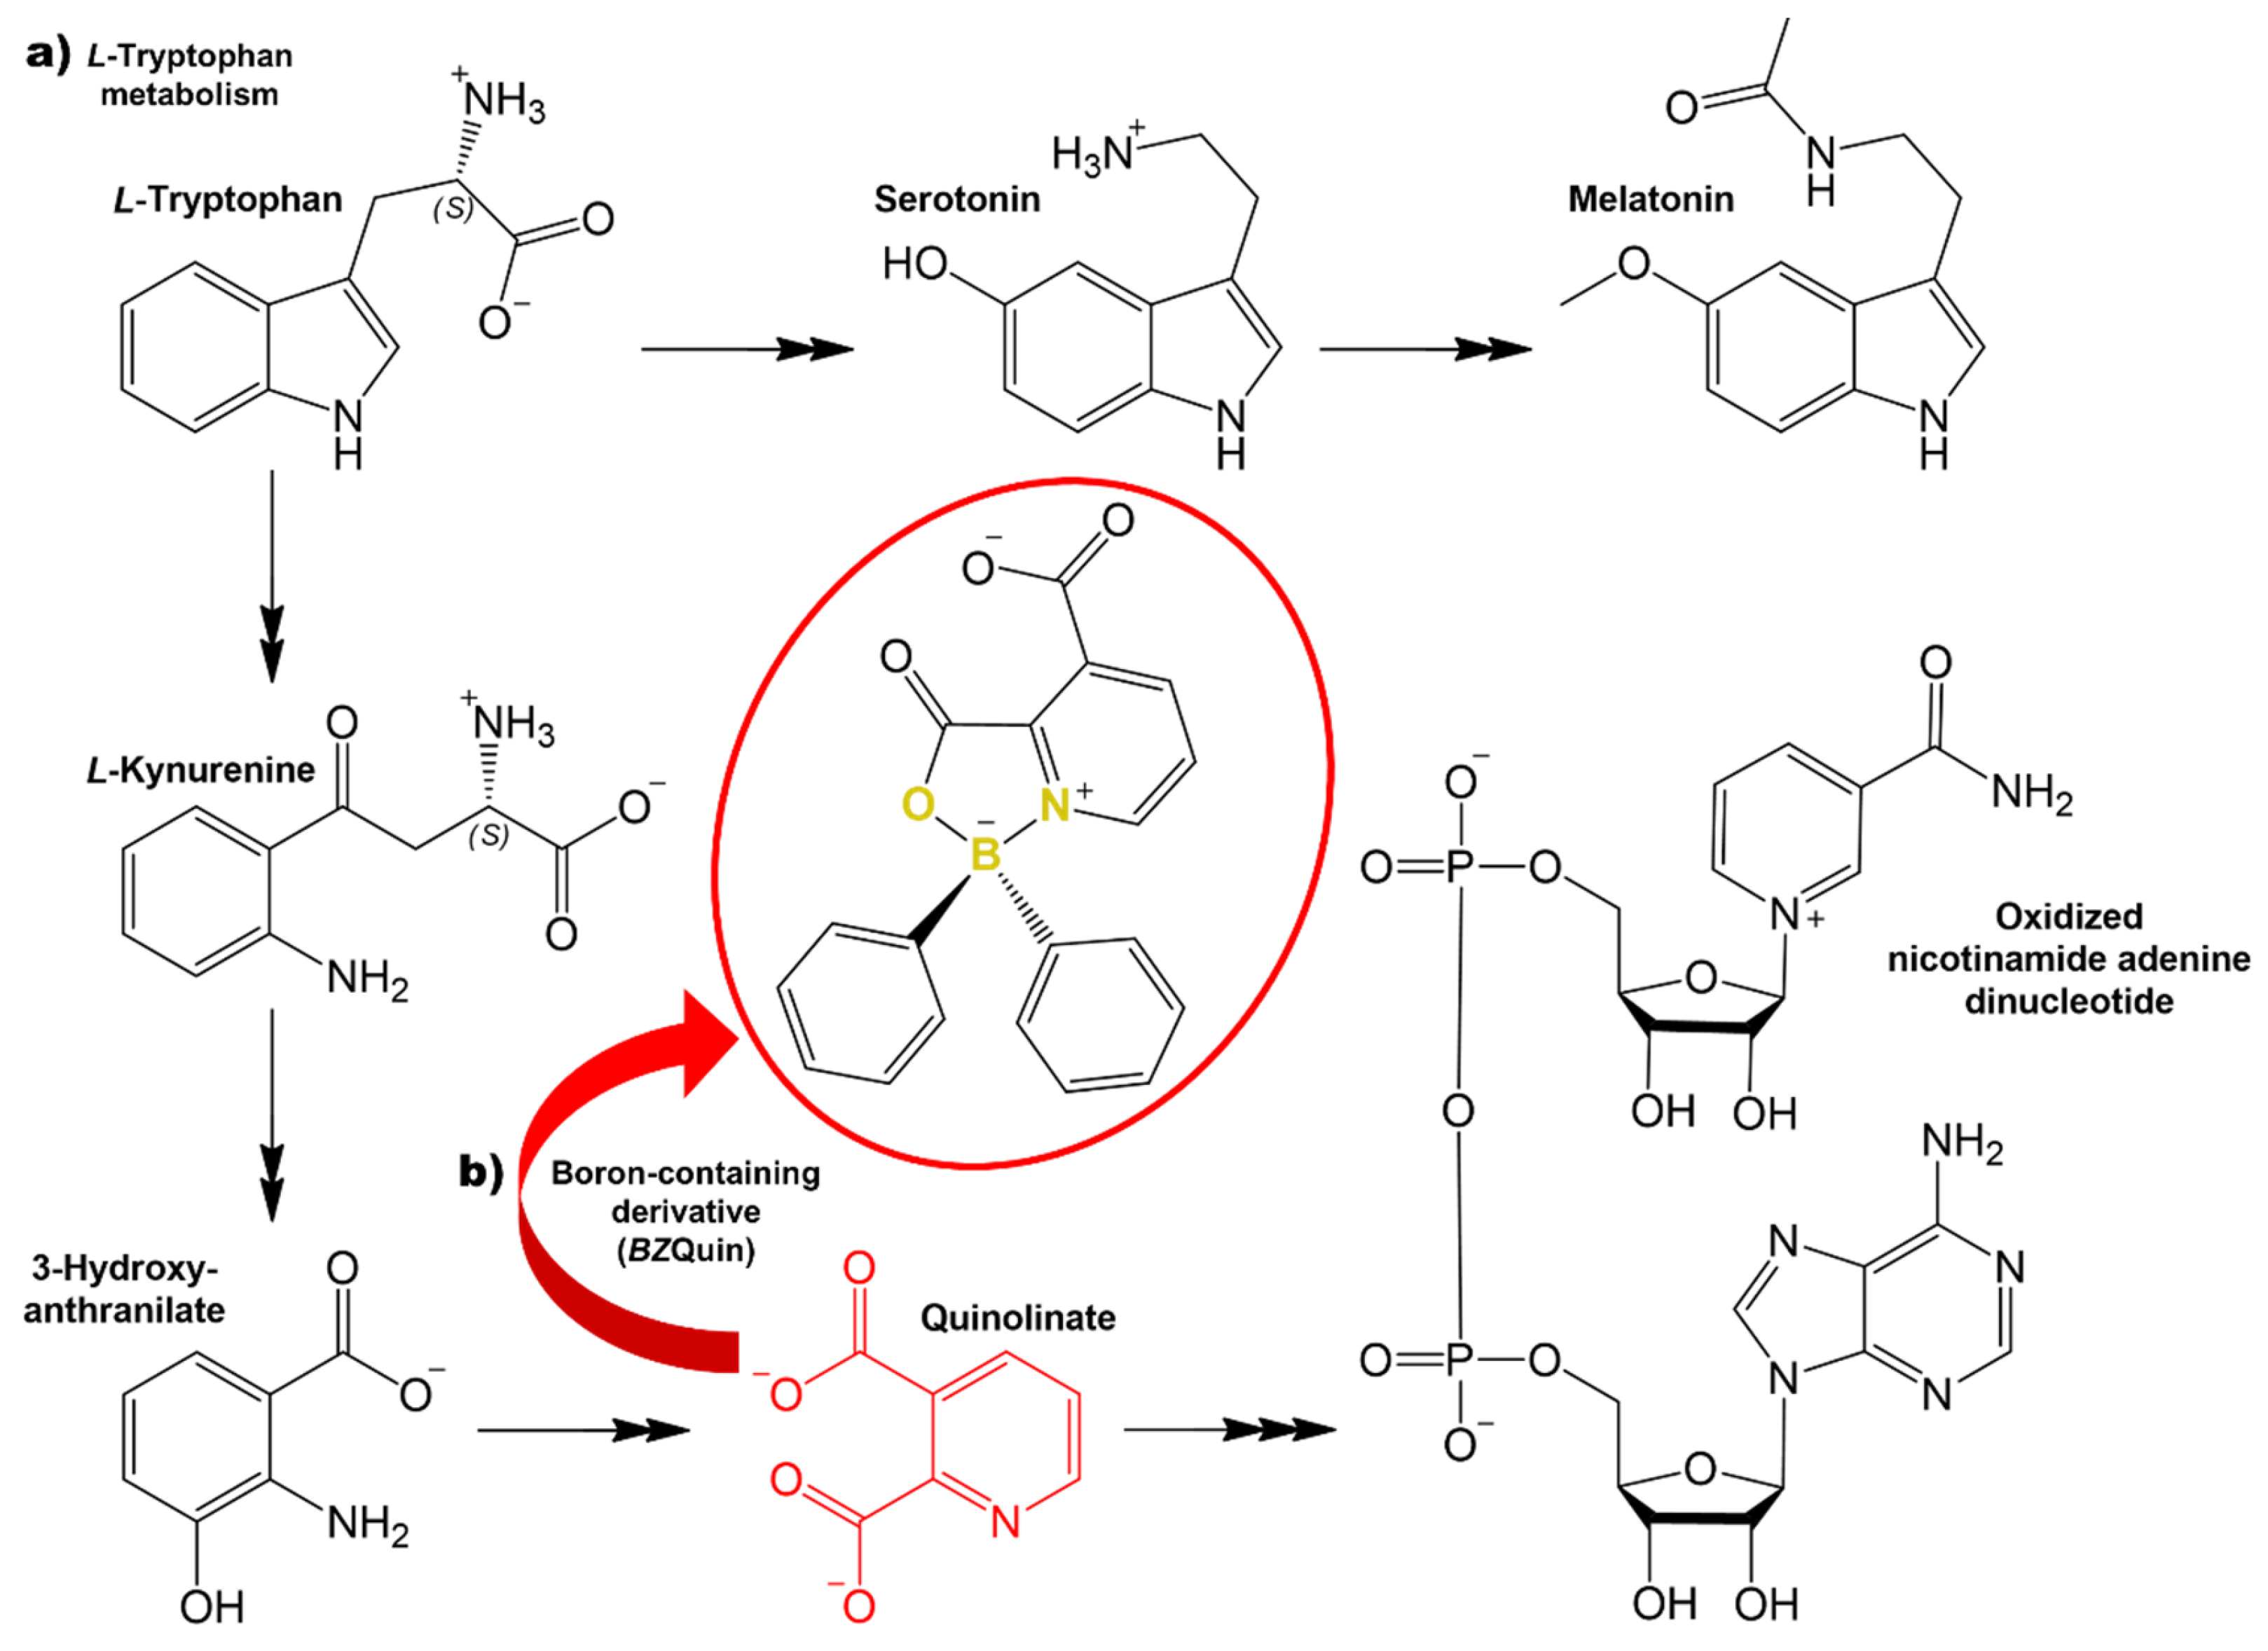
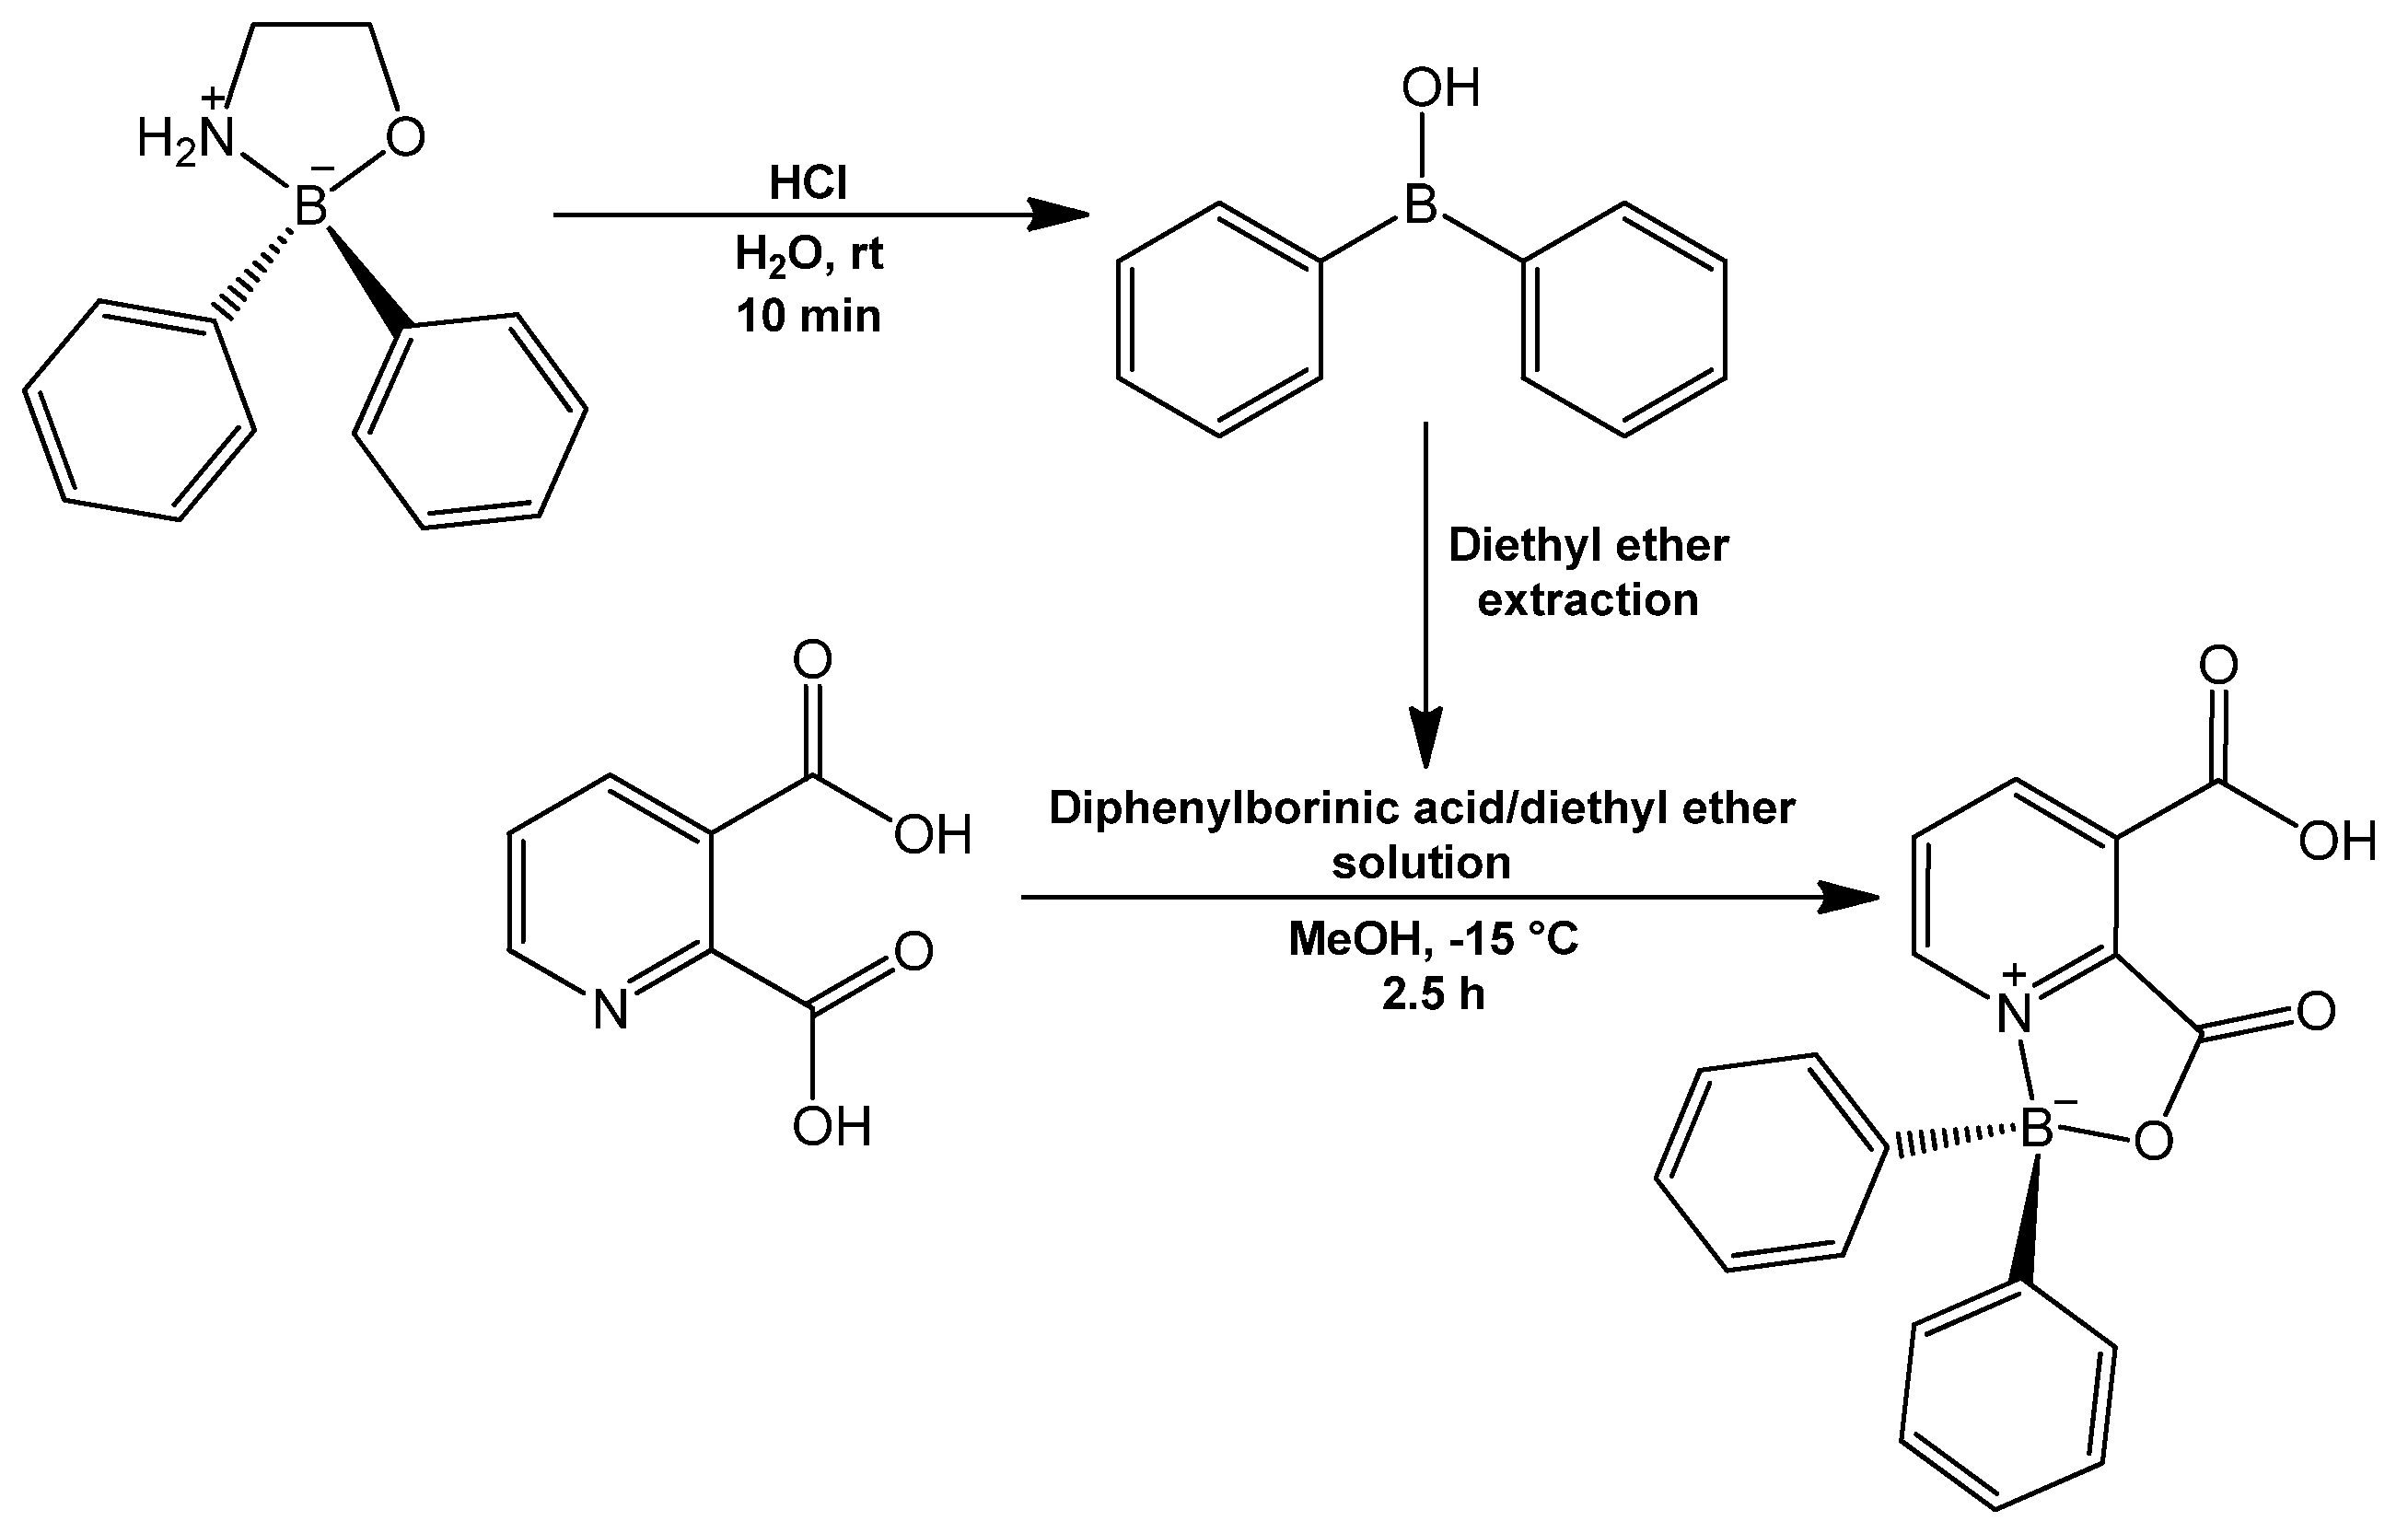
2.2. Synthesis and Chemical Characterization
BZQuin was synthesized from the complexation of pyridine-2,3-dicarboxylic acid and diphenylborinic acid (
Figure 5). The reaction was characterized by the formation of a coordinate covalent bond N→B, which occurred after the dehydration of the initial borinic ester.
BZQuin was obtained with an 87% yield and recrystallized as clear, long, greenish prisms. To the best of the authors’ knowledge, this is the first time that
BZQuin is reported in its acid form. This is because it has only been previously isolated and characterized as an organic salt formed by the amine group from ethanolamine as a cation, with the remaining carboxylate from
BZQuin as an anion [
32]. The main evidence for the formation of
BZQuin as an acid was the absence of the signals of the amine and methylenes from ethanolamine in the
1H NMR spectrum. These would appear at 8.15 ppm for the amine and at 2.82 and 3.55 ppm for the methylenes. Additionally, the O-H
ν band observed in the Raman spectrum further confirmed the obtention of the acid. The successful formation of the organoboron complex was evidenced by a chemical shift of the boron atom at 9.05 ppm in the
11B NMR spectrum. This signal corresponded to a tetravalent boron atom on which lay a negative charge and high electron density. This meant that its signal appeared at lower frequencies than that of a trivalent boron atom. In addition, the split observed in the multiple signal ranging from 7.36–7.12 ppm in the
1H NMR spectrum corresponded to the phenyl rings bonded directly to the boron atom. This could be tentatively assigned supported by the data from the HETCOR experiment. The latter indicated that the signal splits around 7.21, 7.25, and 7.28 ppm corresponded to the hydrogen atoms in the para, meta, and ortho positions with respect to the ipso carbon, respectively. The order of these signals in the
1H NMR spectrum corresponds to that from a previously reported isomer of
BZQuin. The latter is a diphenylboroxazolidone derived from pyridine-2,6-dicarboxylic acid. The most characteristic Raman bands observed were at 2975 cm
−1, 1655 cm
−1, 1001 cm
−1, 955 cm
−1, 554 cm
−1, and 485 cm
−1. These bands corresponded to the stretching of the carboxylic acid O-H bond, borinic-ester bonds, the phenyl ring breathing mode, the stretch of the B-O bond, and two symmetric deformations in the diphenylboroxazolidone, respectively. The synthesis method presented in this article yielded 5% more product than the synthesis method reported for the salt [
32,
33]. In Supplementary
Figures S3–S9, the
BZQuin spectra obtained from the NMR and FT-Raman spectroscopy characterizations are shown.
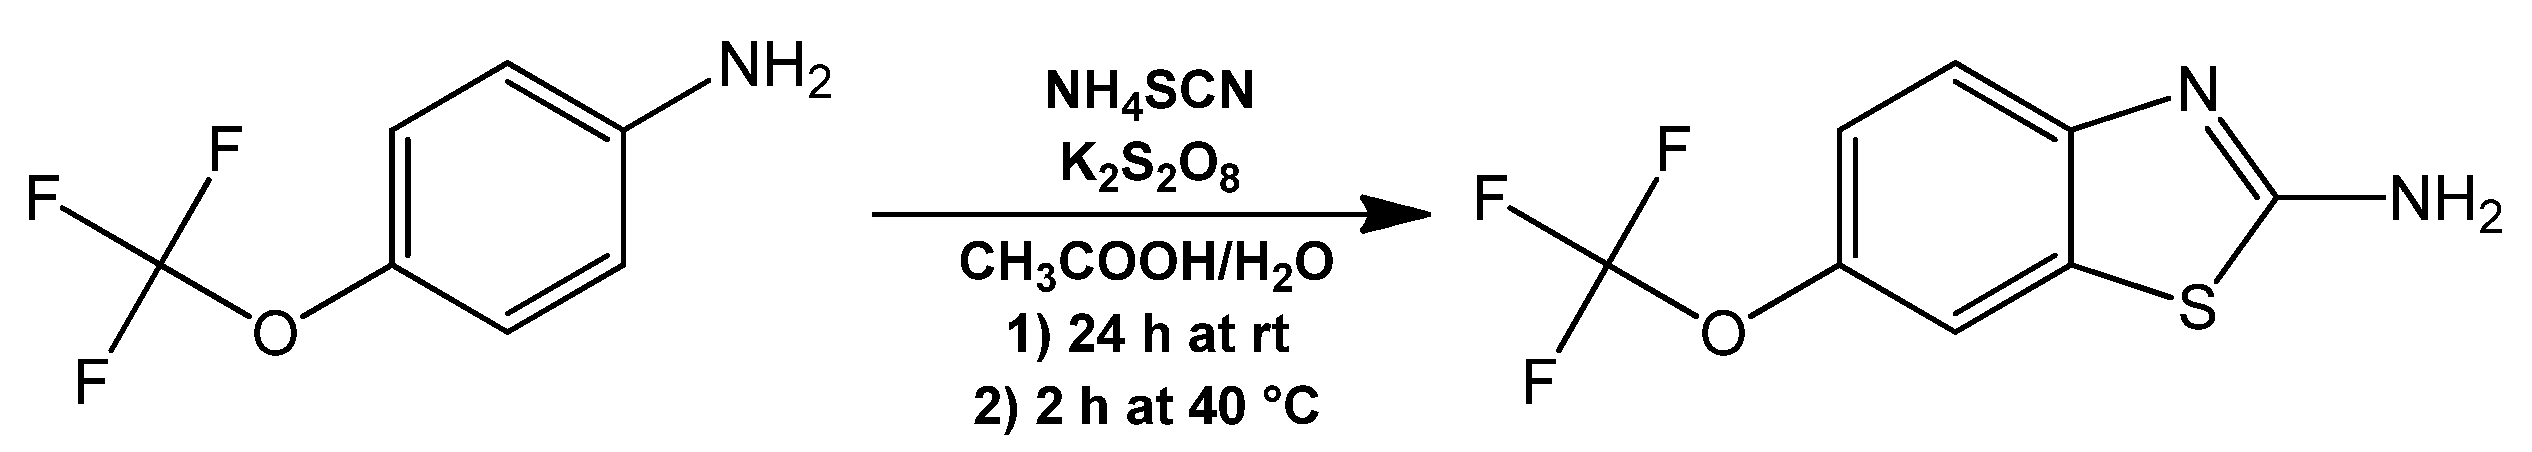
Riluzole (Rlz), an antiglutamatergic drug with clinical applications that was necessary for the in vivo evaluation was synthesized from a one-pot synthesis reaction of 4-(trifluoromethoxy) aniline with ammonium thiocyanate and potassium persulfate as oxidizing agent (
Figure 6). This was obtained with a 46% yield and recrystallized as clear yellow flakes. The main evidence of the formation of Rlz lay in the signals observed in the aromatic region of the
1H NMR spectrum, which appeared at 7.37, 6.98, and 6.78 ppm and corresponded to the hydrogens in positions 7, 4, and 5, respectively. The most characteristic Raman bands observed were at 1270 cm
−1, 528 cm
−1, and 461 cm
−1, which corresponded to the Kekulé mode and the thiazole symmetric and antisymmetric deformations, respectively. In
Supplementary Figures S10–S15, the Rlz spectra obtained from the NMR and FT-Raman spectroscopic characterizations are shown.
2.3. In Vivo Evaluation: Acute Toxicity
For the acute toxicity evaluation, the lethal dose 50 (LD
50) amount for
BZQuin was estimated in male CD-1 mice with a modified version of Lorke’s method [
34]. For the complete results obtained in both phases of the experiment, see
Supplementary Table S3. In
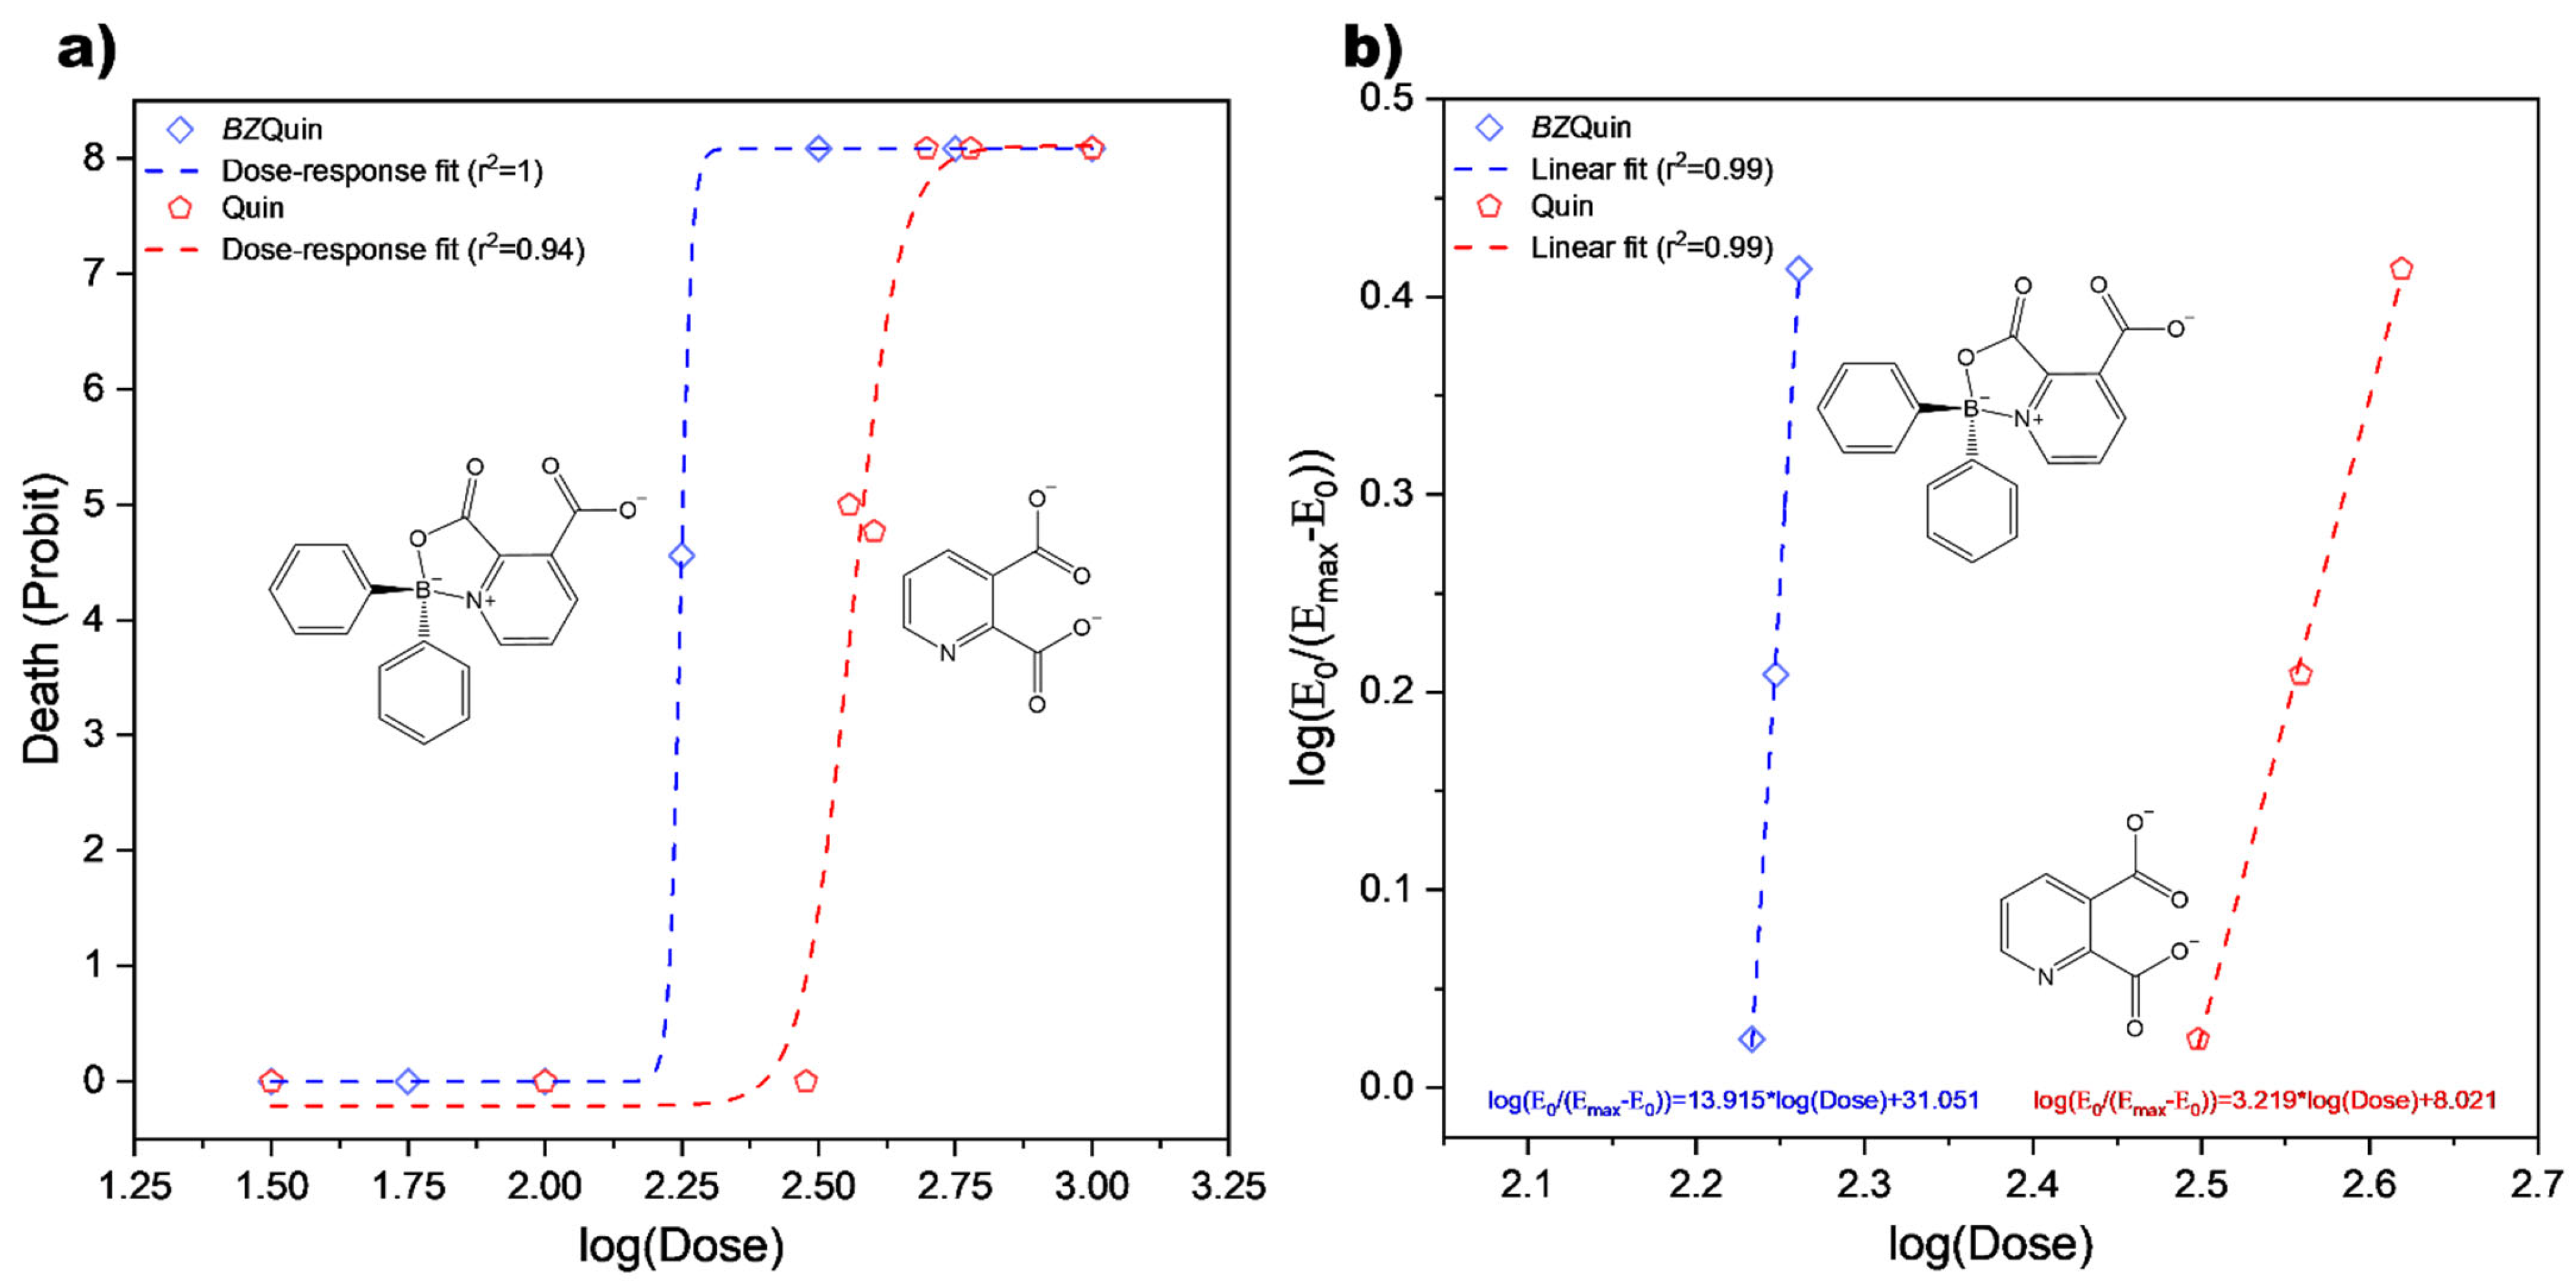
Figure 7, the
BZQuin dose–response curve is presented. This is because the observed effect, death, was of a quantal nature, the probability of which was represented in probit. Additionally, the data fitted to the linearized Hill equation are also shown. Along the
BZQuin curves, the data for its precursor, Quin, are also plotted for comparative purposes, as derived from early reports on the toxicity of kynurenines in mice [
34,
35].
In the dose–response curves, the LD
50 value was estimated by geometric mean (
G), as described by Lorke’s method [
34]. It was 178 mg/kg for
BZQuin, while it was 380 mg/kg for Quin. If the LD
50 value was estimated with the values obtained from the data fitted to the linearized Hill equation, it could differ from that obtained by
G. According to these, the LD
50 value of
BZQuin was 170 mg/kg, while for Quin, it was 309 mg/kg. Considering the LD
50 estimations performed by both methods for each compound, it is safe to say that the LD
50 value of
BZQuin lay around 174 mg/kg. However, the difference between both LD
50 values estimated for Quin left a much broader interval for a correct assessment to be carried out. Despite this, the published report from which Quin data were taken included the experimental LD
50, which was 360 mg/kg [
35], thus narrowing the interval to around 370 mg/kg. Regardless of the LD
50 estimations considered, it can be affirmed that
BZQuin was around two times more toxic than Quin for male CD-1 mice when administered i.p. This was observed in the typical left-side shift in the
BZQuin curves with respect to the Quin curves. Additionally, the difference between the slope values obtained from the linearized Hill equation fits suggested a different mechanism of action for both compounds [
35,
36].
A subsequent autopsy conducted on the mice administered with BZQuin that did not survive revealed bleeding under the meninges. This suggests that the cause of death was due to a stroke-like event, which is usually characterized by the presence of excitotoxicity. This indicates that the effects exerted by BZQuin and Quin at deleterious concentrations were similar because both affected the brain directly. The autopsy carried out on the surviving mice did not reveal any macroscopic signs of pathological changes in the heart, lungs, liver, kidneys, or brain. No hematological changes were explored in this study.
2.4. In Vivo Evaluation: Murine Behavioral Model
The open field test (OFT) was applied after administrations of antiglutamatergic pre-treatments and stimulating agents and the survival after these treatments. This model was designed to study the effects of
BZQuin on behaviors often associated with the stimulation of glutamatergic neurotransmission and the possible interference of antiglutamatergic drugs with these. Quin and
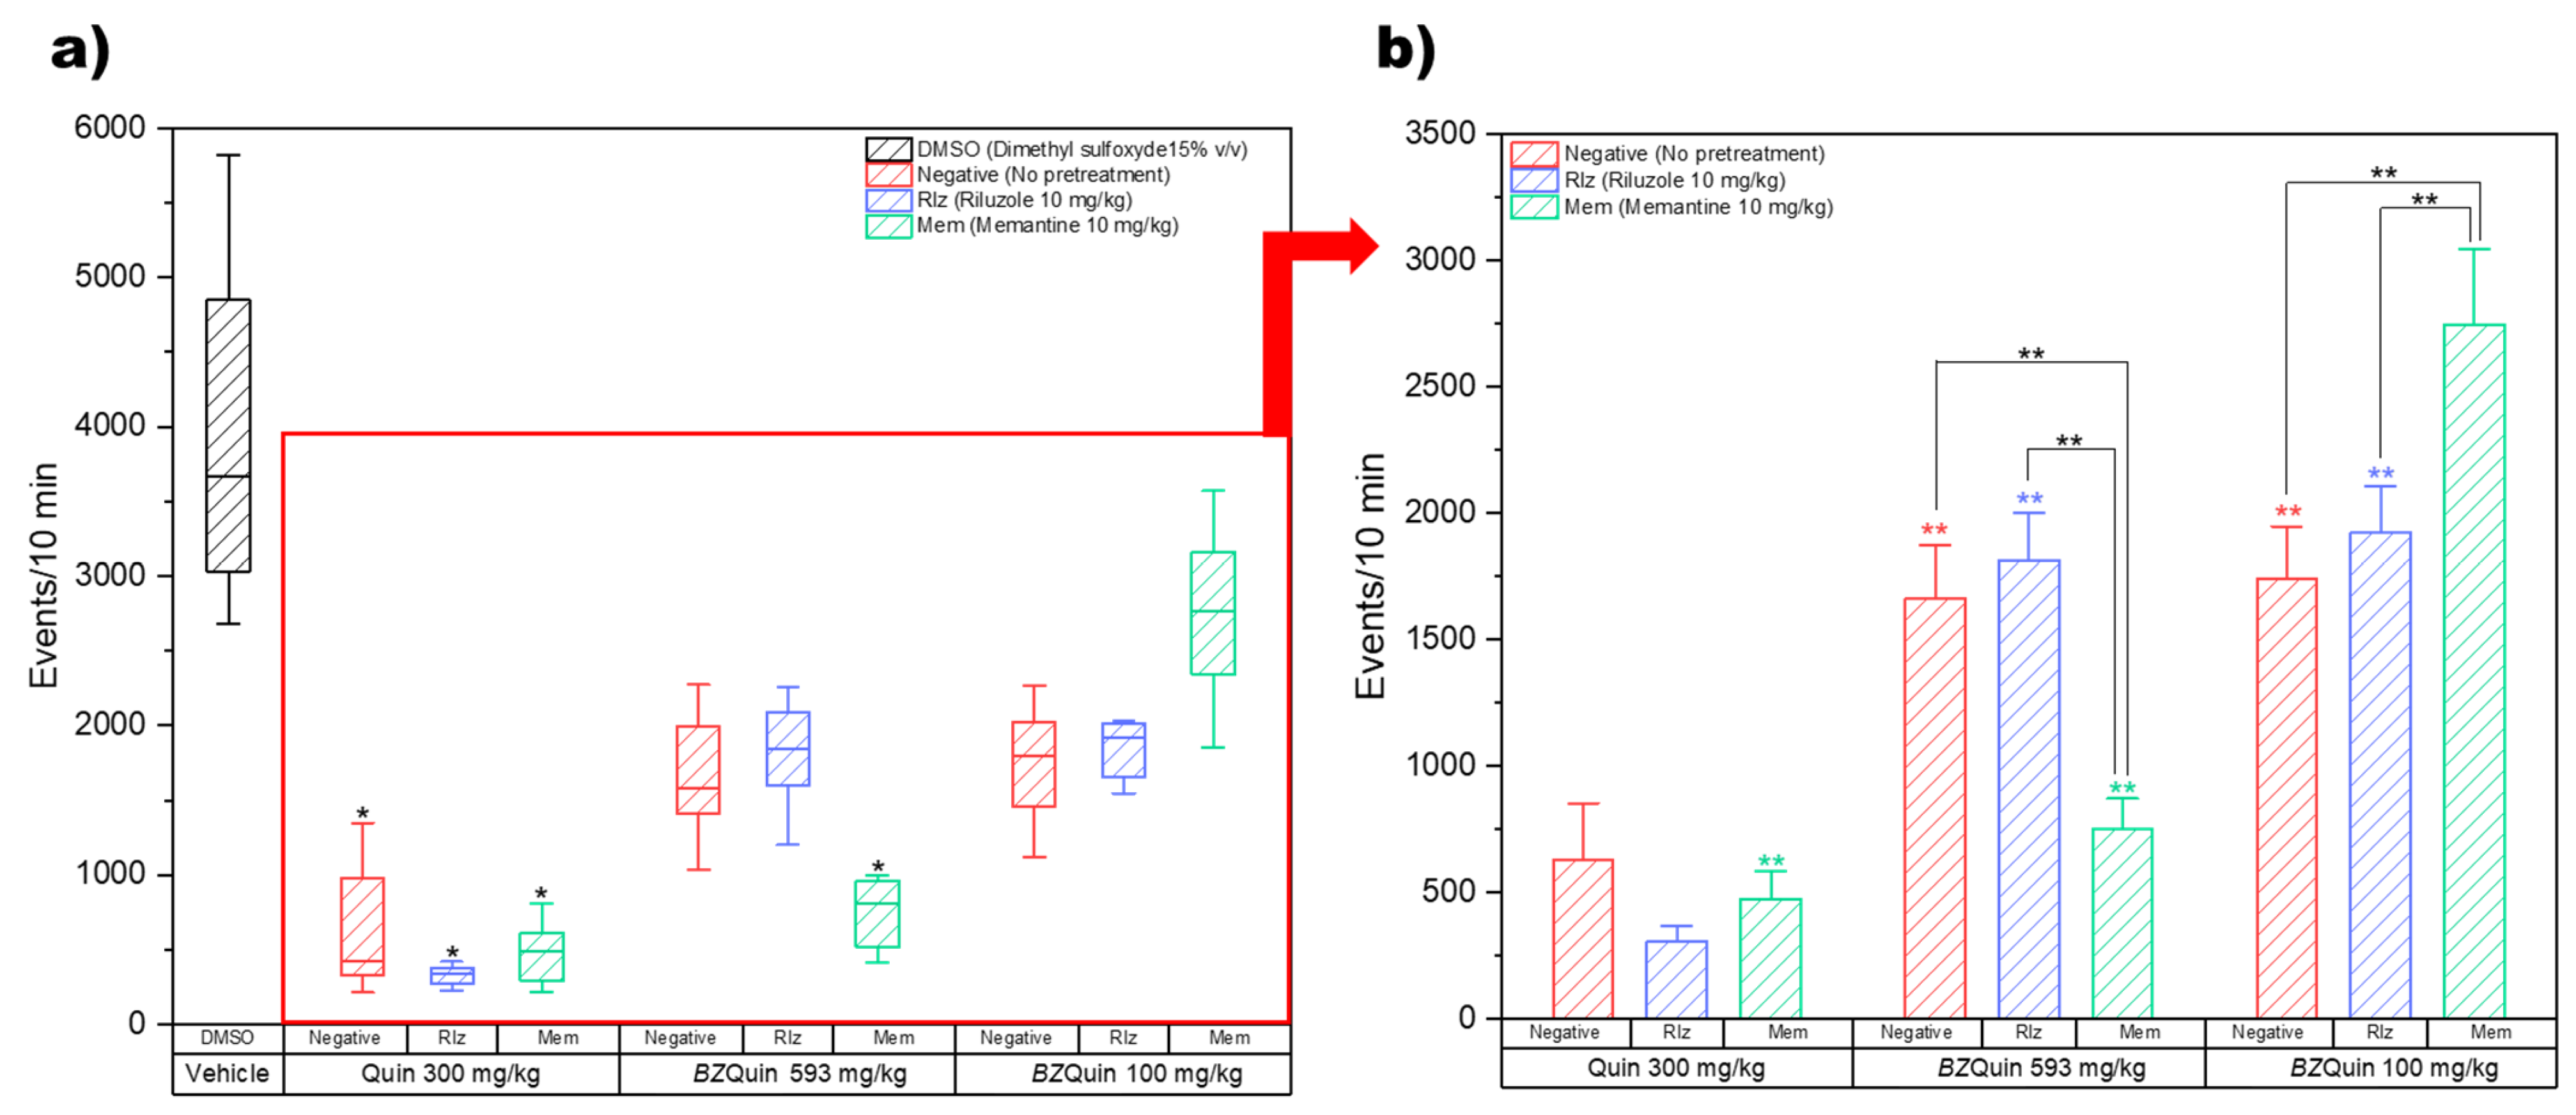
BZQuin were used as stimulating agents, with the former evaluated at 300 mg/kg and the latter at 593 mg/kg and 100 mg/kg. Memantine (Mem) and riluzole (Rlz) were used as antiglutamatergic pretreatments and were both administered at 10 mg/kg. The experimental design, drugs, and administrations are described in detail in the Materials and Methods section. The first parameter of interest in the OFT was locomotor activity, which was directly measured by the number of events. In
Figure 8, the results for locomotor activity recorded over 10 min are shown. In
Figure 8a, the data are plotted as boxes and whiskers since the Shapiro–Wilk normality test was failed (
p < 0.050) while considering the vehicle group. A Kruskal–Wallis test (H = 68.29,
p ≤ 0.001) was conducted for comparing the vehicle group against the remainder of the groups in search of differences. In
Figure 8b, for a more in-depth analysis of the relationship between the pretreatment and the stimulating agent, the vehicle group was obviated to leave the data with a normal distribution suitable for a two-way ANOVA. This graph is plotted as bars because the Shapiro–Wilk normality test was passed (
p > 0.050).
For the interpretation of the locomotor activity results, it should be noted that a decrease in the number of events may be related to the onset and occurrence of seizures. As the intensity of the seizures increased, the locomotor activity, in turn, decreased. It is noteworthy that the locomotor activity was significantly decreased in all the groups administered with Quin at 300 mg/kg as a stimulating agent (
p < 0.05) (
Figure 8a). This indicated more intense seizures in these groups. This is in agreement with Quin as an NMDA receptor agonist. As such, it directly promoted neuron depolarization and action potential firing, which in turn gave rise to the occurrence of seizures [
14]. The two-way ANOVA indicated that the results were mostly influenced by the stimulating agent administered rather than by the pretreatment (
Figure 8b). In a global comparison of the factors, the least square means (LSM) of the pretreatments indicate that there was no significant difference between any of these. In contrast to this, the LSM of the stimulating agents indicate that the locomotor activity was significantly decreased in the following order:
BZQuin at 100 mg/kg;
BZQuin at 593 mg/kg; and Quin at 300 mg/kg (F = 88.70,
p < 0.001). This indicates that the ability of
BZQuin for causing seizures was decreased when compared with its precursor, even when administered at an equimolar dose. For the LSM and their standard errors of the mean (SEMs) for the pretreatments and the stimulating agents, see
Supplementary Table S4. Additionally, in a simple comparison of the LSM of each interaction, there existed significant differences among the groups with the same pretreatment but administered with a different stimulating agent (F = 14.42,
p < 0.001). The locomotor activity of the group with no pretreatment (negative) administered with Quin at 300 mg/kg was significantly decreased when compared with the negative groups administered with
BZQuin at 593 mg/kg and at 100 mg/kg (
p < 0.01). A similar situation was observed with the group pretreated with Rlz at 10 mg/kg and administered with Quin at 300 mg/kg. This was due to its locomotor activity being significantly decreased when compared with the Rlz groups administered with
BZQuin at 593 mg/kg and 100 mg/kg (
p < 0.01). In contrast to this, the locomotor activity of the group pre-treated with memantine (Mem) at 10 mg/kg and administered with
BZQuin at 100 mg/kg was significantly increased when compared with the other two Mem groups (
p < 0.01). An interesting observation is that, when
BZQuin was administered at 593 mg/kg, Mem appeared to contribute to the decrease in locomotor activity. Nonetheless, when
BZQuin was administered at 100 mg/kg, Mem significantly increased it. For the LSM and SEMs for the interaction, see
Supplementary Table S5. Both types of comparisons performed indicate that, regardless of the pretreatment or the dose of
BZQuin administered, Quin decreased locomotor activity to a greater extent than its organoboron derivative.
Although Rlz-pretreated groups had no significant differences in locomotor activity when compared with the negative groups, Mem behaved differently depending on the
BZQuin dose administered. The effects of these drugs were more noteworthy during the latency time until the occurrence of seizures and their intensity. In
Table 1, the results for the latency time are presented. Each mouse was observed for 15 min prior to the start of the OFT. Because the latency time of the groups administered with
BZQuin at 593 mg/kg and 100 mg/kg surpassed the observation time, they were not considered for the statistical analysis. On the other hand, the latency times of the groups administered with Quin at 300 mg/kg passed the Shapiro–Wilk normality test (
p < 0.050); therefore, they were compared with a one-way ANOVA.
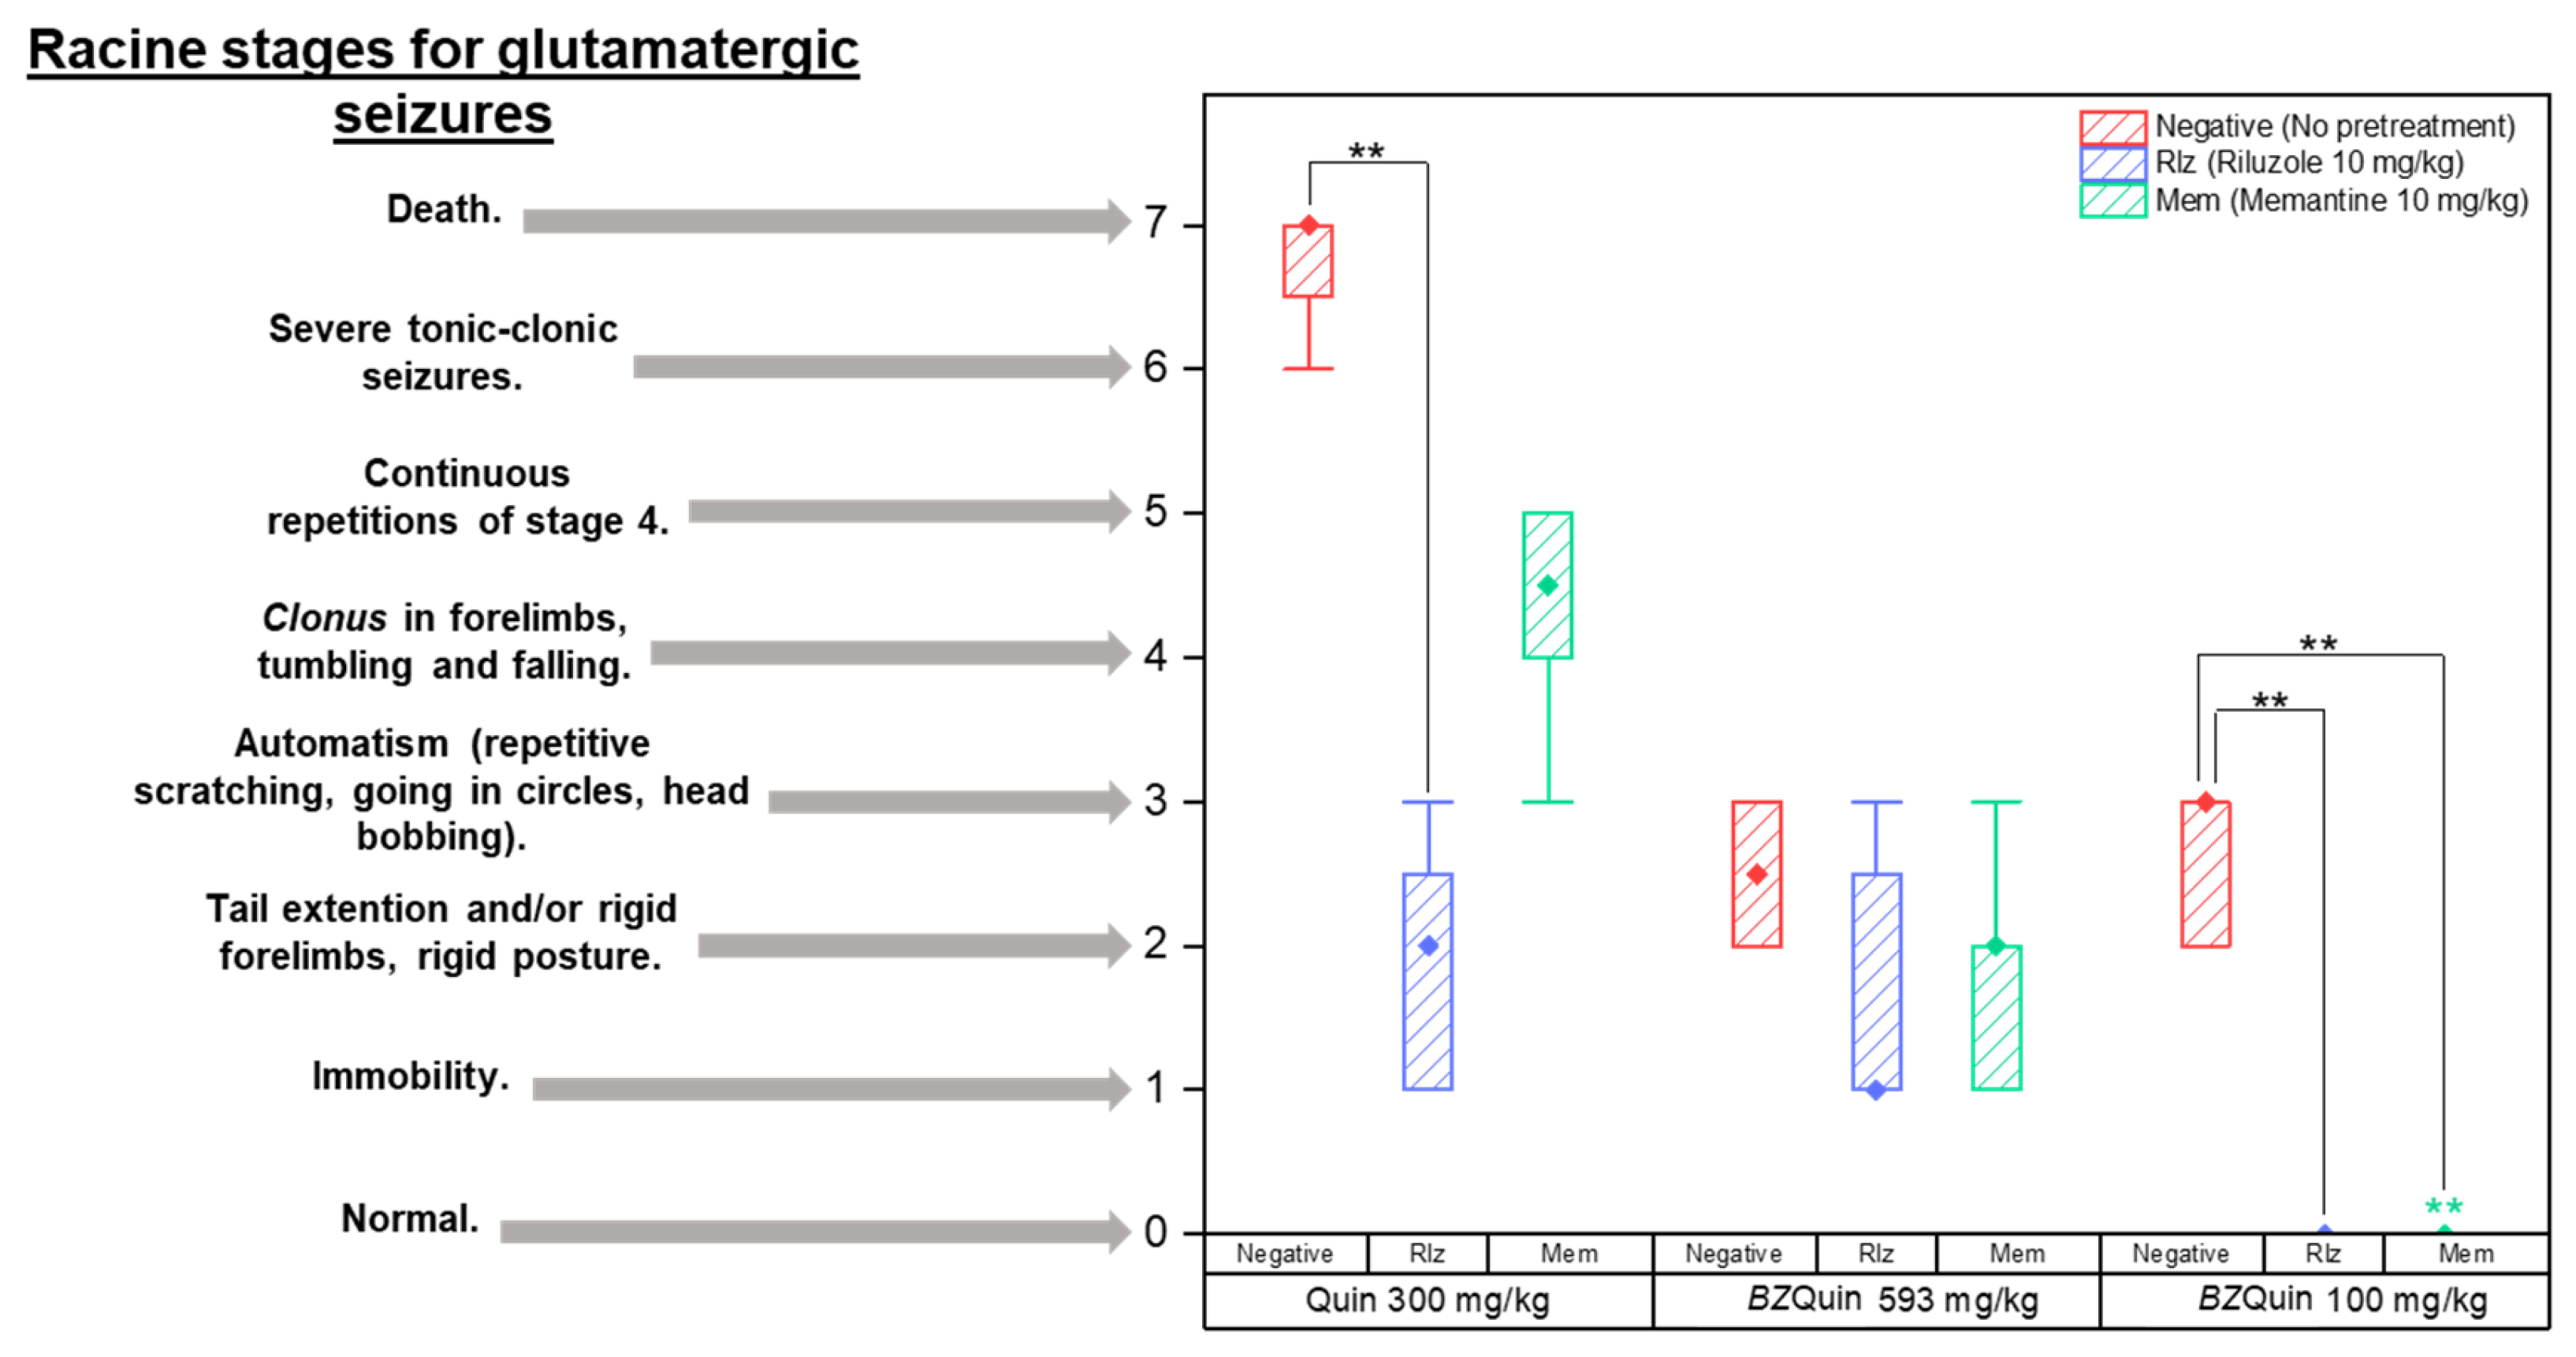
The latency time results indicate that the only significant difference was among the groups administered with Quin at 300 mg/kg, specifically, between the Rlz and negative groups. The longer latency time of the Rlz-pretreated group was related to the delay in the onset of seizures. The latter may be attributed to the antiglutamatergic effect that this pretreatment drug exerted and its interference with the glutamatergic mechanism of Quin. After the initial 15 min of observation, the intensity of the seizures was evaluated according to Racine stages, which are employed when a glutamatergic agent is administered to induce status epilepticus [
37] (
Figure 9).
The data are plotted as boxes and whiskers because the Shapiro–Wilk normality test was failed (
p < 0.050). Because the data could not be analyzed by parametric tests, three Kruskal–Wallis tests were carried out. The first of these was for comparing the effect of the pretreatments (H = 22.19,
p ≤ 0.001). The second was carried out to compare the effect of the stimulating agents (H = 32.06,
p ≤ 0.001), while the third was to compare each individual group against the others (H = 62.09,
p ≤ 0.001). For the medians (P
50) and percentiles (P
25 and P
75) of the pretreatments and stimulating agents, see
Supplementary Table S6.
For comparison of the pretreatments, it was observed that the intensity of the seizures increased in the negative groups as expected due to the lack of pretreatment with an antiglutamatergic drug. Notwithstanding this, there was no difference between the groups pretreated with Rlz or Mem (
p < 0.001). Considering these results, it should be noted that both antiglutamatergic drugs interfered with the effects of both stimulating agents, with the latter reflected in the low-intensity seizures observed in the Rlz and Mem groups. For
BZQuin, an unexplored compound, this suggested that its effects may be related to glutamatergic neurotransmission. For comparison of the stimulating agents, it was observed that the intensity of the seizures increased in the following order:
BZQuin at 100 mg/kg;
BZQuin at 593 mg/kg; and Quin at 300 mg/kg (
p < 0.001). The fact that
BZQuin, even at an equimolar dose compared to Quin, was no longer capable of inducing high-intensity seizures strongly suggested that it does not interact with the NMDA receptor. These in vivo results correlate with the in silico results from the previously discussed molecular docking. Additionally, along with the locomotor activity results, these suggested once again that mGluRs may be the targets for
BZQuin due to the excitatory glutamate-related slow response observed in the administered groups. For the individual-group comparison, among the groups administered with Quin at 300 mg/kg, it was observed that the intensity of seizures was significantly decreased in the group pretreated with Rlz when compared with the negative group (
p < 0.001). Meanwhile, among the groups administered with
BZQuin at 100 mg/kg, it was observed that seizure intensity was significantly decreased in the groups pretreated with Rlz and Mem when compared with the negative group (
p < 0.001). These results indicate more clearly that the effects of
BZQuin were related, at least partially, to its positive influence on glutamatergic neurotransmission. This can be affirmed due to the interference exerted by both antiglutamatergic drugs with its effects. Additionally, in the group pretreated with Mem, there was a significant decrease in seizure intensity when compared with its homologue administered with Quin at 300 mg/kg as a stimulating agent (
p < 0.001). After the OFT, the mice of each group were observed for 15 days to evaluate survival. In
Supplementary Figure S2, survival amounts of the mice at 48 h and at 15 days are represented as bars.
It was observed from the survival at 48 h that, between the groups administered with equimolar doses of BZQuin and Quin, none of the mice from the former groups survived after 48 h, regardless of the pretreatment administered. Among the groups administered with Quin at 300 mg/kg, after 48 h, all mice pretreated with Rlz survived, while three of the mice pretreated with Mem and the majority of the mice from the negative group died. These results demonstrate that, in addition to the already-observed antiglutamatergic effect of Rlz, this drug also improved survival when used against Quin, performing even better than Mem. Among the groups administered with BZQuin at 100 mg/kg, after 48 h, the majority of the mice survived, except for one mouse pretreated with Mem. Therefore, this indicated that perhaps, at a dose below 100 mg/kg, BZQuin may have possible biological applications without toxic effects. From the survival at 15 days, among the groups administered with Quin at 300 mg/kg, the majority of the mice pretreated with Mem died compared with one mouse pretreated with Rlz. This implied that Mem may not be as good as Rlz for improving survival after an acute excitotoxic event. The fact that, at the end of the experiment, the negative group had a survival probability of 0.25 was not in accordance with its estimated and reported LD50. However, BZQuin at an equimolar dose compared with that of Quin remained toxic. Among the groups administered with BZQuin at 100 mg/kg, after 15 days, two of the mice from the negative group died, while all mice pretreated with Rlz and the rest of the mice pretreated with Mem survived. This suggests that Rlz and Mem exerted an effect on the survival of these groups by antagonizing the effects of BZQuin. This is in agreement with Rlz and Mem preventing at all times the occurrence of seizures among the mice of these groups.
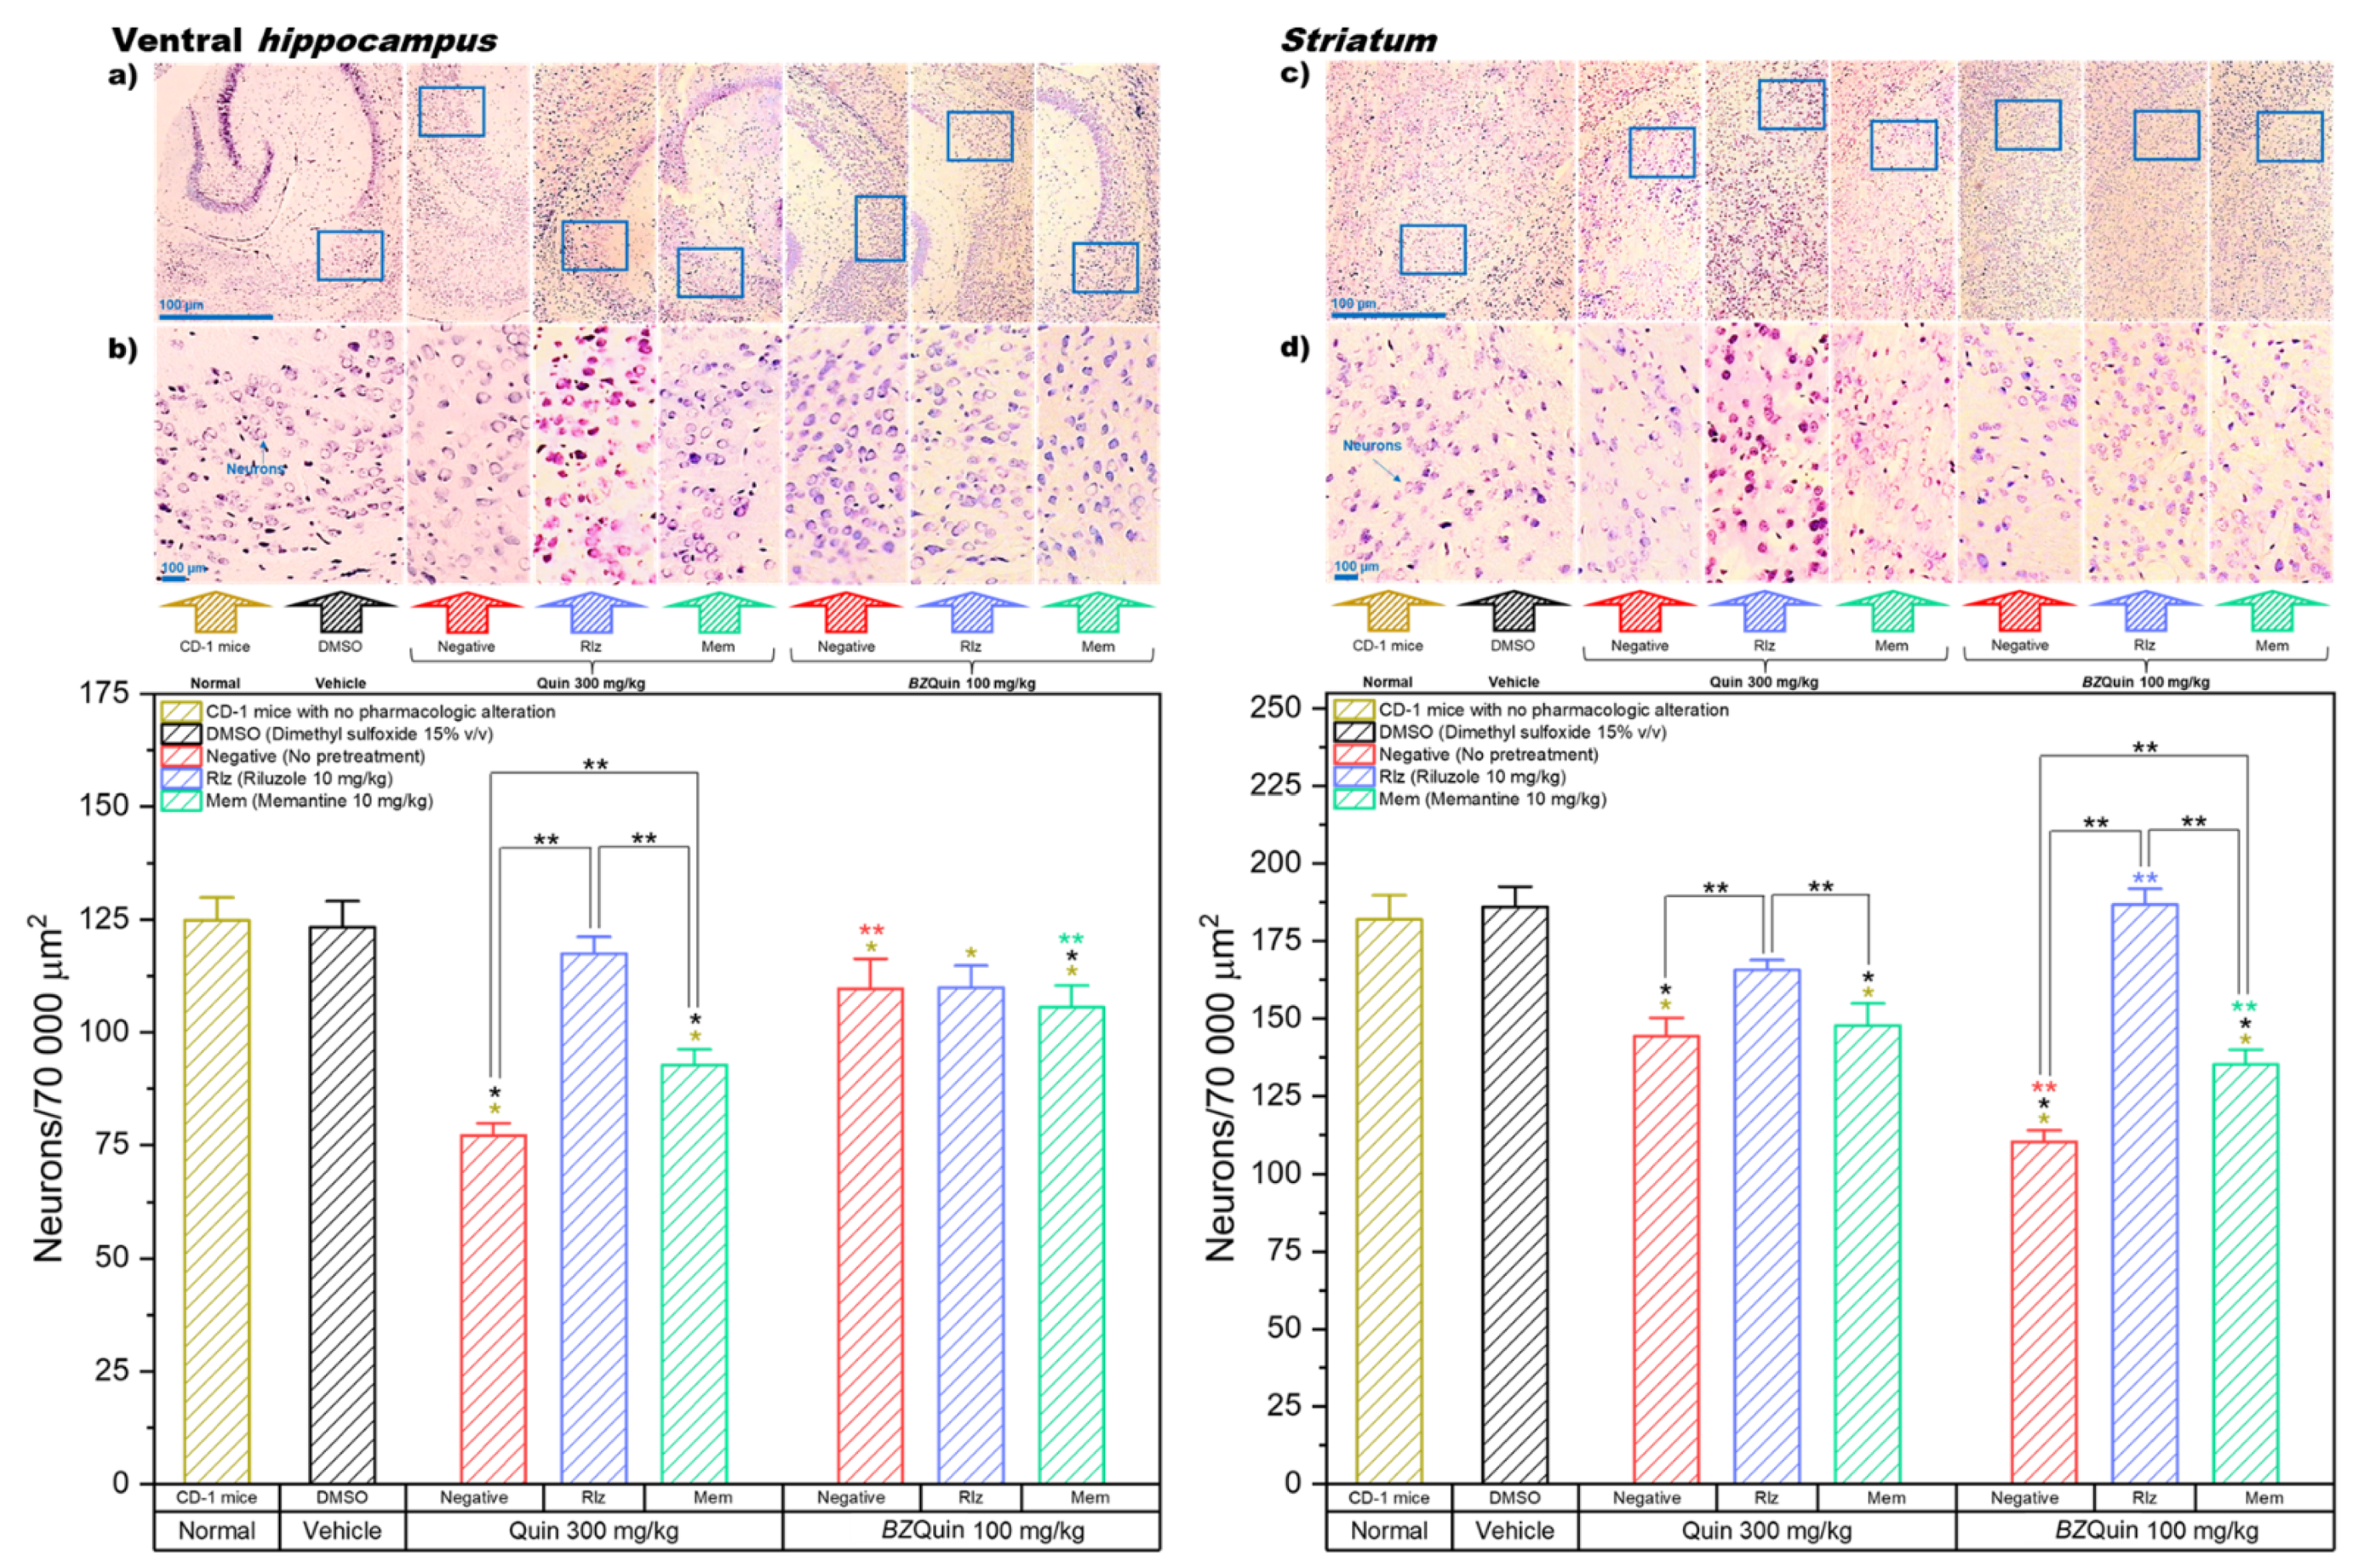
2.5. Ex Vivo Evaluation: Nervous Tissue Histology
The ex vivo evaluation was carried out on the mice in groups not treated (normal), administered with vehicle, and the surviving groups, which were those administered with Quin at 300 mg/kg and with BZQuin at 100 mg/kg. This was performed to observe the effects of the pretreatments and the stimulating agents on neuronal survival using the method of Vogt for neuron staining on brain sections. The neuroanatomical structures of interest in which the neurons were accounted for included the ventral hippocampus, the striatum, and the prefrontal and cerebellum cortexes. A decrease in neuron count was related to neurotoxicity. Therefore, due to the consideration that the stimulating agents Quin and BZQuin exerted a positive influence on glutamatergic neurotransmission, the observed neurotoxicity could be considered a manifestation of excitotoxicity. Micrographs of the regions of the four studied neuroanatomical structures at magnifications of 4× and 20× are presented in this section for demonstrative purposes.
In
Figure 10, the results for the neuron count in the CA1 region of the ventral hippocampus and the striatum are shown. In these graphs, the data are plotted as bars since, for both, the Shapiro–Wilk normality test was passed (
p > 0.050). For the ventral hippocampus, a one-way ANOVA indicated that the neuron count was significantly decreased in the majority of the groups. Among the groups administered with Quin at 300 mg/kg, the only group with no significant difference against the normal and vehicle groups was that pretreated with Rlz. This indicates that the neuroprotective effect of Rlz was particularly good at the CA1 region of the ventral hippocampus. Among the groups administered with
BZQuin at 100 mg/kg, the three groups showed a significant decrease in neuron count when compared to the normal group (
p < 0.05). However, only the group pretreated with Mem demonstrated a significant decrease in neuron count when compared to the vehicle group (
p < 0.01). A global comparison of the LSM of the pretreatments in a two-way ANOVA revealed that the neuron count was significantly decreased in the following order: Rlz, Mem, and negative (F = 23.68,
p < 0.001). Thus, this indicates that Rlz possessed a better neuroprotective effect that Mem in the analyzed region but that both improved neuronal survival. In addition to this, when performing the global comparison for the stimulating agents, the neuron count was significantly lower in the groups administered with Quin at 300 mg/kg than in the groups administered with
BZQuin at 100 mg/kg (F = 25.38,
p < 0.001). This implies that
BZQuin was not as toxic as Quin for the neurons of the analyzed region. This is coherent with the fact that the negative group administered with
BZQuin at 100 mg/kg entertained no difference from the vehicle group.
In a simple comparison of the LSM of the interactions, there existed a significant difference between some of the groups (F = 21.33,
p < 0.001). Among the groups administered with Quin at 300 mg/kg, on comparing the group pretreated with Rlz against the negative and Mem groups, there was a decrease in the neuron count of the latter (
p < 0.001). In the negative group, there was a significant decrease in neuron count when compared against the group pretreated with Mem (
p < 0.01). This is in agreement with the global comparison of the pretreatments because the neuron count decreased significantly in the same order. The most relevant observation in the CA1 region of the ventral hippocampus is that the neuron counts of the groups administered with
BZQuin at 100 mg/kg did not exhibit any significant difference when compared to that of the vehicle group, whether or not the mice were pretreated with Rlz. This could be related to the low expressions of mGluR1, mGluR2, and mGluR7 in this specific region of the hippocampal circuit. These results are coherent and further support the results of the molecular docking and the murine behavioral model, suggesting that
BZQuin may exert its effects by binding to one of these mGluRs [
4,
38].
For the striatum, a one-way ANOVA indicated that the neuron count was significantly decreased in the majority of the groups. Among the groups administered with Quin at 300 mg/kg and among those administered with
BZQuin at 100 mg/kg, the negative and Mem groups revealed a significant decrease in neuron count when compared to the normal and vehicle groups (
p < 0.001). In both groups pretreated with Rlz, this drug exerted a neuroprotective effect, regardless of the stimulating agent administered. Therefore, there were no significant differences from the normal and vehicle groups. A global comparison of the LSM of the pretreatments in a two-way ANOVA demonstrated that the neuron count was significantly decreased in the following order: Rlz, Mem, and negative (F =103.67,
p < 0.001). Additionally, upon conducting a global comparison for the stimulating agents, the neuron count was significantly lower in the groups administered with
BZQuin at 100 mg/kg than in the groups administered with Quin at 300 mg/kg (F = 8.86,
p < 0.01). These global comparisons indicate that the neuroprotective effect of Rlz outperformed that of Mem in the striatum, while
BZQuin appeared to exert a greater neurotoxic effect than Quin in this same region, even at a lower molar dose. This could be attributed to an excitatory effect on neurons and a higher affinity for glutamate receptors. In a simple comparison of the LSM of the interactions, there existed a significant difference between some of the groups (F = 32.21,
p < 0.001). Among the groups administered with Quin at 300 mg/kg, the group pretreated with Rlz revealed a significant decrease in neuron count when compared against the negative and Mem groups (
p < 0.01). A similar situation was observed for the groups administered with
BZQuin at 100 mg/kg (
p < 0.001). However, the neuron count in the group pretreated with Mem was even higher than that of the negative group (
p < 0.001). This demonstrated the neuroprotective effect of Mem against
BZQuin, although it was not as good as Rlz. Finally, when comparing both negative groups, the neuron count of the group administered with
BZQuin was lower than that of the group administered with Quin (
p < 0.001). This is in agreement with the global comparisons and further implies the possible selectivity of
BZQuin for the neurons in the striatum. This same observation could be made when comparing both groups pretreated with Mem. The group administered with
BZQuin had the lowest neuron count (
p < 0.001). However, an inverse situation was observed among the groups pretreated with Rlz, in which the neuron count of the group administered with
BZQuin was the highest (
p < 0.001). This demonstrated the neuroprotective effect of Rlz against
BZQuin in the striatum. With these results, it could be affirmed that
BZQuin exerts a greater influence on the neuron count in the striatum than its precursor, while the antiglutamatergic drugs Rlz and Mem interfered with its effects. A possible explanation behind the
BZQuin effect could be the high expressions of iGluRs in the dopaminergic and glutamatergic neurons in the striatum. The latter is especially remarkable for the thalamo-striatal pathway, in which the mGluR1 receptor is highly expressed. These results are complementary to the molecular-docking results. These results propose the mGluR1 receptor as one of the possible targets for
BZQuin, with its binding site located at the
L-glutamate site. The fact that
BZQuin exerted a neurotoxic effect that was countered by antiglutamatergic drugs strongly suggests a positive influence on glutamatergic neurotransmission [
4,
39].
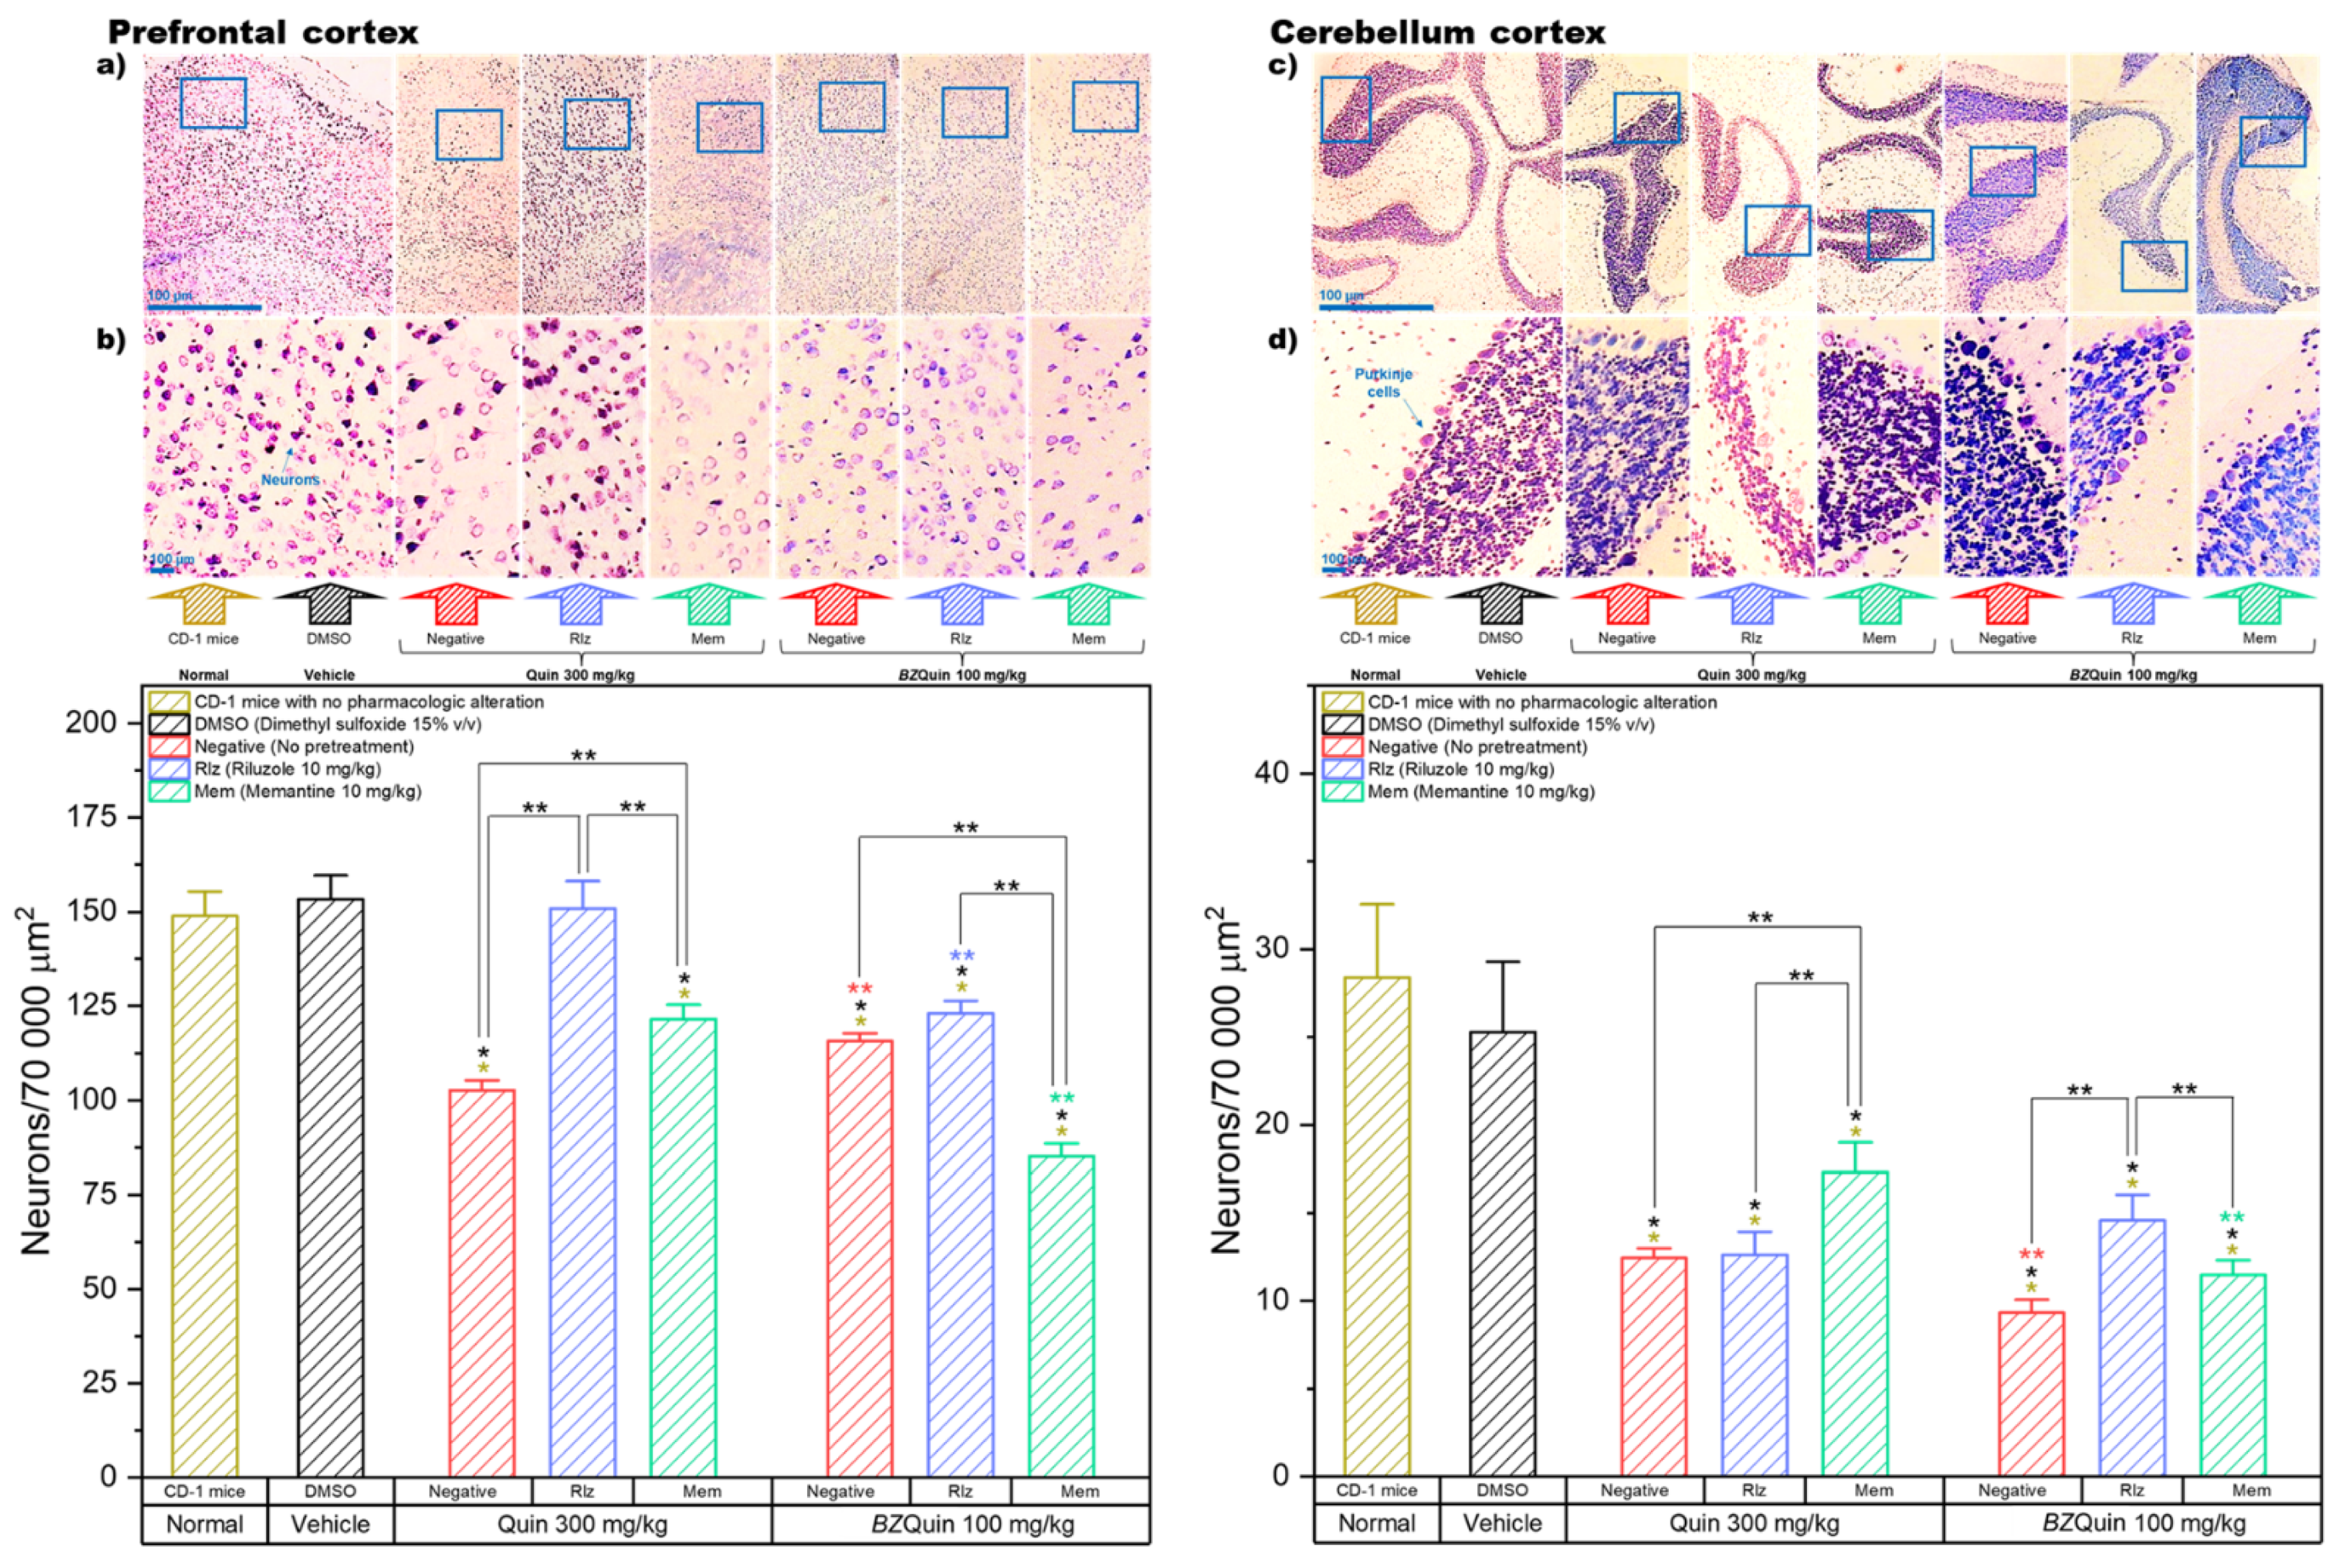
In
Figure 11, the results are presented for the neuron counts in the prefrontal and cerebellum cortexes of the brain. In these graphs, the data are plotted as bars because, for both, the Shapiro–Wilk normality test was passed (
p > 0.050). For the prefrontal cortex, a one-way ANOVA indicated that the negative and Mem groups administered with Quin at 300 mg/kg as a stimulating agent, as well as all the groups administered with
BZQuin at 100 mg/kg, demonstrated a significant decrease in neuron count when compared to the normal and vehicle groups (
p < 0.001). The neuroprotective effect of Rlz was better observed in the prefrontal cortex when it was administered as a pretreatment against Quin, in that there was no significant difference from the normal and vehicle groups. A global comparison of the LSM of the pretreatments in a two-way ANOVA revealed that the neuron count was significantly decreased in the following order: Rlz, negative, and Mem (F = 89.25,
p < 0.001). It is important to highlight that, in the prefrontal cortex, Rlz once again exerted a remarkable neuroprotective effect, although only when used as a pretreatment against Quin. Additionally, Mem appeared to exert a synergistic neurotoxic effect when employed as a pretreatment against
BZQuin. In addition to this, when carrying out a global comparison of the LSM of the stimulating agents, the neuron count in the groups administered with
BZQuin at 100 mg/kg was significantly lower when compared to the neuron count in the groups administered with Quin at 300 mg/kg (F = 59.79,
p < 0.001). In a simple comparison of the LSM of the interactions, there existed a significant difference between some of the groups (F = 49.37,
p < 0.001).
Among the groups administered with Quin at 300 mg/kg, in the negative and Mem groups there was a significant decrease in neuron count when compared to the group pretreated with Rlz (p < 0.001). Another significant decrease in neuron count was observed in the negative group when compared to that pretreated with Mem (p < 0.001). Thus, the latter demonstrated the neuroprotective effects exerted by Rlz and Mem against Quin in the prefrontal cortex. In contrast to this, among the groups administered with BZQuin at 100 mg/kg, when comparing the group pretreated with Mem against the negative and Rlz groups, there was a significant decrease in the neuron count of the former (p < 0.001). This is in agreement with the global comparisons and further supports the observation on the synergic neurotoxicity exerted by the concomitant administration of BZQuin and Mem.
One of the most important differences observed was between both negative groups because the group administered with
BZQuin at 100 mg/kg had a slightly higher, but significant, neuron count than that administered with Quin at 300 mg/kg (
p < 0.01). An inverse situation was observed when comparing both Rlz groups against each other and both Mem groups against each other. This is because the neuron count was higher in the groups administered with Quin at 300 mg/kg (
p < 0.001). Although Rlz and Mem were proved to exert a neuroprotective effect against
BZQuin in the striatum, they appeared to be useless against the
BZQuin-induced neurotoxicity in the prefrontal cortex. The ineffectiveness of these drugs against
BZQuin could be attributed to high expressions of the mGluR1 and mGluR2 receptors in this region, both suggested targets for
BZQuin. In addition, a high intrinsic activity of the evaluated compound with these mGluRs or its direct binding to other unexplored targets, which might not be necessarily glutamatergic, could also contribute to the observed effects [
4,
40].
For the cerebellum cortex, the neuron count was performed for Purkinje cells, a unique type of neuron found specifically in this part of the CNS. A one-way ANOVA indicated that, among the groups administered with Quin at 300 mg/kg and those administered with
BZQuin at 100 mg/kg, all the groups showed a significant decrease in neuron count when compared to the normal and vehicle groups (
p < 0.001). Thus, this indicates that neither Rlz nor Mem were sufficiently effective at protecting the Purkinje cells from the neurotoxicity induced by Quin or
BZQuin. A global comparison of the LSM of the pretreatments in a two-way ANOVA revealed that the Purkinje cell count was significantly decreased in the following order: Mem, Rlz, and negative (F = 11.29,
p < 0.001). Considering these results, the cerebellum cortex was the only studied region in which Mem exerted a better neuroprotective effect than Rlz, at least when used against Quin. In addition, when carrying out the global comparison of the LSM of the stimulating agents, it was observed that the Purkinje cell count was lower in the groups administered with
BZQuin at 100 mg/kg than in the groups administered with Quin at 300 mg/kg (F = 13.21,
p < 0.001). Thus, this suggested that
BZQuin may exert greater effect on Purkinje cell count than Quin. This could be interpreted as an improved selectivity for the neurons of this area similar to what was observed in the striatum. In a simple comparison of the LSM of the interactions, there existed a significant difference among the groups (F = 12.93,
p < 0.001). Among the groups administered with Quin at 300 mg/kg, upon comparison of the negative and Rlz groups to the Mem group, the Purkinje cell count of the latter was significantly higher (
p < 0.001). This confirms the ineffectiveness of Rlz against Quin in this area and the better neuroprotective effect exerted by Mem. Among the groups administered with
BZQuin at 100 mg/kg, upon comparing the group pretreated with Rlz against the negative and Mem groups, there was a significant decrease in the Purkinje cell counts of the latter (
p < 0.05). This demonstrates that Rlz exerted a neuroprotective effect on the Purkinje cells against
BZQuin, while Mem was ineffective against this stimulating agent. These statements are further supported by the comparisons between both Mem groups and both negative groups. In these, the groups administered with
BZQuin exhibited a significant decrease in the Purkinje cell count when compared to their homologues administered with Quin (
p < 0.01). The fact that
BZQuin exerted a greater neurotoxic effect on Purkinje cells could be attributed to the mGluR that this unique type of neuron expresses. This is because they only express the mGluR1 and mGluR7 receptors, which were both suggested as targets for
BZQuin by molecular docking. In addition, Quin was suggested to be unable to bind to the mGluR7 receptor by the same molecular-docking results [
4,
41,
42].

 ,
, 


