Article

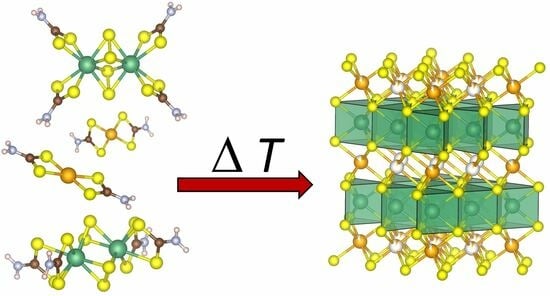
Nb2S4(CS2NH2)4—A New Precursor for NbS2 and Its Transition Metal Inserted Derivatives

Institute of Inorganic Chemistry, Kiel University, Max-Eyth Straße 2, D-24118 Kiel, Germany
*
Author to whom correspondence should be addressed.
Inorganics 2023, 11(12), 478; https://doi.org/10.3390/inorganics11120478
Submission received: 30 October 2023 / Revised: 27 November 2023 / Accepted: 7 December 2023 / Published: 14 December 2023
(This article belongs to the Special Issue 10th Anniversary of Inorganics: Inorganic Solid State Chemistry)

Abstract

:
Transition metal inserted NbS2 (TxNbS2) compounds receive great attention due to their intriguing and diverse magnetic and electric transport properties. Typically, these compounds are prepared by high-temperature synthesis from the elements, which is time and energy-consuming and yields highly crystalline products. So far, no route for preparing these compounds from precursors by thermal decomposition has been reported. Herein, we report the synthesis of a dithiocarbamate of niobium Nb2S4(CS2NH2)4 as a precursor for the synthesis of NbS2 by this preparative strategy. Furthermore, we demonstrate that a co-decomposition with dithiocarbamates of transition metals (here, Co and Pd) is a viable route for the synthesis of TxNbS2-type compounds. This is a promising route for the exploration of these compounds’ properties in the form of, e.g., nanocrystalline or thin film samples.

Graphical Abstract

1. Introduction

Transition metal dichalcogenides (TMDCs) with the general formula MQ2 (M = Ti, Zr, Hf, Nb, Ta, Mo, W; Q = S, Se, Te) crystallize in a layered structure, in which the transition metal cation is either in an octahedral or trigonal prismatic environment of chalcogenide ions [1,2]. The layers are stacked onto each other, and depending on the transition metal and the chalcogen, the layers are separated by a van der Waals gap. For a couple of years, TMDCs have been the focus of research after the discovery of a large variety of unusual physical properties like non-saturating magnetoresistance (e.g., WTe2 [3,4], MoTe2 [5,6], HfTe2 [7,8]), Dirac or Weyl semimetal properties (e.g., WTe2 [9,10], NiTe2 [11], MoTe2 [12,13]), superconductivity [14,15,16,17] and more. Sophisticated synthetic routes for tuning the chemical and physical properties of TMDCs are intercalation or insertion of guest species into the van der Waals gaps, thus generating a host–guest complex [18,19]. The effect of intercalation or insertion leaves the structure of the host intact but alters the chemical and physical properties.
More than half a century ago, the insertion of the 3d metals Mn, Fe, Co, and Ni in the van der Waals gap of the layered compounds NbS2 and TaS2 was reported [20]. Since then, significant progress in this field has been made, as insertion with other metals has been achieved and other hosts like TiS2 [21,22], (Nb,Ta)Se2 [23] and (Zr,Hf)S2 [24,25] were identified. Those compounds are of particular interest due to their diverse magnetic and electric properties [20,26,27,28]. These properties can be tuned, typically within a reasonable range, due to the phase width that those compounds show with respect to the amount of inserted transition metal [27,29,30]. The majority of studies were performed on single crystal specimens and only a few reports on devices fabricated via micromechanical exfoliation exist [31,32,33].
An attractive route for bottom-up synthesis of nanoscaled materials is the use of precursor compounds. In the case of (Mo,W)S2, the tetrathiosalts (NH4)2MS4 are suitable compounds and allow for further chemical modification by cation exchange, e.g., with 3d-metal complexes [34,35,36]. Similar compounds are not known for Nb and Ta; however, for the former, some dithiocarbamate complexes exist [37]. Dithiocarbamate complexes are well known to be suitable precursors for the preparation of sulfides [38,39], and corresponding complexes containing, for example, Co or Ni, are straightforward to synthesize. For known Nb dithiocarbamate complexes of the general formula [Nb2S4(CS2NR2)4] (R = organic substituent, typically alkyl chain), the [Nb2S4]4+-cation is the central ion surrounded by the dithiocarbamate ligands. Yet the unsubstituted compound with R = H was not reported, although its thermal decomposition should yield pure NbS2 virtually free of impurities from the ligand. Precursors containing carbon-rich ions or ligands tend to form metal sulfides with significant carbon content, as exemplified by (NR4)2MS4 [40,41]. For thioxanthate complexes of Nb with the general formula [Nb2S4(CS2CR2)4] the formation of amorphous carbon containing NbS2 was reported to occur upon thermal decomposition at 500 °C [42]. Therefore, the known plethora of compounds bearing the [Nb2S4]4+-cation, along with other carbon or oxygen-containing ligands, appear less appealing as precursors for the preparation of pure NbS2.
Thus, a rationally designed route for 3d-metal inserted NbS2 would be the co-decomposition of [Nb2S4(CS2NH2)4] (1) and Tn+(CS2NH2)n at suitable temperatures. Herein, we demonstrate the feasibility of this route. The synthesis and characterization of the novel compound [Nb2S4(CS2NH2)4] are described, as well as the synthesis of TxNbS2 by the codecomposition route.

2. Results and Discussion

2.1. Synthesis

According to procedures described in the literature, dithiocarbamates containing the [Nb2S4]4+ cation can be prepared by treatment of (Et4N)4Nb2S4(SCN)8 with salts of the desired ligand in water or in the two-phase system water/CH2Cl2 [37]. Following both approaches, we were not able to obtain the title compound when reacting (Et4N)4Nb2S4(SCN)8 with NH4CS2NH2. The IR spectra of the solid products still showed strong bands of the NCSligand. Instead, the aqueous solution containing [Nb2S4(SCN)8]4−-anions (obtained after extraction of the product of fusing NbS2Cl2 with KSCN with water) was reacted directly with a solution of NH4CS2NH2. The reaction appears to be fast as a copious precipitate forms immediately after mixing both solutions, and the solution turns from orange to colorless. But, this product is not the title compound as evidenced by IR spectra, elemental analysis, and X-ray powder diffraction (see Figures S1 and S2 and accompanying discussion). Instead, a prolonged treatment (~20 h) with the ligand is required to ensure complete exchange of the ligands.
Initially, acetone was used to recrystallize the raw product and for single crystal growth. However, it turned out that the crystal structure (1-Acetone) from this batch contained four additional formula units of acetone and did not match the X-ray diffraction pattern obtained for the recrystallized powder (see Figure S3). Crystallization from further solvents proved methanol/water to be a suitable mixture for obtaining single crystals of the ansolvate 1. One should note that in the single crystal structure, a position for an oxygen (i.e., a water molecule) with an occupancy of 0.4 was found. However, the IR spectra for the powdered samples (vide infra) indicate the absence of any solvent.
In further experiments, it was observed that 1 can be obtained phase pure from slow evaporation of a solution in acetone in a petri dish (see Figure S3). In contrast, evaporation in a rotary evaporator leads to a phase mixture of 1 and 1-Acetone. This points to kinetic factors determining which crystalline phase grows since elevated temperature and reduced pressure should favor the ansolvate under the conditions in the rotary evaporator (Figure S4).
Co(CS2NH2)3 is a suitable precursor for the preparation of TxNbS2-type compounds by co-decomposition of precursors. The crystal structure has been reported. However, after synthesis in water, a diffraction pattern different from the reported structure [43] was observed, which could not be matched with an entry in the CSD database. It was found that this product is the monohydrate Co(CS2NH2)3·H2O. The crystal structure was solved and refined from XRPD data. The final difference plot is presented in Figure S5, along with selected results from the Rietveld refinement (Table S1).
For Pd(CS2NH2)2, no crystal structure was reported in the CSD database. The product obtained by slow evaporation from acetone showed a similar diffraction pattern as Ni(CS2NH2)2 [44]. For Pd(CS2NH2)2, a Rietveld refinement using the structure of Ni(CS2NH2)2 as a starting model was carried out successfully to refine the crystal structure. The difference plot, as well as selected details of the refinement, can be found in Figure S6 and Table S1. There are minor differences between the crystal structures of the two compounds regarding the relative orientation of the individual complexes.

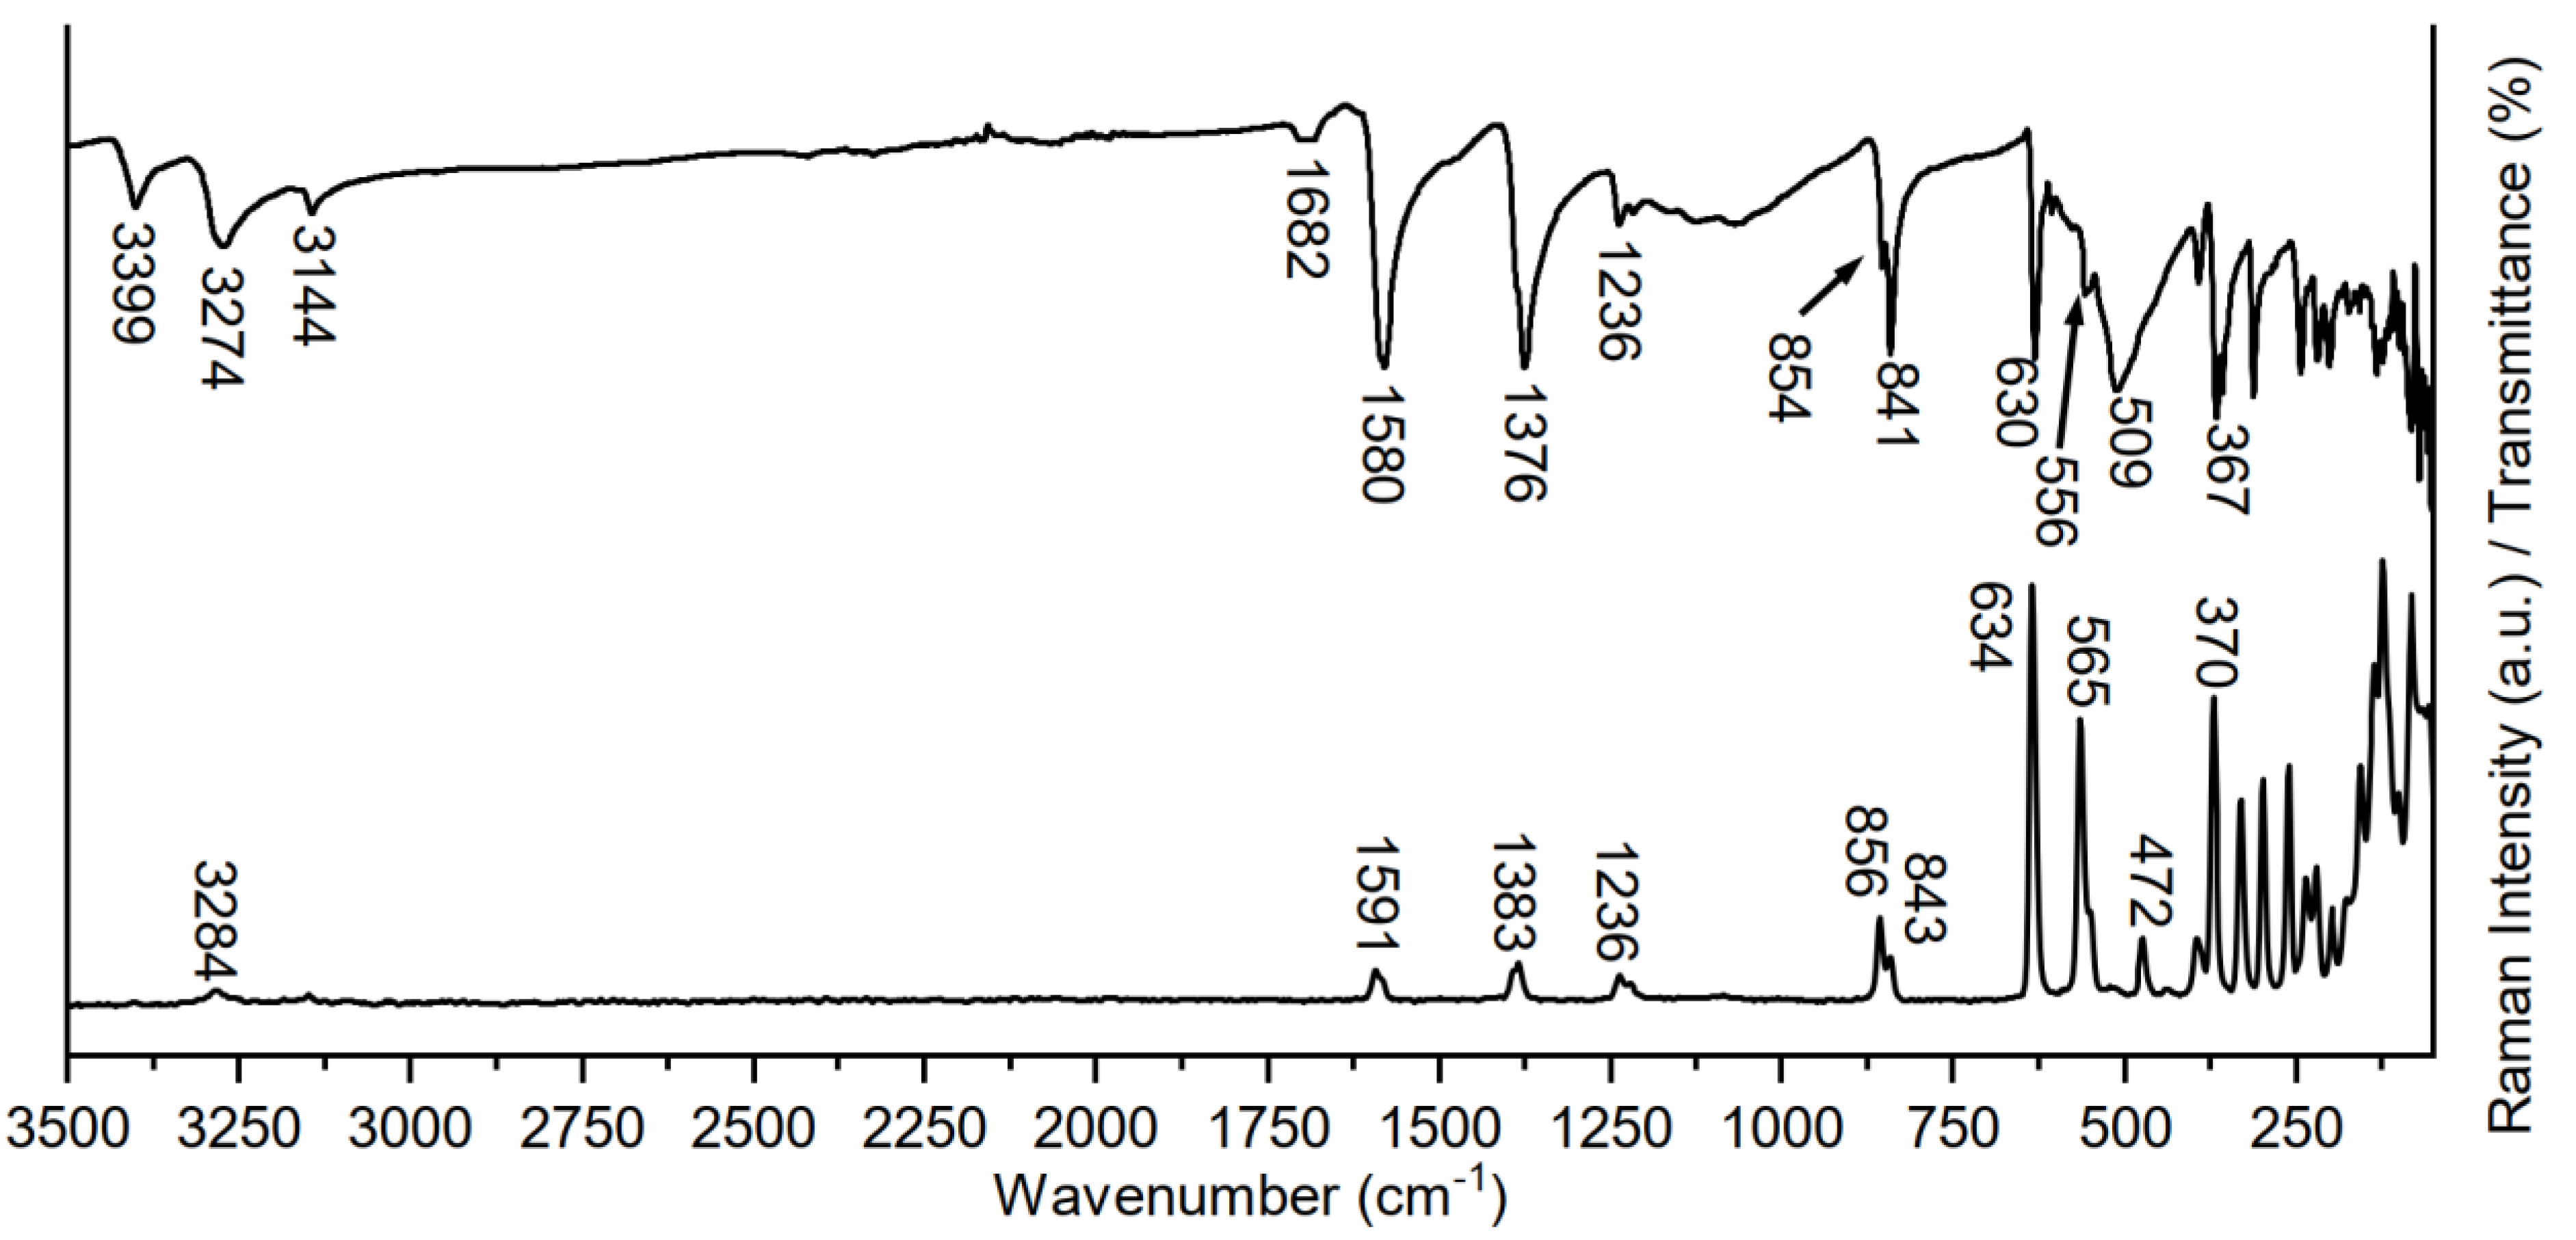
2.2. Vibrational Spectroscopy

The vibrational spectra obtained from the powder of 1 are presented in Figure 1. As outlined in the discussion of the synthetic procedure, the solution from which 1 is prepared contains the complex anion [Nb2S4(SCN)8]4−. The absence of a band in the region of 2080 cm−1 (CN stretching vibration of the NCS ligand) provides evidence for a complete exchange of these ligands. The vibrations of the dithiocarbamate ligand can be assigned to the bands at 3399, 3274, 3144 cm−1 (υ N-H), 1580 cm−1 (NH2 bending), 1376 cm−1 (C-N stretching), 840 cm−1 (C-S stretching), 1236 cm−1 and extending bands to 1050 cm−1 as well as 854 and 841 cm−1 (NH2 rocking coupled to C-S stretching), 630 cm−1 (C-S stretching) [45]. The Raman spectrum shows known characteristic bands for the [Nb2S4]4+ core with the S-S vibration at 565 cm−1 [37,42,46] and various Nb-S vibrations in the range of 370–250 cm−1.

2.3. Crystal Structures

Compound 1 crystallizes in the orthorhombic space group Pbcn with Z = 4 formula units in the unit cell. The asymmetric unit consists of one crystallographically independent Nb4+ cation, one independent [S2]2− anion, and four dithiocarbamate anions in general positions, as well as one water molecule that is located on a crystallographic mirror plane (Figure S7). The Nb cations are 8-fold coordinated by four S atoms of two dithiocarbamate anions and both S atoms of two [S2]2− anions within an irregular coordination (Table S3). Each two Nb cations are linked by two µ-1,1,2,2 bridging [S2]2− anions into discrete clusters that are located on centers of inversion (Figure 2). The geometric parameters of the Nb2S44+ core (Table S3) are in agreement with the literature data [37].
In the crystal structure, the cluster molecules are linked by intermolecular N-H···S hydrogen bonding between the dithiocarbamate S atom and the N-H hydrogen atom of a neighboring anion into layers that are parallel to the a-b plane (Figure S8 and Table S4). Within the layers the water molecules are located and hydrogen bonded to the H atoms of the dithiocarbamate molecules. There are additional intermolecular hydrogen bonds that correspond to only weak interactions.
As mentioned in Section 2.1, the crystal structure of 1-Acetone was also determined, the details of which are presented in the Supplemental Information (Figures S9 and S10 and Tables S5 and S6).

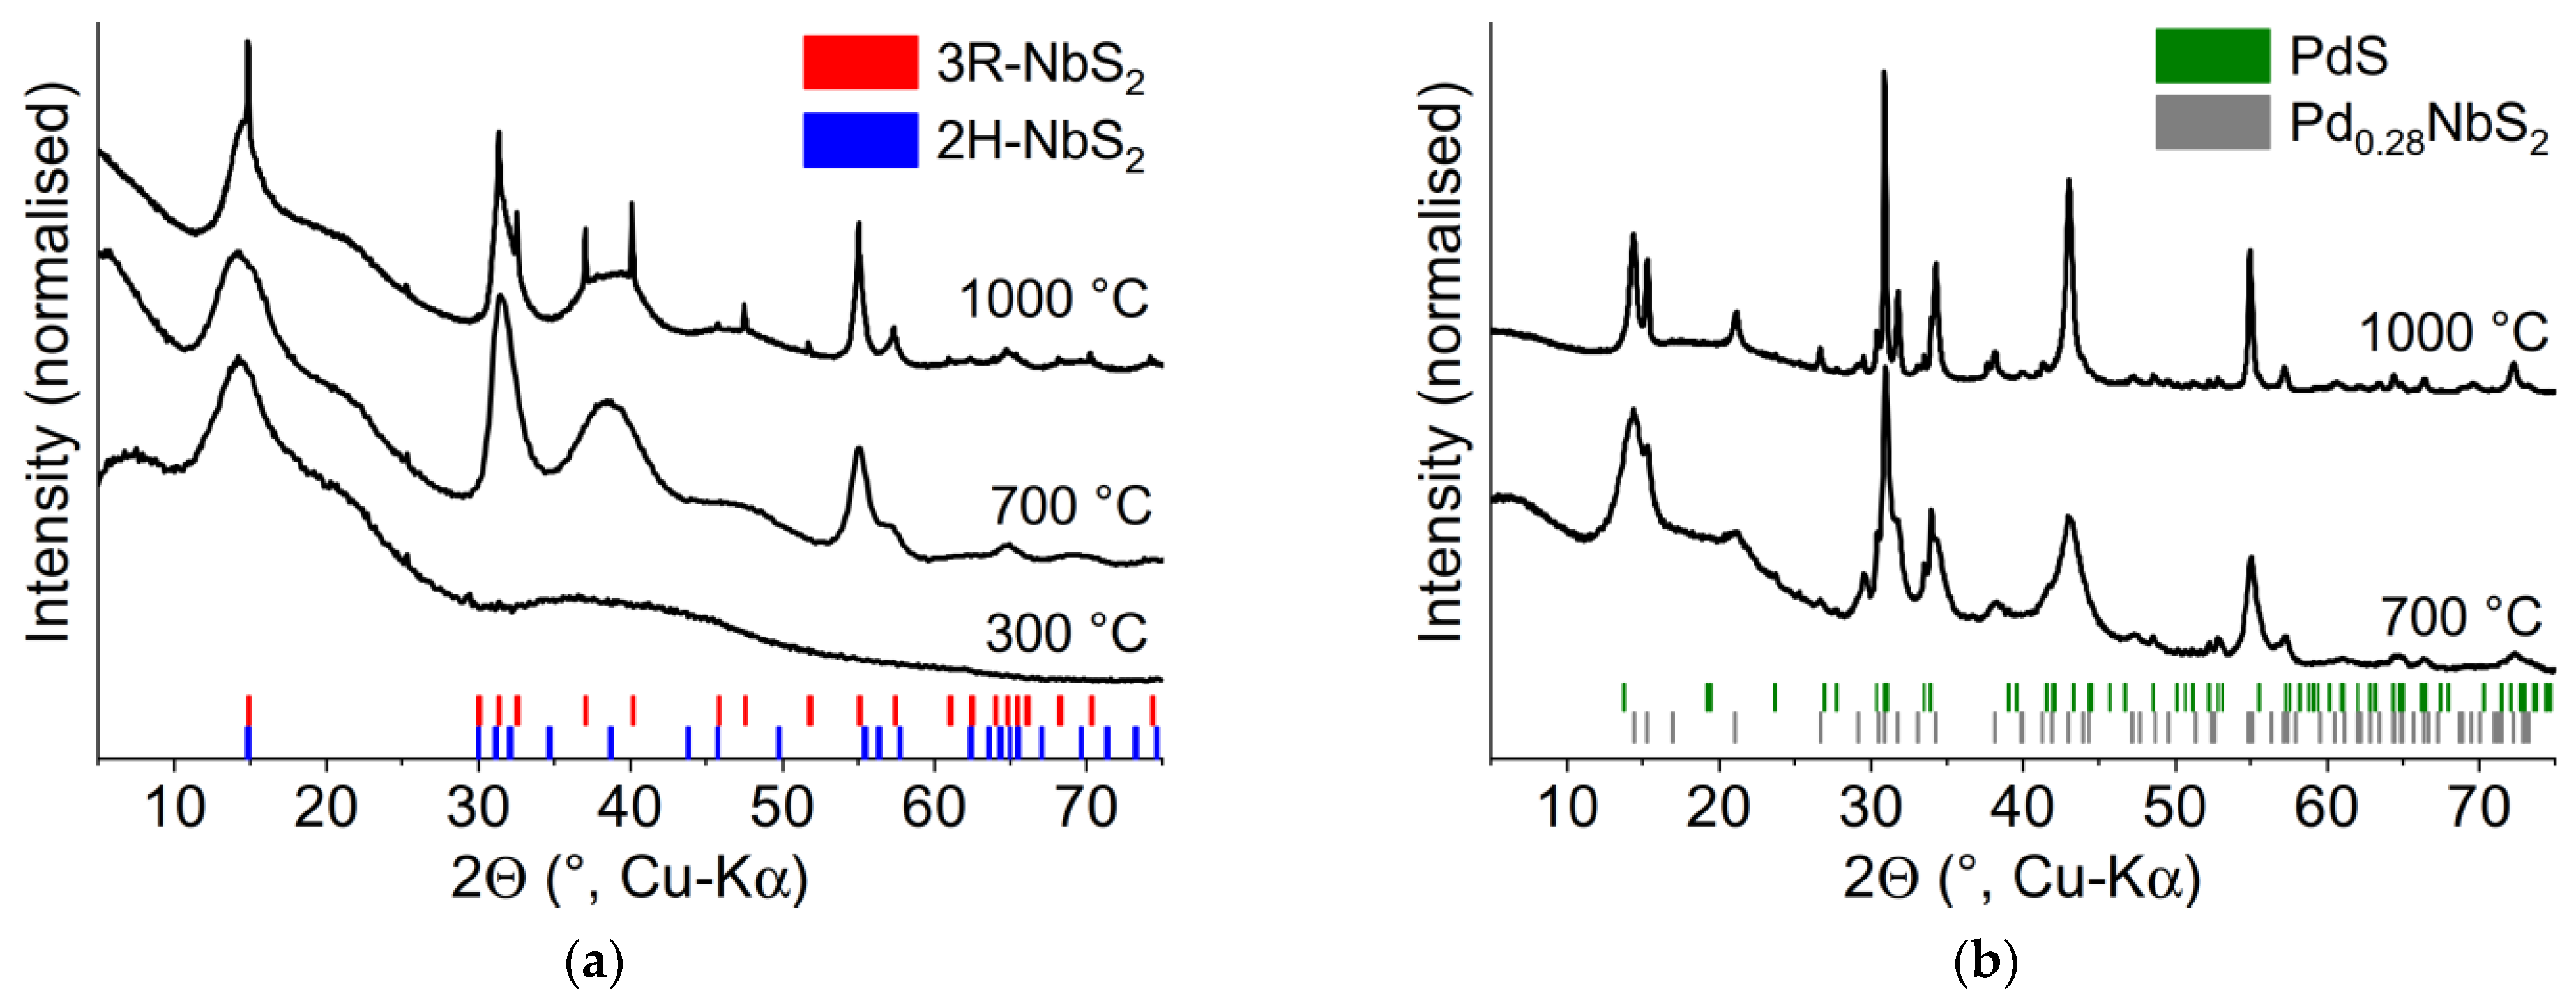
2.4. Thermal Decomposition

It is well known that metal dithiocarbamates are suitable precursors for the generation of metal sulfides. Many of these compounds thermally decompose at temperatures around 200–250 °C, frequently forming thiocyanates that transform into sulfides at even higher temperatures [38,39].
Measurements using differential thermoanalysis and thermogravimetry (DTA-TG) of 1 shows a first mass step of 42 wt.-% starting around 200 °C, with a maximum in the first derivative of the TG curve (DTG curve) at 260 °C (Figure 3a). This is accompanied by an endothermic event in the DTA curve with an onset temperature of ~210 °C and a peak temperature coinciding with the peak in the DTG curve. The expected mass loss for the formation of Nb2S4(SCN)4 as intermediate by emission of H2S would be 20 wt.-%, much lower than observed. Alternatively, the formation of NbS3 can be expected, with a theoretical mass loss of 44.6 wt.-%, which is in good agreement with the experimental value. A second, rather sluggish mass loss of 16.1% starts around 475 °C and is not completed up to 600 °C where the measurement was terminated. The mass loss is higher than expected for the removal of one formula unit of sulfur from NbS3. Analysis of the residual by XRPD showed the formation of a niobium oxide (Figure S11), despite the use of inert gas (Ar). Likely, very low residual amounts of oxygen or water in the inert gas are sufficient to cause oxide formation due to the oxophilicity of Nb.
In an attempt to learn more about the evolution of crystalline phases during thermal decomposition, we performed temperature-resolved XRPD in the range of 25–550 °C in an open glass capillary (see Figure 3b). Compound 1 remains crystalline and stable up to ~190 °C. Slightly above 200 °C, thermal decomposition is complete, and the intermediately formed product is amorphous. At 475 °C, one reflection appears, which is assigned to the same oxide phase observed after the DTA-TG experiment.
In order to test the use of 1 as a precursor for NbS2 in the absence of oxygen or moisture, a small amount (drop casted on a Si/SiO2 substrate) was decomposed in a sealed quartz ampoule at 1000 °C for 1 h. On the substrate, the NbS2 grows with a strongly preferred orientation such that the layers grow preferentially parallel to the substrate’s surface (see Figure S12 and accompanying explanation). The XRPD pattern of the resulting black powder that was scratched off the substrate is shown in Figure 4a. The sample consists mainly of 3R-NbS2 with small amounts of 2H-NbS2. The width of the diffraction lines is virtually only limited by instrumental resolution, i.e., there is no significant domain size or strain contribution. Furthermore, no signs of stacking faults (i.e., broadening of cross reflections) are evident, unlike typical synthesis of NbS2 by means of preparation from the elements at temperatures of 900–1000 °C [14,48,49,50]. The lattice parameters for 3R-NbS2 were determined via a Pawley fit to be a = 3.334(1) Å and c = 17.844(1) Å, which indicates non-stoichiometric Nb1+xS2 according to the study of Fischer et al., not surprising for a decomposition in a vacuum [50]. In a first attempt towards the synthesis of transition metal inserted NbS2, the same approach was used for a precursor mixture of 1 and Co(CS2NH2)3 with a targeted composition of Co1/3NbS2. The XRPD pattern in Figure 4b shows that the target compound was obtained, and the sharp reflections indicate an excellent crystallinity of the sample.
After this first test, a more extended series of decomposition experiments was performed in sealed quartz tubes with quantities of ~30 mg powdered precursor. Both pure 1 as well as a co-decomposition with Pd(CS2NH2)2 was tested. The latter was chosen since little has been reported experimentally on the system PdxNbS2 [51], whereas AgxNbS2 [52,53] is well known. First, we shall discuss the product evolution of decomposing pure 1 at different temperatures, and the XRPD patterns are shown in Figure 5a. A temperature of 300 °C yields an amorphous product, in line with the results from the in situ experiment (see Figure 3b). There is one broad halo located around 15° 2Θ, which could indicate some short-range order similar to amorphous WS3 [54]. After decomposition at 700 °C, the product shows broad reflections indicating domain sizes on the nanoscale. No clear assignment to either of the two known polytypes (2H and 3R type) of NbS2 can be made. The broadening of the cross-plane reflections (cf. the observed and calculated reflections around 38 and 48° 2Θ) is most pronounced, indicating the presence of severe stacking faults. The product obtained at 1000 °C shows overall sharper reflections, indicating the growth of the crystallites. Furthermore, some very sharp reflections can be observed, which can be assigned to unfaulted 3R-NbS2. The crystallinity for this part of the sample is similar to that seen in the data in Figure 4. The origin of this effect is not clear. Possibly, this is related to the exact area where the precursor was decomposed, i.e., at the wall of the ampoule or in the volume of the precursor. The precursor being dispersed on a surface vs. being in a compact volume may play a role here.
In Figure 5b, the XRPD pattern of the products of the co-decompositions are shown. Again, the product obtained after decomposition at 1000 °C shows the sharpest reflections, and two phases can be identified: A Pd inserted NbS2 and minor impurities of PdS (3.5 wt.-%, vide infra). Two additional weak reflections remained unexplained (see Figure S13). For the PdxNbS2, the best fit could be obtained with a structural model using the 2a × 2a type superstructure, well known for other transition metal inserted TMDCs [55]. For this type of superstructure, the Pd2+-cations are ordered in the interlayer space at a distance of two times the lattice parameter a of the host structure 2H-NbS2. This differs from the disordered arrangement reported previously for Pd0.23NbS2 [51] and may be related to a higher content of Pd. A detailed refinement proved the suitability of this structure model. The content of Pd was estimated using a Rietveld refinement to be Pd0.28NbS2, deviating only slightly from the ideal value of 0.25 for this superstructure type. The Pd was found to be slightly disordered in the interlayer space, with some of the Pd2+-cations residing on the second available Wyckoff position in the interlayer space (see Figure S14 for a depiction of the crystal structure). The lattice parameter c is larger compared to Pd0.23NbS2 (12.2298(8) Å vs. 12.2147(18) Å [51]), further evidencing a larger Pd-content compared to this compound. The difference plot of the refinement and details of the crystal structure can be found in Figure S13 and Tables S7 and S8. From the quantification, the ratio of Pd:Nb in the sample was calculated to be ~1:3 in agreement with the weighed precursor mixture. The formation of PdS as a side phase may either indicate an incomplete reaction or a solubility limit of Pd in PdxNbS2.
These results show the suitability of 1 as a precursor for NbS2 as well as the feasibility of synthesizing transition metal inserted NbS2 via a facile co-decomposition route. However, there are aspects that may be addressed in future work. First, the synthesis of 1 from NbS2Cl2 as starting material has an overall yield of ~25% (for Nb2S4(CS2NEt2)4 33% were reported), which leaves room for improvement. Theoretically, 1 may be obtained from NbS2Cl2 by exchange of the chloride anion by [CS2NH2] -anions since the former contains the [Nb2S4]4+ cation in the crystal structure [37,56]. The step of melting this compound in KSCN is accompanied by significant losses in the yield [37]. If the major barrier for activating NbS2Cl2 for substitution of the chloride might be the reaction in an ionic medium, then ionic liquids or deep eutectic solvents may be a future perspective for enhancing the yield.
Furthermore, the results show that 1 is suitable for synthesizing NbS2 after a short thermal treatment. It will be interesting to see how different atmospheres (e.g., flow of inert gas) will affect the microstructure of the samples. Also, the observed differences in crystallinity for the different decomposition experiments call for clarification. The results so far suggest that dispersion of the precursor on a surface favors the formation of a highly crystalline product. Hence, the directed decomposition on different substrates may affect crystallinity and may induce the preferred orientation of the crystallites. This is suggested by the decomposition experiment we carried out on the Si/SiO2 substrate that led to crystallization with a pronounced preferred orientation.
So far, we have explored temperatures as low as 700 °C for the co-decomposition. The TG-data of 1 (see Figure 3) suggests that even lower decomposition temperatures are possible. However, a more pronounced line broadening in the XRPD patterns is expected and might obscure the relatively weak superstructure reflections that characterize the insertion compounds. This question may then be answered with transmission electron microscopy and spatially resolved EDX and is left open for future work.
A major achievement of this work is the development of the co-decomposition route for the synthesis of transition metal inserted NbS2. Given these compounds’ chemical and compositional variability, this holds great potential when exploring their physical properties and applying this route to synthesize them as nanomaterials or films. The latter may be obtained when depositing mixed precursor solutions on suitable substrates with subsequent thermal treatment.
For PdxNbS2, we reported for the first time the formation of an ordered superstructure in the interlayer space. As this type of compound is only scarcely investigated, we suggest further studies on its structural properties (i.e., formation of superstructures and solubility limit of Pd) as well as its physical properties.

3. Materials and Methods

3.1. Preparations

NH4CS2NH2 was prepared according to the procedure described by Teske and Bensch [57].
NbS2Cl2: The procedure was adopted from the literature [58,59]. Nb (1.224 g, 13.2 mmol, chempur, 99.9%), NbCl5 (2.371 g, 8.8 mmol Alfa Aesar, 99.9%) and S (1.409 g, 44 mmol chempur, 99.999%) were ground and loaded in a quartz ampoule in a glove box (Ar, pO2 <1 ppm, pH2O < 1 ppm) as NbCl5 hydrolyses in humid air. The ampoule was evacuated to p < 3 × 10⁻⁴ mbar and sealed. The charge was heated to 500 °C, held there for 2 days, and cooled to room temperature. The raw product was transferred into an ampoule of 16 mm inner diameter, and chemical vapor transport was carried out in a temperature gradient of 500 °C → 400 °C. On the cold end side phase, pure NbS2Cl2 was obtained in the form of deep red crystals. The powder is of orange color.
Nb2S4(CS2NH2)4: This preparation is a variation of the procedure given by Sokolov et al., [37] NbS2Cl2 (0.5 g, 2.2 mmol)) was ground with KSCN (5.0 g, 51 mmol, dried at 160 °C) and loaded in a quartz ampoule with an inner diameter of 16 mm. After evacuation to p < 3 × 10⁻⁴ mbar, it was sealed and heated for 48 h to 180 °C. The reddish melt was well-ground and extracted with demineralized water (~15 mL). An orange solution was obtained after filtration, to which a solution of freshly prepared NH4CS2NH2 (0.727 g, 6.6 mmol) in demineralized water was added. Within seconds, a copious orange precipitate had formed, but stirring was continued for 20 h in order to complete the reaction. The orange precipitate was filtered off and washed with water. The raw product was recrystallized from acetone. Yield: ~25% based on NbS2Cl2. Elemental analysis: C 6.95 (calcd. 7.04); H 1.49 (calcd. 1.18); N 8.02 (calcd. 8.21); S 56.40 (calcd. 56.36).
Co(CS2NH2)3: CoCl2·6H2O (180 mg, 756 µmol) and NH4CS2NH2 (250 mg, 2.3 mmol) were dissolved in demineralized water each. After mixing the solution, a dark green solution formed, and instantaneously, a green precipitate formed. Stirring was continued for 2 h, after which the product was recovered by filtration and washing with demineralized water. The diffraction pattern of the raw product does not match the pattern known in the literature for Co(CS2NH2)3 [43]. Thus, the product was recrystallized from acetone, after which the proper phase was obtained. Yield: ~80%. Elemental analysis: C 12.21 (calcd. 10.19); H 2.15 (calcd. 2.28); N 12.46 (calcd. 11.89); S 56.60 (calcd. 54.44).
Pd(CS2NH2)2: K2PdCl2 (490 mg, 1.5 mmol) and NH4CS2NH2 (364 mg, 3.3 mmol) were dissolved in demineralized water each. An orange precipitate formed quickly, which was filtered off, washed with water, and dried in vacuo. The raw product was recrystallized from acetone. Yield: ~95%. Elemental analysis: C 8.67 (calcd. 8.26); H 1.59 (calcd. 1.39); N 9.73 (calcd. 9.64); S 45.29 (calcd. 44.12).
For the co-decomposition of precursors, weighed amounts of the precursors were dissolved in acetone, and the solvent was slowly evaporated in a petri dish. The precursor mixture was collected and transferred in a quartz ampoule (inner volume ~25 cm3), evacuated to p ~ 1 × 10⁻¹ mbar, and flame-sealed. The ampoule was heated to the target temperature at a rate of 100 °C/h, held there for one hour, and slowly cooled to room temperature. The resulting black powders were stored in a glove box (Ar, pO2/H2O < 1 ppm).

3.2. X-ray Powder Diffraction

Data for structure solution of Co(CS2NH2)·H2O was collected on an STOE Stadi-P diffractometer equipped with Mo-Kα1 radiation (Johansson type Ge (111) monochromator) and a Dectris MYTHEN 1K detector in Debye-Scherrer geometry. The sample was loaded in a capillary (Spezialglas Nr. 14, Hilgenberg) of 0.7 mm diameter and spun during the measurement.
All operations for structure solution and refinement were carried out in TOPAS Academic V. 6.0 [60]. Indexing using singular value decomposition [61] of the diffraction pattern of Co(CS2NH2)·H2O yielded a monoclinic cell with a = 7.1516 Å, b = 14.6611 Å, c = 11.7222 Å and β = 99.092° and the space group P21/c with only one unindexed reflection. After refining the lattice parameters, zero point error, and accounting for minor microstructural effects using a Pawley fit in the next step, charge flipping was applied to solve the structure. The sites of both cobalt and sulfur atoms could clearly be identified. In the next step, these coordinates were transferred to a real-space approach for a simulated annealing (SA) [62]. The CS2NH2 ligands were modeled as rigid bodies with bond lengths and angles taken from the literature [43]. The water molecule was modeled by a single oxygen atom that was allowed to translate freely during the SA run. The structure could quickly be solved, and in the final refinement, all parameters (zero point error, lattice parameters, microstructure, atomic coordinates, S-C-S angle of the dithiocarbamate, and Biso values) could be refined stably. The details of the final refinement can be found in Table S1. The final difference plot is displayed in Figure S5.
The XRPD pattern of the decomposition products was measured on a Panalytical Empyrean diffractometer equipped with Cu-Kα radiation, a focusing X-ray mirror, and a PIXcel 1D detector in transmission geometry. The samples were kept between two sheets of Scotch® tape. The patterns of the samples obtained by decomposition on Si/SiO2 wafers were measured on an STOE Stadi-P diffractometer equipped with Cu-Kα1 radiation (Johansson type Ge (111) monochromator) and a Dectris MYTHEN 1K detector on Debye–Scherrer geometry.
The XRPD pattern of the decomposed precursor 1 on a Si/SiO2 substrate was recorded on a Panalytical X’Pert Pro MPD equipped with Cu-Kα radiation, a Göbel mirror, parallel plate collimator and PIXcel 1D detector in Bragg–Brentano geometry. The sample was held on stage for flat samples.
The temperature-resolved XRPD data was collected on an STOE Stadi-P diffractometer equipped with Cu-Kα1 radiation (Johansson type Ge (111) monochromator) and a Dectris MYTHEN 1K detector in Debye–Scherrer geometry. The samples were loaded in 0.5 mm thick quartz capillaries, heated in an STOE capillary furnace, and spun during the measurement. The temperature increments were 25 °C per step, and each measurement took ~2 h.

3.3. Single Crystal X-ray Analysis

The data collections were performed using a XtaLAB Synergy, Dualflex, HyPix diffractometer from Rigaku [63] and an Imaging Plate Diffraction System (IPDS-2) from STOE & CIE [64] with MoKα-radiation (λ = 0.71073 Å). For compound 1, a multi-scan absorption correction was performed using CrysAlisPro Field [63] using spherical harmonics, which were implemented in the SCALE3 ABSPACK scaling algorithm. For compound 1-Acetone, a numerical absorption correction was performed using X-Red and X-Shape as part of the program package X-Area [64]. The structures were solved with SHELXT [65] and refined using SHELXL-2016 [66] and SHELXL-2018 [66]. All atoms were refined anisotropic. The C--H and N-H H atoms were initially located in a difference map but finally positioned with idealized geometry (methyl H atoms allowed to rotate but not to tip) and refined isotropic with Uiso(H) = 1.2 Ueq(C,N) (1.5 for methyl H atoms) using a riding model. The O atom in the compound is not fully occupied. Its H atom was located in a difference map, its distance was set to ideal values, and finally, it was refined isotropic with Uiso(H) = 1.5 Ueq(O) using a riding model.
CCDC 2303610 (1), CCDC 2303609 (1-Acetone), CCDC 2303611 (Co(CS2NH2)3·H2O) and CCDC 2303612 (Pd(CS2NH2)2) contain the supplementary crystallographic data for this paper. These data can be obtained free of charge from the Cambridge Crystallographic Data Centre via http://www.ccdc.cam.ac.uk/data_request/cif.

4. Conclusions

In this work, we established the synthesis of the title compound Nb2S4(CS2NH2)4. It proved to be thermally labile above 200 °C and thus is suitable as a precursor for synthesizing NbS2 by thermal decomposition. Furthermore, the co-decomposition with dithiocarbamates of Co and Pd proved a viable route for the rapid synthesis of NbS2 inserted with these metals. This opens up an intriguing route for synthesizing these compounds as thin films or nanomaterials and exploring their physical properties in this state of matter.
Furthermore, we observed for the first time the formation of an ordered superstructure for Pd0.28NbS2, which calls for a more extensive investigation of the structural and physical properties of this type of compound.

Supplementary Materials

The following supporting information can be downloaded at https://www.mdpi.com/article/10.3390/inorganics11120478/s1.

Author Contributions

Conceptualization, S.M. and W.B.; investigation, S.M., C.N. and P.Z.; writing—original draft preparation, S.M. and C.N.; writing—review and editing, S.M., C.N. and W.B.; visualization, S.M. and C.N. All authors have read and agreed to the published version of the manuscript.

Funding

This research was funded by the federal state of Schleswig Holstein and the DFG under Grant No. BE1653/35-1.

Data Availability Statement

CCDC 2303610 (1), CCDC 2303609 (1-Acetone), CCDC 2303611 (Co(CS2NH2)3·H2O), and CCDC 2303612 (Pd(CS2NH2)2) contain the supplementary crystallographic data for this paper. These data can be obtained free of charge from the Cambridge Crystallographic Data Centre via http://www.ccdc.cam.ac.uk/data_request/cif.

Conflicts of Interest

The authors declare no conflict of interest.

References

  1. Wilson, J.A.; Yoffe, A.D. The Transition Metal Dichalcogenides Discussion and Interpretation of the Observed Optical, Electrical and Structural Properties. Adv. Phys. 1969, 18, 193–335. [Google Scholar] [CrossRef]
  2. Katzke, H.; Tolédano, P.; Depmeier, W. Phase Transitions between Polytypes and Intralayer Superstructures in Transition Metal Dichalcogenides. Phys. Rev. B 2004, 69, 134111. [Google Scholar] [CrossRef]
  3. Ali, M.N.; Xiong, J.; Flynn, S.; Tao, J.; Gibson, Q.D.; Schoop, L.M.; Liang, T.; Haldolaarachchige, N.; Hirschberger, M.; Ong, N.P.; et al. Large, Non-Saturating Magnetoresistance in WTe2. Nature 2014, 514, 205–208. [Google Scholar] [CrossRef] [PubMed]
  4. Luo, Y.; Li, H.; Dai, Y.M.; Miao, H.; Shi, Y.G.; Ding, H.; Taylor, A.J.; Yarotski, D.A.; Prasankumar, R.P.; Thompson, J.D. Hall Effect in the Extremely Large Magnetoresistance Semimetal WTe2. Appl. Phys. Lett. 2015, 107, 182411. [Google Scholar] [CrossRef]
  5. Chen, F.C.; Lv, H.Y.; Luo, X.; Lu, W.J.; Pei, Q.L.; Lin, G.T.; Han, Y.Y.; Zhu, X.B.; Song, W.H.; Sun, Y.P. Extremely Large Magnetoresistance in the Type-II Weyl Semimetal MoTe2. Phys. Rev. B 2016, 94, 235154. [Google Scholar] [CrossRef]
  6. Thirupathaiah, S.; Jha, R.; Pal, B.; Matias, J.S.; Das, P.K.; Sivakumar, P.K.; Vobornik, I.; Plumb, N.C.; Shi, M.; Ribeiro, R.A.; et al. MoTe2: An Uncompensated Semimetal with Extremely Large Magnetoresistance. Phys. Rev. B 2017, 95, 241105. [Google Scholar] [CrossRef]
  7. Mangelsen, S.; Naumov, P.G.; Barkalov, O.I.; Medvedev, S.A.; Schnelle, W.; Bobnar, M.; Mankovsky, S.; Polesya, S.; Näther, C.; Ebert, H.; et al. Large Nonsaturating Magnetoresistance and Pressure-Induced Phase Transition in the Layered Semimetal HfTe2. Phys. Rev. B 2017, 96, 205148. [Google Scholar] [CrossRef]
  8. Mangelsen, S.; Bensch, W. HfTe2: Enhancing Magnetoresistance Properties by Improvement of the Crystal Growth Method. Inorg. Chem. 2020, 59, 1117–1124. [Google Scholar] [CrossRef]
  9. Pletikosić, I.; Ali, M.N.; Fedorov, A.V.; Cava, R.J.; Valla, T. Electronic Structure Basis for the Extraordinary Magnetoresistance in WTe2. Phys. Rev. Lett. 2014, 113, 216601. [Google Scholar] [CrossRef]
  10. Wu, Y.; Mou, D.; Jo, N.H.; Sun, K.; Huang, L.; Bud’ko, S.L.; Canfield, P.C.; Kaminski, A. Observation of Fermi Arcs in the Type-II Weyl Semimetal Candidate WTe2. Phys. Rev. B 2016, 94, 121113. [Google Scholar] [CrossRef]
  11. Xu, C.; Li, B.; Jiao, W.; Zhou, W.; Qian, B.; Sankar, R.; Zhigadlo, N.D.; Qi, Y.; Qian, D.; Chou, F.-C.; et al. Topological Type-II Dirac Fermions Approaching the Fermi Level in a Transition Metal Dichalcogenide NiTe2. Chem. Mater. 2018, 30, 4823–4830. [Google Scholar] [CrossRef]
  12. Sun, Y.; Wu, S.-C.; Ali, M.N.; Felser, C.; Yan, B. Prediction of Weyl Semimetal in Orthorhombic MoTe2. Phys. Rev. B 2015, 92, 161107. [Google Scholar] [CrossRef]
  13. Deng, K.; Wan, G.; Deng, P.; Zhang, K.; Ding, S.; Wang, E.; Yan, M.; Huang, H.; Zhang, H.; Xu, Z.; et al. Experimental Observation of Topological Fermi Arcs in Type-II Weyl Semimetal MoTe2. Nat. Phys. 2016, 12, 1105–1110. [Google Scholar] [CrossRef]
  14. Witteveen, C.; Górnicka, K.; Chang, J.; Månsson, M.; Klimczuk, T.; Rohr, F.O. von Polytypism and Superconductivity in the NbS2 System. Dalton Trans. 2021, 50, 3216–3223. [Google Scholar] [CrossRef] [PubMed]
  15. Castro Neto, A.H. Charge Density Wave, Superconductivity, and Anomalous Metallic Behavior in 2D Transition Metal Dichalcogenides. Phys. Rev. Lett. 2001, 86, 4382–4385. [Google Scholar] [CrossRef] [PubMed]
  16. Dutta, U.; Malavi, P.S.; Sahoo, S.; Joseph, B.; Karmakar, S. Pressure-Induced Superconductivity in Semimetallic 1T-TiTe2 and Its Persistence upon Decompression. Phys. Rev. B 2018, 97, 060503. [Google Scholar] [CrossRef]
  17. Klemm, R.A. Pristine and Intercalated Transition Metal Dichalcogenide Superconductors. Phys. C 2015, 514, 86–94. [Google Scholar] [CrossRef]
  18. Marseglia, E.A. Transition Metal Dichalcogenides and Their Intercalates. Int. Rev. Phys. Chem. 1983, 3, 177–216. [Google Scholar] [CrossRef]
  19. Lerf, A. Storylines in Intercalation Chemistry. Dalton Trans. 2014, 43, 10276–10291. [Google Scholar] [CrossRef]
  20. Parkin, S.S.P.; Friend, R.H. 3d Transition-Metal Intercalates of the Niobium and Tantalum Dichalcogenides. I. Magnetic Properties. Philos. Mag. B 1980, 41, 65–93. [Google Scholar] [CrossRef]
  21. Inoue, M.; Hughes, H.P.; Yoffe, A.D. The Electronic and Magnetic Properties of the 3d Transition Metal Intercalates of TiS2. Adv. Phys. 1989, 38, 565–604. [Google Scholar] [CrossRef]
  22. Koyano, M.; Horisaka, S.; Negishi, H.; Sasaki, M.; Inoue, M.; Suzuki, N.; Motizuki, K. Magnetic Scattering of Conduction Carriers in 3d Transition-Metal Intercalates of MxTiS2 (M = Mn, Fe, Co, and Ni). J. Low Temp. Phys. 1990, 78, 141–154. [Google Scholar] [CrossRef]
  23. Voorhoeve, J.M.; van den Berg, N.; Robbins, M. Intercalation of the Niobium-Diselenide Layer Structure by First-Row Transition Metals. J. Solid State Chem. 1970, 1, 134–137. [Google Scholar] [CrossRef]
  24. Yacobi, B.G.; Boswell, F.W.; Corbett, J.M. The Fundamental Absorption Edge in NixZrS2. Mater. Res. Bull. 1979, 14, 1033–1038. [Google Scholar] [CrossRef]
  25. Buhannic, M.; Danot, M. Iron Migration in the Van Der Waals Gap of Zirconium Disulfide: Time Evolution of the FexZrS2 Compounds. Solid State Commun. 1990, 73, 739–742. [Google Scholar] [CrossRef]
  26. Parkin, S.S.P.; Friend, R.H. 3d Transition-Metal Intercalates of the Niobium and Tantalum Dichalcogenides. II. Transport Properties. Philos. Mag. B 1980, 41, 95–112. [Google Scholar] [CrossRef]
  27. Chen, C.-W.; Chikara, S.; Zapf, V.S.; Morosan, E. Correlations of Crystallographic Defects and Anisotropy with Magnetotransport Properties in FexTaS2 Single Crystals 0.23 ≤ x ≤ 0.35. Phys. Rev. B 2016, 94, 054406. [Google Scholar] [CrossRef]
  28. Inoshita, T.; Hirayama, M.; Hamada, N.; Hosono, H.; Murakami, S. Topological Semimetal Phases Manifested in Transition Metal Dichalcogenides Intercalated with 3d Metals. Phys. Rev. B 2019, 100, 121112. [Google Scholar] [CrossRef]
  29. Maniv, E.; Nair, N.L.; Haley, S.C.; Doyle, S.; John, C.; Cabrini, S.; Maniv, A.; Ramakrishna, S.K.; Tang, Y.-L.; Ercius, P.; et al. Antiferromagnetic Switching Driven by the Collective Dynamics of a Coexisting Spin Glass. Sci. Adv. 2021, 7, eabd8452. [Google Scholar] [CrossRef]
  30. Le Blanc-Soreau, A.; Rouxel, J.; Gardette, M.-F.; Gorochov, O. Proprietes electriques et magnetiques de Mn0,25NbS2 et Mn0,33NbS2. Mater. Res. Bull. 1976, 11, 1061–1071. [Google Scholar] [CrossRef]
  31. Yamasaki, Y.; Moriya, R.; Arai, M.; Masubuchi, S.; Pyon, S.; Tamegai, T.; Ueno, K.; Machida, T. Exfoliation and van Der Waals Heterostructure Assembly of Intercalated Ferromagnet Cr1/3TaS2. 2D Mater. 2017, 4, 041007. [Google Scholar] [CrossRef]
  32. Arai, M.; Moriya, R.; Yabuki, N.; Masubuchi, S.; Ueno, K.; Machida, T. Construction of van Der Waals Magnetic Tunnel Junction Using Ferromagnetic Layered Dichalcogenide. Appl. Phys. Lett. 2015, 107, 103107. [Google Scholar] [CrossRef]
  33. Danz, T.; Liu, Q.; Zhu, X.D.; Wang, L.H.; Cheong, S.W.; Radu, I.; Ropers, C.; Tobey, R.I. Structural and Magnetic Characterization of Large Area, Free-Standing Thin Films of Magnetic Ion Intercalated Dichalcogenides Mn0.25TaS2 and Fe0.25TaS2. J. Phys. Condens. Matter 2016, 28, 356002. [Google Scholar] [CrossRef] [PubMed]
  34. Ellermeier, J.; Näther, C.; Bensch, W. Tris(Ethylenediamine-N,N’)Nickel(II) Tetrathiomolybdate. Acta Crystallogr. Sect. C Cryst. Struct. Commun. 1999, 55, 501–503. [Google Scholar] [CrossRef]
  35. Ellermeier, J.; Stähler, R.; Bensch, W. Two New [Ni(Tren)2]2+ Complexes: [Ni(Tren)2]Cl2 and [Ni(Tren)2]WS4. Acta Crystallogr. Sect. C Cryst. Struct. Commun. 2002, 58, m70–m73. [Google Scholar] [CrossRef]
  36. Ellermeier, J.; Bensch, W. Solvothermal Syntheses, Crystal Structures and Properties of Thiomolybdates with Complex Transition Metal Cations. Z. Naturforsch. B J. Chem. Sci. 2001, 56, 611–619. [Google Scholar] [CrossRef]
  37. Sokolov, M.; Virovets, A.; Nadolinnyi, V.; Hegetschweiler, K.; Fedin, V.; Podberezskaya, N.; Fedorov, V. Nb2S24+ Complexes with 1,1-Dithioacid Ligands. Inorg. Chem. 1994, 33, 3503–3509. [Google Scholar] [CrossRef]
  38. Sengupta, S.K.; Kumar, S. Thermal Studies on Metal Dithiocarbamato Complexes. A Review. Thermochim. Acta 1984, 72, 349–361. [Google Scholar] [CrossRef]
  39. Sharma, A.K. Thermal Behaviour of Metal-Dithiocarbamates. Thermochim. Acta 1986, 104, 339–372. [Google Scholar] [CrossRef]
  40. Poisot, M.; Bensch, W.; Fuentes, S.; Alonso, G. Decomposition of Tetra-Alkylammonium Thiomolybdates Characterised by Thermoanalysis and Mass Spectrometry. Thermochim. Acta 2006, 444, 35–45. [Google Scholar] [CrossRef]
  41. Poisot, M.; Bensch, W. Decomposition of Tetraalkylammonium Thiotungstates Characterized by Thermoanalysis, Mass Spectrometry, X-Ray Diffractometry and Scanning Electron Microscopy. Thermochim. Acta 2007, 453, 42–51. [Google Scholar] [CrossRef]
  42. Sokolov, M.N.; Rogachev, A.V.; Abramov, P.A.; Fedin, V.P. Thioxanthate Complexes of {Nb2S4}4+. Polyhedron 2015, 85, 727–731. [Google Scholar] [CrossRef]
  43. Raston, C.L.; White, A.H.; Willis, A.C. Crystal Structure of Tris(Dithiocarbamato)Cobalt(III). J. Chem. Soc. Dalton Trans. 1975, 2429–2432. [Google Scholar] [CrossRef]
  44. Gasparri, G.F.; Nardelli, M.; Villa, A. The Crystal and Molecular Structure of Nickel Bis(Dithiocarbamate). Acta Cryst. 1967, 23, 384–391. [Google Scholar] [CrossRef]
  45. Nakamoto, K.; Fujita, J.; Condrate, R.A.; Morimoto, Y. Infrared Spectra of Metal Chelate Compounds. IX. A Normal Coordinate Analysis of Dithiocarbamato Complexes. J. Chem. Phys. 1963, 39, 423–427. [Google Scholar] [CrossRef]
  46. Rijnsdorp, J.; Haas, C. Fine Structure in the Absorption Edge Spectrum of NbS2Y2 (Y = Cl, Br, I). J. Phys. Chem. Solids 1980, 41, 375–384. [Google Scholar] [CrossRef]
  47. Kato, K.; Tamura, S. Die Kristallstruktur von T-Nb2O5. Acta Crystallogr. Sect. B Struct. Crystallogr. Cryst. Chem. 1975, 31, 673–677. [Google Scholar] [CrossRef]
  48. Jellinek, F.; Brauer, G.; Müller, H. Molybdenum and Niobium Sulphides. Nature 1960, 185, 376–377. [Google Scholar] [CrossRef]
  49. Katzke, H. Stacking Disorder in 2H-NbS2 and Its Intercalation Compounds Kx(H2O)yNbS2 I. Description and Model Calculations of Stacking Faults in the Host Lattice NbS2. Z. Kristallogr. Cryst. Mater. 2009, 217, 127–130. [Google Scholar] [CrossRef]
  50. Fisher, W.G.; Sienko, M.J. Stoichiometry, Structure, and Physical Properties of Niobium Disulfide. Inorg. Chem. 1980, 19, 39–43. [Google Scholar] [CrossRef]
  51. Huang, C.; Wang, X.; Wang, D.; Zhao, W.; Bu, K.; Xu, J.; Huang, X.; Bi, Q.; Huang, J.; Huang, F. Atomic Pillar Effect in PdxNbS2 To Boost Basal Plane Activity for Stable Hydrogen Evolution. Chem. Mater. 2019, 31, 4726–4731. [Google Scholar] [CrossRef]
  52. Wiegers, G.A.; Haange, R.J.; van Bolhuis, F. The Crystal Structure of Stage-2 4H-Ag0.22NbS2. Phys. Status Solidi A 1988, 107, 817–824. [Google Scholar] [CrossRef]
  53. Van der Lee, A.; van Smaalen, S.; Wiegers, G.A.; de Boer, J.L. Order-Disorder Transition in Silver-Intercalated Niobium Disulfide Compounds. I. Structural Determination of Ag0.6NbS2. Phys. Rev. B 1991, 43, 9420–9430. [Google Scholar] [CrossRef] [PubMed]
  54. Mangelsen, S.; Srinivasan, B.R.; Schürmann, U.; Kienle, L.; Näther, C.; Bensch, W. Nanostructured Tungsten Sulfides: Insights into Precursor Decomposition and the Microstructure Using X-Ray Scattering Methods. Dalton Trans. 2019, 48, 1184–1201. [Google Scholar] [CrossRef] [PubMed]
  55. Van den Berg, J.M.; Cossee, P. Structural Aspects and Magnetic Behaviour of NbS2 and TaS2 Containing Extra Metal Atoms of the First Transition Series. Inorg. Chim. Acta 1968, 2, 143–148. [Google Scholar] [CrossRef]
  56. Rijnsdorp, J.; de Lange, G.J.; Wiegers, G.A. Preparation, Structures, and Properties of Niobium Chalcogenide Halides, NbX2Y2 (X = S, Se; Y = Cl, Br, I). J. Solid State Chem. 1979, 30, 365–373. [Google Scholar] [CrossRef]
  57. Teske, C.L.; Bensch, W. On Crystal Structure Investigations of α- and β-Ammoniumdithiocarbamate NH4CS2NH2 and the Role of Hydrogen Bonding. Z. Anorg. Allg. Chem. 2010, 636, 356–362. [Google Scholar] [CrossRef]
  58. Schäfer, H.; Beckmann, W. Beiträge Zur Chemie der Elemente Niob und Tantal. LIV. Sulfid- und Selenidhalogenide des Niobs. Z. Anorg. Allg. Chem. 1966, 347, 225–230. [Google Scholar] [CrossRef]
  59. Schnering, H.G.v.; Beckmann, W. Beiträge zur Chemie der Elemente Niob und Tantal. LV. Die Kristallstruktur von NbS2Cl2. Z. Anorg. Allg. Chem. 1966, 347, 231–239. [Google Scholar] [CrossRef]
  60. Coelho, A.A. TOPAS and TOPAS-Academic: An Optimization Program Integrating Computer Algebra and Crystallographic Objects Written in C++. J. Appl. Cryst. 2018, 51, 210–218. [Google Scholar] [CrossRef]
  61. Coelho, A.A. Indexing of Powder Diffraction Patterns by Iterative Use of Singular Value Decomposition. J. Appl. Cryst. 2003, 36, 86–95. [Google Scholar] [CrossRef]
  62. Coelho, A.A. Whole-Profile Structure Solution from Powder Diffraction Data Using Simulated Annealing. J. Appl. Cryst. 2000, 33, 899–908. [Google Scholar] [CrossRef]
  63. CrysAlis PRO, version 171.43, Program Package for Crystal Structure Determinations; Rigaku: Wroclow, Poland, 2020.
  64. X-Area, Version 1.44, Program Package for Crystal Structure Determinations; STOE & Cie GmbH: Darmstadt, Germany, 2002.
  65. Sheldrick, G.M. SHELXT—Integrated Space-Group and Crystal-Structure Determination. Acta Crystallogr. Sect. A Found. Adv. 2015, 71, 3–8. [Google Scholar] [CrossRef] [PubMed]
  66. Sheldrick, G.M. Crystal Structure Refinement with SHELXL. Acta Crystallogr. Sect. C Struct. Chem. 2015, 71, 3–8. [Google Scholar] [CrossRef]
Figure 1. Infrared and Raman spectra of Nb2S4(CS2NH2)4.
Inorganics 11 00478 g001
Figure 2. Excerpt of the crystal structure of compound 1 with a view of the cluster molecule.
Inorganics 11 00478 g002
Figure 3. (a) DTA-TG curve for 1 in the range of 30–600 °C. Additionally, the DTG curve is shown (top trace). (b) Temperature resolved XRPD data of 1. Above 200 °C, the sample is amorphous, and from ~475 °C, crystalline Nb16.8O42 [47] can be observed.
Inorganics 11 00478 g003
Figure 4. (a) XRPD pattern of the product of the decomposition of 1 at 1000 °C deposited on a Si/SiO2 substrate. The tick marks for 2H- and 3R-NbS2 indicate the latter as the main phase, aside from a small amount of 2H-NbS2. (b) Comparison of the calculated (Co1/3NbS2) and observed XRPD pattern of the product obtained by co-decomposition of 1 and Co(CS2NH2)3 by the same approach.
Inorganics 11 00478 g004
Figure 5. (a) XRPD pattern of the decomposition products of 30 mg of 1 in a sealed quartz ampoule at temperatures as indicated. (b) XRPD pattern of the decomposition products after co-decomposition of 1 and Pd(CS2NH2)2. Vertical bars indicate the positions of Bragg reflections.
Inorganics 11 00478 g005
Disclaimer/Publisher’s Note: The statements, opinions and data contained in all publications are solely those of the individual author(s) and contributor(s) and not of MDPI and/or the editor(s). MDPI and/or the editor(s) disclaim responsibility for any injury to people or property resulting from any ideas, methods, instructions or products referred to in the content.

