Article

Co, Cu, Fe, and Ni Deposited over TiO2 and Their Photocatalytic Activity in the Degradation of 2,4-Dichlorophenol and 2,4-Dichlorophenoxyacetic Acid

by
Isaias Limón-Rocha
1,
Adriana Marizcal-Barba
1,
C. A. Guzmán-González
2,
Luis M. Anaya-Esparza
3,
Suresh Ghotekar
4,
O. A. González-Vargas
5 and
A. Pérez-Larios
1,*
1
Research Laboratory in Nanomaterials, Water and Energy, Engineering Department, University of Guadalajara, Campus Altos, Tepatitlán de Morelos 47600, Jalisco, Mexico
2
Department of Applied Basic Sciences, University of Guadalajara, Campus Tonalá, Tonalá 45425, Jalisco, Mexico
3
Department of Livestock and Agricultural Sciences, University of Guadalajara, Campus Altos, Tepatitlán de Morelos 47600, Jalisco, Mexico
4
Department of Chemistry, Smt. Devkiba Mohansinshji Chauhan College of Commerce & Science, University of Mumbai, Silvassa 396 230, Dadra and Nagar Haveli (UT), India
5
Departamento de Ingeniería en Control y Automatización, ESIME-Zacatenco, Instituto Politécnico Nacional, UPALM, Av. Politécnico s/n, Col., Zacatenco, Alcadía Gustavo A. Madero 07738, Ciudad de México, Mexico
*
Author to whom correspondence should be addressed.
Inorganics 2022, 10(10), 157; https://doi.org/10.3390/inorganics10100157
Submission received: 1 August 2022 / Revised: 6 September 2022 / Accepted: 7 September 2022 / Published: 27 September 2022
(This article belongs to the Special Issue Nanocomposites for Photocatalysis)

Abstract

:
Pure TiO2 synthesized by the sol-gel method and subsequently deposited at 5% by weight with Co, Cu, Fe, and Ni ions by the deposition–precipitation method was studied as photocatalysts. The nanomaterials were analyzed by SEM, TEM, UV-Vis DRS, DRX, Physisorption N2, and XPS. The SEM and TEM images present a semi-spherical shape with small agglomerations of particles and average size between 63 and 65 nm. UV-Vis results show that a reduction below 3.2 eV exhibits a redshift displacement and increment in the optical absorption of the nanoparticles promoting the absorption in the UV-visible region. XRD spectra and analysis SAED suggest the characteristic anatase phase in TiO2 and deposited materials according to JCPDS 21-1272. The specific surface area was calculated and the nanomaterial Ni/TiO2 (21.3 m2 g−1) presents a slight increment when comparing to TiO2 (20.37 m2g−1). The information generated by the XPS spectra present the deposition of metallic ions on the support and the presence of different valence states for each photocatalyst. The photocatalytic activity was carried out in an aqueous solution with 80 mg L−1 of 2,4-D or 2,4-DCP under UV light (285 nm) with 100 mg L−1 of each photocatalysts for 360 min. The nanomaterial that presented the best efficiency was Ni/TiO2, obtaining a degradation of 85.6% and 90.3% for 2,4-D and 2,4-DCP, respectively. Similarly, this material was the one that presented the highest mineralization, 68.3% and 86.5% for 2,4-D and 2,4-DCP, respectively. Photocatalytic reactions correspond to the pseudo-first-order Langmuir–Hinshelwood model.

1. Introduction

Chlorophenols are a group of pollutants commonly found in wastewater and represent a health concern due to their toxicity, chemical stability, and low biodegradability [1]. 2,4-dichlorophenoxyacetic acid (2,4-D) and 2,4-dichlorophenol (2,4-DCP) have been reported as priority pollutants by the Environmental Protection Agency (EPA) and World Health Organization (WHO) for the damage caused to human health and the environment [2,3]. These compounds are widely used in the development of personal care, textile, petrochemical, and agricultural products [4,5]. Mountassif et al. observed a bioaccumulation of 2,4-D (91.7%) in the water since not being absorbed into the soil; this is in accordance with high level reports of organic compounds from various countries [6]. In Mexico, these have been used mainly as material for the production of insecticides, pesticides, and herbicides [7,8]. For its part, a study carried out in 2006 in Chapala and Sayula Lakes by Reynoso Silva et al. report on the 2006 drought, a concentration 10 times higher (0.02 ppm) in Chapala compared to Sayula (0.002 ppm) in the liver of Goodea atripinnis, a species of fish endemic to the area. In that same year, in the rainy season, a concentration of 0.05 ppm is identified in Chapala and 0.05 ppm in Sayula due to the agricultural activity [9]. The use of conventional methods for the removal of pollutants in water have been investigated, and their residuals are removed with complementary treatments [10,11].
In the last decade, the Advanced Oxidation Processes (AOPs) technologies and heterogeneous photocatalysis have emerged as an efficient alternative for wastewater treatment through the use of photocatalysts such as CdS, ZnO, ZnS, Fe2O3, WO3, and TiO2 [12,13,14]. TiO2 is a good photocatalyst due to its chemical stability, nontoxicity, low-cost, abundance, and acceptable efficiency for the degradation of pollutants in water. However, its wide band gap (~3.2 for anatase phase) limits its response to the UV-light range, promoting high electron–hole pair recombination and poor photocatalytic activity [15,16]. In this context, the improvement of its structural, morphological, optical, and surface properties is essential to increase the efficiency of the photocatalytic processes, which could be carried out by doping with other inorganic compounds and synthesizing different chemical routes [17,18,19,20].
Currently, several approaches have been studied to enhance the photocatalytic activity of TiO2 for wastewater treatment, including metal doping using Al, Cr, Ag, Au, Pt, Mn, Cu, Fe, Co, and Ni, attributed with the structural and physicochemical parameters modification of TiO2 [5,17,21,22]. Previous studies suggested that the incorporation of copper ions into TiO2 matrix provides an increase in the photocatalytic activity for the degradation of organic pollutants (stearic acid), associated with the modification of the UV-light absorption wave, reducing enery band gap (Eg) values [23]. Furthermore, it was found that the doping of iron into TiO2 allows a decrease in the crystallite size, modifies the absorption wavelength, and shortens the band gap energy [24]. Anju et al. reported similar trends in the degradation of 2,4-DCP using pure TiO2 as a support and doping with cobalt and nickel ions [25].
Therefore, this work aimed to evaluate the effect of metal ions Co2+, Cu2+, Fe3+, and Ni2+ (5% wt.) using the TiO2 photocatalyst as support by the deposition–precipitation method. The synthesized samples were characterized with various techniques such as SEM, TEM, UV-Vis DRS, DRX, FTIR, Physisorption N2, and XPS. The deposited-TiO2 nanomaterials were evaluated through the heterogeneous photocatalysis to measure the photocatalytic activity in the degradation and mineralization of 2,4-D and 2,4-DCP.

2. Experimental

2.1. Chemical Reagents

Titanium (IV) butoxide reagent grade C16H36O4Ti, 97% purity; Urea, CH4N2O reagent grade 99% purity; 2,4-Dichlorophenol, reagent grade C6H4Cl2O, 99% purity; polyethylene glycol (PEG), 98% purity and 2,4-Dichlorophenoxyacetic acid, reagent grade Cl2C6H3OCH2CO2H, 97% purity; these reagents were obtained from Sigma-Aldrich. Cobalt (II) nitrate hexahydrate, Co(NO3)2 * 6H2O reagent grade 92% purity; Cupric (II) Nitrate Hydrated, Cu(NO3)2 * 3H2O reagent grade 92% purity; Iron (III) Nitrate nonahydrate Fe(NO3)3 * 9H2O reagent grade 92% purity; Nickel (II) nitrate hexahydrate, Ni(NO3)2 * 6H2O reagent grade 92% purity; these reagents were obtained from Meyer (Blue Springs, MO, USA). Ammonium hydroxide NH4OH reagent grade 28–30% purity was obtained from Jalmek (San Nicolás de los Garza, Mexico), and deionized water was obtained from the Golden Bell Company (Bell, CA, USA).

2.2. Synthesis of TiO2 Nanoparticles

The sol-gel method was used with some modifications to obtain TiO2 nanoparticles from the precursor C16H36O4Ti [26]. In a three-necked flask, 140 mL of ethanol with 14 g of Titanium (IV) butoxide and 2 g of PEG were kept under magnetic stirring at 300 rpm. The solution was brought to a neutral pH by adding NH4OH (1 M) drop by drop. The mixed was then refluxed at 80 °C for 2 h; it was sonicated for 1 h and cooled to 0 °C for 12 h. The gel obtained was dried at 100 °C and calcined at 500 °C for 5 h in a static air atmosphere (heating rate of 2 °C/min).

2.3. Deposited-TiO2 Nanoparticles

The preparation of the deposited-TiO2 materials with different ions (5% wt.) was carried out by the deposition–precipitation method with urea [17]. The TiO2 support was dried for 12 h at 100 °C before deposition of the Co ions. The metal ions (0.0042 M) used as a Co-precursor, and urea (0.42 M), were mixed in 100 mL of distilled water at room temperature under magnetic stirring until homogenization. Subsequently, 2 g of the TiO2 support were added to the mixture. The suspension was kept in a vigorous stirring at 80 °C in the absence of light for 24 h. The solution was washed and centrifuged four times to remove excess ions deposited over support material. Once the solid was obtained, it was dried at 100 °C for 2 h at room temperature. This procedure was repeated to obtain the Cu, Fe, and Ni deposited-TiO2 materials.

2.4. Materials Characterization

The micrographs of the materials were examined by scanning electron microscopy (Tescan, MIRA 3LMU, United Kingdom) operated at 20 kV. The microstructure of deposited-TiO2 was studied by means of high-resolution transmission electron microscopy (Jeol, Peabody, MA, USA) operated at 200 kV. The absorbance of modifed-TiO2 nanomaterials was measured using a UV-Vis DRS spectrophotometer (Shimadzu UV-2600, Tokyo, Japan) in the wavelength range of 200 and 900 nm. The band gap energy (plot) was calculated using the Tauc plot method [27]:
(α · hv)1 / γ = B(hvEg)
where h is the Planck constant, v is the photon’s frequency, Eg is the band gap energy, and B is a constant, based on the assumption that the absorption coefficient α can be expressed. The Kubelka–Munk function is used to determine the measure of band gap energy through the diffuse reflectance spectra.
The information on phase, crystallite size, and lattice parameters values of the nanomaterials were determined by X-ray diffraction (Panalytical diffractometer, Empyrean, Almelo, the Netherlands) equipped with Cu Kα radiation (λ = 0.154 nm). The diffraction patterns were obtained from 10° to 90° (2θ) with a scan rate of 0.02°/0.2 s. The average crystal size was determined using the Scherrer equation:
D = k λ β   C o s   θ  
where D is the crystal size, k is the form factor (0.89), λ is the wavelength of Cu Kα radiation (0.154 nm), β is the width evaluated at mid-high of the most intense diffraction peak, and θ is the Bragg angle.
The inter-planar distance (d) was evaluated with Bragg’s law:
d   Å = n λ 2   S i n   θ
The FTIR spectra were recorded on an FTIR (Thermo Fisher Scientific, Nicolet iS5, Tokyo, Japan) Spectrometer (4000–200 cm−1) using attenuated total reflectance (ATR) with a diamond waveguide (XR model). A detector of fast recovery, deuterated triglycine sulfate (DTGS) (standard) was used for the analysis. The FTIR spectra were recorded at room temperature, with 24 scans and 4 cm−1 of resolution. The specific surface area was obtained by the Brunauer–Emmett–Teller method (BET), and the pore size distribution was obtained following the Barrett–Joyner–Halenda (BJH) method. A Micromeritics analyzer (TriStar II Plus, USA) was used for measurement of the deposited-TiO2 the surface area, pore volume, and pore size by nitrogen adsorption–desorption. The samples were degassed at 200 °C for 2 h, under vacuum. Nitrogen adsorption isotherms were measured at liquid nitrogen temperature (77 K), and nitrogen pressures ranging from 10−6 to 1.0 P/P0. The XPS spectra were collected using a SPECS PHOIBOS 150 spectrometer by using Al Kα monochromatic (1486.6 eV) radiation as the excitation source. The XPS analysis was carried out at ambient temperature and pressures typically in the order of less than 10−6 Pa. The binding energy shifts due to surface charging were corrected using the binding energy of carbon (C 1s 284.8 eV) [28].

2.5. Photocatalytic Activity

The photocatalytic properties of deposited-TiO2 nanomaterials (Co/TiO2, Cu/TiO2, Fe/TiO2 and Ni/TiO2) were studied through the degradation of 2,4-D and 2,4-DCP in a typical kinetic reaction experiment. A glass batch reactor provided with a cooling medium, and a UV-lamp of 1 mW cm−2 placed inside a quartz tube was used. The reactor was loaded with 330 mL of deionized polluted water with 80 mg L−1 of 2,4-D or 80 mg L−1 2,4-DCP, and 100 mg L−1 of deposited-TiO2 as a catalyst. The degradation curves were obtained by measuring the evolution of absorbance maximum (at 283 and 285 nm for 2,4-D and 2,4-DCP, respectively) as a function of time (every 30 min up to 360 min) using a UV-Vis (Shimadzu UV-2600, Tokyo, Japan) spectrophotometer with scans from 200 to 900 nm.
The total organic carbon in the samples was measured using a TOC-LCSN equipment (Shimadzu, model), and calculated applying Equation (2):
TOC = TCIC
where TOC is the amount of total organic carbon (mg L−1), TC is the amount of total carbon (mg L−1), and IC inorganic carbon (mg L−1) in aqueous solution.

3. Results

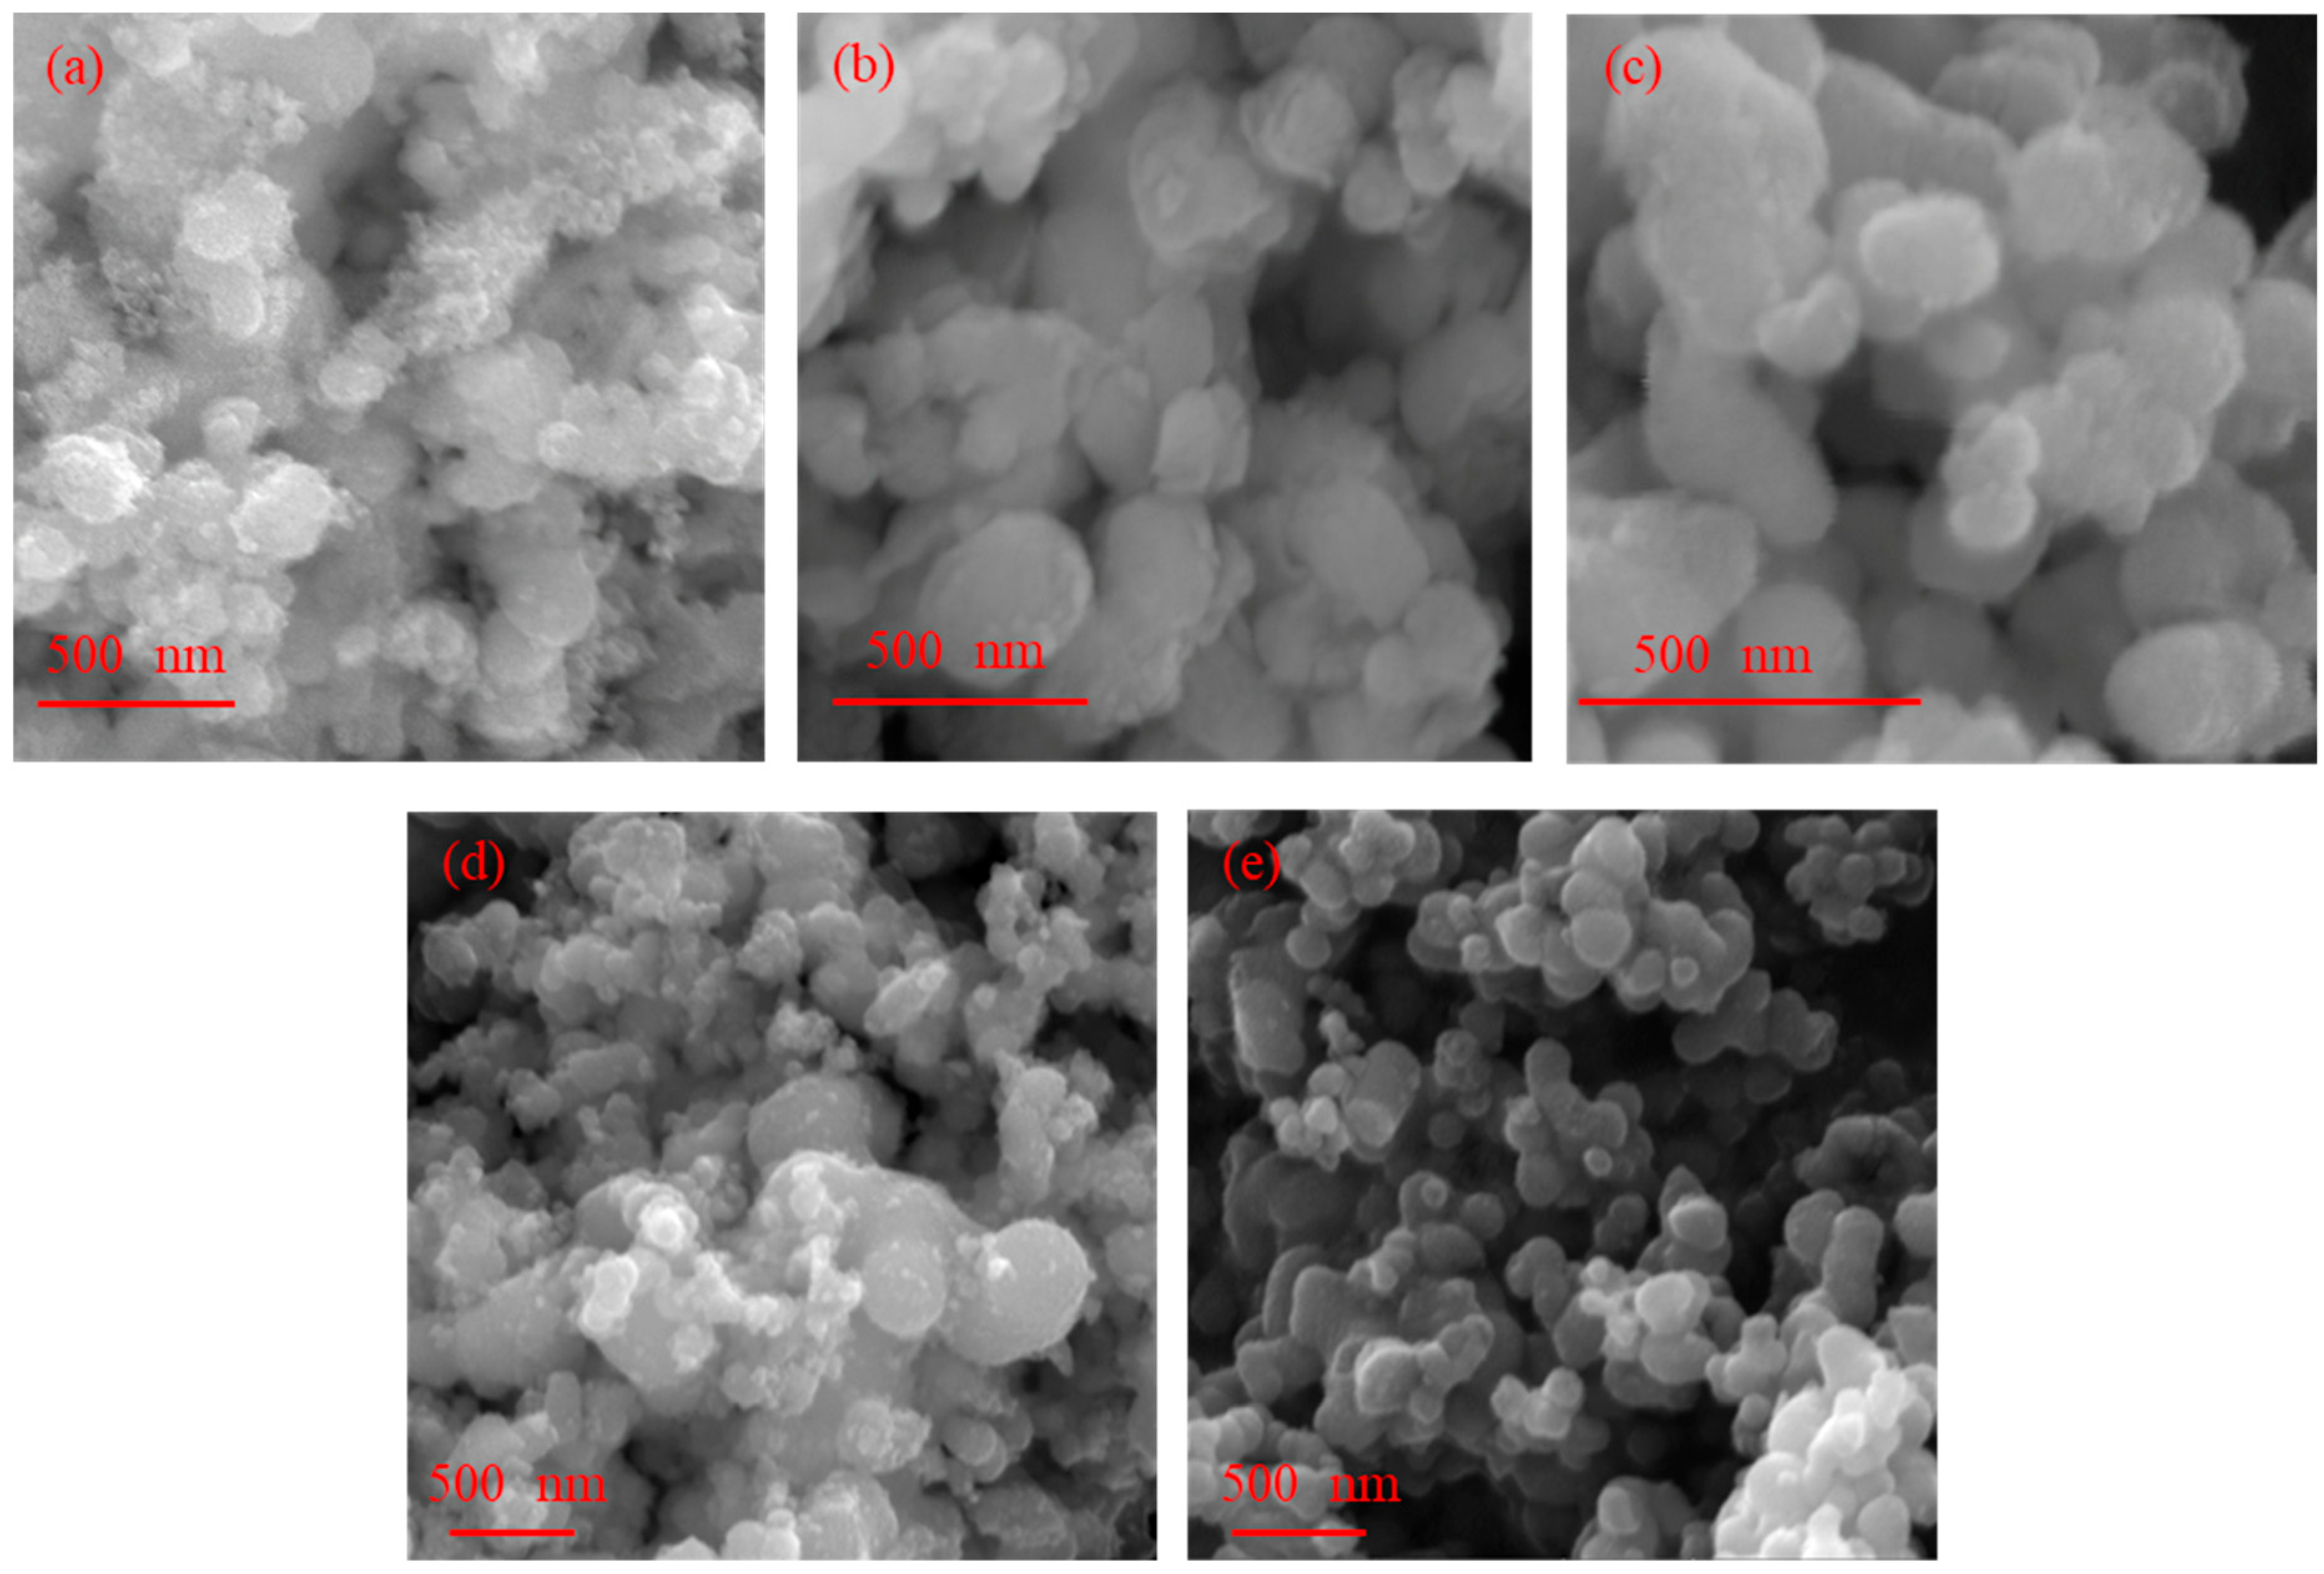
3.1. Scanning Electron Microscopy (SEM) Analysis

Figure 1 shows the surface morphology of pure TiO2 and deposited-TiO2 photocatalyst. The TiO2 nanoparticles (Figure 1a) exhibited semi-spherical form with some aggregates with a homogeneous distribution and sizes <100 nm. The Co/TiO2 (Figure 1b) exhibited uniform small semi-spherical nanoparticles similar to those reported in literature [29], while the Cu/TiO2 (Figure 1c) presented a semi-spherical shape and homogeneous distribution, in agreement with those reported by Qureshi et al. [30]. The addition of the iron ion (Figure 1d) to TiO2 does not show significant morphological changes, and the semi-spherical shape is still maintained with small agglomerations of particles [31]. Figure 1d shows the result of the doping of TiO2 with Ni ions, where small agglomerations of particles with a semi-spherical shape can be observed with a uniform size distribution; these results can be compared with those presented by Kunnamareddy et al. [32]. In general, the incorporation of the different doping ions such as Co, Cu, Fe, and Ni does not significantly affect the typical morphological features of TiO2, mainly associated with the deposition–precipitation method used during the synthesis process [14,17].

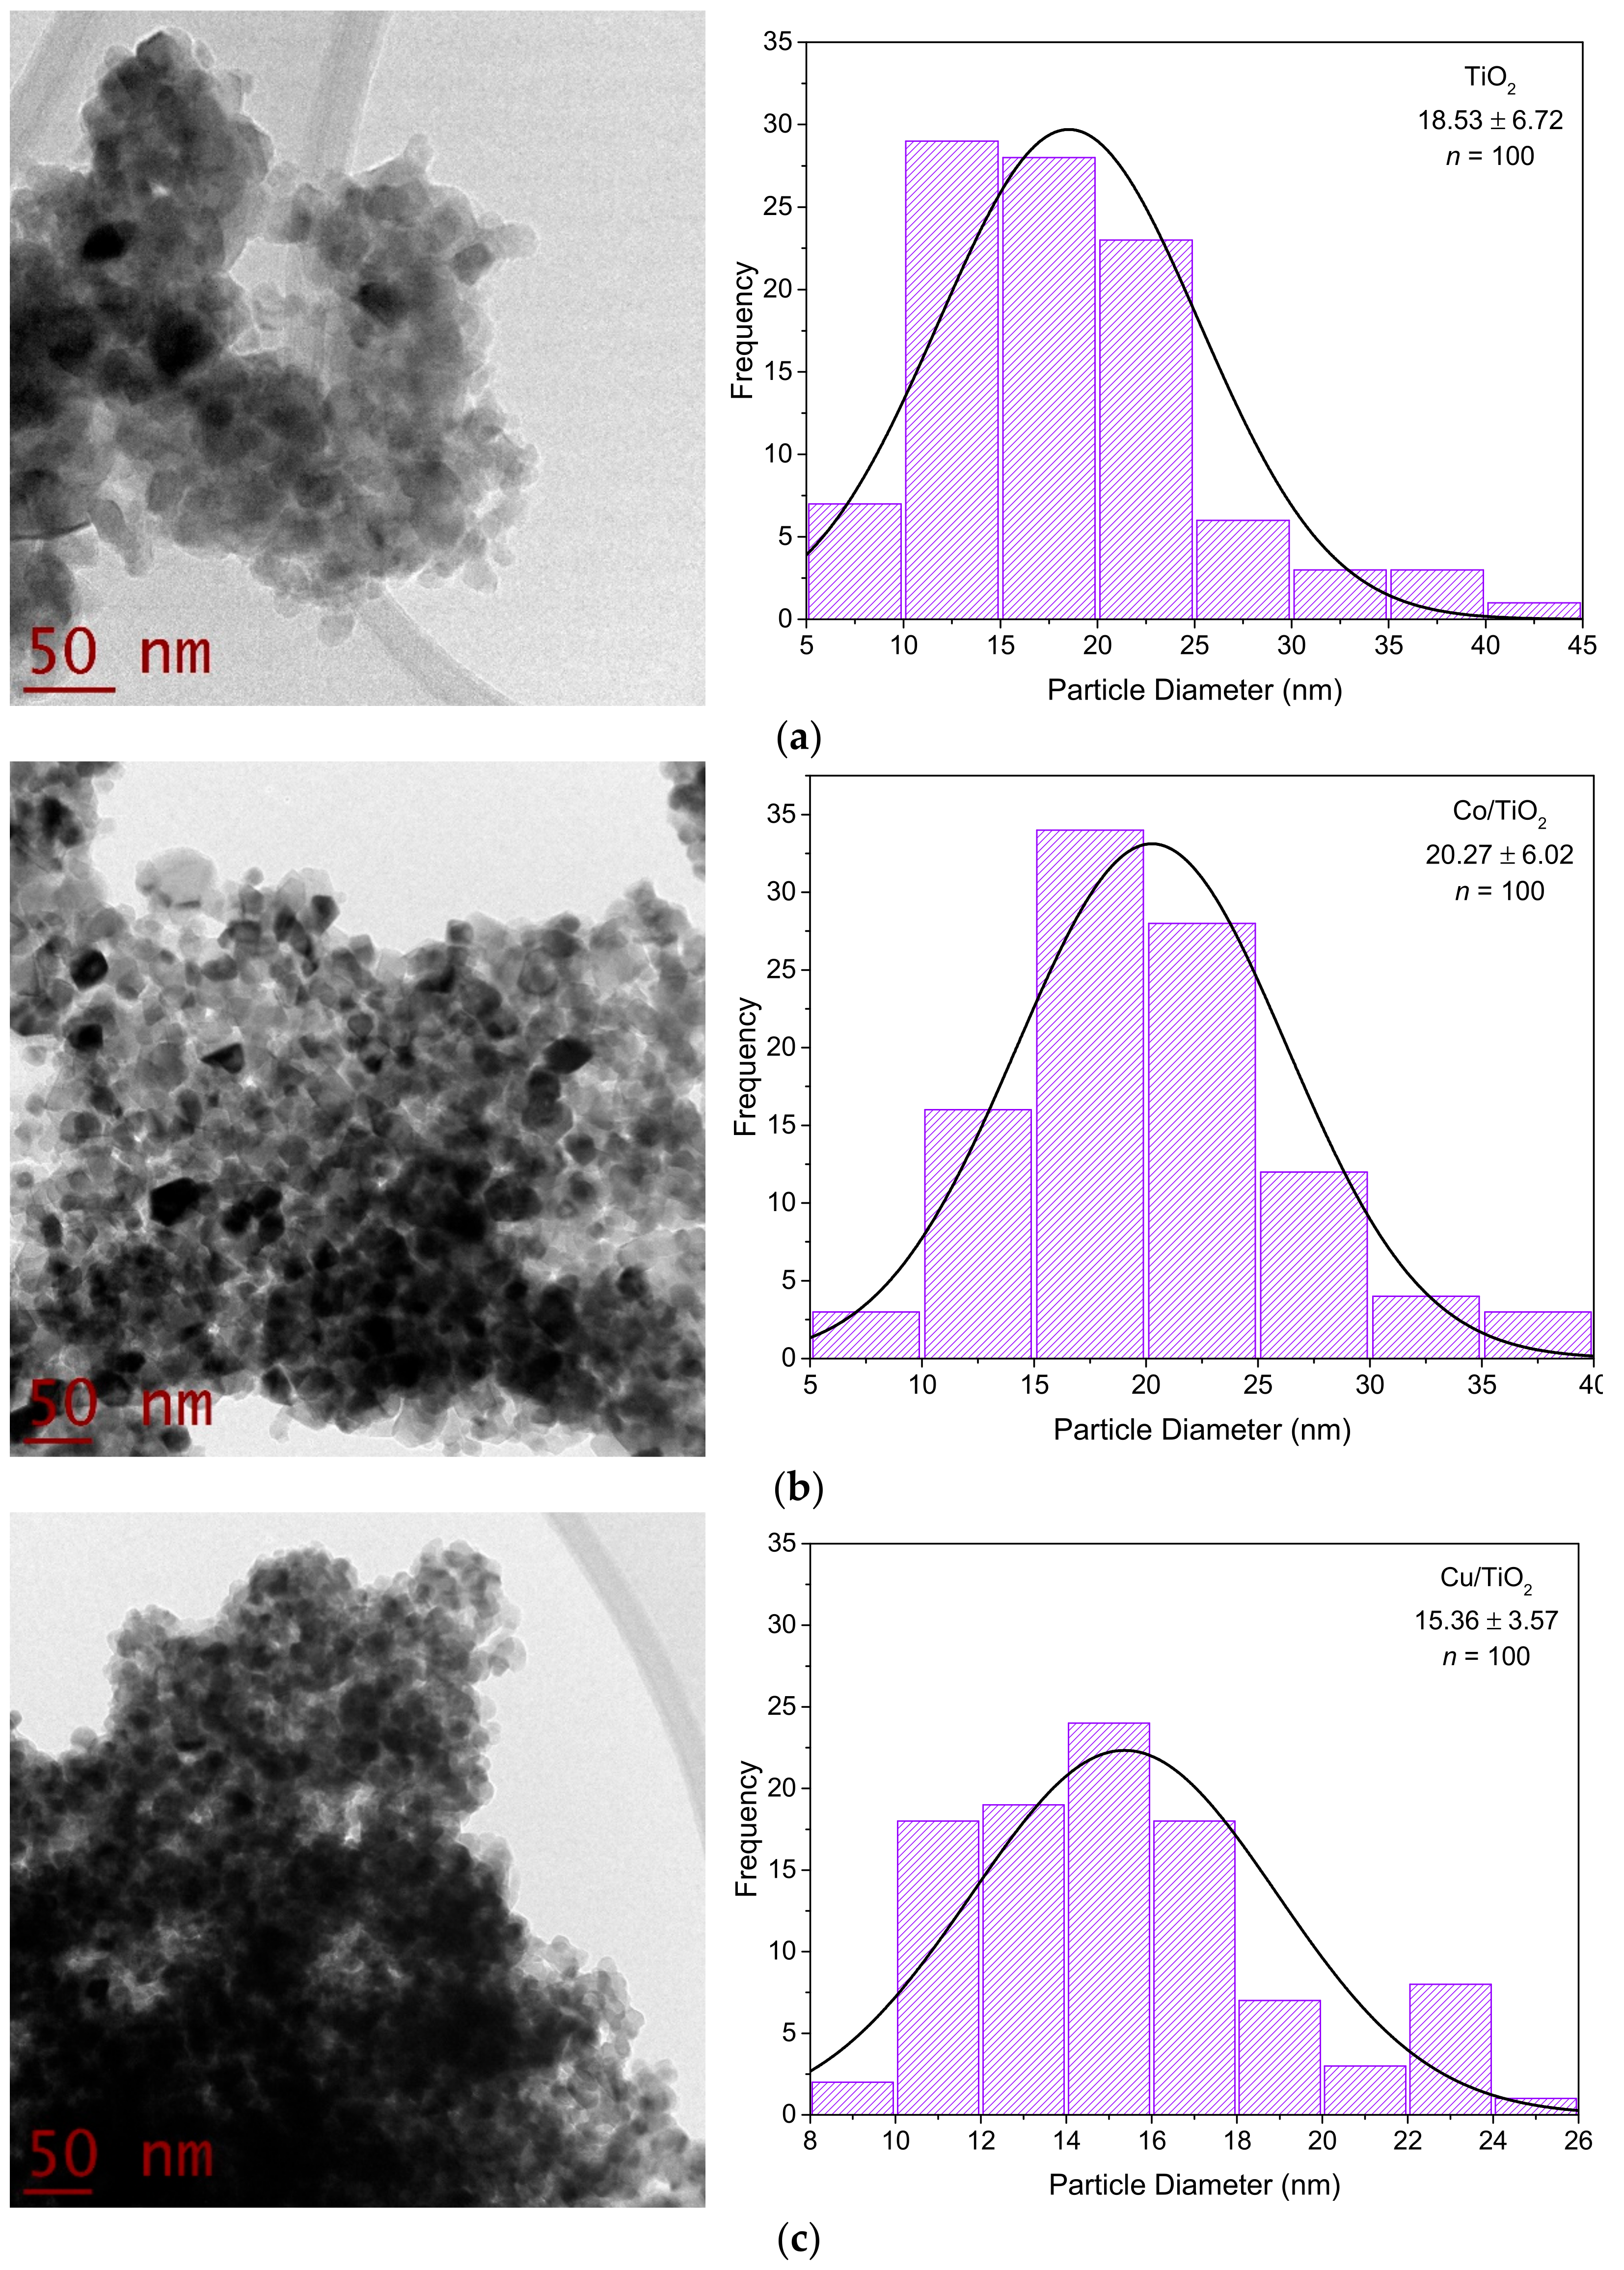
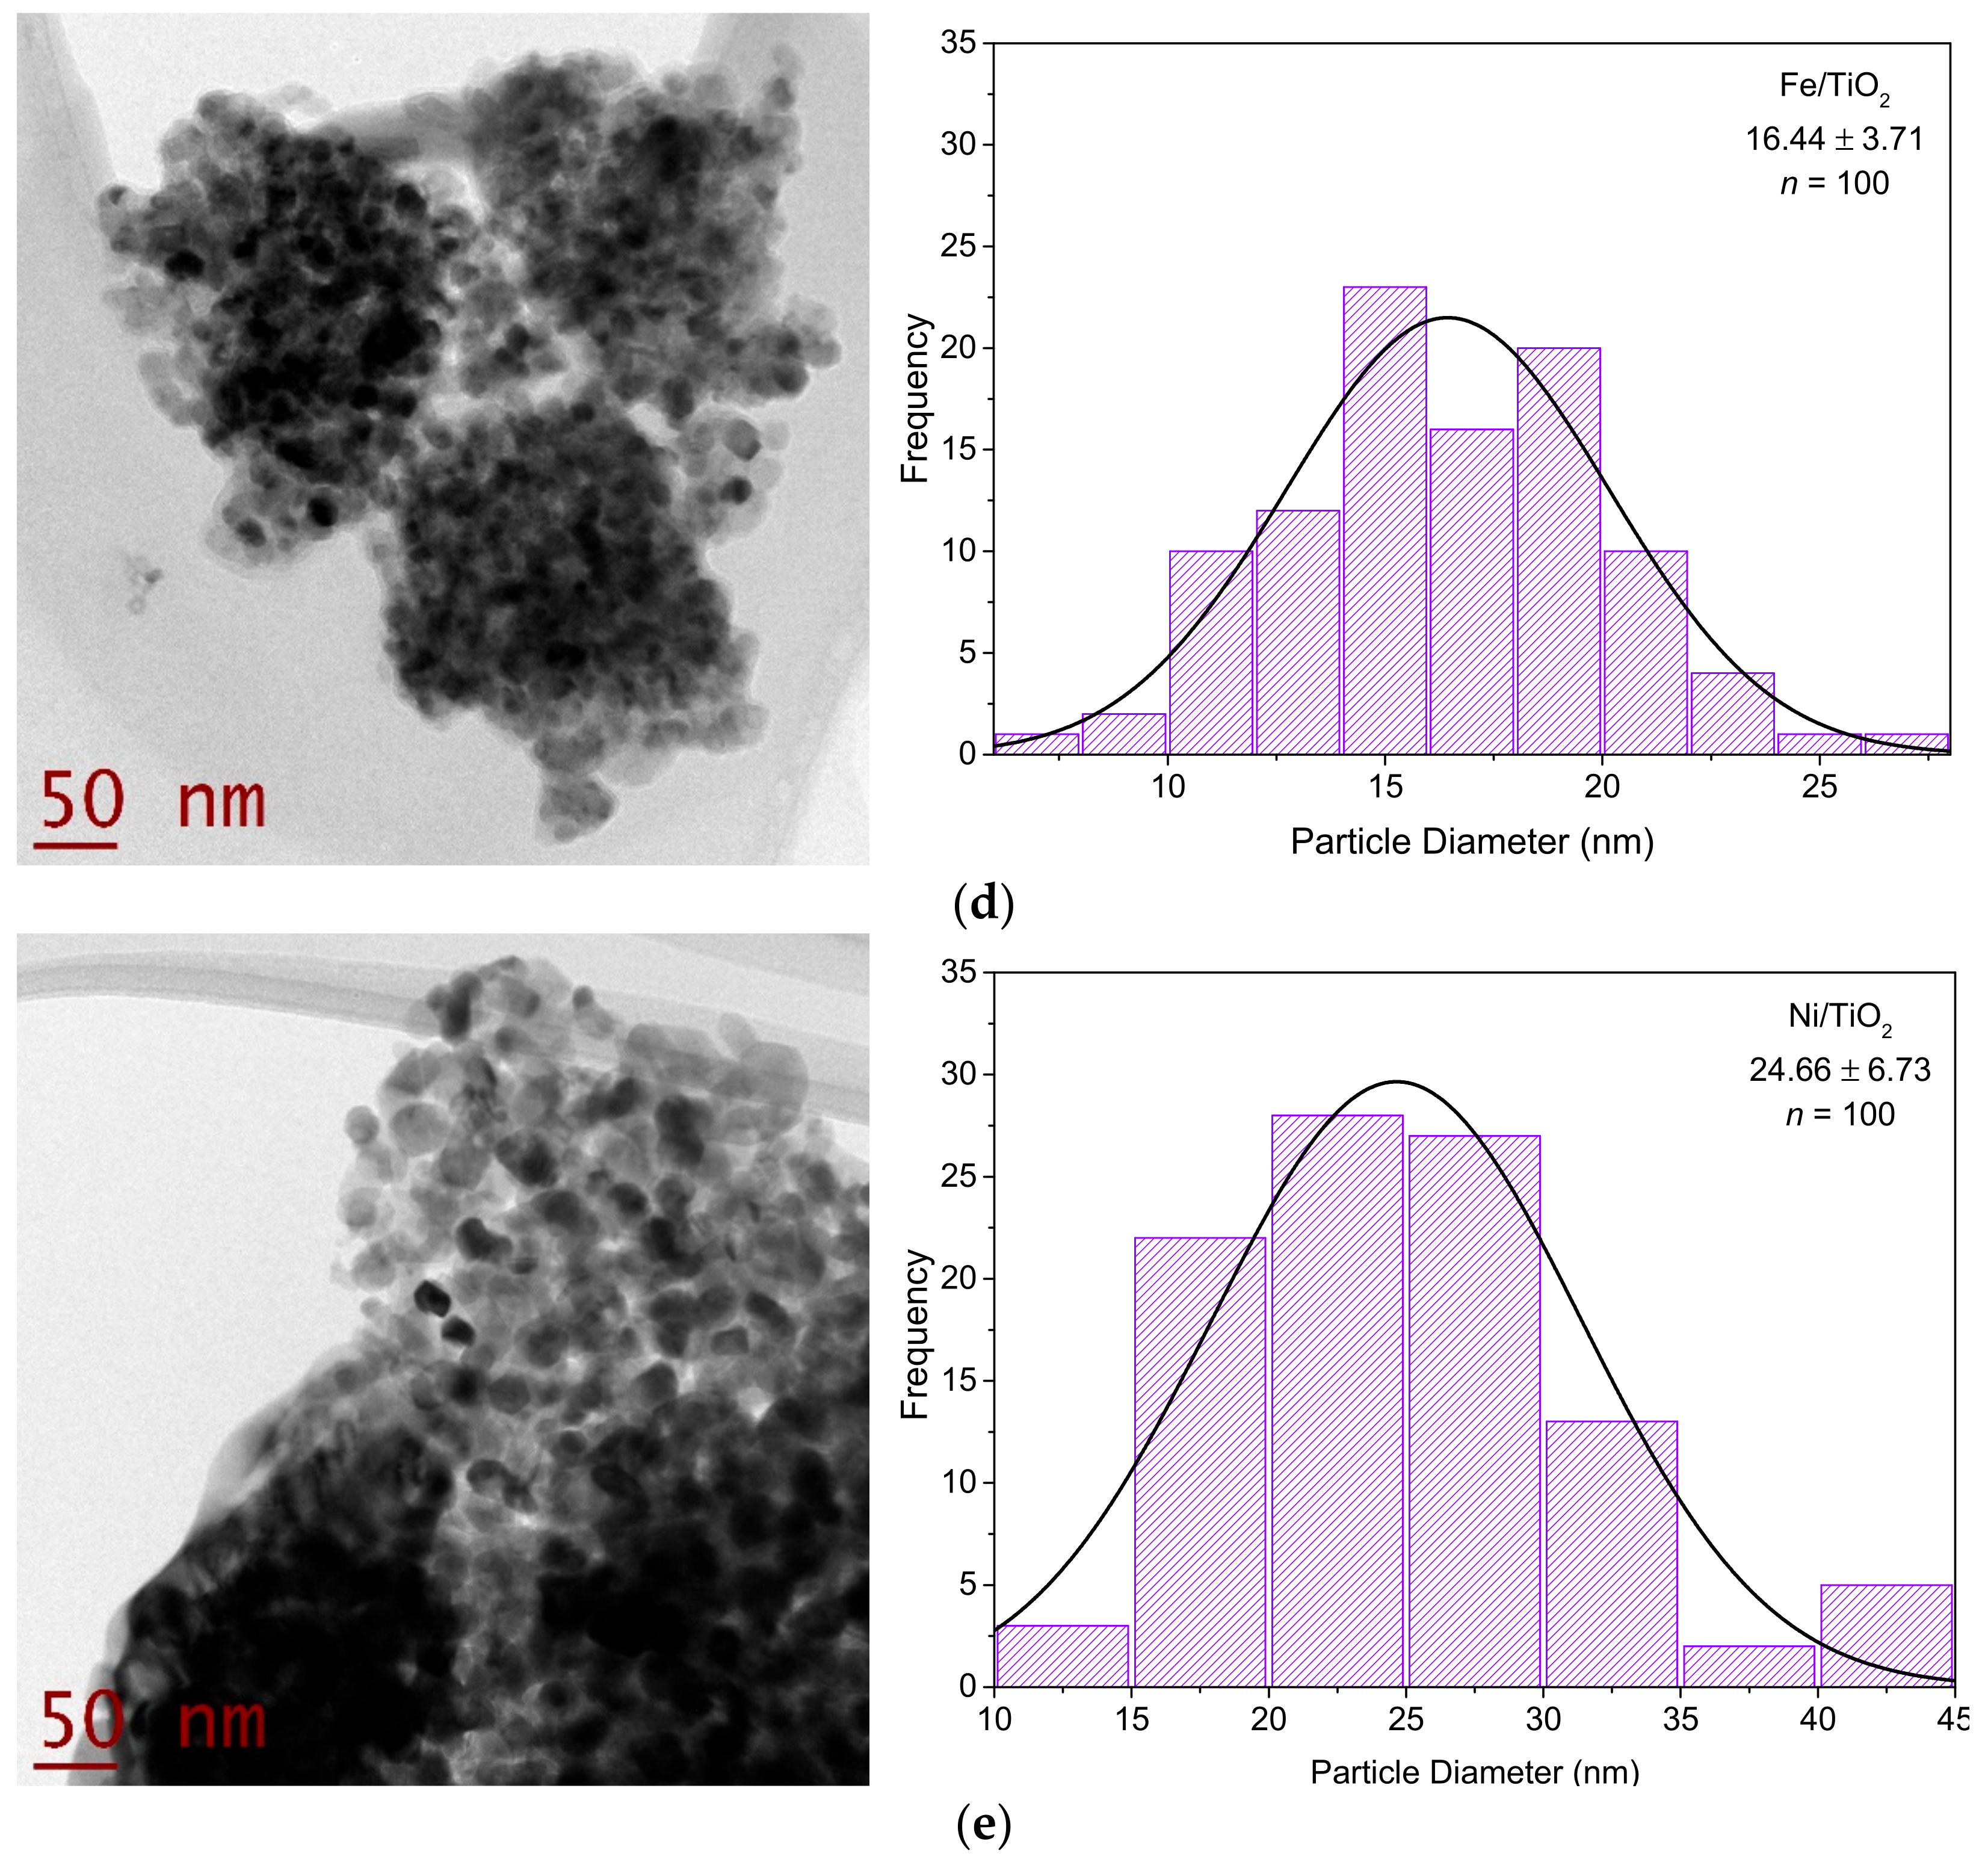
3.2. Transmission Electron Microscopy (TEM) Studies

The images show that the materials exhibited a semi-spherical form with some superficial agglomerations and sizes less than 100 nm of diameter (Figure 2). The average size by nanoparticle is 64.18 ± 18.74 nm (TiO2), 63.27 ± 16.55 nm (Co/TiO2), 65.67 ± 13.28 nm (Cu/TiO2), 68.03 ± 13.28 nm (Fe/TiO2), and 68.50 ± 20.75 nm (Ni/TiO2). The distribution histograms of particle sizes for all samples are presented in (Figure 2). The diameter of the particles was estimated by measuring 100 nanoparticles on the TEM images using ImageJ software (Java 1.8.0_172 64 bits, Wayne Rasband, University of Wisconsin, USA). The average particle diameter is 18.53 ± 6.72 nm (TiO2), 20.27 ± 6.02 nm (Co/TiO2), 15.36 ± 3.57 nm (Cu/TiO2), 16.44 ± 3.71 nm (Fe/TiO2) and 24.66 ± 6.73 nm (Ni/TiO2). Nguyen et al. found that the crystallite diameter for Pd-doped TiO2 is in the range of 12–28 nm by measuring 20 particles using the ImageJ program [15]. It has been reported that nanoparticles with size ≤ 100 nm are more active against organic pesticides than higher nanoparticles, associated with an increase in surface area [33,34].
The selected area electron diffraction (SAED) pattern corresponded to TiO2 and modified TiO2 (Figure 3). The images revealed the crystalline structure that corresponds to the anatase phase of support (TiO2) according to JCPDF 21-1272 [1]. The rings show good homogeneity in shape; however, some rings of the samples show discontinuity due to the formation of larger crystallites, as demonstrated by Maurya and Bhatia et al. [35]. The TEM analytical results indicate a good dispersion of the ion metallic (Cu+, Ni+) over the surface of TiO2 through the deposition–precipitation process corroborating the results of the SEM analysis.

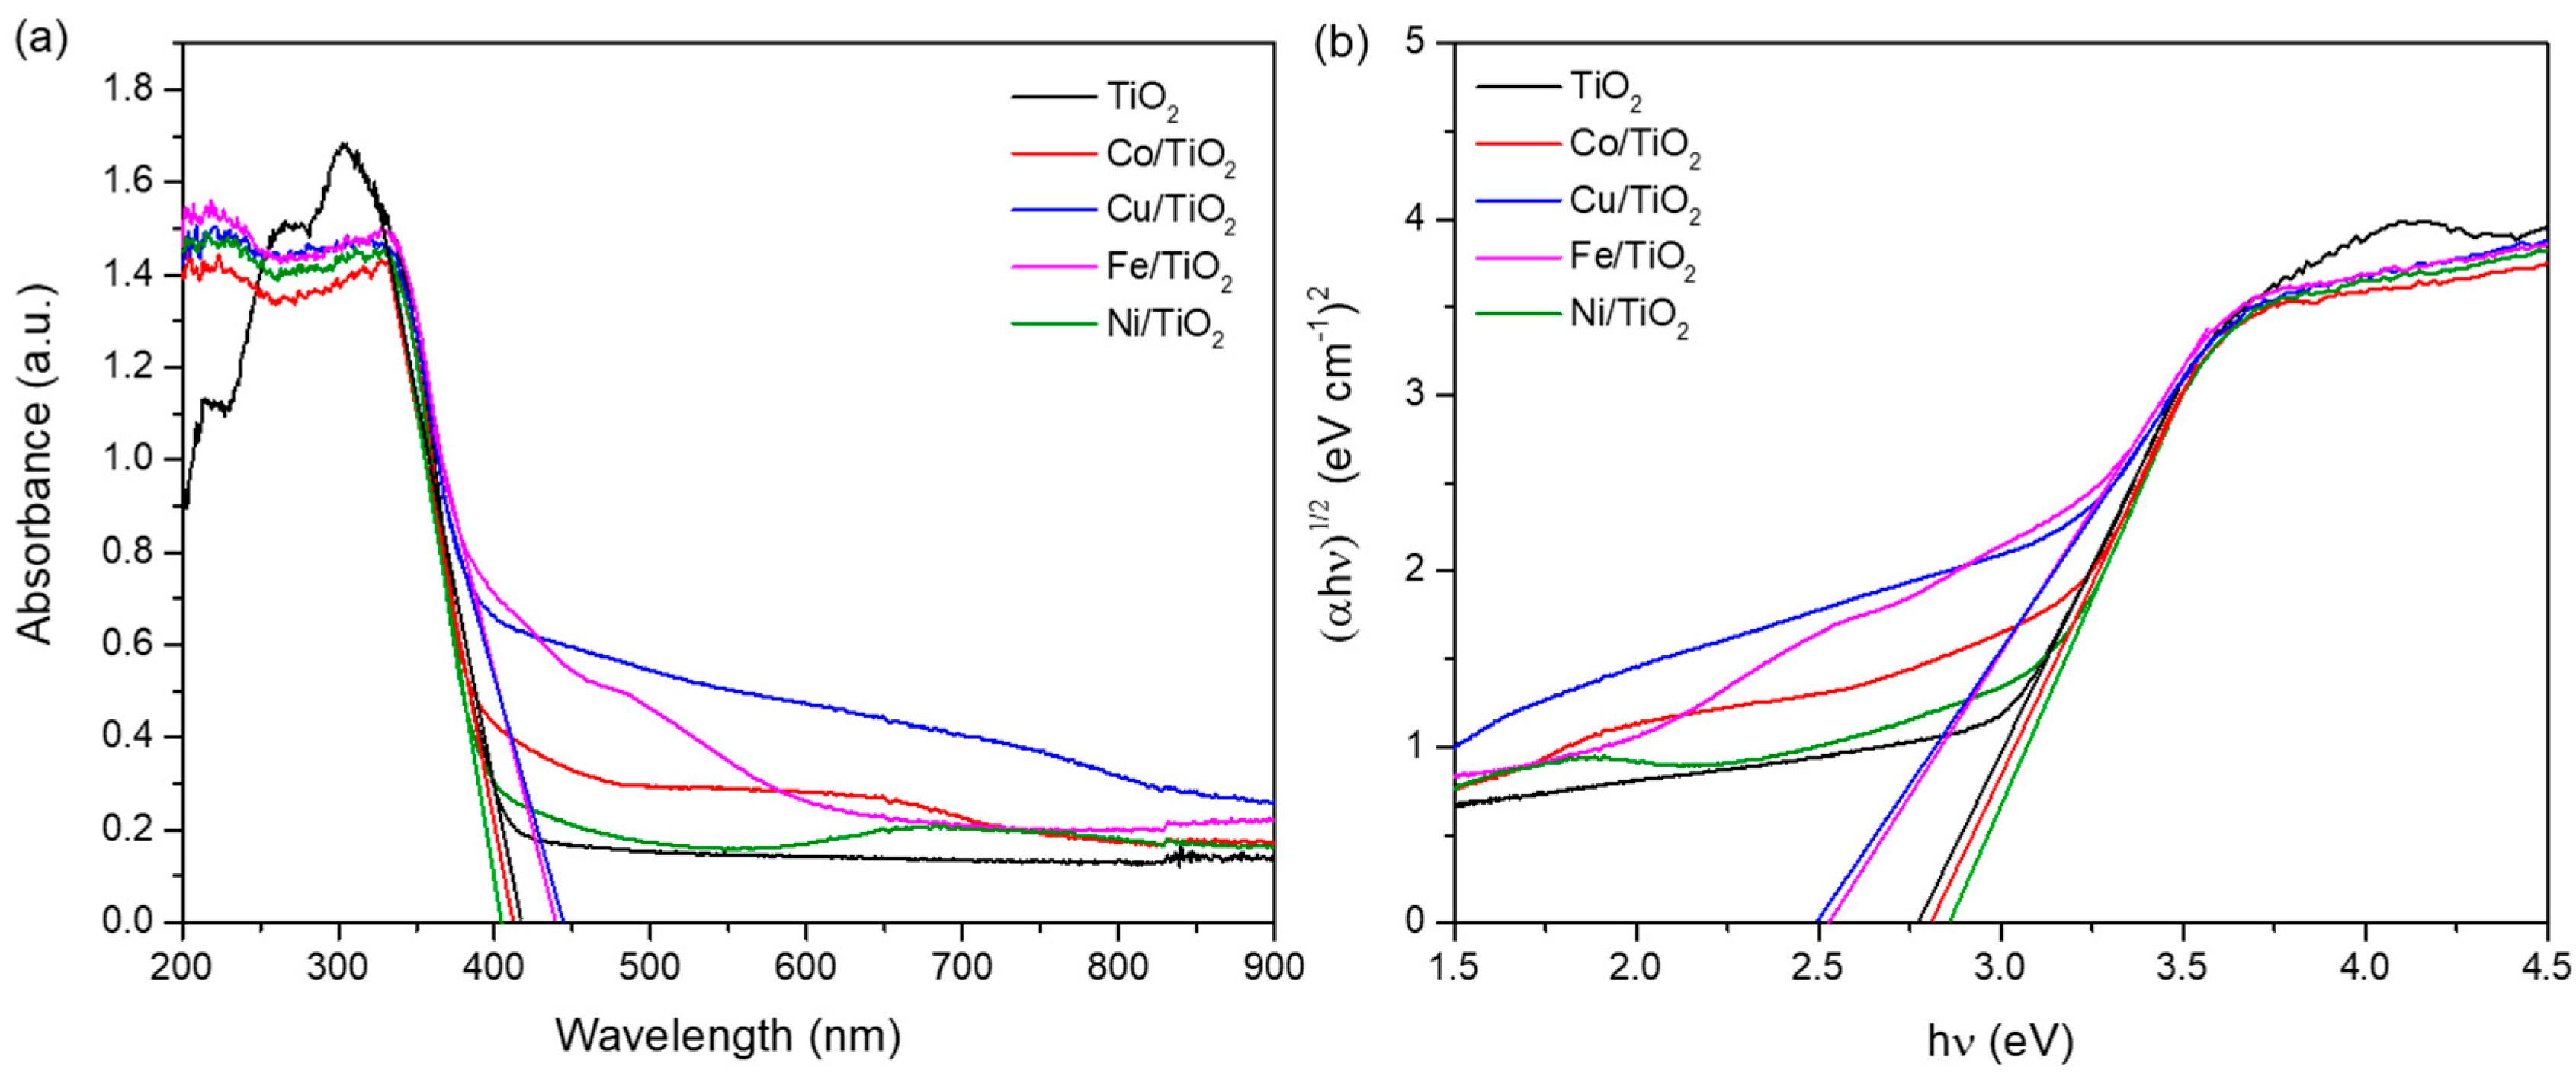
3.3. UV-VIS by Diffuse Reflectance Spectroscopy

Figure 4 shows the UV-Vis diffuse reflectance spectra of the TiO2 and deposited-TiO2 photocatalysts. TiO2 exhibited a strong absorption band between 400 and 450 nm (Figure 4a), which is characteristic of O2p → Ti3d transitions in the tetrahedral structure or TiO2 in its anatase phase [36]. The TiO2 NPs present two shoulders around 200–250 and 250–300 nm (bands associated with bulk crystals), which may change with the incorporation of doping ions, promoting a displacement in the UV-light absorption spectra [37]. Pure TiO2 exhibits an absorption band edge at 421 nm (ultraviolet absorption) [38], and similar trends were observed in Co/TiO2 (416 nm), Cu/TiO2 (451 nm), Fe/TiO2 (443 nm), and Ni/TiO2 (408 nm) samples. The band gap (Eg) energies of the nanomaterials were calculated by applying the Tauc’s plot method and Kubelka–Munk function [27]; results are shown in Table 1. The nanoparticles of Co/TiO2 (2.80 eV), Ni/TiO2 (2.85 eV), and TiO2 (2.77 eV) showed similar results, unlike Cu/TiO2 (2.50 eV) and Fe/TiO2 (2.53 eV), which exhibited a significant reduction in Eg values. It is well known that, when Eg exhibits a redshift displacement, we can observe an increment in the optical absorption of the nanoparticles promoting the absorption in the UV-visible region [39,40]. In this context, a displacement of Eg value in nanomaterials helps to increase their photocatalytic efficiency in the degradation of organic contaminants [41,42].

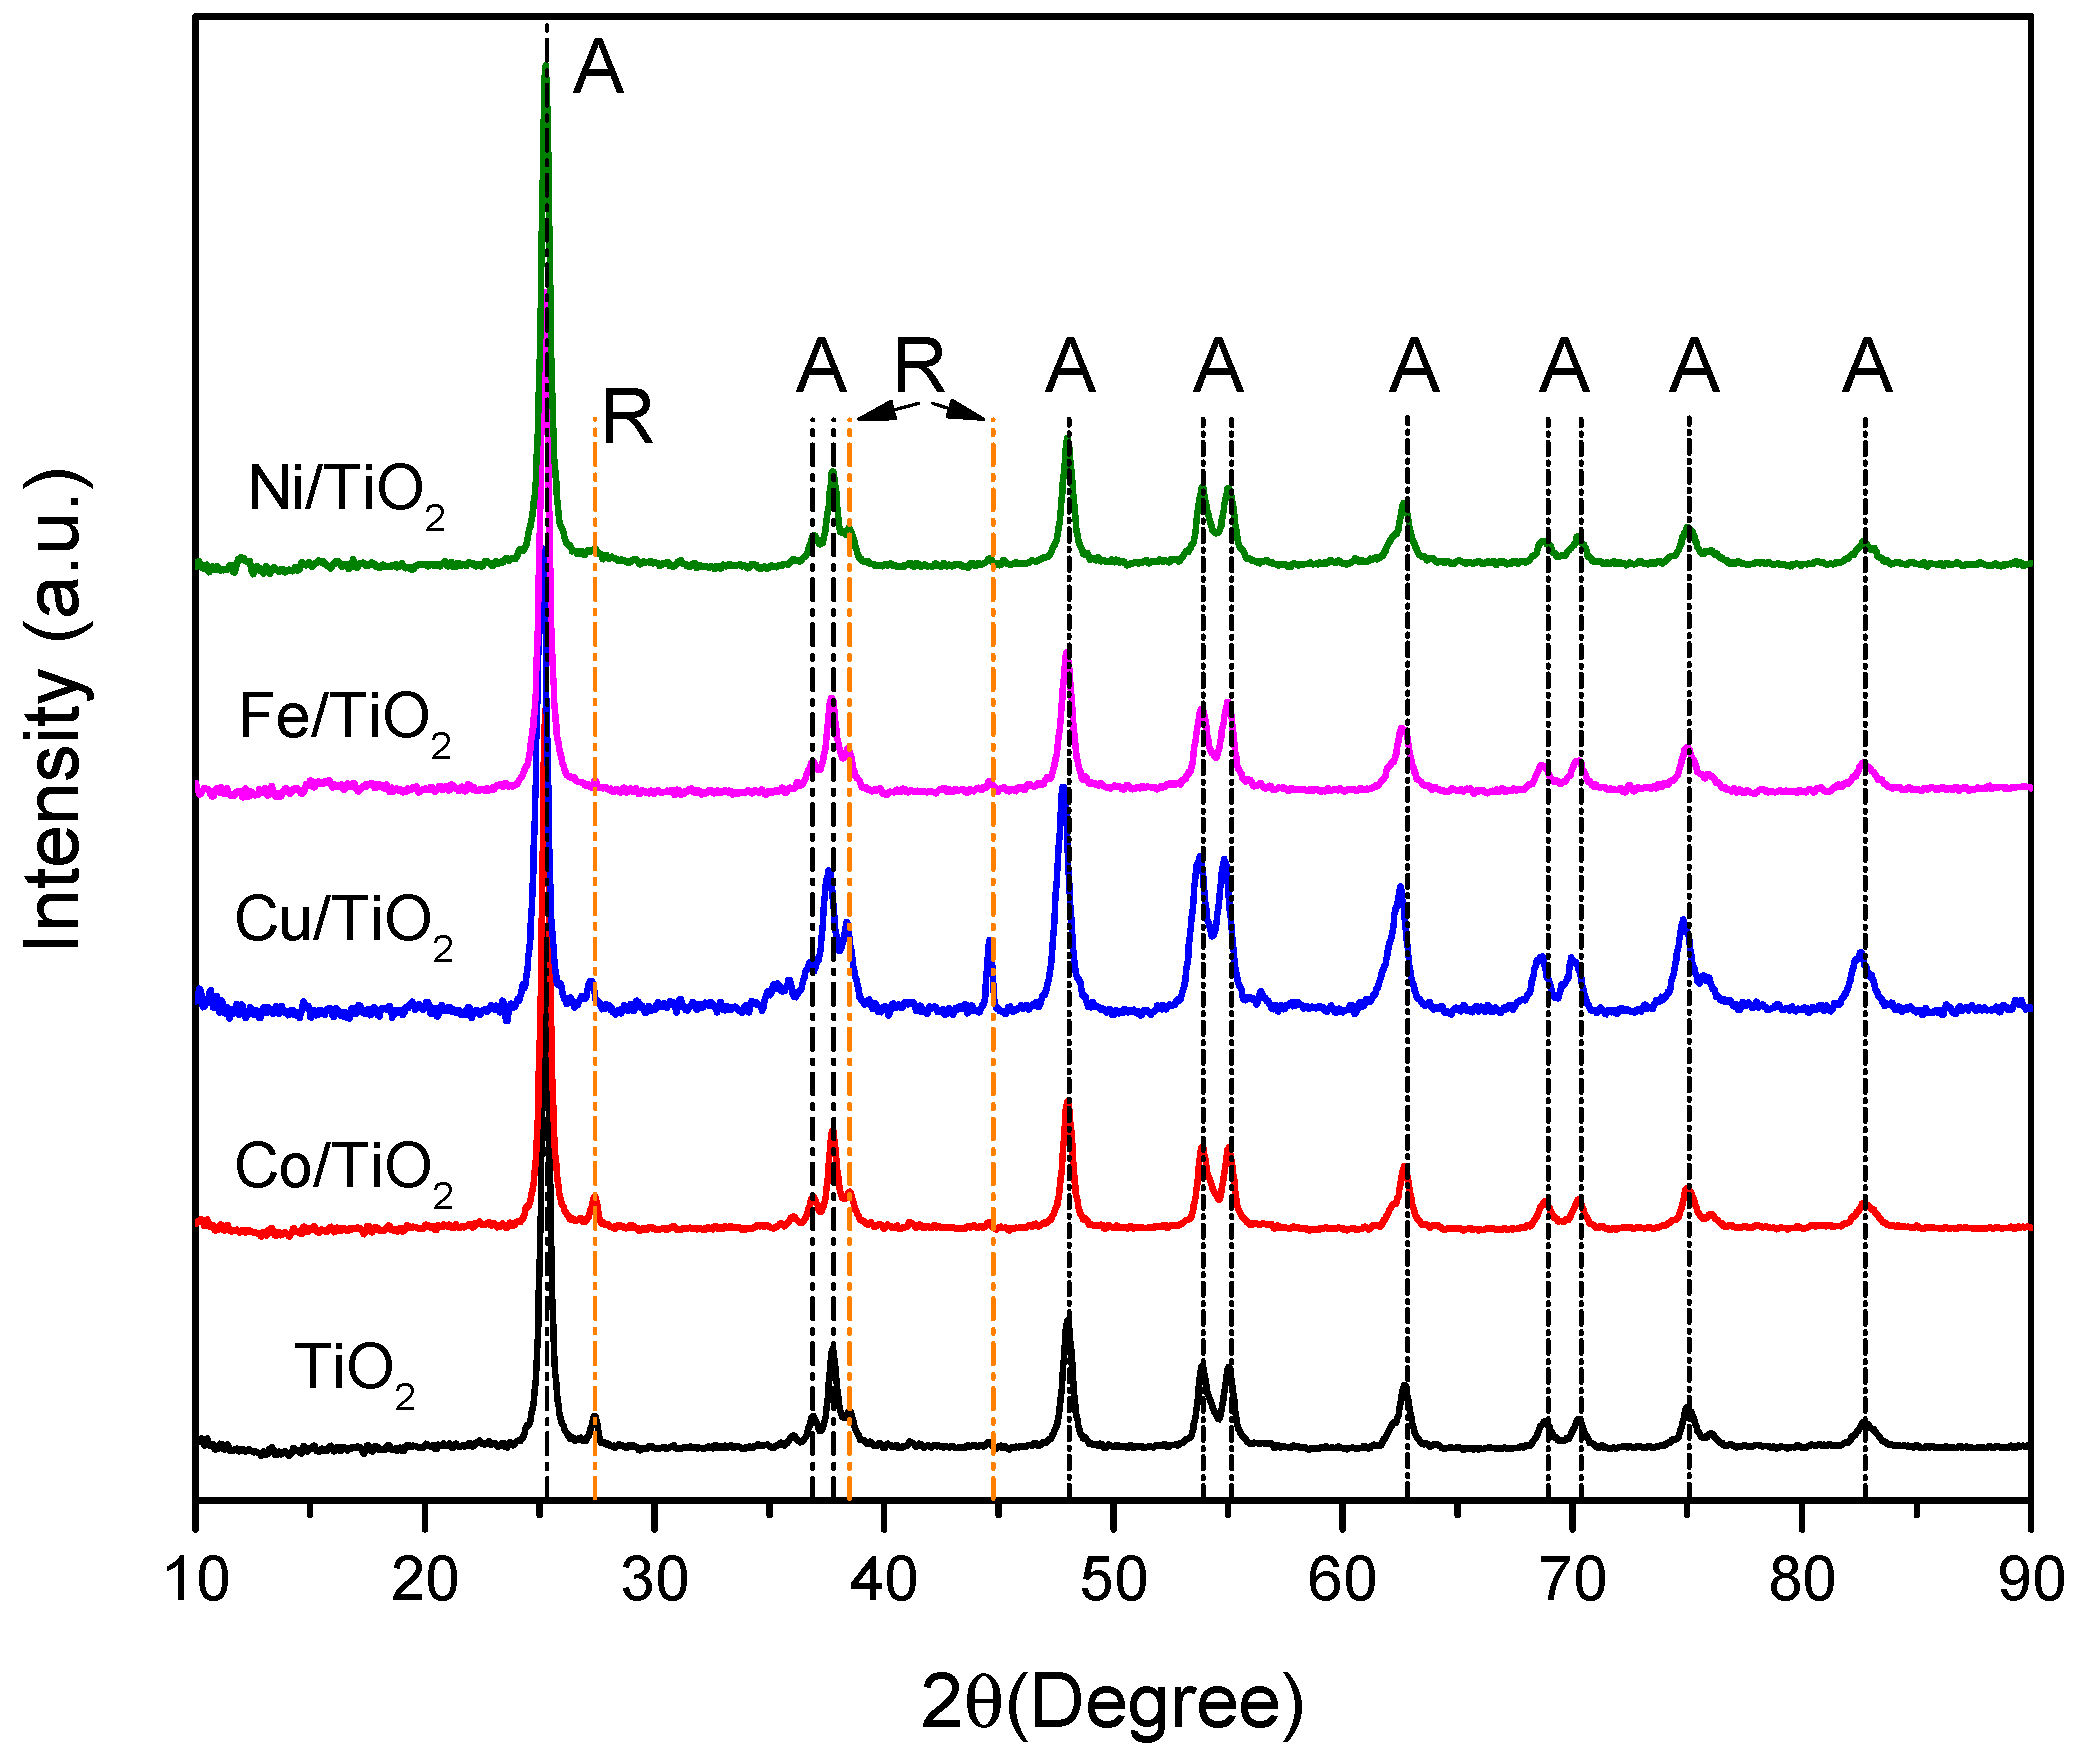
3.4. X-ray Diffraction
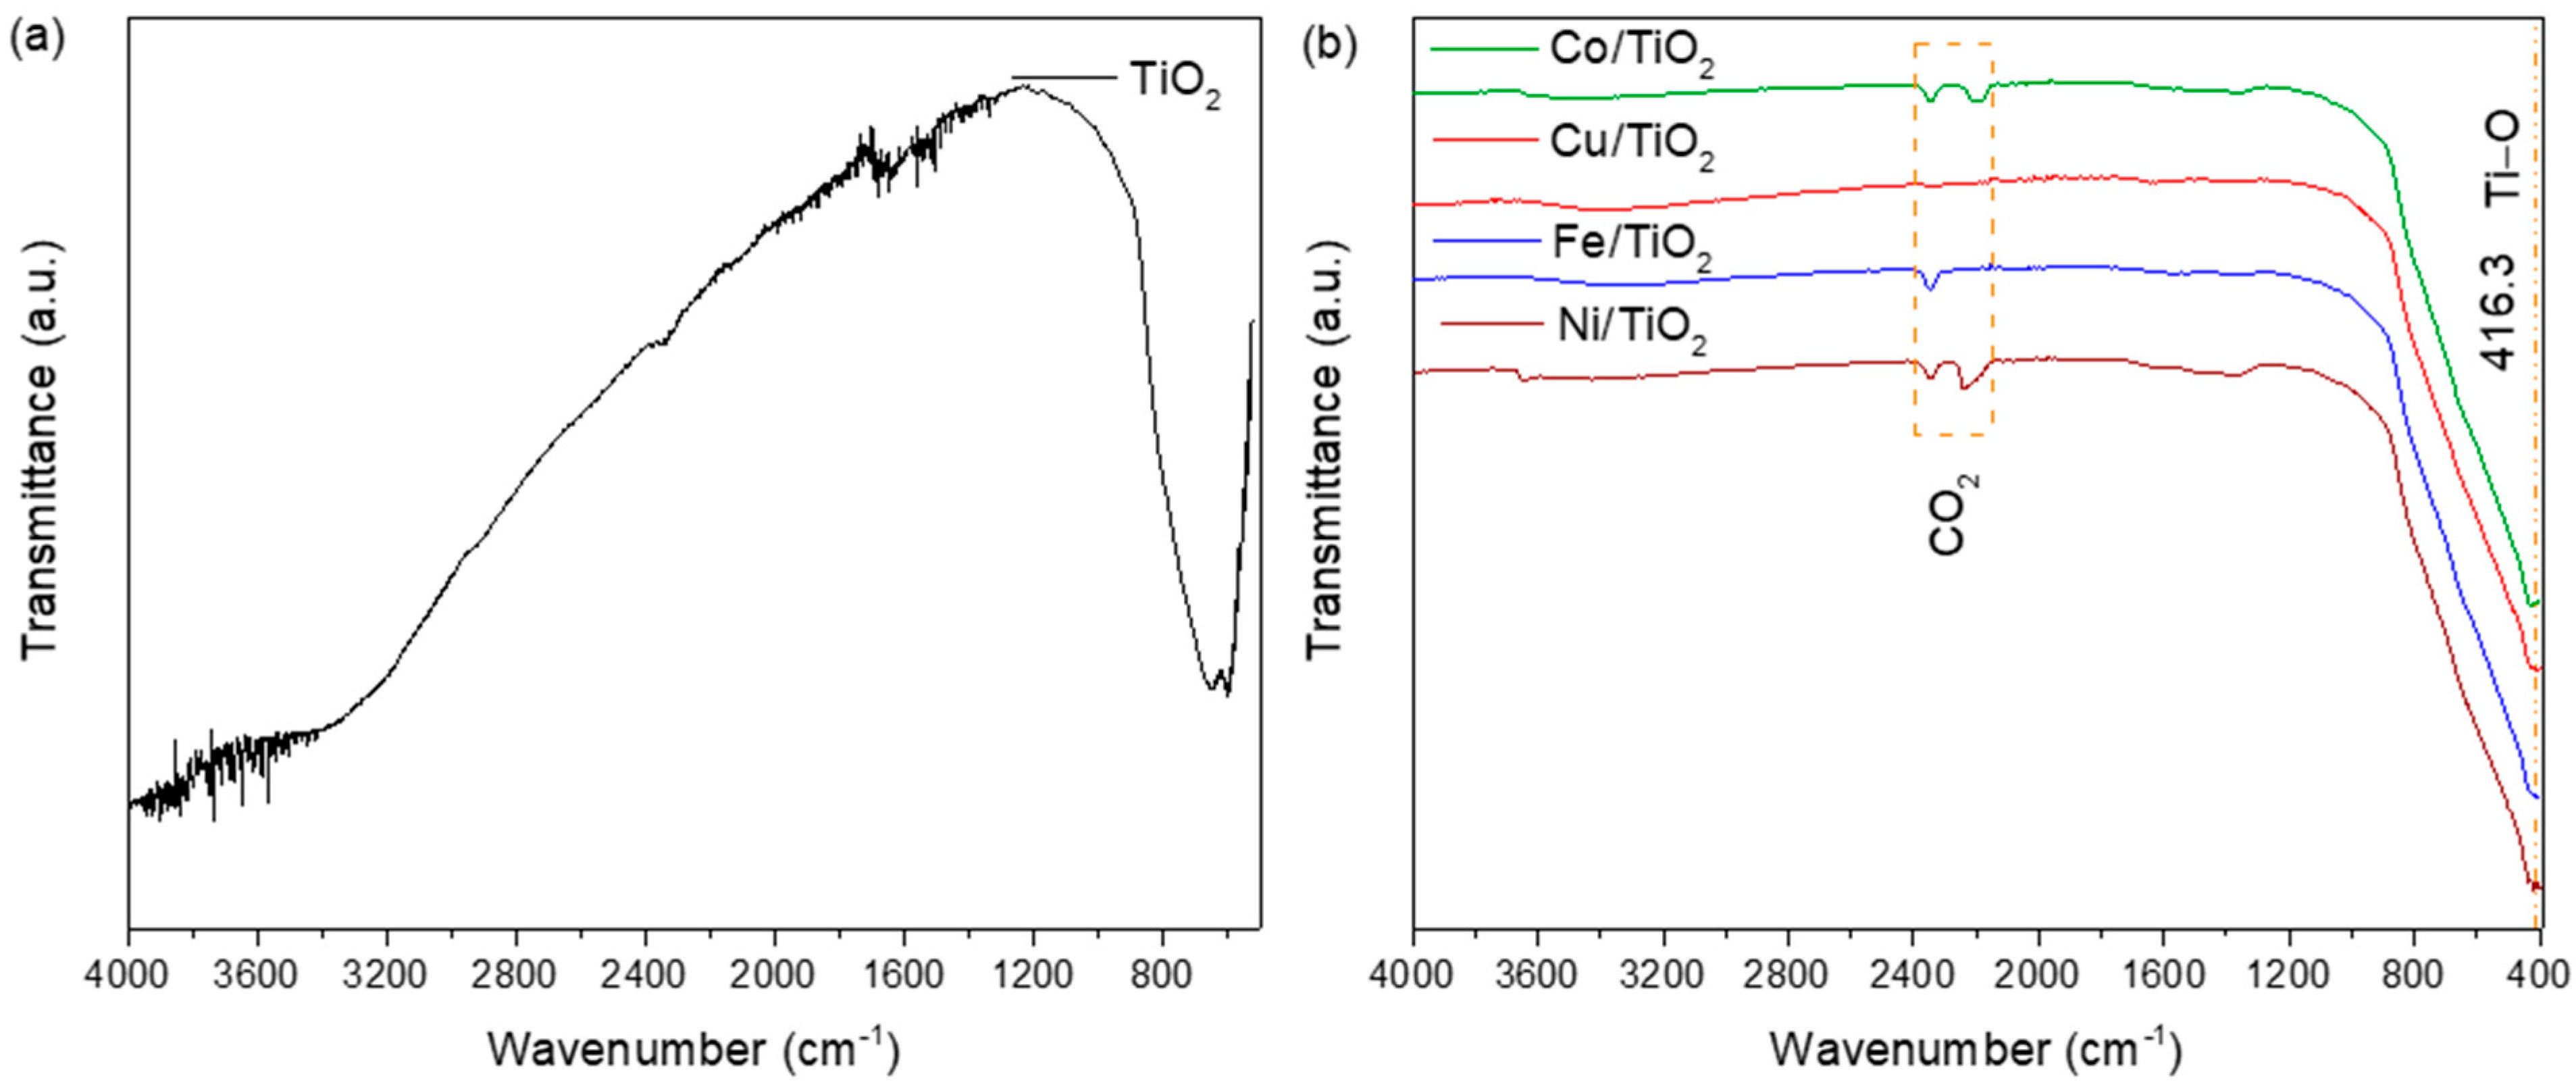
The photocatalysts were studied by X-ray diffraction (XRD) to identify their crystalline structure and patterns of pure TiO2 and deposited-TiO2 depicted in Figure 5. The XRD pattern of TiO2 and deposited-TiO2 NPs show the characteristics peaks of the tetragonal anatase phase of TiO2 at 2θ°: 25.26° (101), 37.75° (004), 48.00° (200), 53.92° (105), 55.02° (211), 62.66° (204), 68.82° (116), 70.25° (220), 75.07° (215), and 83.52° (312), according to the JCPDS 21-1272 [43,44]. In addition, the presence of the rutile phase was identified in all samples. The rutile phase for TiO2, Cu/TiO2, and Ni/TiO2 is located at 2θ degrees: 27.38°, 27.20°, and 27.39°, with the Miller index (110). Similarly, at 2θ°: 44.61°, 44.60°, and 44.59°, the Miller index (215) of the rutile phase is identified for Co/TiO2, Cu/TiO2, and Fe/TiO2, according to the crystallographic card JCPDS 21-1276 [45]. The deposited-TiO2 samples do not present significant changes in the diffractogram, which can be attributed to the low content of dopant ions and their high physical dispersion in TiO2 surface [46]. Furthermore, the deposition–precipitation method with urea is widely used in metallic ions over TiO2 deposition as it provides good dispersion according to previous reports [47]. The crystallite size of TiO2–anatase was estimated by the Scherrer equation, and the results are reported in Table 1. The samples showed an average crystallite size ranging from 10 to 14 nm, suggesting that crystallite size is influenced by the element dopant dispersed in the support [48].
Table 1 shows the value of d-spacing of TiO2 (0.3523 nm), Co/TiO2 (0.3524 nm), Cu/TiO2 (0.3547 nm), Fe/TiO2 (0.3528 nm), and Ni/TiO2 (0.3523 nm). These values were compared with the standard values of d-spacing of the JCPDS 21-1276 and corroborate the anatase phase structure of TiO2 and are attributed to the (101) lattice planes [45]. The variation present in the d-spacing between modified TiO2 nanomaterials suggests the incorporation of metallic ions into the support structure [49,50]. The anatase crystalline phase present in the modified TiO2 samples is an indicative of high charge mobility and low charge resistance (generation of hydroxyl radicals) of these materials, which may increase the photocatalytic activity of nanocatalysts against organic pesticides [51,52].
The unit cell parameters of pure TiO2 and deposited-TiO2 are listed in Table 2. The lattice parameters of the anatase tetragonal phase of TiO2 (a = 3.788 Å, c = 9.524 Å) and volume (136.64 Å3) consistent with the JCPDS 21-1272 card. On the other hand, deposited-TiO2 samples showed are influenced in ion deposited-dependent response, the samples of Cu/TiO2 (a = 3.803 Å, c = 9.561 Å, and V = 138.06 Å3) and Fe/TiO2 (a = 3.791 Å, c = 9.532 Å, and V = 136.99 Å3) increases, while Co/TiO2 (a = 3.788 Å, c = 9.520 Å, and V = 136.60 Å3) and Ni/TiO2 (a = 3.788 Å, c = 9.520 Å, and V = 136.60 Å3) decreased compared to the TiO2. This phenomenon is attributed to a well/poor dispersion of the different metallic ions on the surface of the TiO2 [40]. Previous studies have shown that the photocatalytic efficiency of TiO2 was improved by doping with different elements, since this process affects the particle size and the crystalline phase of the materials, achieving an adequate transfer of the photoexcited electron–hole pairs [53]. The modified TiO2 samples show a slight increase in crystallite size due to metallic ions (presence of defects), which is directly related to the decrease in the band gap, that in turn, may improve their photocatalytic activity against organic pollutants [54,55].

3.5. FT-IR Results

Figure 6 shows the FTIR spectra for the pure and deposited-TiO2 nanoparticles. In Figure 6a, the FTIR spectrum of TiO2 shows stretching modes around 1683 cm−1 corresponding to the bending modes of Ti-OH water, the signals around 1557, 1507, and 1339 cm−1 are ascribed to the vibrational modes related to the polymer alkyl chain (PEG); the first is due to the stretching vibrations of CH and the second to the bending of CH and lastly the stretching vibration of CO, which confirms the interaction of PEG on the surface of TiO2 through the H bond [56]. The peaks at 652 and 596 cm−1 are assigned to the lattice vibration of TiO2 (Ti–O–Ti) [57]. In general, deposited-TiO2 materials (Figure 6b) exhibited similar FTIR spectra to pure TiO2; however, the samples exhibited absorption peaks at 2196 and 2341 cm−1; this denotes the existence of CO2 molecule in air [58,59].

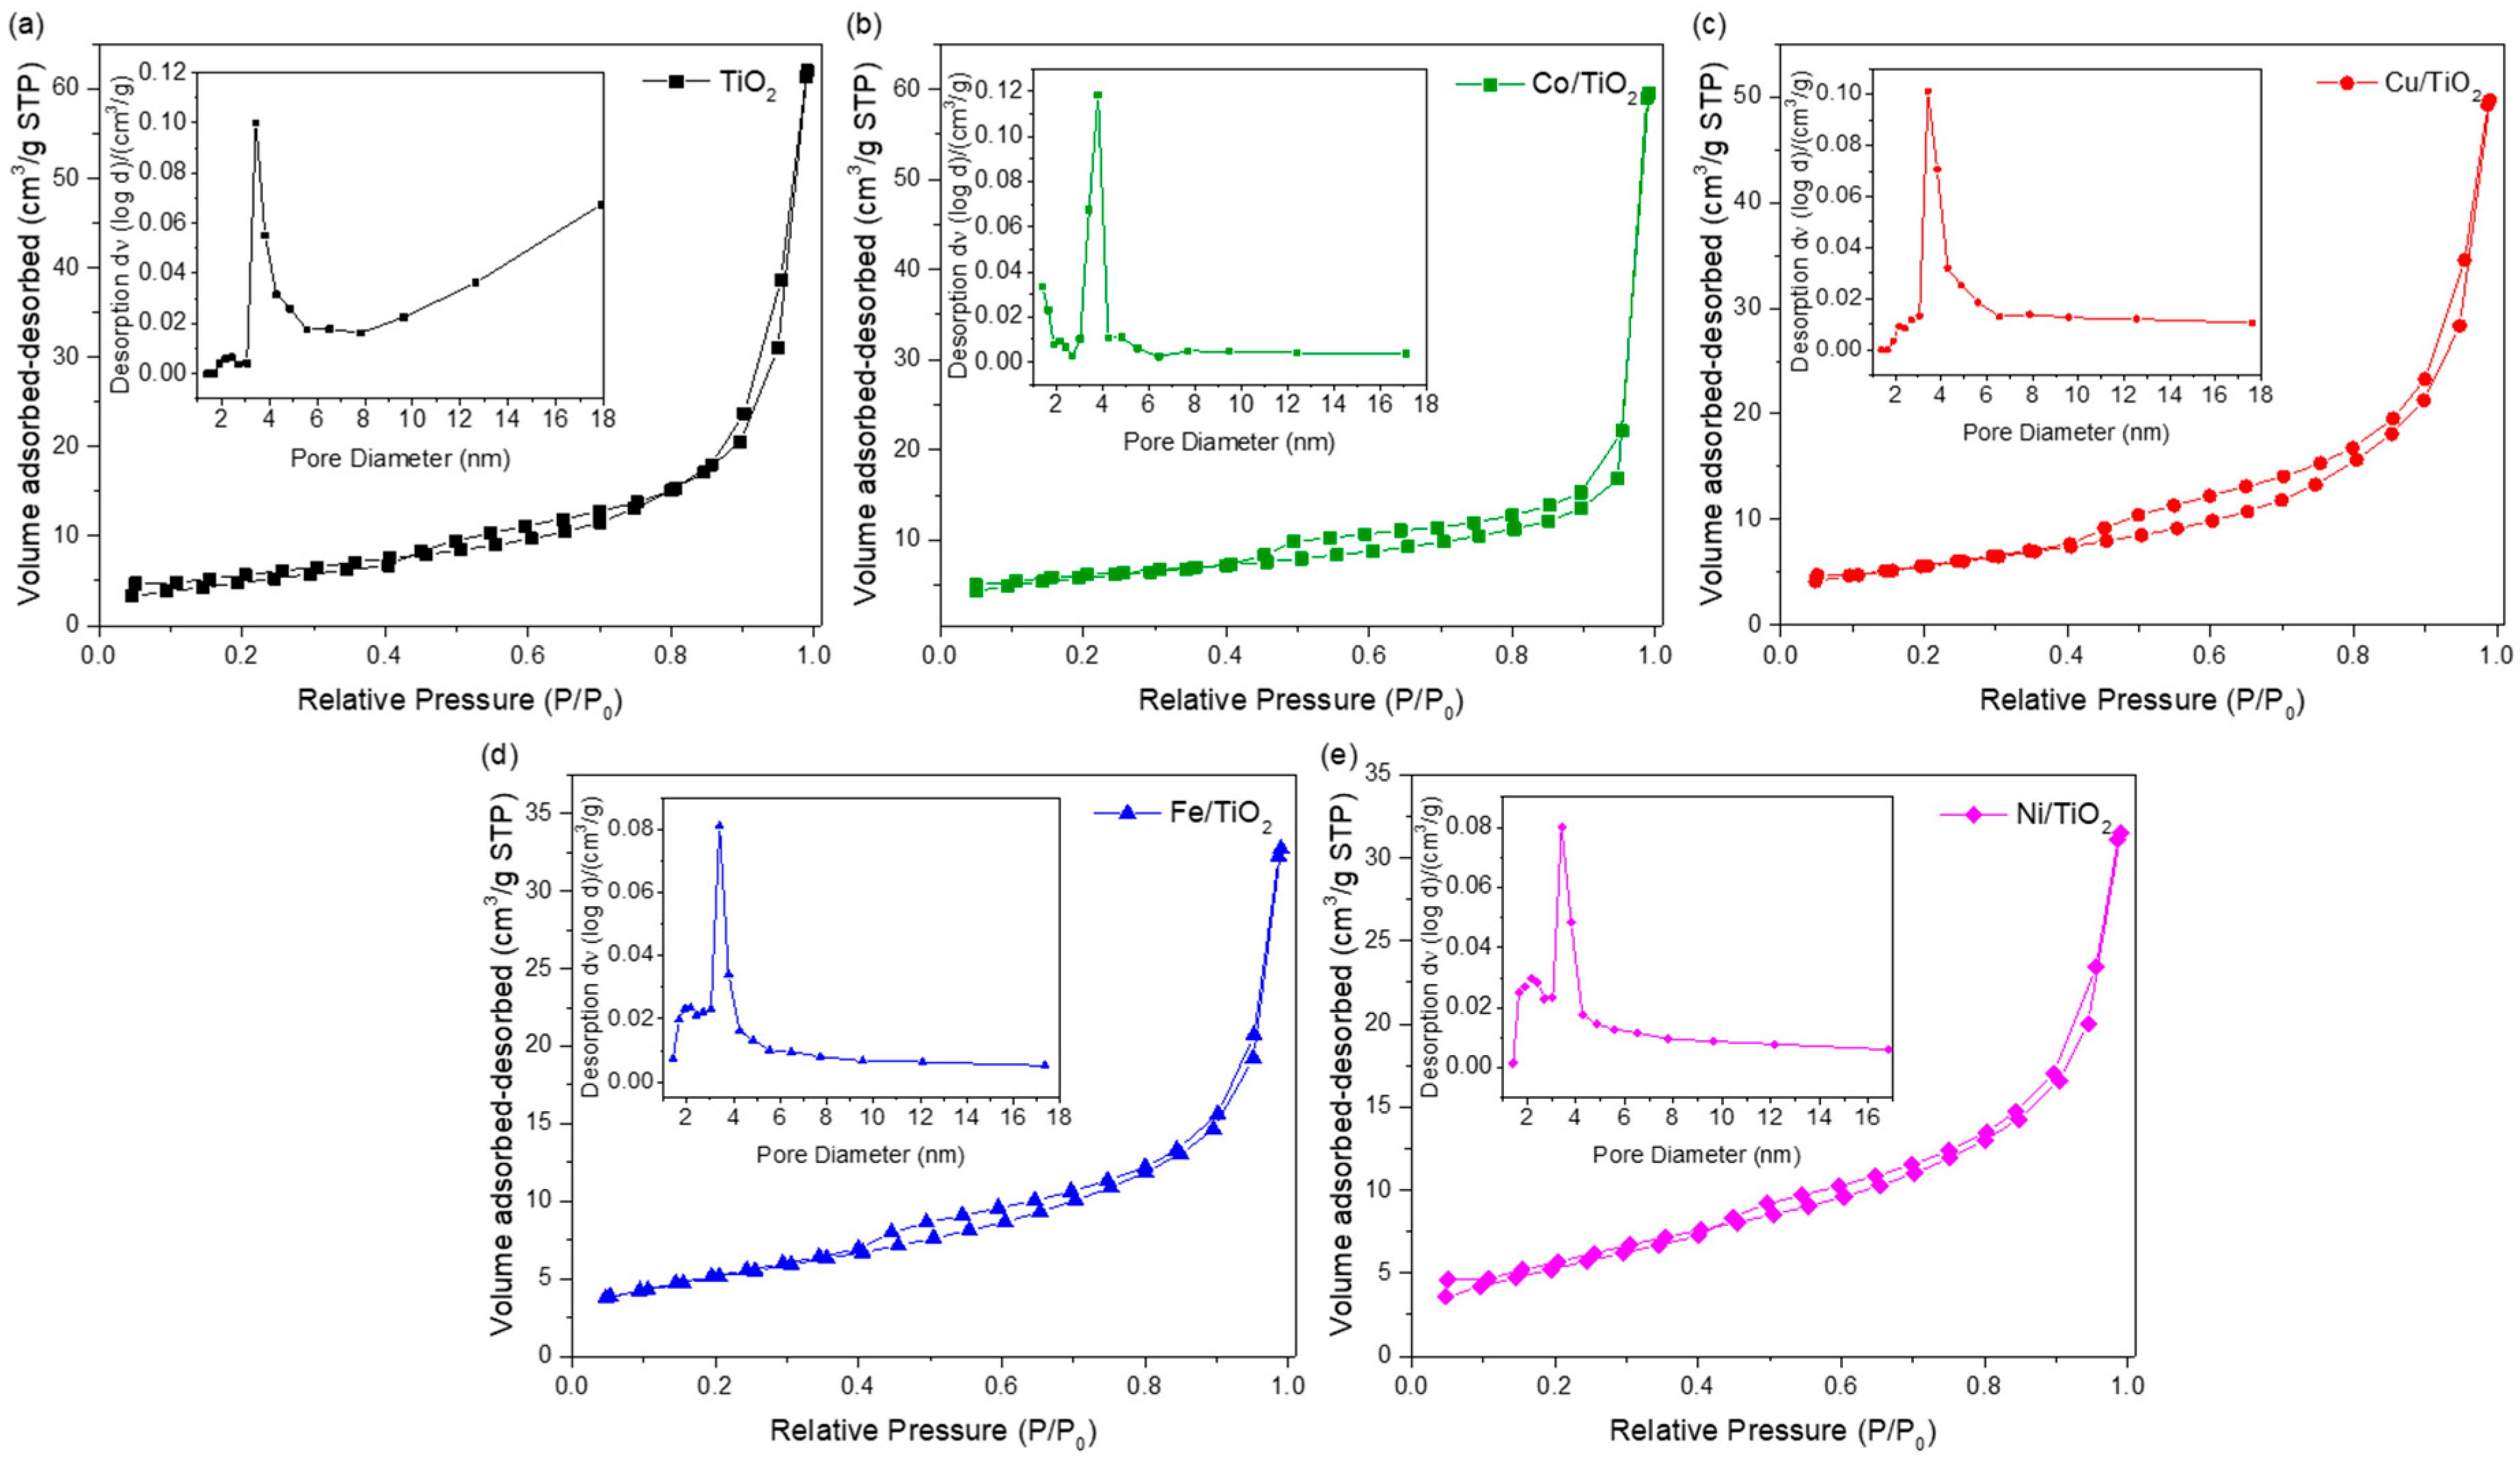
3.6. Nitrogen Physisorption Analysis

Figure 7 shows the adsorption–desorption isotherms of the pure and deposited-TiO2 nanoparticles (M = Co, Cu, Fe, and Ni) and BJH pore size distribution. The deposited materials are classified as Type IV isotherms, associated with the physisorption of mesoporous materials according to IUPAC classification [60]. Moreover, the common characteristic is the hysteresis loops present in the multilayer range of the physisorption isotherms that suggest capillary condensation associated with mesoporous-like structures. The results of pure TiO2 exhibits an H2 type hysteresis loop, which changes to H4 upon deposition of ion metal (Co, Cu, Fe, and Ni) on the surface of the support [48]. These conditions promote the modification of the textural properties of the materials. In Table 1, it can be seen how the volume and average pore size decrease after metal loading. Employing the BJH method, the average pore size was calculated, showing a significant decrement due to the dopant compared to pure TiO2. However, the specific surface areas (SBET) did not present significant changes after the deposition–precipitation process, except for Ni/TiO2, which presents a slight increase (21.3 m2 g−1). The heterogeneous photocatalysis process depends mainly on a mesoporous structure, a small pore diameter, and a large pore volume, achieving a significant improvement in the photocatalyst activity by decreasing the degree of mass transfer [61]. Alalm et al. reported an enhance in the photocatalytic activity due to high surface area enhanced by incorporation of sulfur cations into the lattice of TiO2 [1]. It has been reported that the specific surface area of TiO2 may be influenced by the presence of different metallic ions (Cu, Co, Ni, Pd, Sn, and Zn) and their concentrations loaded in the support [48]. In this context, the surface composition of the resultant nanomaterial may exhibit changes associated with a good dispersion of the metallic ions on the support [62]. The results of the N2 physisorption analysis agree with the SEM and TEM analyses, maintaining a relationship between the nanometric size of the samples and the specific surface area. The mesoporous structure obtained in the synthesized nanomaterials in this study presented a hysteresis loop for P/P0 ~ 0.40, related to agglomerates of cylindrical pores [63]. On the other hand, the SBET results suggest an increase in adsorption process within the active sites promoted by the interaction between the mesoporous structure and the pore size distribution [64]. Furthermore, the incorporation of metallic ions over TiO2 support contributed to an improvement in the efficiency of the photocatalytic activity.

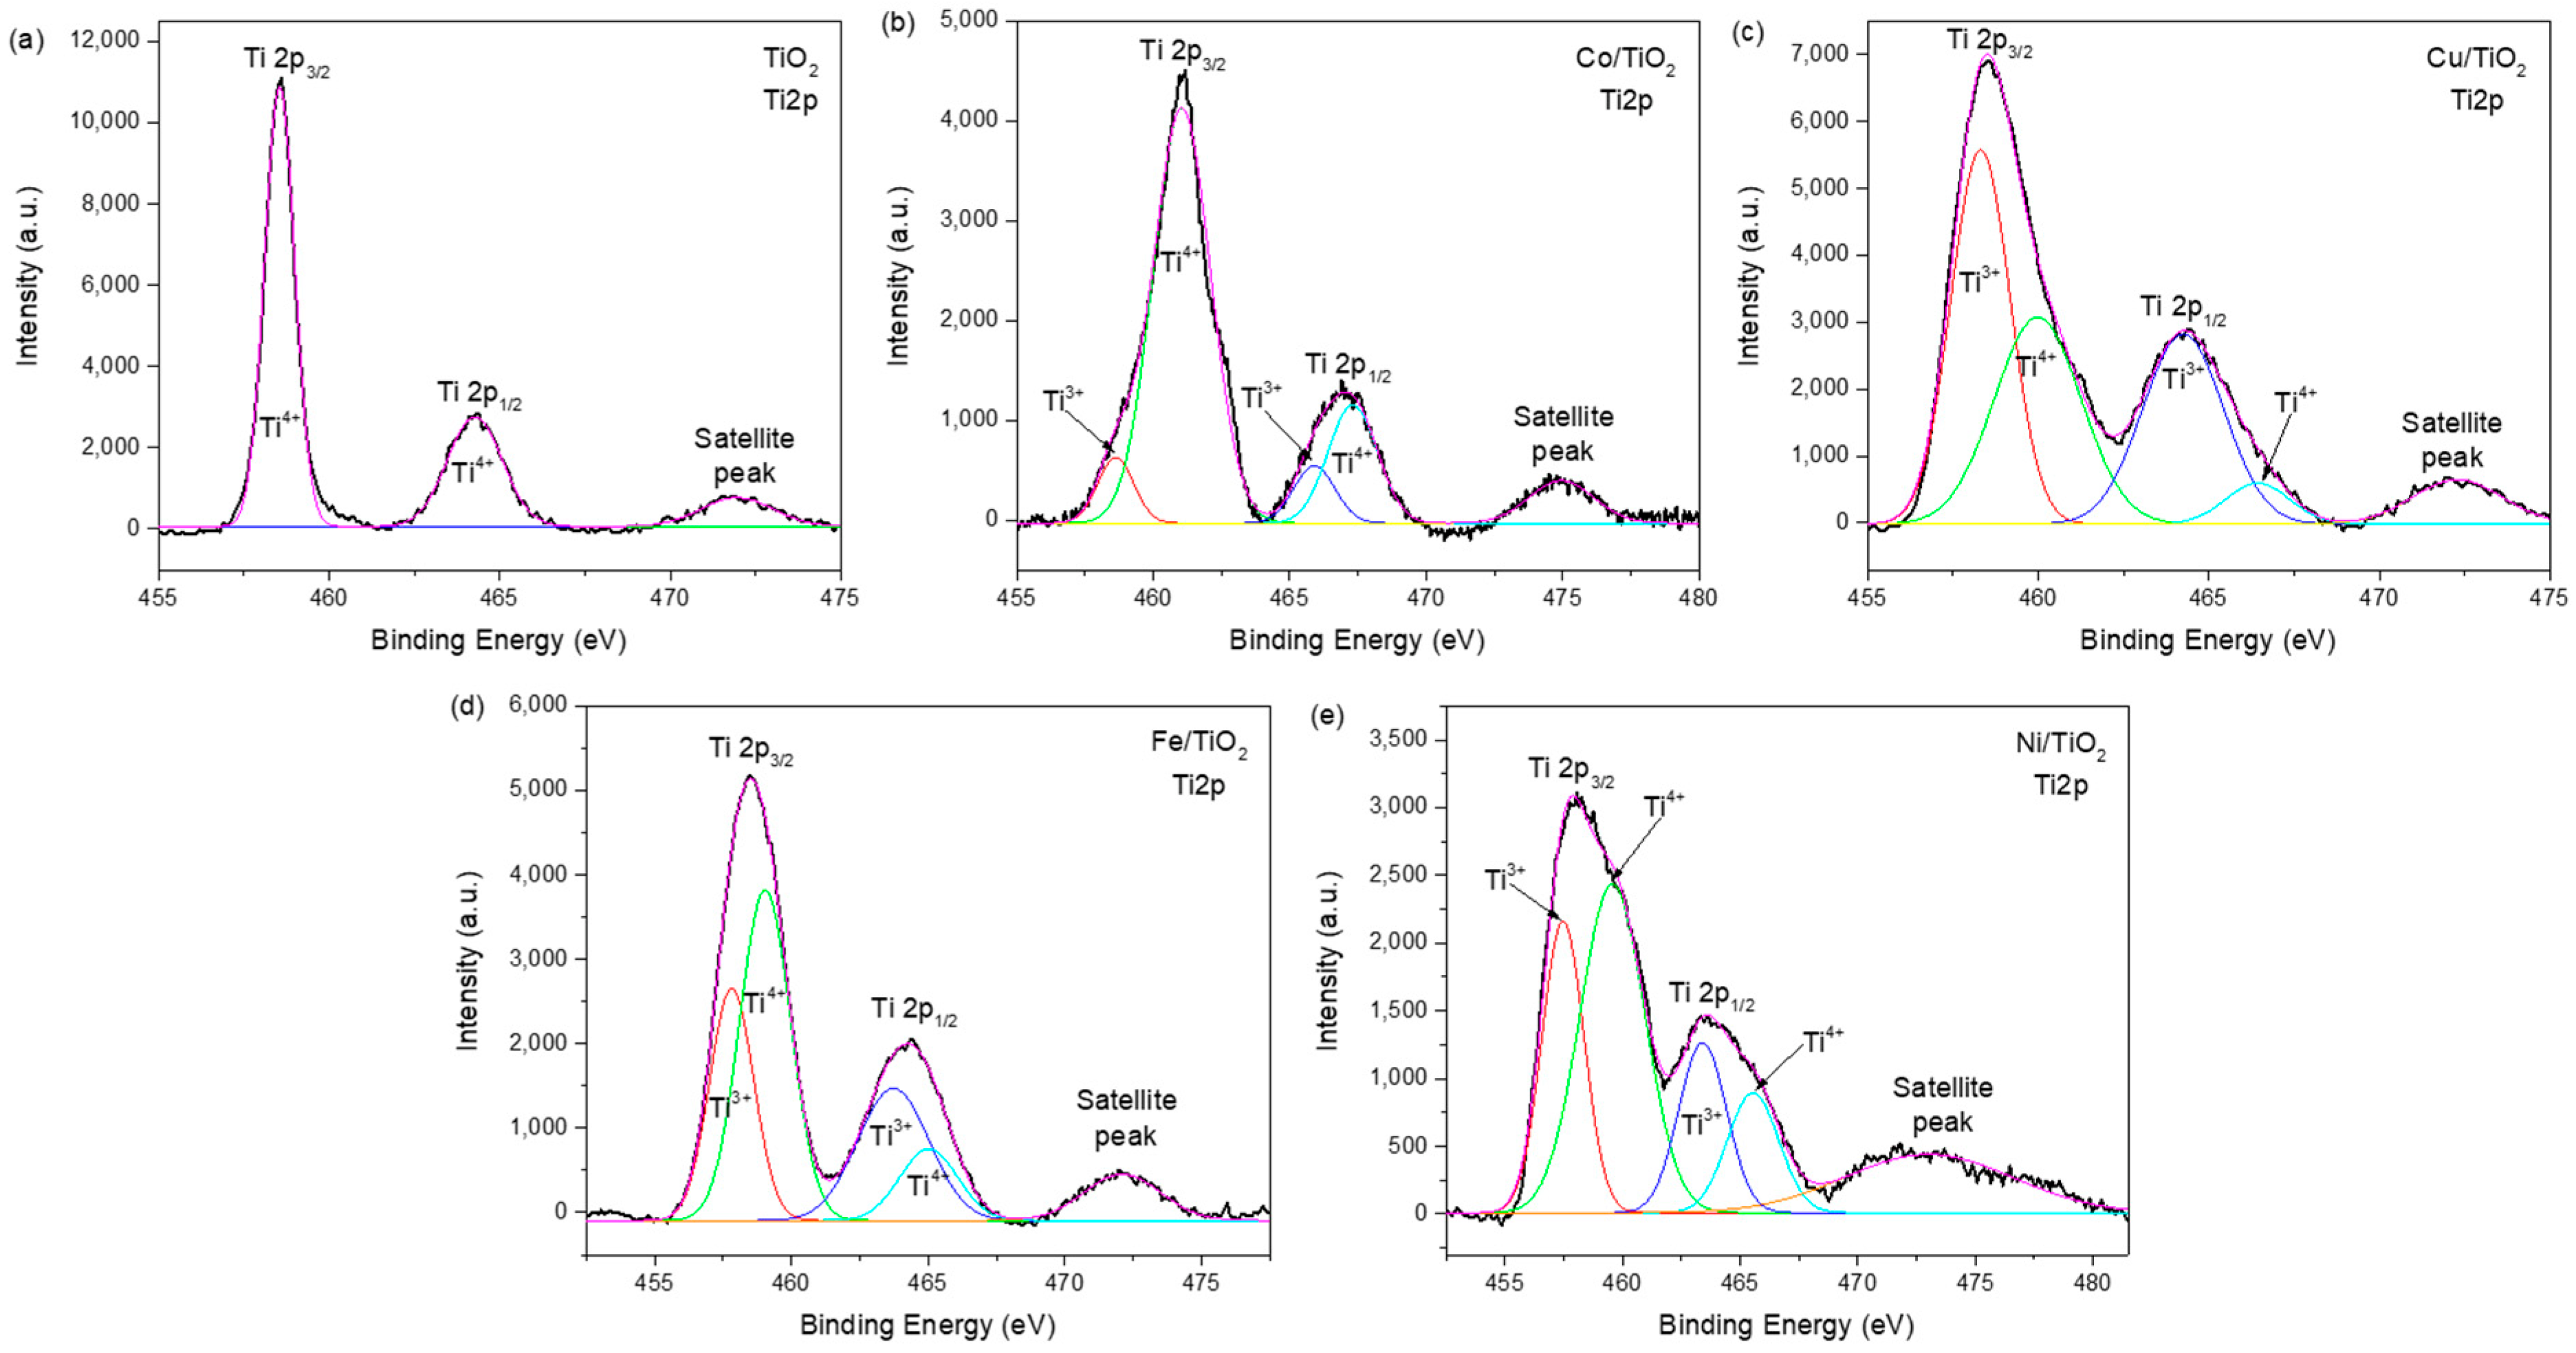
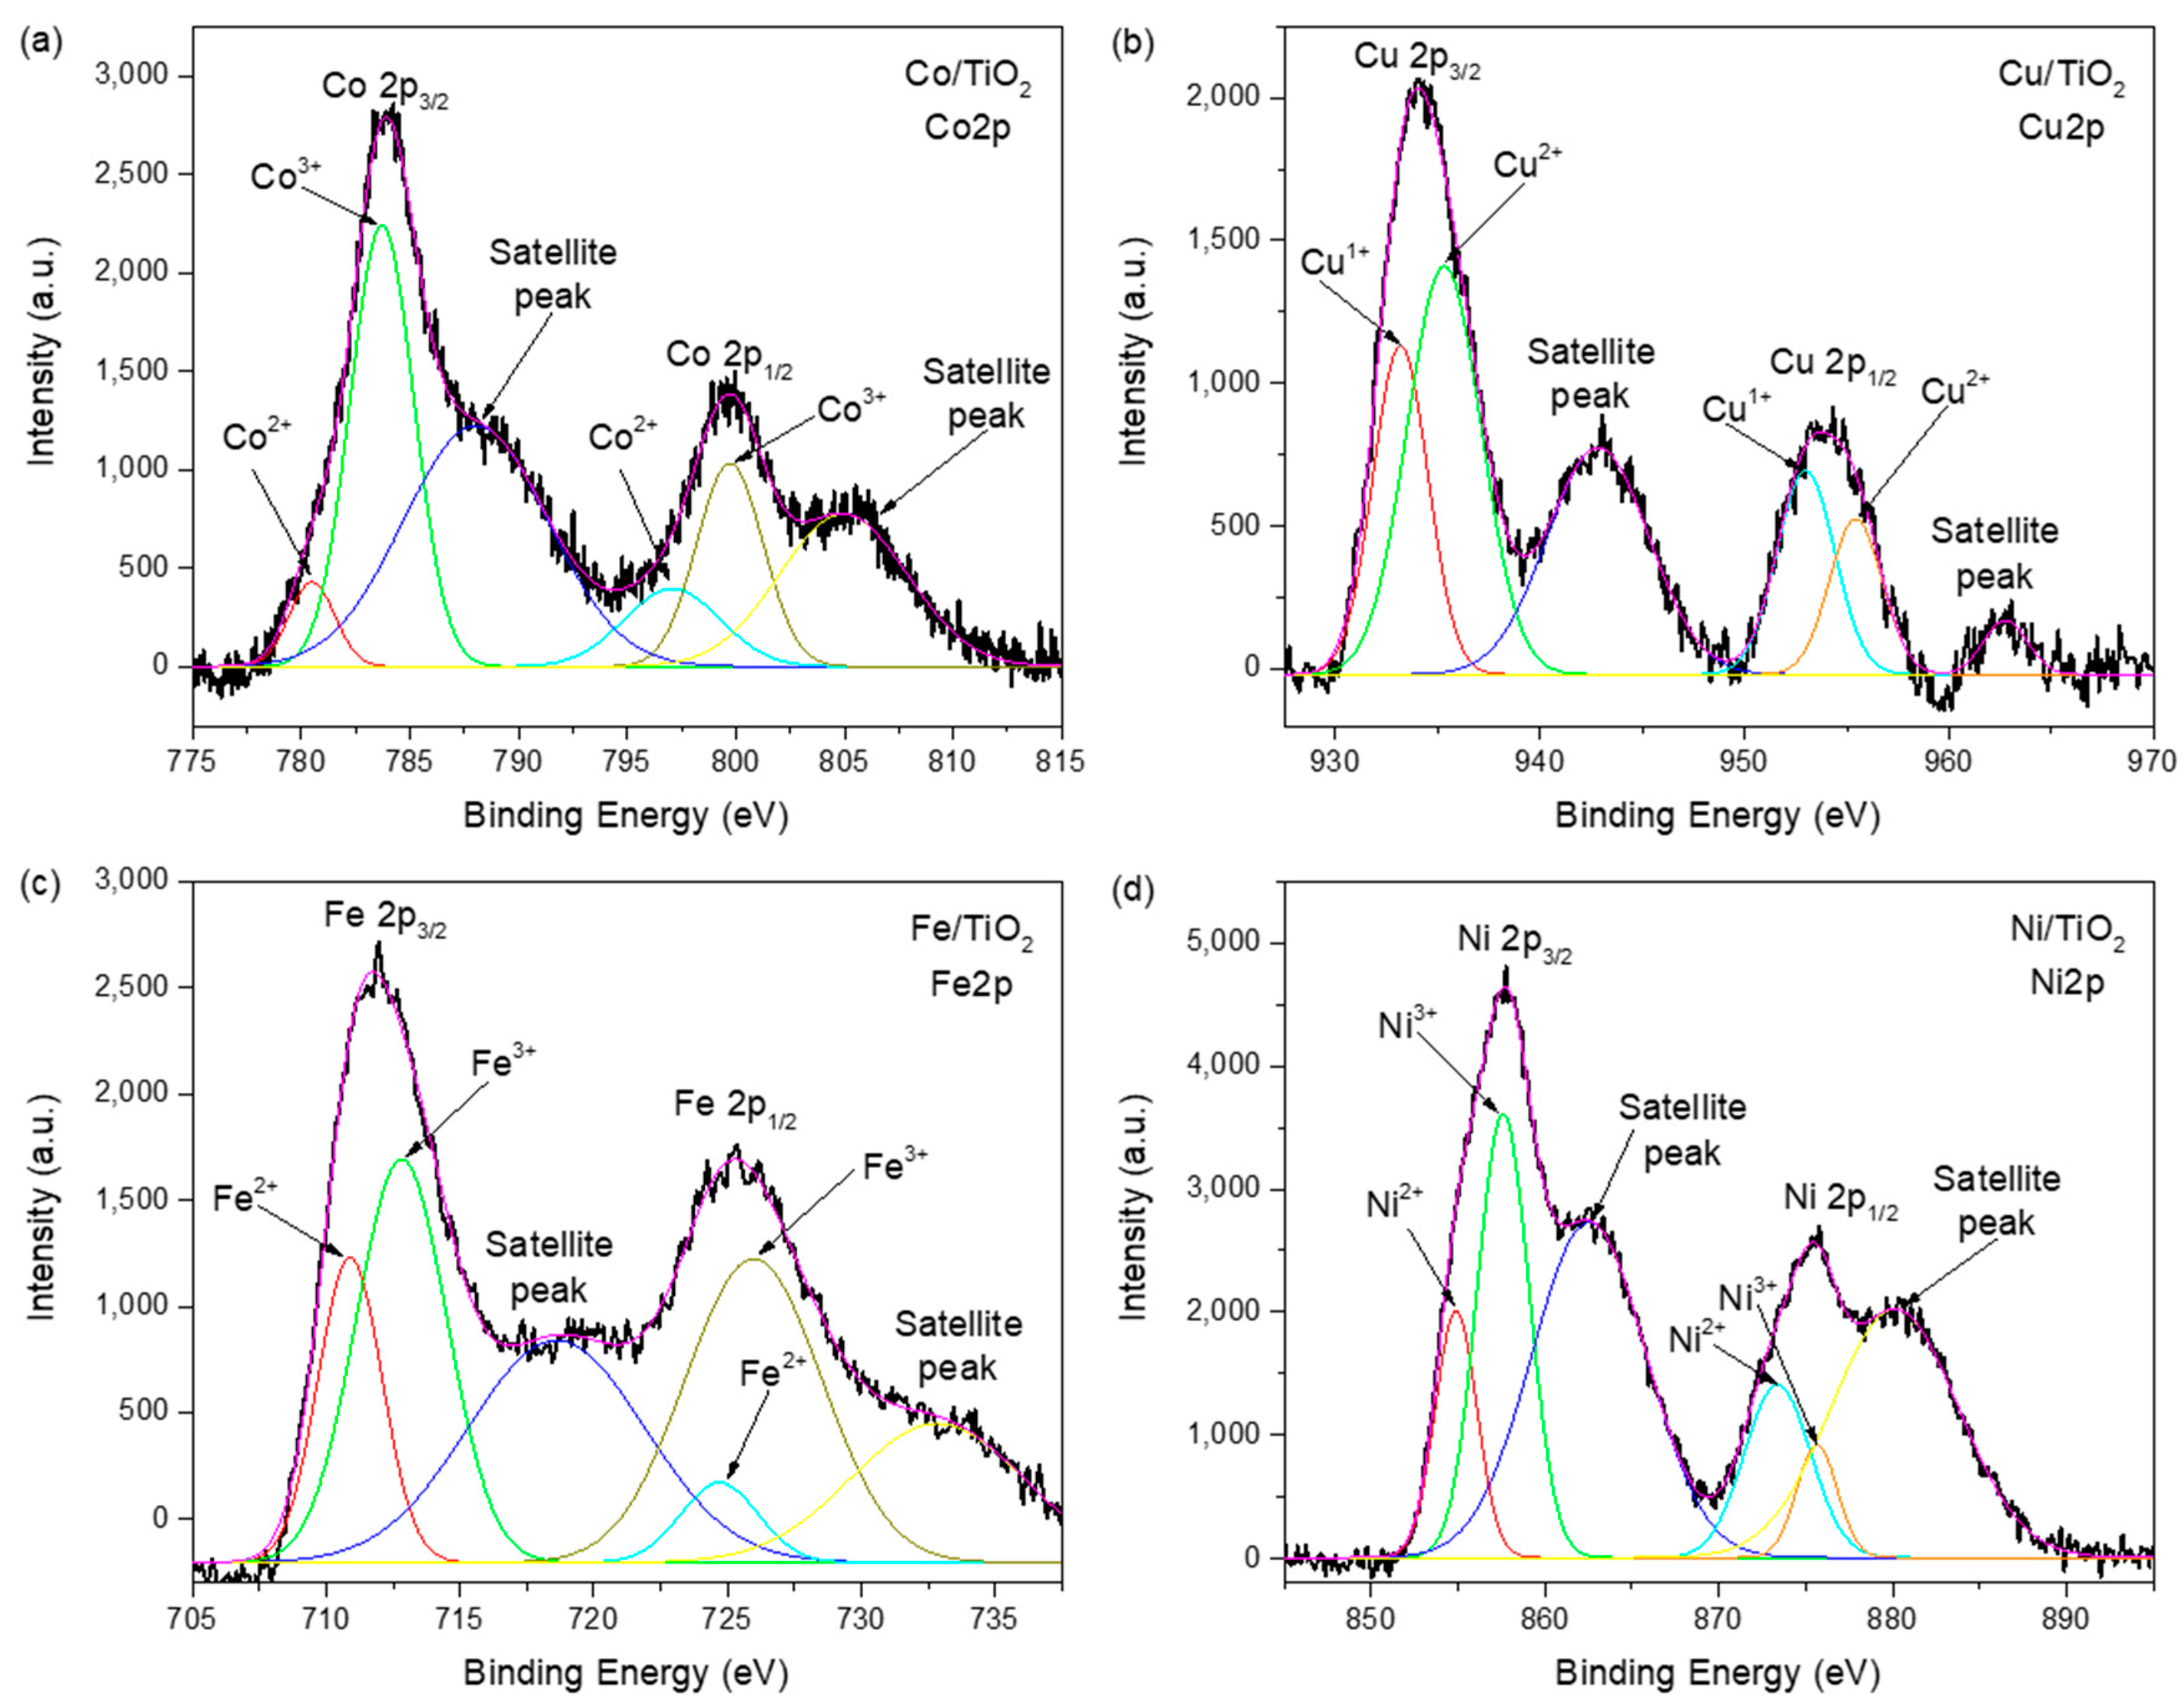
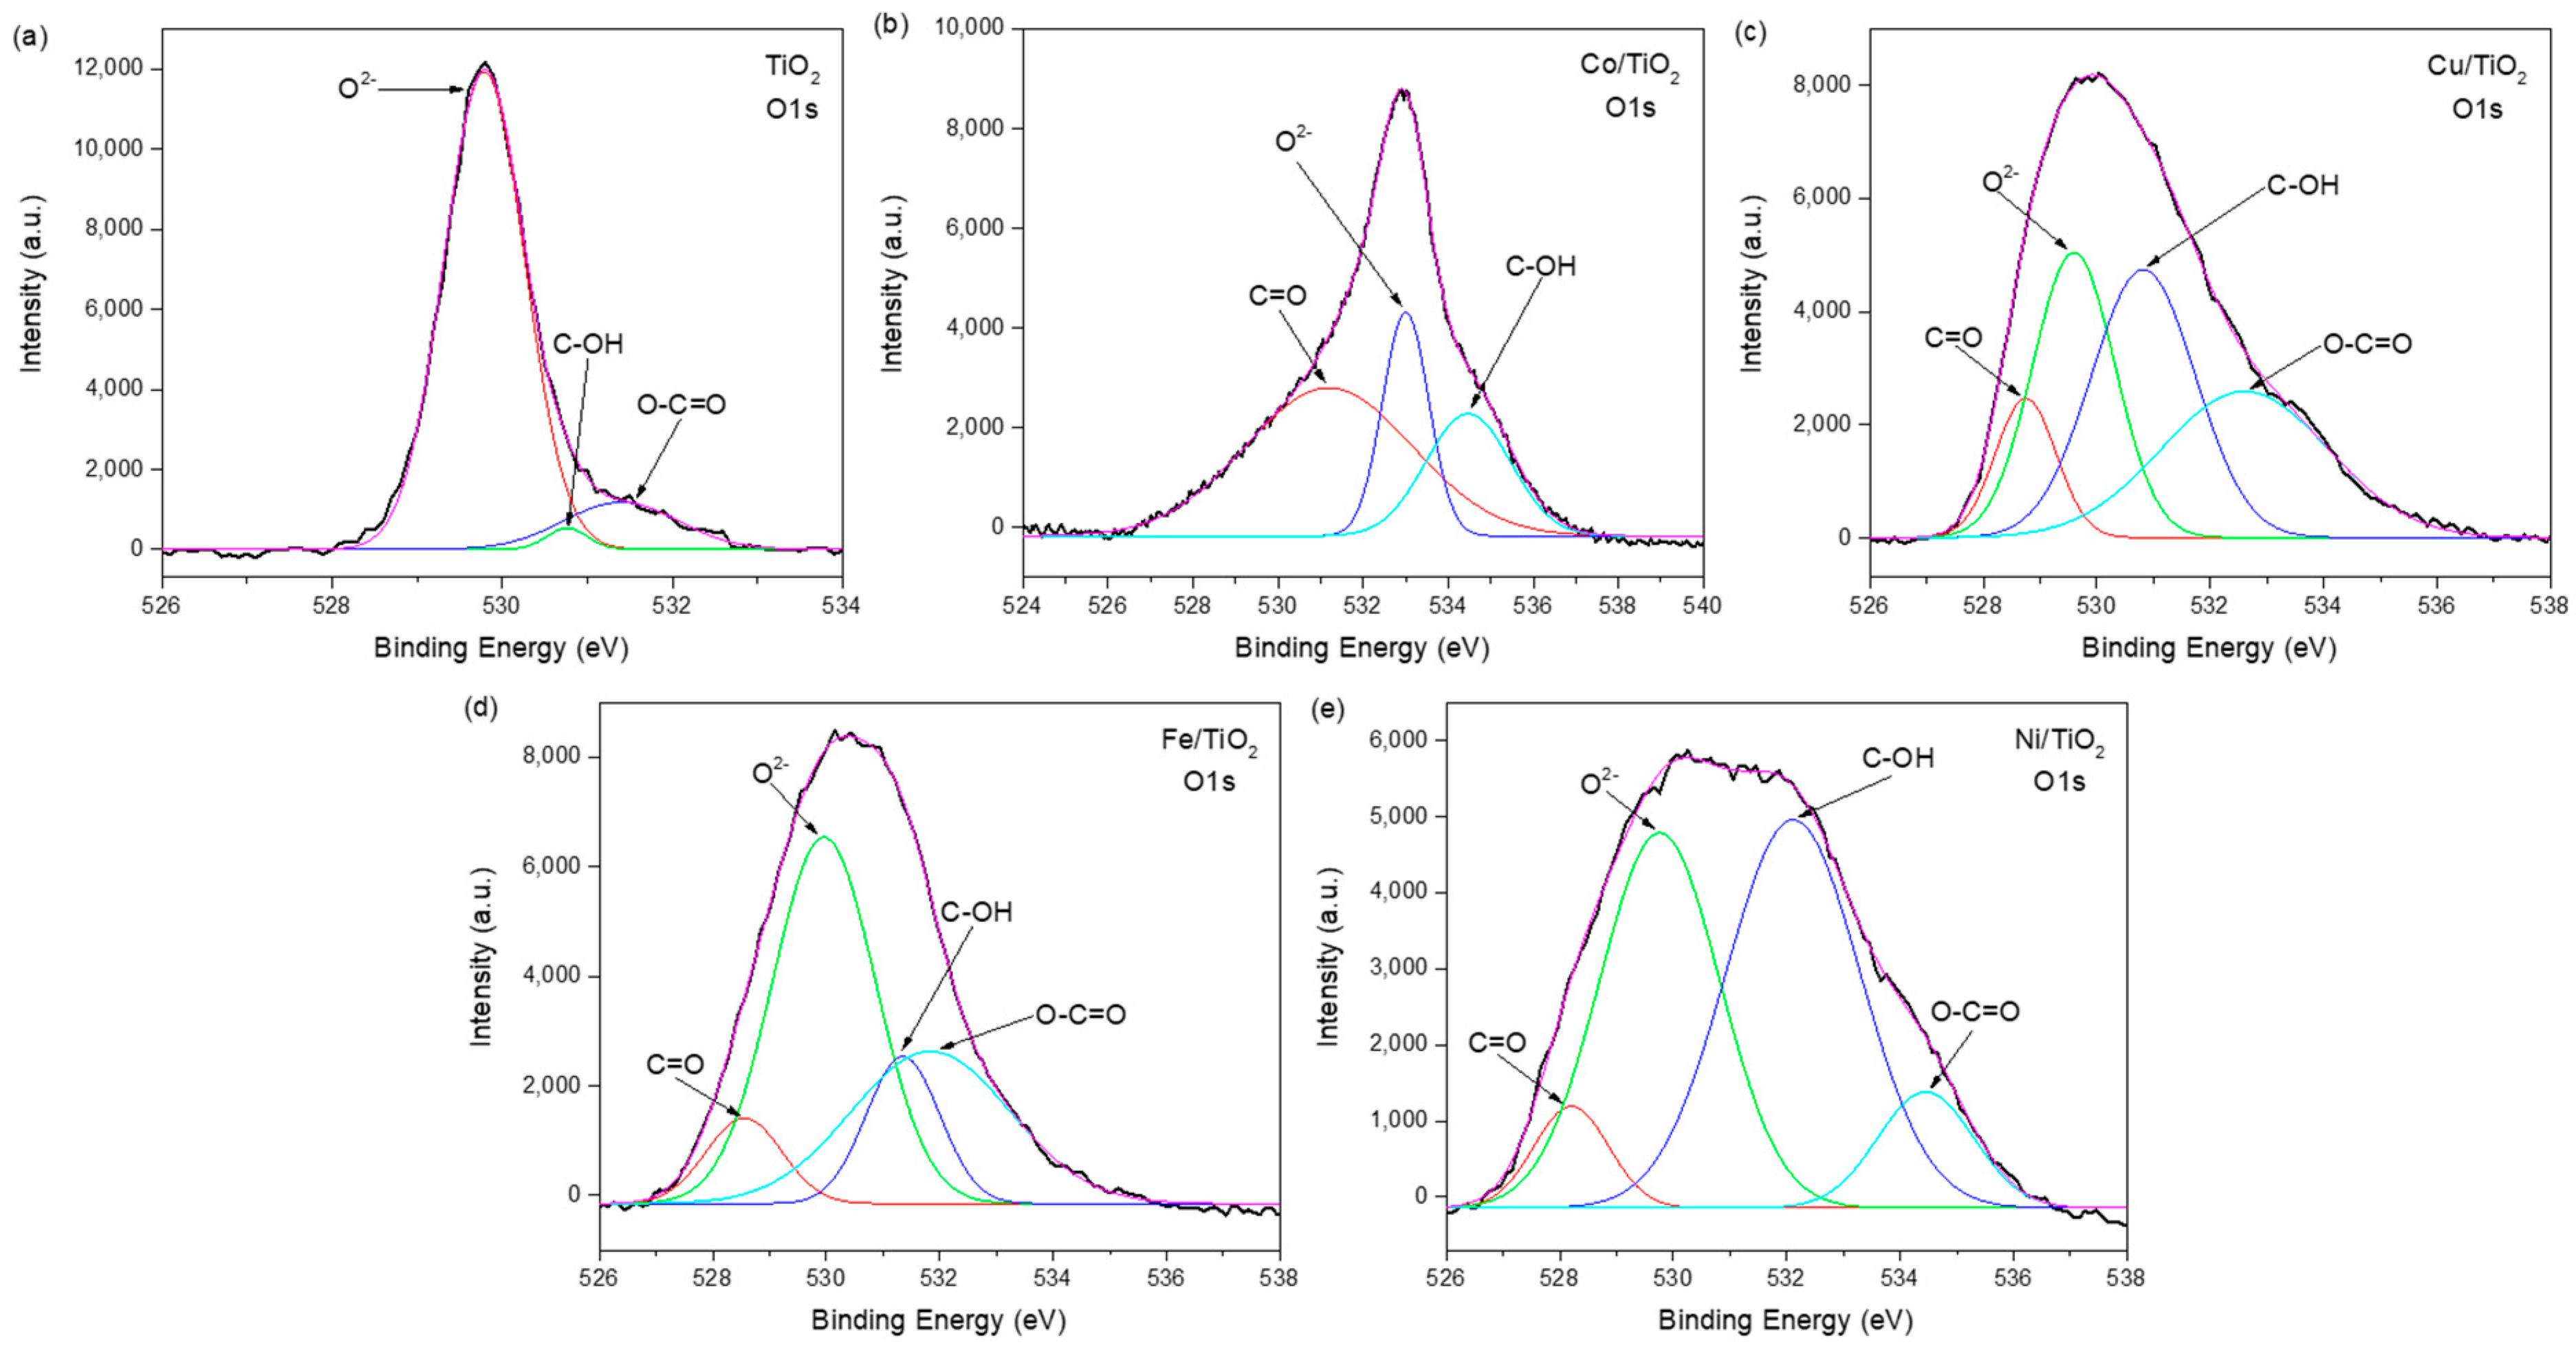
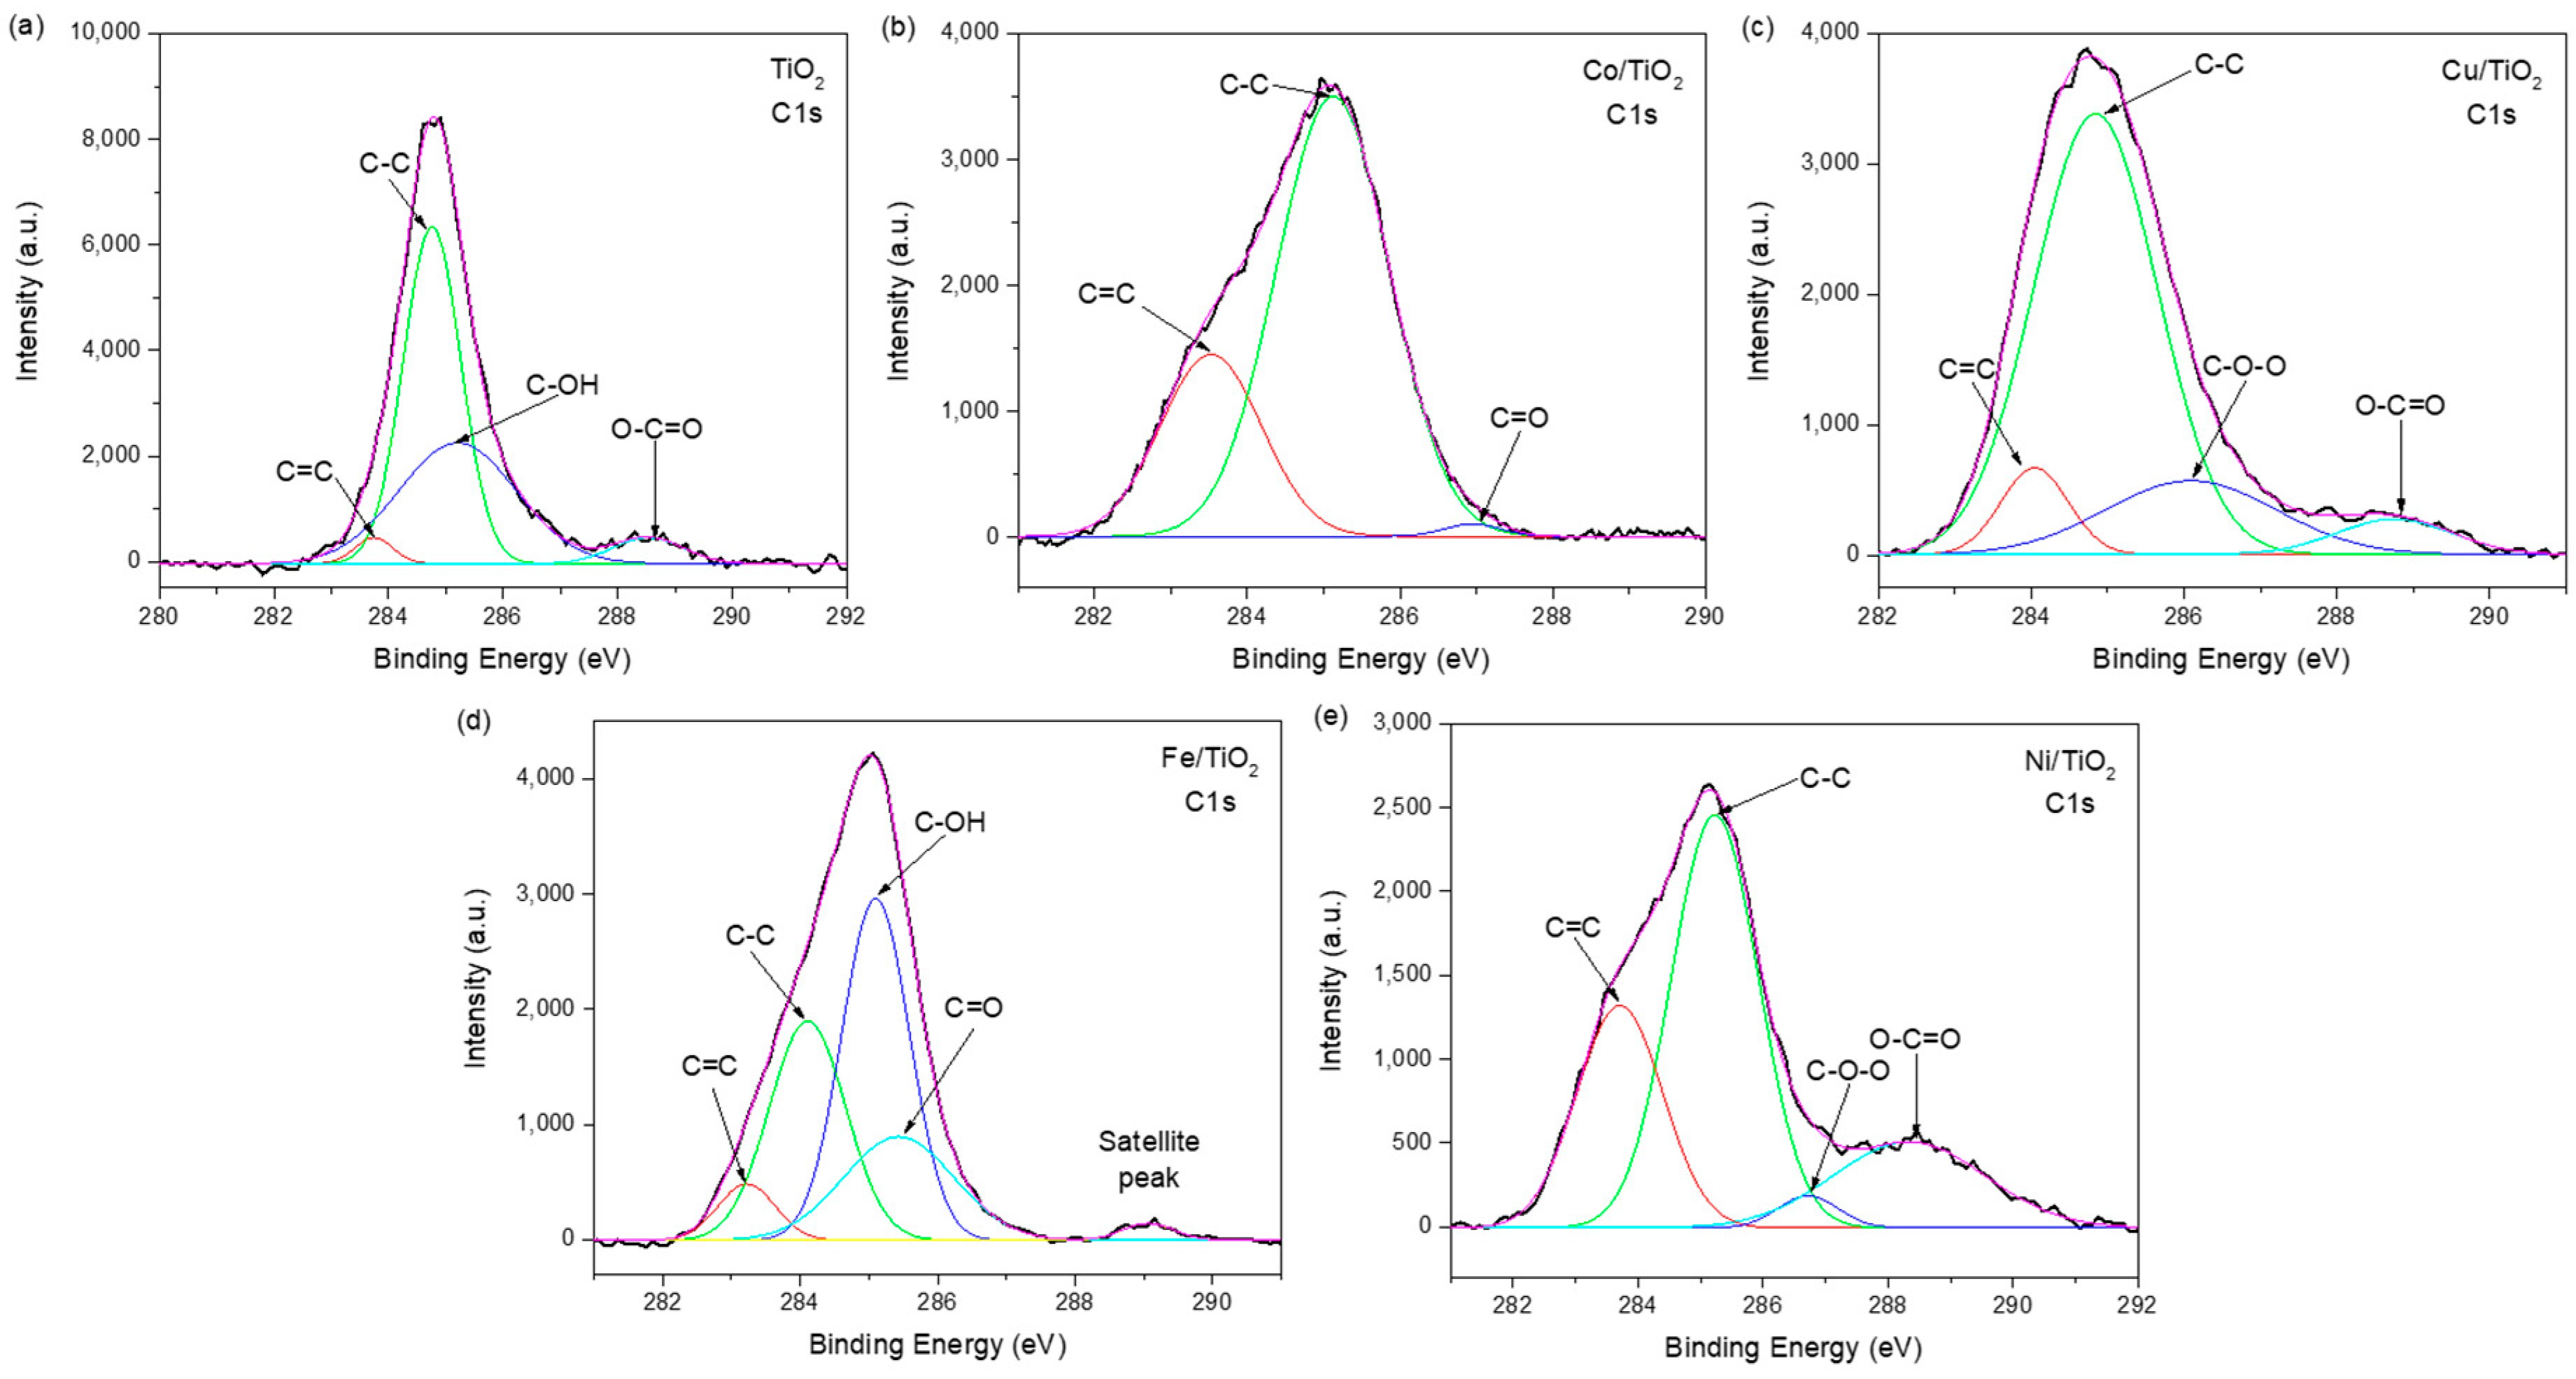
3.7. XPS Spectroscopy Analysis

The XPS analysis was carried out for the identification of elements present and the valence states of the TiO2, Co/TiO2, Cu/TiO2, Fe/TiO2 and Ni/TiO2. Figure 8 shows the deconvoluted XPS spectra of the Ti 2p orbital for the TiO2, and the characteristic peaks for Ti 2p3/2 were observed at 458.55, and 464.27 eV for Ti4+ [65]. After depositing, the nanoparticles show the presence of the valence state Ti3+ indicating the formation of Ti2O3 in the nanoparticles, which suggests a development of mixed oxides and TiO2 [66]. The shift in the position of these peaks indicates an influence of ion addition on the electronic state of Ti, and the presence of Ti3+ indicates the formation of Ti-O-M structure over the lattice of the support [65]. In the case of deposited nanomateriales Ti4+, these peaks were found at 461.04 (Co/TiO2), 459.99 (Cu/TiO2), 458.91 (Fe/TiO2), and 458.06 eV (Ni/TiO2) for Ti 2p3/2 and 467.31 (Co/TiO2), 466.43 (Cu/TiO2), 472.01 (Fe/TiO2), and 464.41 eV (Ni/TiO2) for Ti 2p1/2. The Ti3+ species was located at 458.62, 458.31, 457.72, and 456.88 eV, for Ti 2p3/2, respectively. Additionally, the photoelectronic splitting of Ti 2p1/2 was located at 465.89, 464.25, 471.57, and 462.85 for Ti3+, respectively [65,67]. These results are in agreement with those previously reported in the literature [68,69,70,71]. A satellite peak was also observed at 464.21 (Fe/TiO2) and 460.04 (Ni/TiO2) for Ti 2p3/2 and 471.96 (TiO2), 474.95 (Co/TiO2), 472.29 (Cu/TiO2), 477.58 (Fe/TiO2), and 469.87 (Ni/TiO2) eV for Ti 2p1/2 [72,73].
The different species (Co/TiO2, Cu/TiO2, Fe/TiO2, and Ni/TiO2) are present in Figure 9 as 2p3/2 and 2p1/2 for nanomaterials. The valence state of Co/TiO2 corresponding to Co 2p3/2 are located at 783.71 (Co3+) and 780.49 eV (Co2+); additionally, the peaks of Co 2p1/2 are presented at 799.72 (Co3+) and 797.07 eV (Co2+) [22]. The Cu/TiO2 NPs presents signals characteristic to Cu 2p3/2 at 933.31 (Cu+) and 935.58 eV (Cu2+), for Cu 2p1/2, the peaks were found at 953.04 (Cu+) and 955.49 eV (Cu2+) [46]. In the case of Fe/TiO2, the signals of Fe 2p3/2 are located at 710.89 (Fe2+) and 712.82 eV (Fe3+), 724.70 (Fe2+) and 725.98 eV (Fe3+) for Fe 2p1/2 [22]. The signals of Ni/TiO2 are located at 857.28 and 862.76 eV for Ni 2p3/2. On the other hand, the peaks for Ni 2p1/2 were located at 874.73 and 881.02 eV [74]. Additional shake-up satellites signals were identified at 788.04 Co+, 804.94 Co+, 942.83 Cu+, 962.76 Cu+, 718.60 Fe+, 732.84 Fe+, 865.81 Ni+, and 885.59 eV Ni+ are also observed (Figure 9). The identification of parameters of the physic-chemical surface provides an idea of the elements in the sample, the chemical state in which they are found, and the identification of defect origins for the oxygen vacancy.
Figure 10 illustrates the XPS spectra of O 1s, and TiO2 pure shows a strong signal at 530.76 eV attributed to the crystal lattice oxygen O2− (O-Ti bond) [75]. The deposited samples show the same peak signal at 532.29 (Co/TiO2), 529.59 (Cu/TiO2), 529.96 (Fe/TiO2), and 529.76 eV (Ni/TiO2) [76]. The broad band centered at 529.79, 531.19, 528.75, 528.55, and 528.20 eV that are associated with C=O (oxygen double bond to aromatic carbon) group, respectively [77]. The peaks at about 531.39 (TiO2), 533.00 (Co/TiO2), 530.82 (Cu/TiO2), 531.35 (Fe/TiO2), and 532.11 eV (Ni/TiO2) indicate the presence of C-OH or adsorbed OH group [78]. The bonds observed at 534.47 (Co/TiO2), 532.61 (Cu/TiO2), 531.84 (Fe/TiO2), and 534.45 eV (Ni/TiO2) correspond to the O-C=O group [78,79]. According to these data, the photocatalysts presented an improvement in the generation of hydroxyl groups, which are essential in photocatalytic applications since they interact with photoinduced holes by promoting the production of hydroxyl radicals on the surface of materials, favoring oxidation reactions during photocatalytic degradation of organic pollutants [64].
On the other hand, the presence of C in the XPS spectra resulted from the organic compounds used during the deposition–precipitation method, indicating the addition of ions elements during these processes. The principal peak (C-C) of C 1s spectra (Figure 11) shows signals from about 284.77 (TiO2), 285.09 (Co/TiO2), 284.84 (Cu/TiO2), 284.11 (Fe/TiO2), and 285.23 eV (Ni/TiO2). The C 1s shows the C=C chemical state at 283.81, 283.31, 284.05, 283.22, and 283.71 eV, respectively. The C-OH group appears at 285.35 (TiO2) and 285.43 eV (Fe/TiO2). The peaks at 286.09 (Cu/TiO2) and 286.72 eV (Ni/TiO2) correspond to group C-O-O. The peaks assigned at 287.46 (Co/TiO2) and 289.06 (Fe/TiO2) are attributed to group C=O. In addition, peaks at 288.53 (TiO2), 288.75 (Cu/TiO2) and 288.33 eV (Cu/TiO2) were related with group O-C=O. These results are similar with those reported by Feng et al. [80] and Dougherty et al. [78].

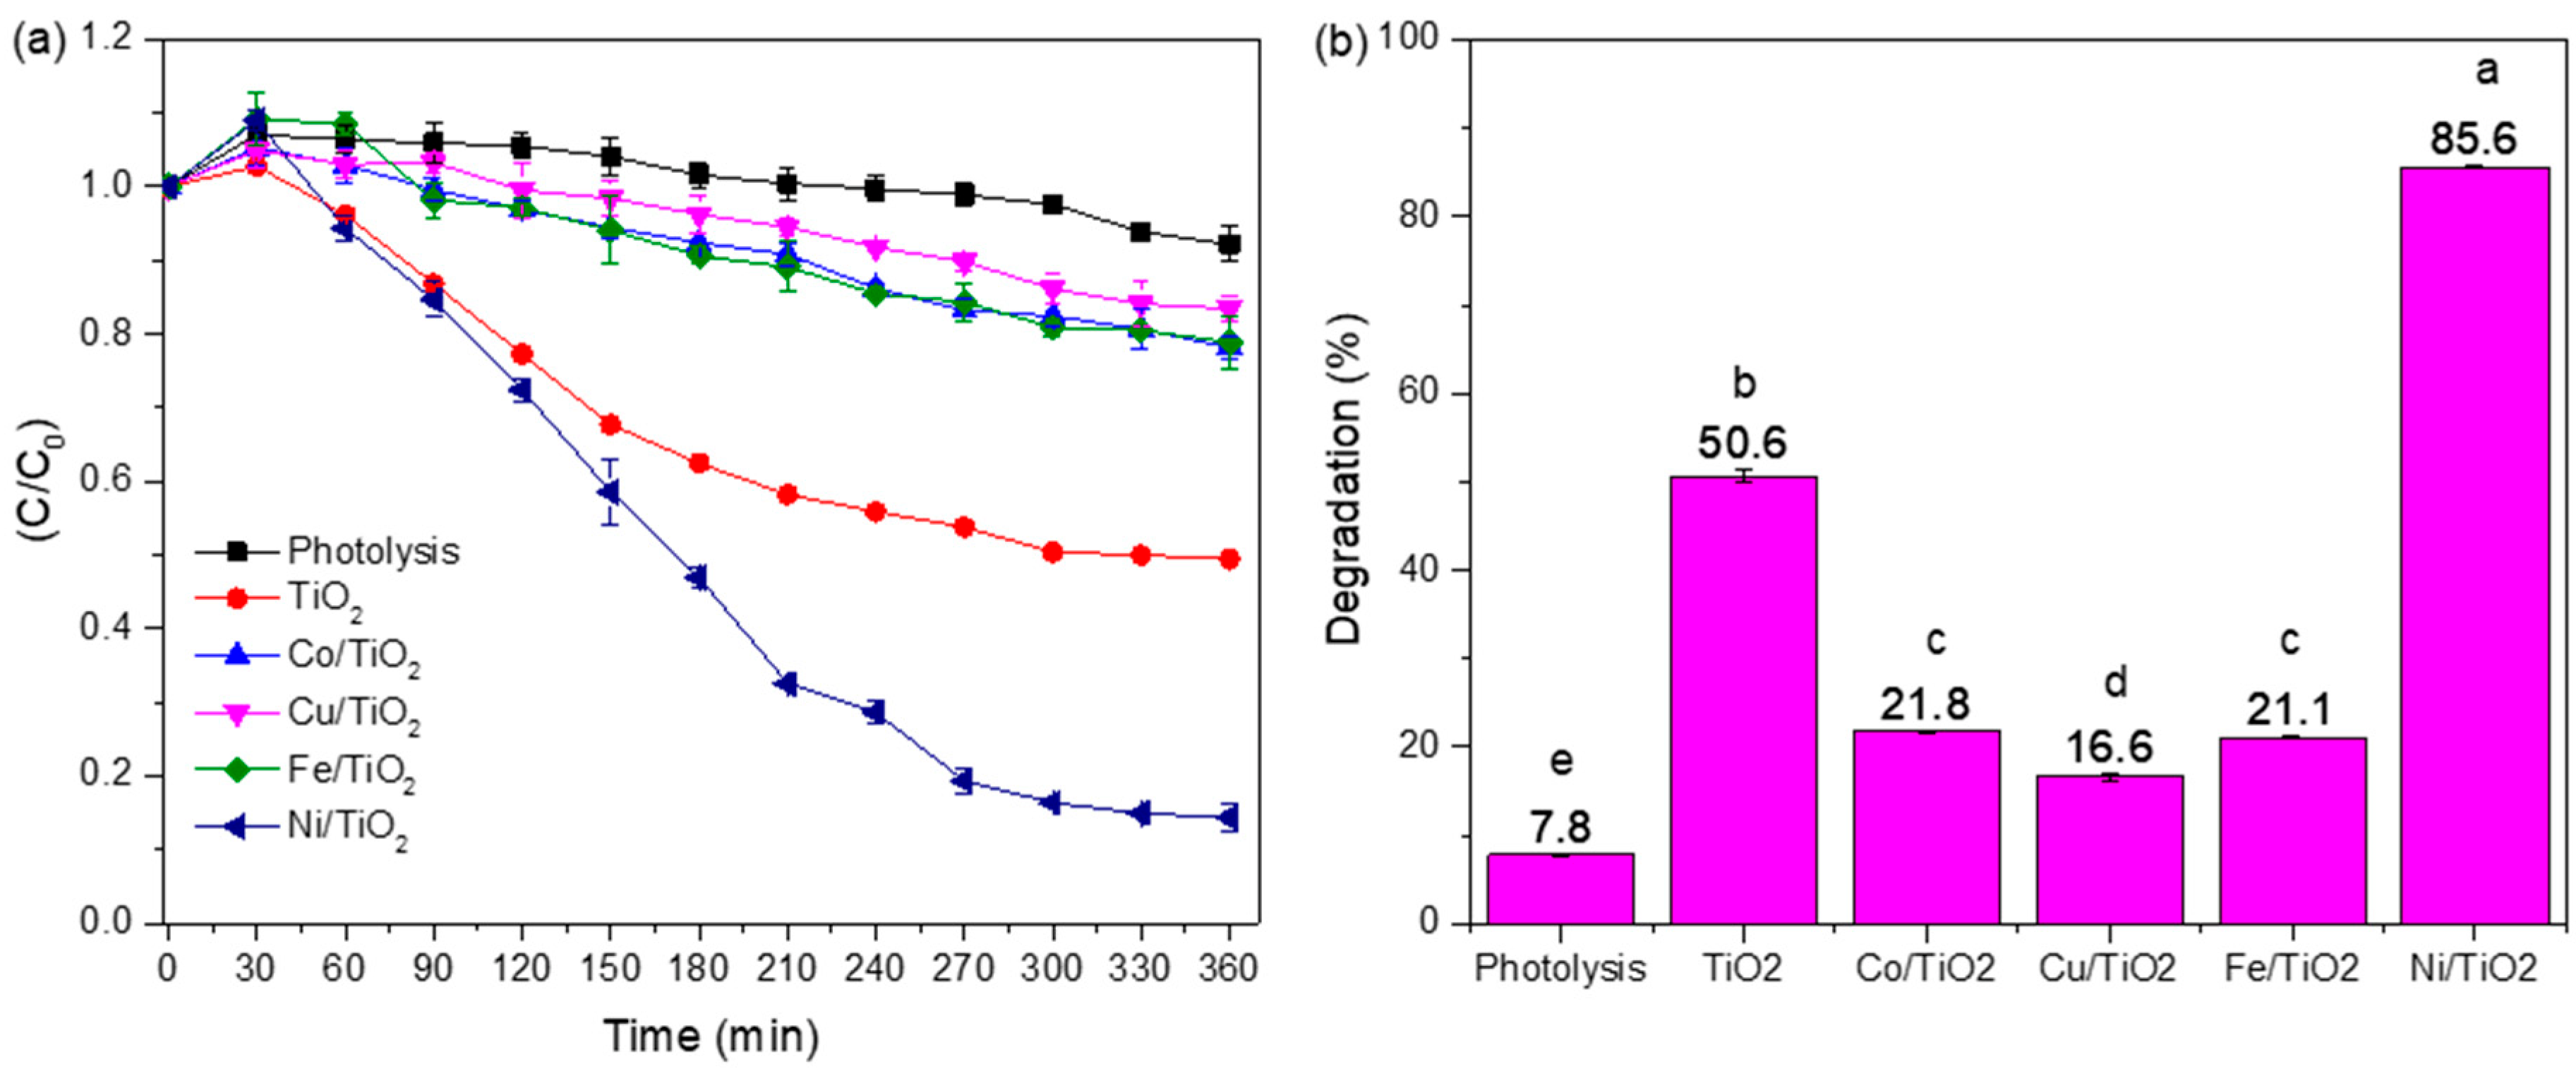
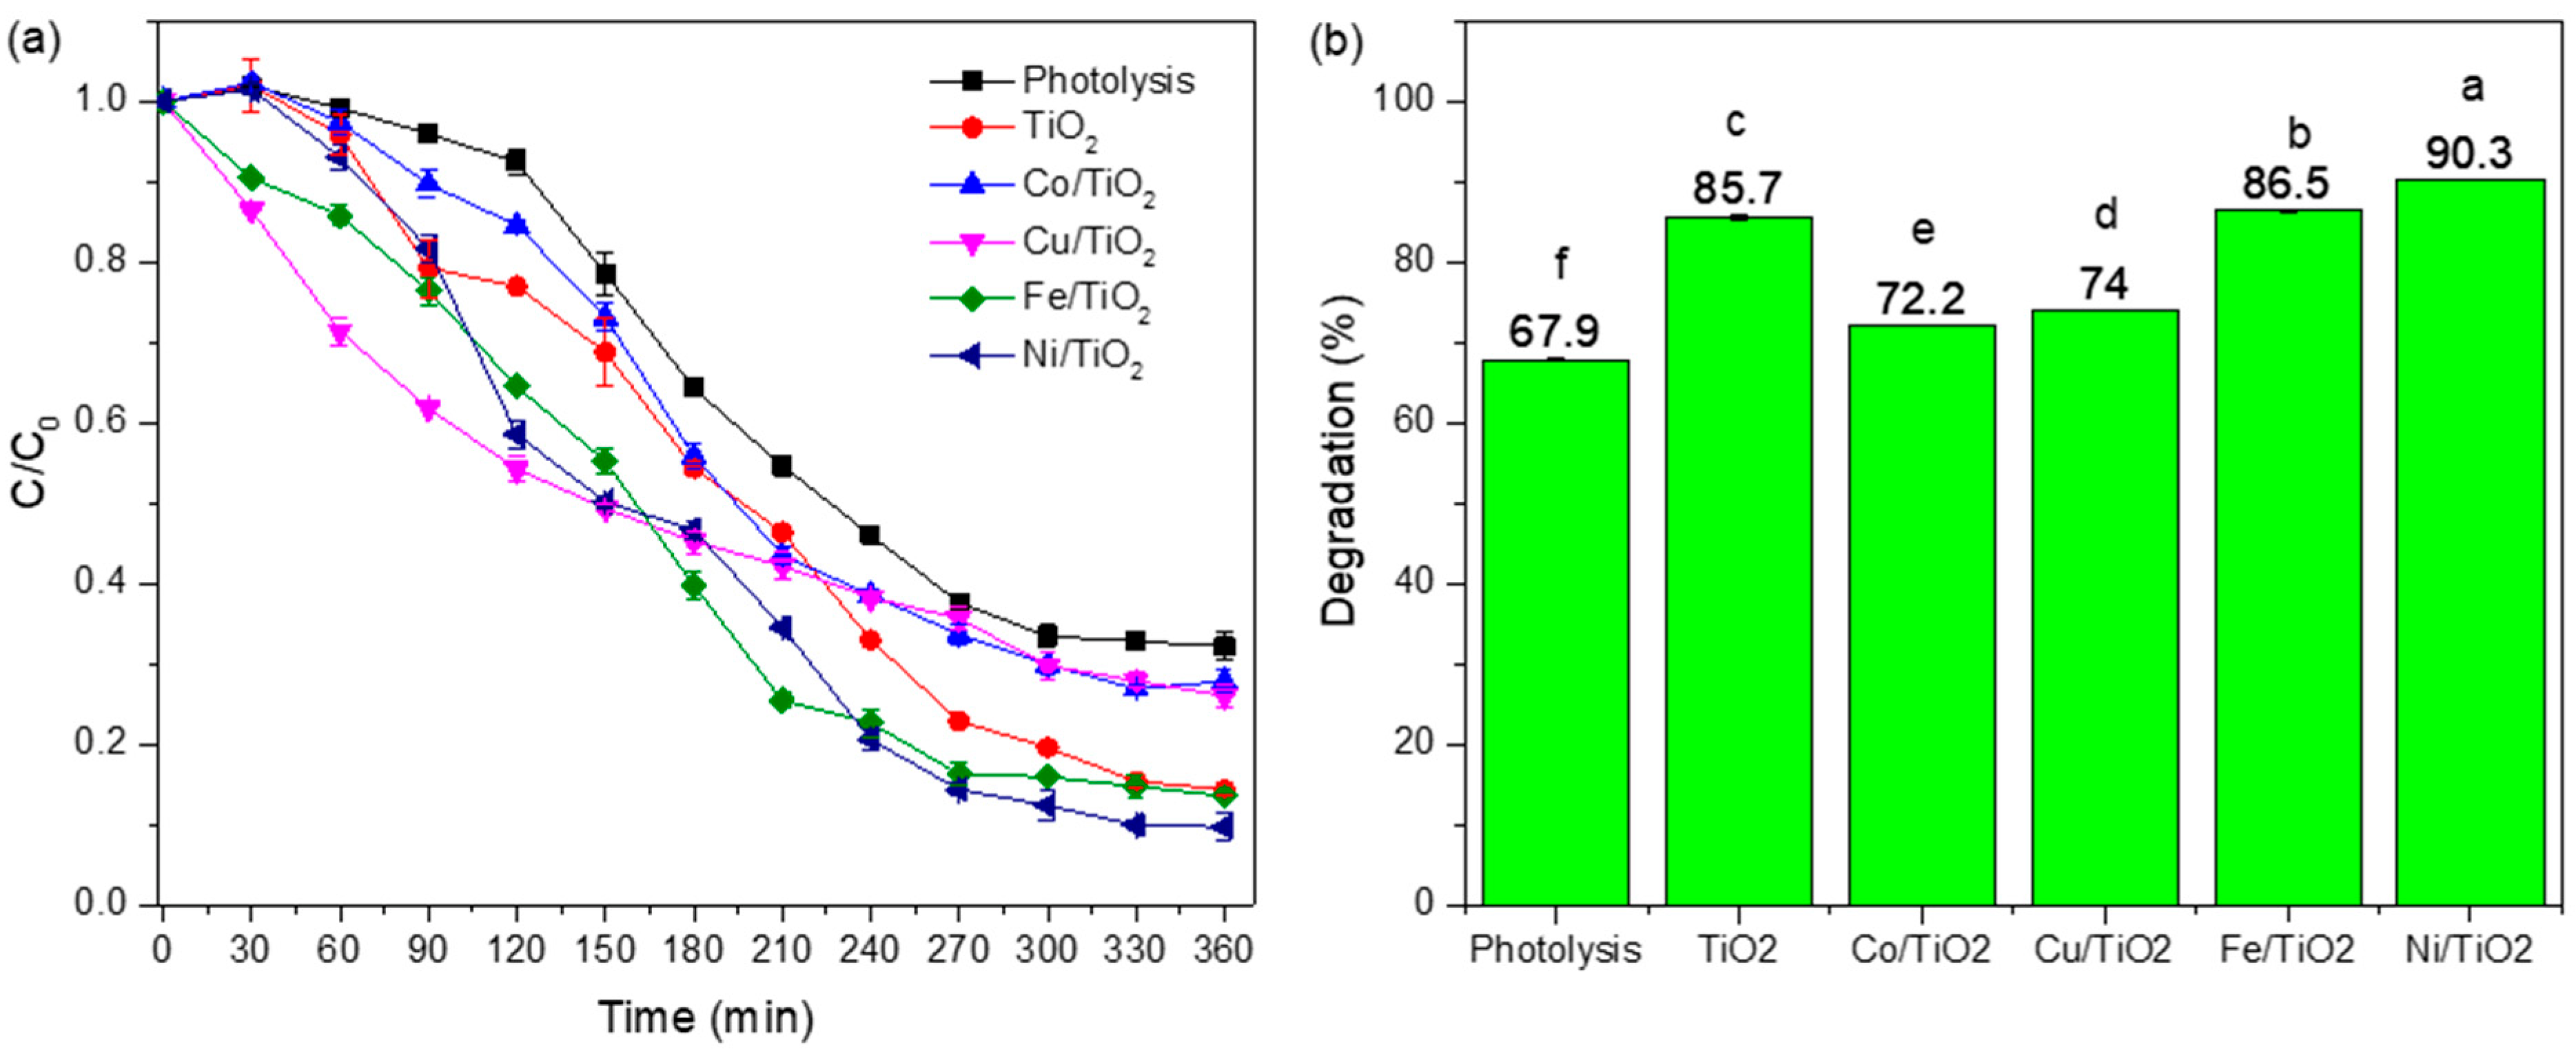
3.8. Degradation of Organic Compounds

The photocatalytic activities of TiO2 and modified-TiO2 materials were carried out using 2,4-D and 2,4-DCP organic compounds. These solutions were exposed to UV-light irradiation in the absence and presence of 100 mg L−1 of TiO2 and deposited-TiO2 as photocatalysts. Figure 12 and Figure 13 show the evolution of 2,4-D and 2,4-DCP as a function of time (p < 0.05). In 2,4-D, the highest degradation was achieved using Ni/TiO2 (85.6% in 360 min) followed by TiO2 (50.6% in 360 min), Co/TiO2 (21.8% in 360 min), Fe/TiO2 (21.1% in 360 min), Co/TiO2 (16.6% in 360 min), and photolysis (7.8% in 360 min). Siah et al. used TiO2 with Lanthanum at 0.1, 0.5, 1 and 5 mol% in a solution of 50 mL of 2,4-D with 50 mg of catalyst under UV-light (15 mW cm−2). They found that the composite La/TiO2 0.1 mol% obtained a removal percentage reaching 59.8% after 360 min of light irradiation [81]. In another work, a solution with 90 mg L−1 of 2,4-D at pH 3 found a conversion of 63% after 300 min of photocatalytic activity under UV-light (1.8 mW cm−2) used 600 mg L−1 of N-TiO2 and urea (1:0.5 weight ratio) [82].
Similar results were found in the 2,4-DCP where the best photocatalytic activity was achieved using Ni/TiO2 (90.3% in 360 min) followed by Fe/TiO2 (86.5% in 360 min), TiO2 (85.7% in 360 min), Cu/TiO2 (74.0% in 360 min), Co/TiO2 (72.2% in 360 min), and photolysis (67.9% in 360 min). In the literature, a 61.6% degradation of 2,4-DCP (40 mg L−1) is reported when using mixed matrix photocatalytic membranes (MMM) with Co/TiO2 at 1% (containing 1.34 mol%-Co). The solution was fed to the membrane module with a flow rate of 1.5 L min−1 at a pressure of 12 bar. After 30 min, the permeate was measured and analyzed. The UV-light source was a 400 W metal halide lamp and photon flux of 510 nm [83]. Moreover, in a solution of 2,4-DCP (250 mg L−1), using S-TiO2 dose of 800 mg L−1 under visible light irradiation at 400 W (510 nm) after 240 min, a degradation efficiency of 91% was determined [1]. The XPS deconvolution analysis revealed the presence of Ti3+ species, which is directly associated with the presence of oxygen vacancies. The ions’ metallic defects in the samples of deposited-TiO2 promote an enhanced absorption of UV-light by promoting charge separation and electron transfer during photocatalytic activity [47]. Shen et al. suggest that the increase in the photocatalytic activity is directly related to the ability of the catalyst to generate free radicals, which are responsible for giving way to the oxidation and reduction processes [84,85].

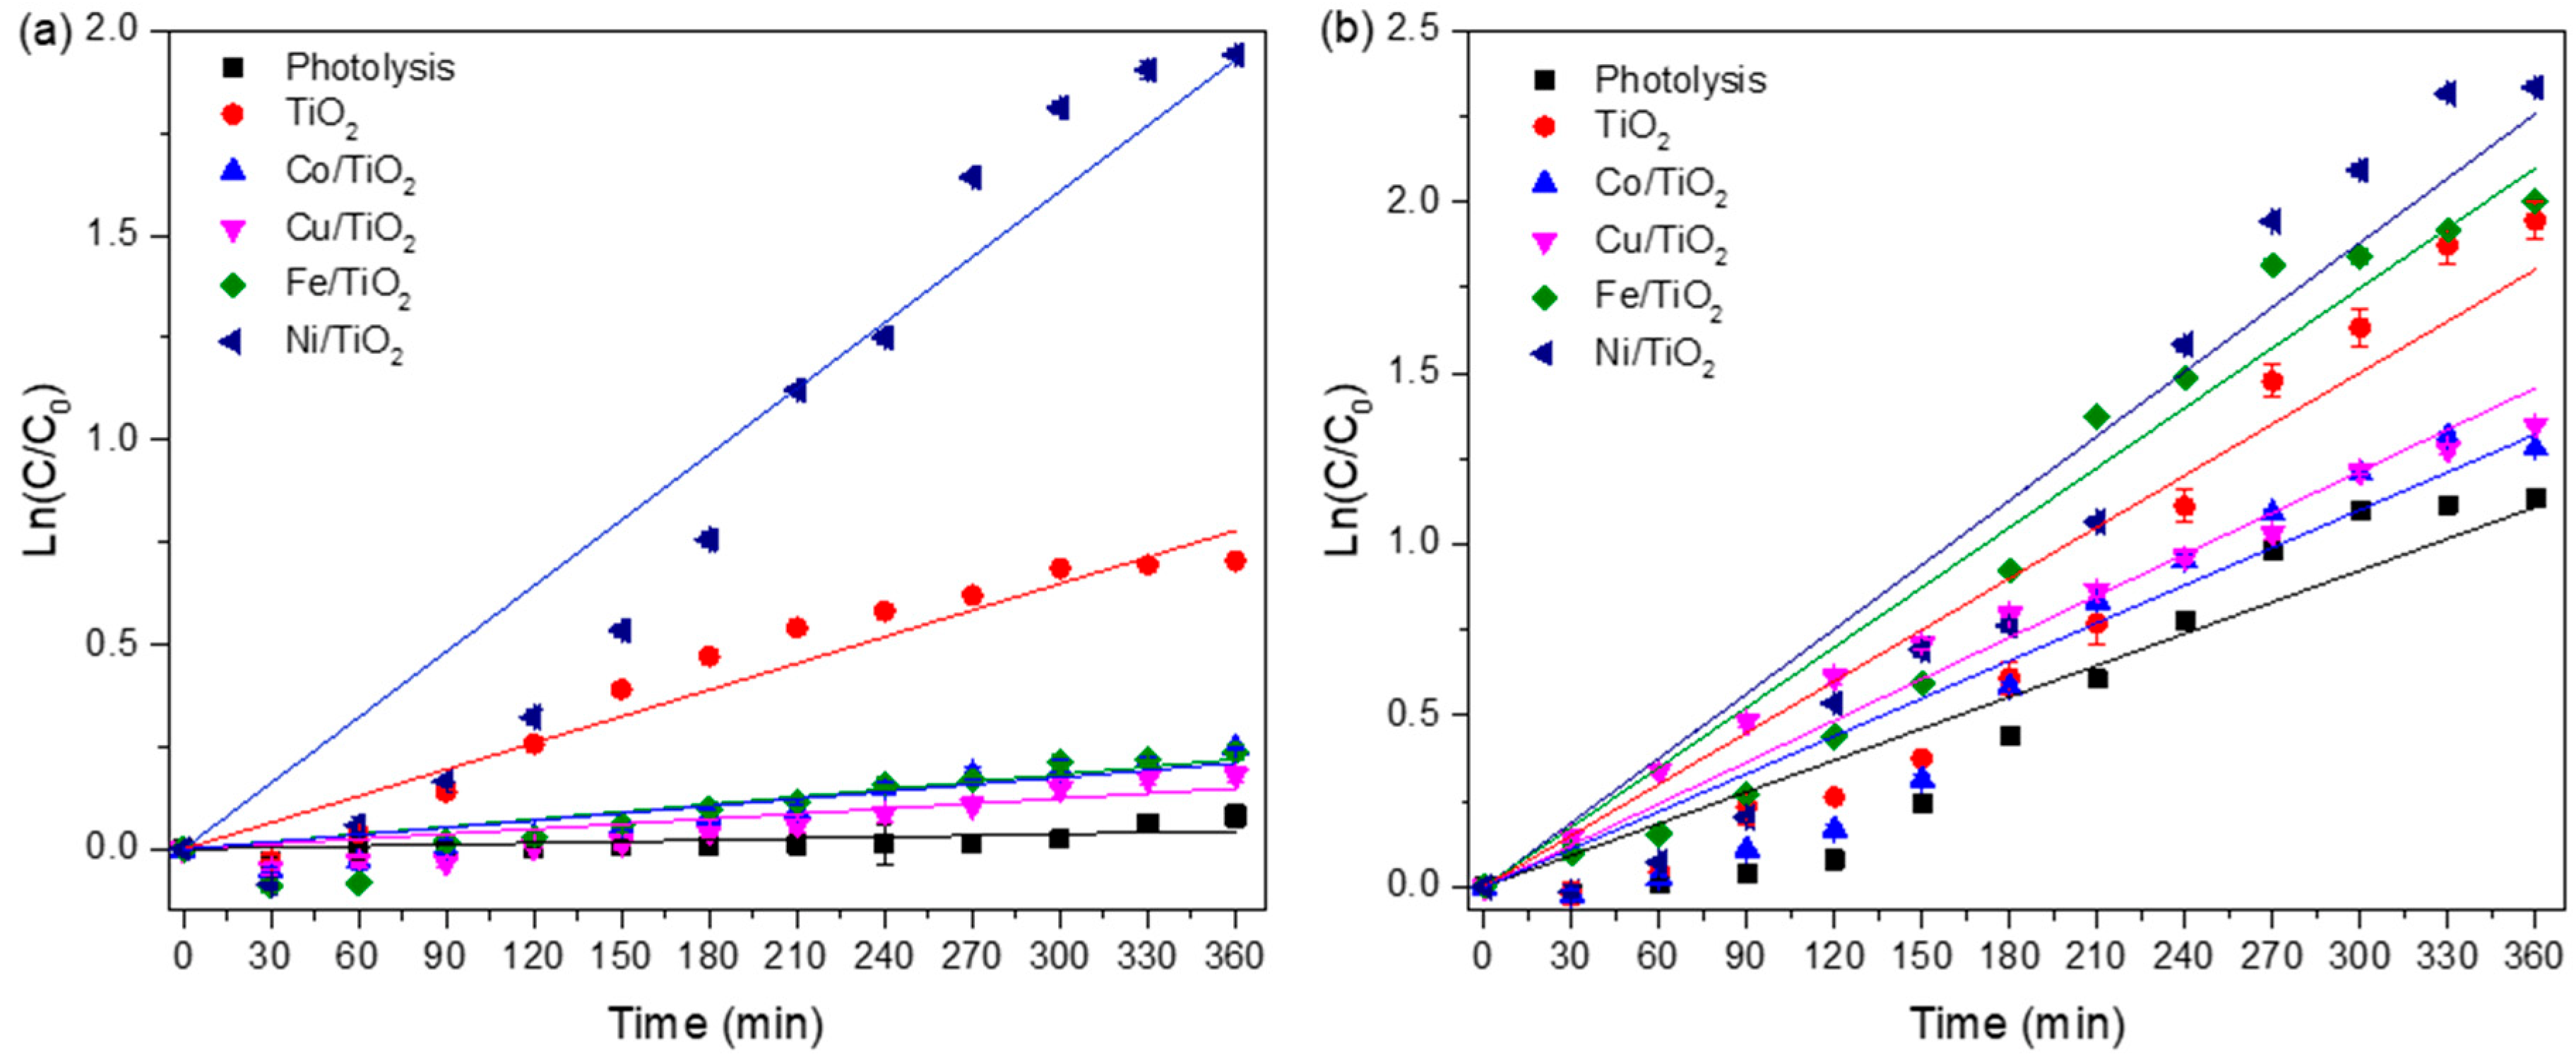
3.9. Kinetics of Photocatalytic Degradation

The Langmuir–Hinshelwood model was used to calculate the kinetics of photocatalytic degradation of 2,4-D and 2,4-DCP compounds in solution. The relationship between the rate of degradation (r) and the concentration of organic pollutants (c) was obtained by applying the following equation:
r = d c d t = k K c 1 + K c  
where k is the rate constant, and K is the adsorption equilibrium constant on the catalyst surface, and t is the irradiation time (min). If the concentration is less than 1, this equation can be simplified to the following pseudo-first-order kinetics:
l n C 0 C = k K t = k a p p t  
The apparent first-order rate constant kapp (min L−1) for the compounds degradation can be expressed by plotting ln(C0/C) versus time (t). The relation between initial concentrations of pollutants on the kapp values obtained on the degradation of different concentrations of organic compounds within 360 min is shown in Figure 14.
The pseudo-first order reaction rate constant and the half-life or half-time of the reaction, which is the time required to drop the reactant concentration, are presented in the Table 3. The constant rate and half-life of reaction showed better results with the Ni/TiO2 sample than for the pure TiO2 in both cases. This result was favored because of the synergy produced between the organic molecules and the metallic ions over TiO2 surface.
The regression coefficient values (R2) of the experiments have been included in Table 4. In addition, different kinds of reaction kinetics models were compared (zero order, first order and the Langmuir–Hishelwood model) to demonstrate the kinetic degradation. The best model in both cases followed the L-H model that simulates a pseudo-first order kinetics as shown in Table 4.

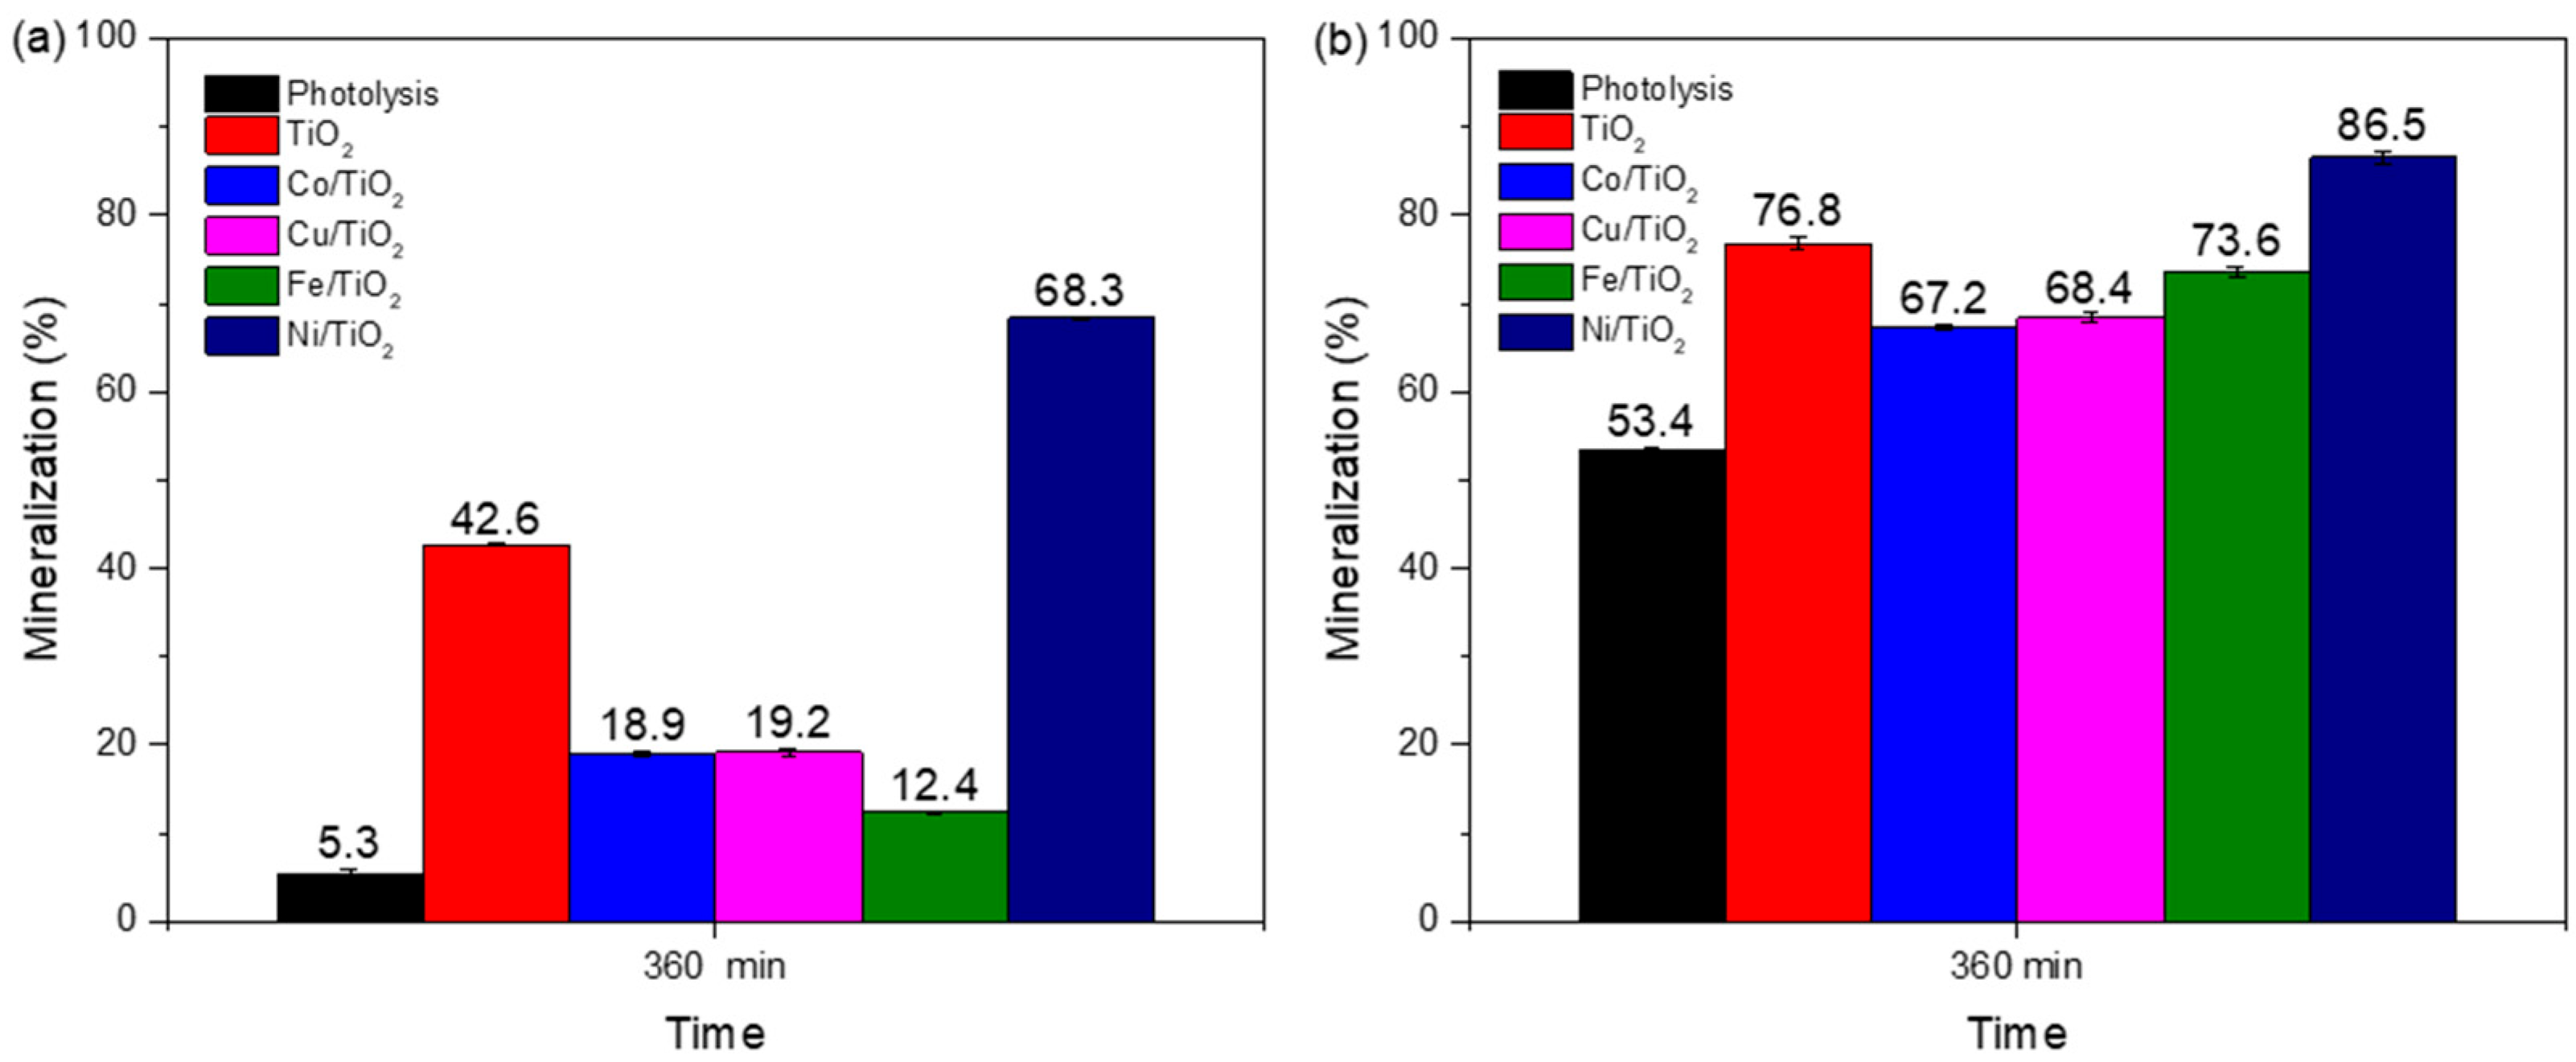
3.10. Mineralization of Organic Compounds

Figure 15 shows the results of the mineralization of the organic pollutant by analysis of total organic carbon (TOC). An important relationship is observed between the irradiation time of UV-light and the photocatalyst in the mineralization processes. Table 5 shows the percentage of mineralization of TiO2 and deposited-TiO2 on the organic compound. The Ni/TiO2 presented the best efficiency of mineralization by the 2,4-D (68.3%) and 2,4-DCP (86.5%).
Table 5 shows the results of the mineralization of the organic pollutant, and the best mineralization is present by Ni/TiO2 in both cases (68.3% to 2,4-D and 86.5% to2,4-DCP). This comportment is due to the reduction of band gap of TiO2, the presence of the O2 vacancies due to the introduction of the ions metallic over the surface of the support, and the effective separation of e/h+ species in the photocatalyst [13].

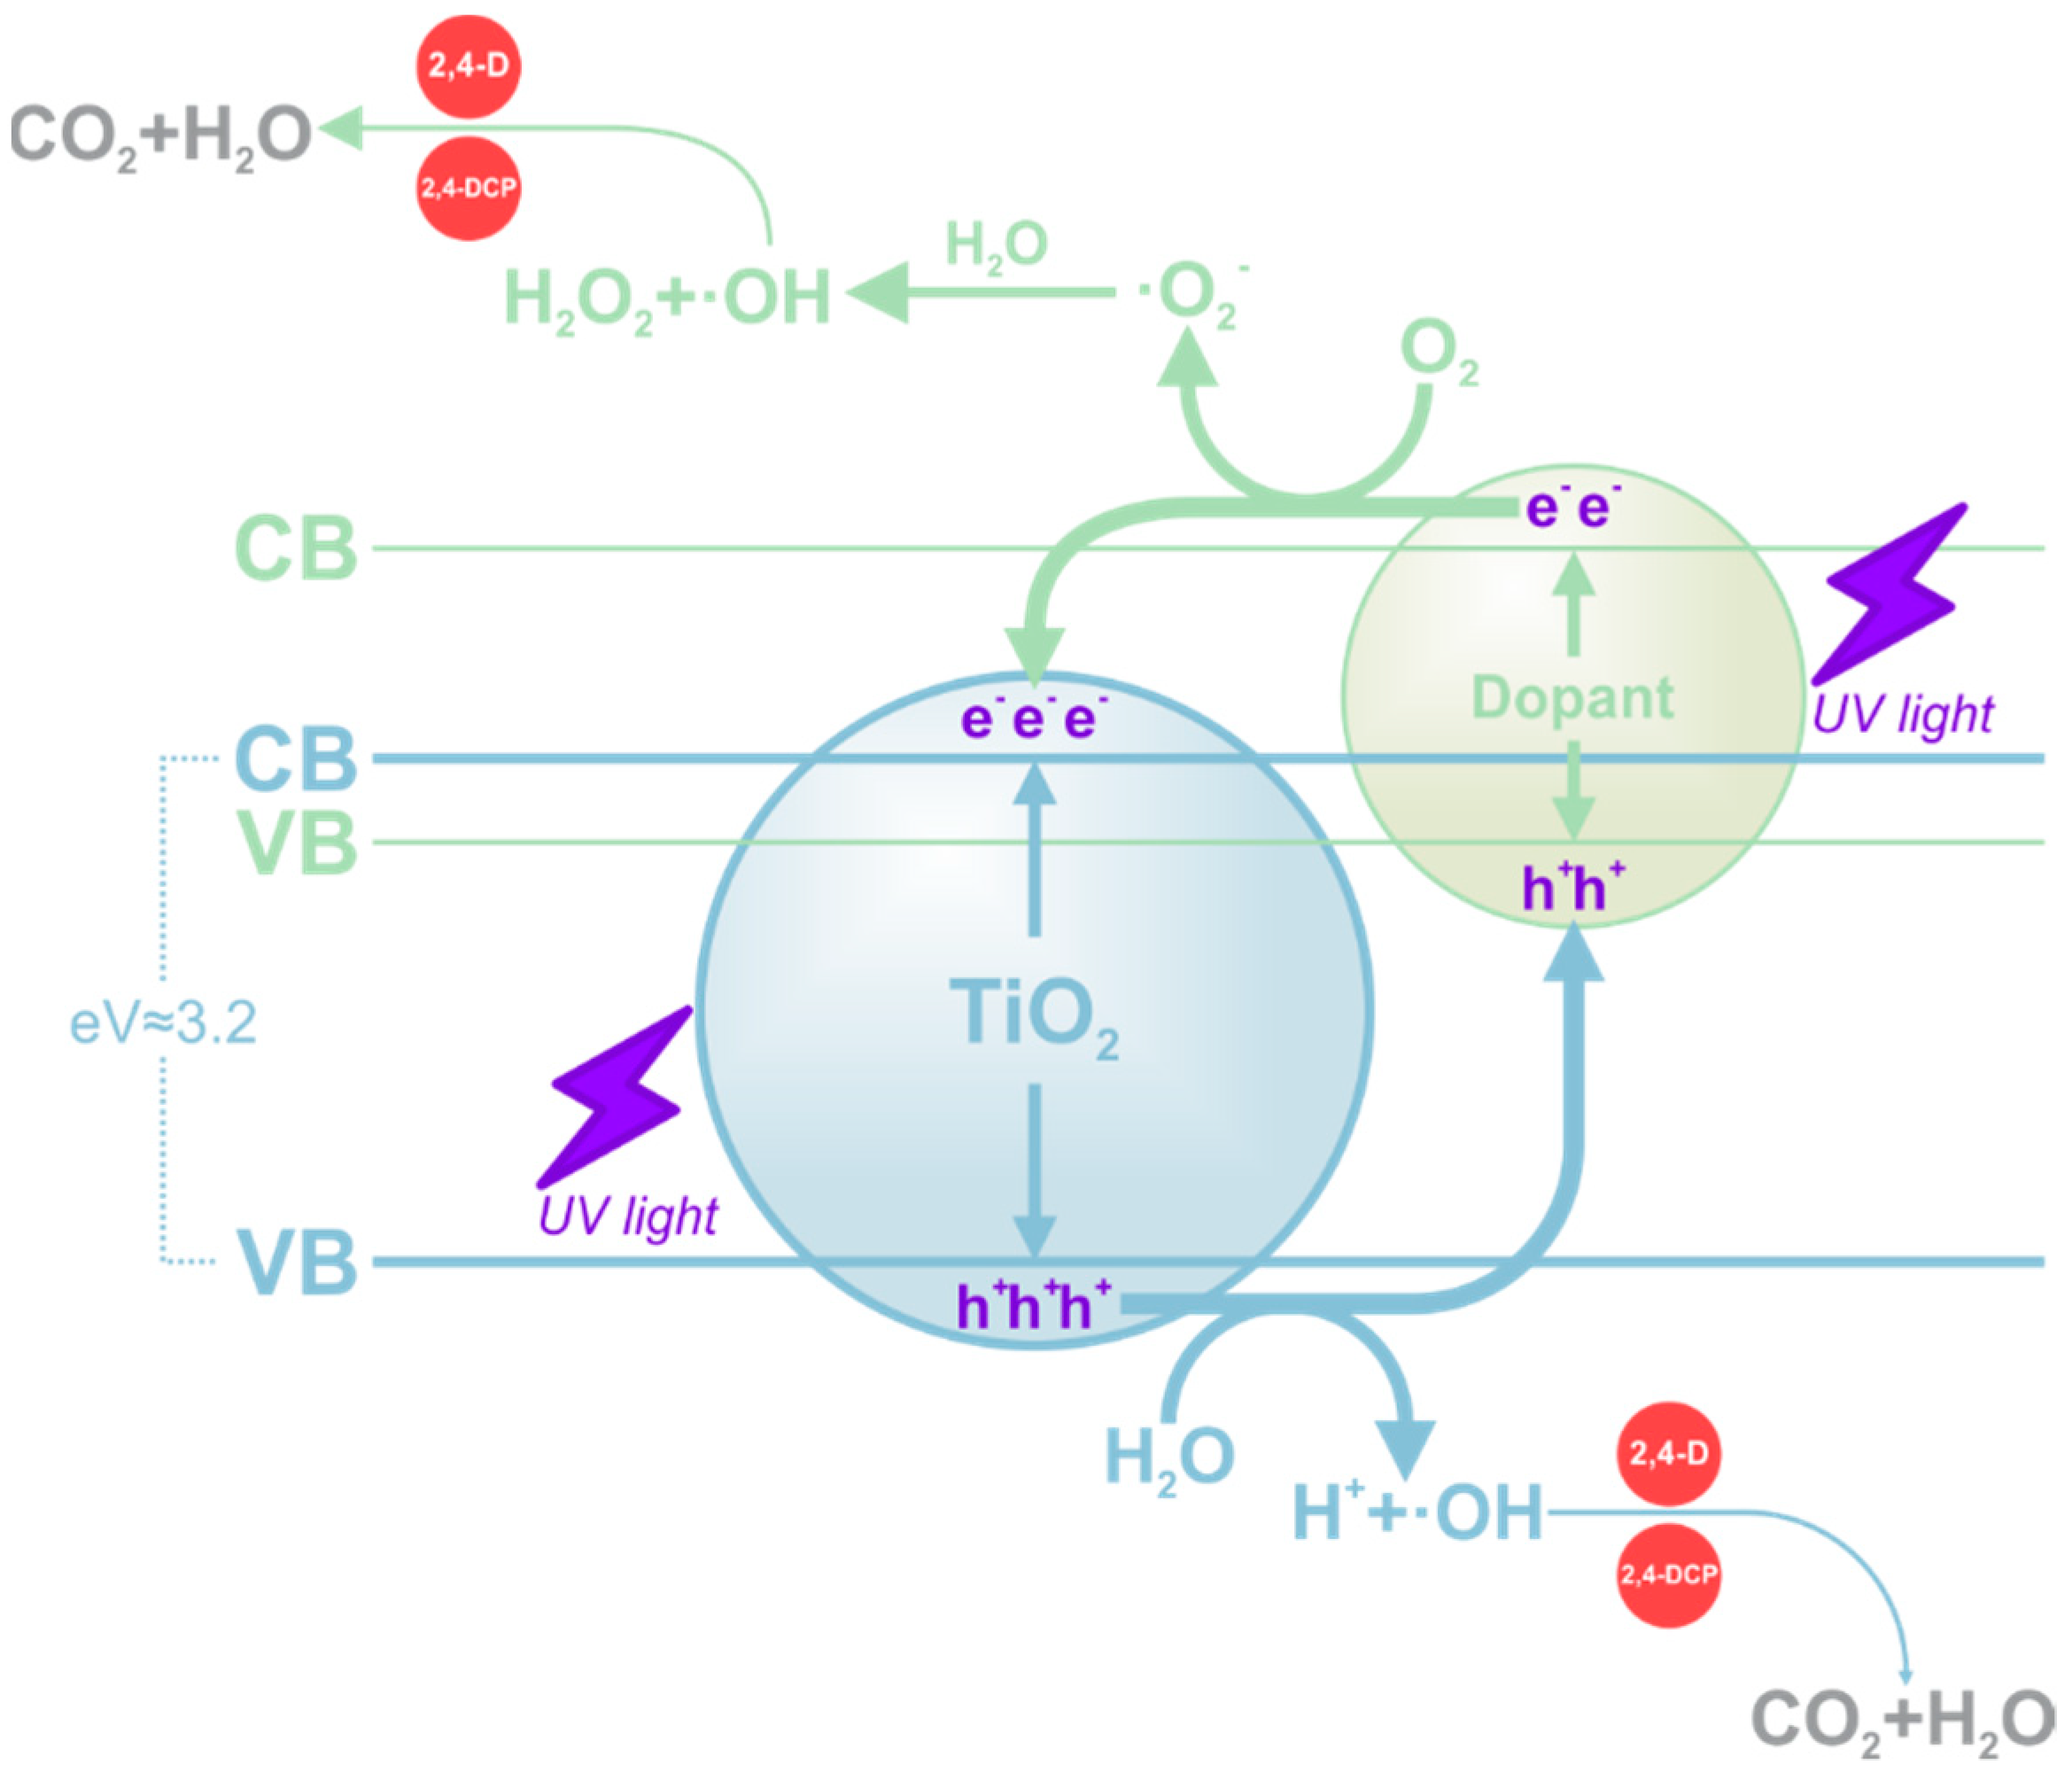
3.11. Mechanisms for the Photocatalytic Degradation

Figure 16 shows the photocatalytic mechanisms diagram proposed for the deposited-TiO2 nanomaterials [86]. The photocatalytic process begins when the photocatalysts are excited by UV-light (absorption of a photon) to promote the formation of oxidizing agents (electron-hole pairs) over the surface of the nanoparticle support. The photogenerated electrons in the TiO2 conduction band (CB) react with oxygen dissolving in water molecules forming superoxide anions ( · O 2 ). Furthermore, the · O 2 interact with water molecules generated by hydroxyl radicals (·OH). Additionally, the holes (h+) of the valence band (VB) of TiO2 migrate to the VB of the dopant Metals (M); then, its h+ can react with water molecules on the surface to produce a chain of reaction with ·OH [87,88]. The radicals interact directly with the contaminant (2,4-D or 2,4-DCP) from this process, degrading its structure until simple molecules such as CO2 and H2O are obtained [76]. Suggested reactions are listed below (Equations (6)–(11)):
TiO 2 + hv TiO 2   ( e CB + h VB + )
TiO 2   e CB + O 2 Aq · O 2
· O 2 + H 2 O H 2 O 2 + · OH
M h VB + + H 2 O H + + · OH
· OH + 2 , 4 -D CO 2 + H 2 O
· OH + 2 , 4 -DCP CO 2 + H 2 O
The main objective of the photocatalytic activity is the mineralization of the organic compounds. According to the results and the information reported in the literature, the following degradation pathway was proposed when the samples were analyzed by HPLC MS. The hydroxyl-based decomposition of 2,4-D, 2,4-DCP used ion metallic deposited over TiO2 under UV-light start when the hydroxyl radical attacks the chloride at the ortho and para position formed 2-choloro-4-hydroxyphenol. Subsequently, it begins to decline to form 2-chloro-5-hydroxy-1,4-benzoquinone. In the next stage, hydroxyl radicals interact with the pollutants until being converted to tetrahydroxybenzene. On the other hand, the rupture of the benzene ring (the products are maleic, fumaric, oxalic, formic and acetic acids) favors the formation of different compounds of aliphatic carboxylic acid, which when decomposed gave CO2 and H2O [89,90,91,92].

4. Conclusions

TiO2 nanomaterials were modified from metal ions (Co+, Cu+, Fe+, and Ni+ to 5 at. wt.%) by the deposition–precipitation method. The nanoparticles present a semi-spherical, homogeneous, dispersed shape, according to SEM and TEM analyses. The deposition of metallic ions on TiO2 shifted the light absorption towards the visible region. The interaction of the ions on the support does not present significant changes in its structure, conserving the anatase and rutile crystalline phase according to the SAED and XRD results. The FT-IR and XPS results show each element’s characteristic bonds in the modified TiO2 samples. In this sense, the specific surface area of the samples of modified TiO2 presents a slight increase compared to pure TiO2. The defects caused by the metallic ions have favored improving the structural, morphological, optical, and surface properties of the modified TiO2, promoting the improvement of the photocatalytic activity. Among several modified TiO2 materials, Ni/TiO2 shows the highest photocatalytic activity for the degradation of 2,4-D (85.6%) and 2,4-DCP (90.3%), as well as the highest mineralization 2,4-D (68.3%) and 2,4-DCP (86.5%). Ni/TiO2 follows the pseudo-first order Langmuir–Hinshelwood rate constant relationship in photocatalytic degradation reactions.

Author Contributions

Writing—original draft preparation, I.L.-R. and A.M.-B.; Writing—review and editing, C.A.G.-G., L.M.A.-E., O.A.G.-V. and S.G.; Supervision, A.P.-L.; Project administration, A.P.-L. All authors have read and agreed to the published version of the manuscript.

Funding

This research received no external funding.

Institutional Review Board Statement

Not applicable.

Informed Consent Statement

Not applicable.

Data Availability Statement

Not applicable.

Acknowledgments

I.L.-R. thanks CONACYT for the scholarship (936484), and I appreciate the support in the characterization of photocatalysts from Martín Flores and Milton Vázquez as well as the technicians of the equipment Sergio Oliva and José Rivera for the characterization of analysis XPS, XRD, and SEM-DES (project 270660, Support for the Strengthening and Development of the Scientific and Technological Infrastructure).

Conflicts of Interest

The authors declare no conflict of interest.

References

  1. Alalm, M.G.; Samy, M.; Ookawara, S.; Ohno, T. Immobilization of S-TiO2 on reusable aluminum plates by polysiloxane for photocatalytic degradation of 2,4-dichlorophenol in water. J. Water Process Eng. 2018, 26, 329–335. [Google Scholar] [CrossRef]
  2. González, G.C.; Julcour, C.; Chaumat, H.; Jáuregui-Haza, U.; Delmas, H. Degradation of 2,4-dichlorophenoxyacetic acid by photolysis and photo-Fenton oxidation. J. Environ. Chem. Eng. 2018, 6, 874–882. [Google Scholar] [CrossRef]
  3. Barik, A.J.; Gogate, P.R. Degradation of 2,4-dichlorophenol using combined approach based on ultrasound, ozone and catalyst. Ultrason. Sonochem. 2017, 36, 517–526. [Google Scholar] [CrossRef] [PubMed]
  4. Martínez-Ruiz, E.B.; Martínez-Jerónimo, F. Exposure to the herbicide 2,4-D produces different toxic effects in two different phytoplankters: A green microalga (Ankistrodesmus falcatus) and a toxigenic cyanobacterium (Microcystis aeruginosa). Sci. Total Environ. 2018, 619–620, 1566–1578. [Google Scholar] [CrossRef] [PubMed]
  5. Al-Mamun, M.R.; Kader, S.; Islam, M.S.; Khan, M.Z.H. Photocatalytic activity improvement and application of UV-TiO2 photocatalysis in textile wastewater treatment: A review. J. Environ. Chem. Eng. 2019, 7, 103248. [Google Scholar] [CrossRef]
  6. Mountassif, D.; Kabine, M.; Mounchid, K.; Mounaji, K.; Latruffe, N.; El Kebbaj, M.S. Biochemical and histological alterations of cellular metabolism from jerboa (Jaculus orientalis) by 2,4-dichlorophenoxyacetic acid: Effects on d-3-hydroxybutyrate dehydrogenase. Pestic. Biochem. Physiol. 2008, 90, 87–96. [Google Scholar] [CrossRef]
  7. Bejarano González, F. Los Plagicidas Altamente Peligrosos en México, 1st ed.; RAPAM: Texcoco, Mexico, 2017; Available online: https://www.greenpeace.org/static/planet4-mexico-stateless/2018/11/8075ba39-8075ba39-libro-plaguicidas-final-14-agst-2017sin-portada.pdf (accessed on 20 August 2022).
  8. Centro de Estudios para el Desarrollo Rural Sustentable y la Soberanía Alimentaria (CEDRSSA). Uso y Regulación de Herbicidas en México, 1st ed.; CEDRSSA: Mexico City, Mexico, 2020; pp. 1–43. [Google Scholar]
  9. Silva, M.R.; Hernández, A.A.; Velasco, A.F.; Moya, C.Á. Genetic damage in Goodea atripinnis (Goodeidae) and persistent organic-compounds in both Chapala and Sayula Lakes, in Mexico TT—Daño genético en Goodea atripinnis (Goodeidae) y compuestos orgánicos persistentes en los Lagos de Chapala y Sayula, en Méxi. Hidrobiológica 2014, 24, 215–221. Available online: http://www.scielo.org.mx/scielo.php?script=sci_arttext&pid=S0188-88972014000300005&lang=pt%5Cnhttp://www.scielo.org.mx/pdf/hbio/v24n3/v24n3a5.pdf (accessed on 20 August 2022).
  10. Titus, D.; Samuel, E.J.J. Photocatalytic Degradation of Azo Dye Using Biogenic SnO2 Nanoparticles with Antifungal Property: RSM Optimization and Kinetic Study. J. Clust. Sci. 2019, 30, 1335–1345. [Google Scholar] [CrossRef]
  11. Crini, G.; Lichtfouse, E. Advantages and disadvantages of techniques used for wastewater treatment. Environ. Chem. Lett. 2018, 17, 145–155. [Google Scholar] [CrossRef]
  12. Suarez-Escobar, A.F.; Conde-Rivera, L.R.; Lopez-Suarez, F.E.; Illán-Gómez, M.J.; Gonzalez-Hernandez, K.S.; Chalapud-Morales, J.S. Heterogeneous Photocatalytic Degradation of Ibuprofen Over TiO2–Ag Supported on Activated Carbon from Waste Tire Rubber. Top. Catal. 2021, 64, 51–64. [Google Scholar] [CrossRef]
  13. Basavarajappa, P.S.; Patil, S.B.; Ganganagappa, N.; Reddy, K.R.; Raghu, A.V.; Reddy, C.V. Recent progress in metal-doped TiO2, non-metal doped/codoped TiO2 and TiO2 nanostructured hybrids for enhanced photocatalysis. Int. J. Hydrogen Energy 2020, 45, 7764–7778. [Google Scholar] [CrossRef]
  14. Isari, A.A.; Hayati, F.; Kakavandi, B.; Rostami, M.; Motevassel, M.; Dehghanifard, E. N, Cu co-doped TiO2@functionalized SWCNT photocatalyst coupled with ultrasound and visible-light: An effective sono-photocatalysis process for pharmaceutical wastewaters treatment. Chem. Eng. J. 2020, 392, 123685. [Google Scholar] [CrossRef]
  15. Nguyen, C.H.; Fu, C.-C.; Juang, R.-S. Degradation of methylene blue and methyl orange by palladium-doped TiO2 photocatalysis for water reuse: Efficiency and degradation pathways. J. Clean. Prod. 2018, 202, 413–427. [Google Scholar] [CrossRef]
  16. Wang, Y.; Rao, L.; Wang, P.; Shi, Z.; Zhang, L. Photocatalytic activity of N-TiO2/O-doped N vacancy g-C3N4 and the intermediates toxicity evaluation under tetracycline hydrochloride and Cr(VI) coexistence environment. Appl. Catal. B Environ. 2020, 262, 118308. [Google Scholar] [CrossRef]
  17. Zanella, R.; Giorgio, S.; Henry, C.R.; Louis, C. Alternative methods for the preparation of gold nanoparticles supported on TiO2. J. Phys. Chem. B 2002, 106, 7634–7642. [Google Scholar] [CrossRef]
  18. Andhare, D.D.; Patade, S.R.; Kounsalye, J.S.; Jadhav, K.M. Effect of Zn doping on structural, magnetic and optical properties of cobalt ferrite nanoparticles synthesized via. Co-precipitation method. Phys. B Condens. Matter. 2020, 583, 412051. [Google Scholar] [CrossRef]
  19. Al Balushi, B.S.M.; Al Marzouqi, F.; Al Wahaibi, B.; Kuvarega, A.T.; Al Kindy, S.M.Z.; Kim, Y.; Selvaraj, R. Hydrothermal synthesis of CdS sub-microspheres for photocatalytic degradation of pharmaceuticals. Appl. Surf. Sci. 2018, 457, 559–565. [Google Scholar] [CrossRef]
  20. Anaya-Esparza, L.M.; Montalvo-González, E.; González-Silva, N.; Méndez-Robles, M.D.; Romero-Toledo, R.; Yahia, E.M.; Pérez-Larios, A. Synthesis and characterization of TiO2-ZnO-MgO mixed oxide and their antibacterial activity. Materials 2019, 12, 698. [Google Scholar] [CrossRef]
  21. Gogoi, D.; Namdeo, A.; Kumar, A. Ag-doped TiO2 photocatalysts with effective charge transfer for highly efficient hydrogen production through water splitting. Int. J. Hydrogen Energy 2019, 45, 2729–2744. [Google Scholar] [CrossRef]
  22. Portillo-Vélez, N.; Zanella, R. Comparative study of transition metal (Mn, Fe or Co ) catalysts supported on titania : Effect of Au nanoparticles addition towards CO oxidation and soot combustion reactions. Chem. Eng. J. 2020, 385, 123848. [Google Scholar] [CrossRef]
  23. Alotaibi, A.M.; Williamson, B.A.D.; Sathasivam, S.; Kafizas, A.; Alqahtani, M.; Sotelo-Vazquez, C.; Buckeridge, J.; Wu, J.; Nair, S.P.; Scanlon, D.O.; et al. Enhanced Photocatalytic and Antibacterial Ability of Cu-Doped Anatase TiO2 Thin Films: Theory and Experiment. ACS Appl. Mater. Interfaces 2020, 12, 15348–15361. [Google Scholar] [CrossRef] [PubMed] [Green Version]
  24. Norabadi, E.; Ashrafi, S.D.; Kamani, H.; Jahantiq, A. Degradation of 2, 6-dichlorophenol by Fe-doped TiO2 Sonophotocatalytic process : Kinetic study, intermediate product, degradation pathway. Int. J. Environ. Anal. Chem. 2020, 1, 1–16. [Google Scholar] [CrossRef]
  25. Anju, K.R.; Radhik, T.; Ramalingam, R.J.; Al-lohedan, H.A. Hydrothermal synthesis of nanosized (Fe, Co, Ni)-TiO2 for enhanced visible light photosensitive applications. Opt.—Int. J. Light Electron Opt. 2018, 165, 408–415. [Google Scholar] [CrossRef]
  26. Pérez-Larios, A.; Hernández-Gordillo, A.; Morales-Mendoza, G.; Lartundo-Rojas, L.; Mantilla, Á.; Gómez, R. Enhancing the H2 evolution from water-methanol solution using Mn2+-Mn+3-Mn4+ redox species of Mn-doped TiO2 sol-gel photocatalysts. Catal. Today 2016, 266, 9–16. [Google Scholar] [CrossRef]
  27. Makuła, P.; Pacia, M.; Macyk, W. How To Correctly Determine the Band Gap Energy of Modified Semiconductor Photocatalysts Based on UV–Vis Spectra. J. Phys. Chem. Lett. 2018, 9, 6814–6817. [Google Scholar] [CrossRef] [PubMed]
  28. Chi, M.; Sun, X.; Sujan, A.; Davis, Z.; Tatarchuk, B.J. A quantitative XPS examination of UV induced surface modification of TiO2 sorbents for the increased saturation capacity of sulfur heterocycles. Fuel 2019, 238, 454–461. [Google Scholar] [CrossRef]
  29. Lassoued, M.S.; Lassoued, A.; Ammar, S.; Gadri, A.; Salah, A.B.; García-Granda, S. Synthesis and characterization of Co-doped nano-TiO2 through co-precipitation method for photocatalytic activity. J. Mater. Sci. Mater. Electron. 2018, 29, 8914–8922. [Google Scholar] [CrossRef]
  30. Qureshi, A.A.; Javed, S.; Javed, H.M.A.; Akram, A.; Jamshaid, M.; Shaheen, A. Strategic design of Cu/TiO2-based photoanode and rGO-Fe3O4-based counter electrode for optimized plasmonic dye-sensitized solar cells. Opt. Mater. 2020, 109, 110267. [Google Scholar] [CrossRef]
  31. Rodríguez, P.A.O.; Pecchi, G.A.; Casuscelli, S.G.; Elías, V.R.; Eimer, G.A. A simple synthesis way to obtain iron-doped TiO2 nanoparticles as photocatalytic surfaces. Chem. Phys. Lett. 2019, 732, 136643. [Google Scholar] [CrossRef]
  32. Kunnamareddy, M.; Rajendran, R.; Sivagnanam, M.; Rajendran, R.; Diravidamani, B. Nickel and sulfur codoped TiO2 nanoparticles for efficient visible light photocatalytic activity. J. Inorg. Organomet. Polym. Mater. 2021, 31, 2615–2626. [Google Scholar] [CrossRef]
  33. Zhu, X.; Zhou, Q.; Xia, Y.; Wang, J.; Chen, H.; Xu, Q.; Liu, J.; Feng, W.; Chen, S. Preparation and characterization of Cu-doped TiO2 nanomaterials with anatase/rutile/brookite triphasic structure and their photocatalytic activity. J. Mater. Sci. Mater. Electron. 2021, 32, 21511–21524. [Google Scholar] [CrossRef]
  34. Faustino, E.; da Silva, T.F.; Cunha, R.F.; Guelfi, D.R.V.; Cavalheri, P.S.; de Oliveira, S.C.; Caires, A.R.L.; Casagrande, G.A.; Cavalcante, R.P.; Junior, A.M. Synthesis and characterization of N and Fe-doped TiO2 nanoparticles for 2,4-Dimethylaniline mineralization. Nanomaterials 2022, 12, 2538. [Google Scholar] [CrossRef] [PubMed]
  35. Maurya, A.; Bhatia, N. Microwave Assisted Sol Gel Synthesis of Magnesium Oxide (MgO). Int. J. Eng. Res. Dev. 2017, 13, 1–6. [Google Scholar]
  36. Castañeda, C.; Tzompantzi, F.; Rodríguez-Rodríguez, A.; Sánchez-Dominguez, M.; Gómez, R. Improved photocatalytic hydrogen production from methanol/water solution using CuO supported on fluorinated TiO2. J. Chem. Technol. Biotechnol. 2018, 93, 1113–1120. [Google Scholar] [CrossRef]
  37. López, R.; Gómez, R. Photocatalytic Degradation of 4-Nitrophenol on Well Characterized Sol–Gel Molybdenum Doped Titania Semiconductors. Top. Catal. 2011, 54, 504–511. [Google Scholar] [CrossRef]
  38. Yang, Y.; Yin, L.-C.; Gong, Y.; Niu, P.; Wang, J.-Q.; Gu, L.; Chen, X.; Liu, G.; Wang, L.; Cheng, H.-M. An Unusual Strong Visible-Light Absorption Band in Red Anatase TiO2 Photocatalyst Induced by Atomic Hydrogen-Occupied Oxygen Vacancies. Adv. Mater. 2018, 30, 1704479. [Google Scholar] [CrossRef]
  39. Vega, M.P.B.; Hinojosa-Reyes, M.; Hernández-Ramírez, A.; Mar, J.L.G.; Rodríguez-González, V.; Hinojosa-Reyes, L. Visible light photocatalytic activity of sol–gel Ni-doped TiO2 on p-arsanilic acid degradation. J. Sol-Gel Sci. Technol. 2018, 85, 723–731. [Google Scholar] [CrossRef]
  40. Saoud, K.; Alsoubaihi, R.; Bensalah, N.; Bora, T.; Bertino, M.; Dutta, J. Synthesis of supported silver nano-spheres on zinc oxide nanorods for visible light photocatalytic applications. Mater. Res. Bull. 2015, 63, 134–140. [Google Scholar] [CrossRef]
  41. Vu, V.N.; Pham, T.H.T.; Chanthavong, M.; Do, T.H.; Nguyen, T.H.L.; Nguyen, Q.D.; Tran, T.K.N. Enhanced Photocatalytic Degradation of Rhodamine-B under Led Light Using CuZnAl Hydrotalcite Synthesized by Co-Precipitation Technique. Inorganics 2022, 10, 89. [Google Scholar] [CrossRef]
  42. Dalto, F.; Kuźniarska-Biernacka, I.; Pereira, C.; Mesquita, E.; Soares, O.S.G.P.; Pereira, M.F.R.; Rosa, M.J.; Mestre, A.S.; Carvalho, A.P.; Freire, C. Solar light-induced methylene blue removal over TiO2/AC composites and photocatalytic regeneration. Nanomaterials 2021, 11, 3016. [Google Scholar] [CrossRef]
  43. Haque, F.Z.; Nandanwar, R.; Singh, P. Evaluating photodegradation properties of anatase and rutile TiO2 nanoparticles for organic compounds. Optik 2016, 128, 191–200. [Google Scholar] [CrossRef]
  44. Jiang, P.; Xiang, W.; Kuang, J.; Liu, W.; Cao, W. Effect of cobalt doping on the electronic, optical and photocatalytic properties of TiO2. Solid State Sci. 2015, 46, 27–32. [Google Scholar] [CrossRef]
  45. Yu, Y.; Liu, S.; Wang, W.; Shang, Q.; Han, J.; Liu, C.; Tian, Z.; Chen, J. Eco-friendly utilization of sawdust: Ionic liquid-modified biochar for enhanced Li+ storage of TiO2. Sci. Total Environ. 2021, 794, 148688. [Google Scholar] [CrossRef] [PubMed]
  46. Olowoyo, J.O.; Kumar, M.; Dash, T.; Saran, S.; Bhandari, S.; Kumar, U. Self-organized copper impregnation and doping in TiO2 with enhanced photocatalytic conversion of H2O and CO2 to fuel. Int. J. Hydrogen Energy 2018, 43, 19468–19480. [Google Scholar] [CrossRef]
  47. Camposeco, R.; Hinojosa-Reyes, M.; Zanella, R. Highly efficient photocatalytic hydrogen evolution by using Rh as co-catalyst in the Cu/TiO2 system. Int. J. Hydrogen Energy 2021, 46, 26074–26086. [Google Scholar] [CrossRef]
  48. Deshmane, V.G.; Owen, S.L.; Abrokwah, R.Y.; Kuila, D. Mesoporous nanocrystalline TiO2 supported metal (Cu, Co, Ni, Pd, Zn, and Sn) catalysts: Effect of metal-support interactions on steam reforming of methanol. J. Mol. Catal. A Chem. 2015, 408, 202–213. [Google Scholar] [CrossRef]
  49. Ruíz-Santoyo, V.; Marañon-Ruiz, V.F.; Romero-Toledo, R.; Vargas, O.A.G.; Pérez-Larios, A. Photocatalytic Degradation of Rhodamine B and Methylene Orange Using TiO2-ZrO2 as Nanocomposite. Catalysts 2021, 11, 1035. [Google Scholar] [CrossRef]
  50. Padiyan, D.P.; Raja, D.H. Synthesis of Various Generations Titania Nanotube Arrays by Electrochemical Anodization for H2 Production. Energy Procedia 2012, 22, 88–100. [Google Scholar] [CrossRef]
  51. Kong, C.P.Y.; Suhaimi, N.A.A.; Shahri, N.N.M.; Lim, J.; Nur, M.; Hobley, J.; Usman, A. Auramine O UV Photocatalytic Degradation on TiO2 Nanoparticles in a Heterogeneous Aqueous Solution. Catalysts 2022, 12, 975. [Google Scholar] [CrossRef]
  52. Zulmajdi, S.L.N.; Zamri, N.I.I.; Mahadi, A.H.; Rosli, M.Y.H.; Ja’afar, F.; Yasin, H.M.; Kusrini, E.; Hobley, J.; Usman, A. Sol-gel Preparation of Different Crystalline Phases of TiO2 Nanoparticles for Photocatalytic Degradation of Methylene Blue in Aqueous Solution. Am. J. Nanomater. 2019, 7, 39–45. [Google Scholar] [CrossRef]
  53. Guevara, C.G.A.; Galindo, R.S.; Pinilla, M.A.G.; Vargas, D.X.M.; Delgado, N.A.R. Water Disinfection Using Chitosan Microbeads with N-, C-, C-N/TiO2 By Photocatalysis Under Visible Light. Top. Catal. 2021, 64, 142–154. [Google Scholar] [CrossRef]
  54. Tahya, C.Y.; Irawati, W.; Karnelasatri, K.; Purba, F.J. Synthesis and characterization of TiO2-CaO and TiO2-CaO-Fe2O3 photocatalyst for removal of catechol. Molekul 2019, 14, 140–148. [Google Scholar] [CrossRef] [Green Version]
  55. Lee, J.C.; Gopalan, A.I.; Sai-Anand, G.; Lee, K.P.; Kim, W.J. Preparation of visible light photocatalytic graphene embedded rutile titanium(IV) oxide composite nanowires and enhanced NOx removal. Catalysts 2019, 9, 170. [Google Scholar] [CrossRef]
  56. León, A.; Reuquen, P.; Garín, C.; Segura, R.; Vargas, P.; Zapata, P.; Orihuela, P. FTIR and Raman Characterization of TiO2 Nanoparticles Coated with Polyethylene Glycol as Carrier for 2-Methoxyestradiol. Appl. Sci. 2017, 7, 49. [Google Scholar] [CrossRef]
  57. Alsharaeh, E.H.; Bora, T.; Soliman, A.; Ahmed, F.; Bharath, G.; Ghoniem, M.G.; Abu-Salah, K.M.; Dutta, J. Sol-Gel-Assisted Microwave-Derived Synthesis of Anatase Ag/TiO2/GO Nanohybrids toward Efficient Visible Light Phenol Degradation. Catalysts 2017, 7, 133. [Google Scholar] [CrossRef]
  58. Raja, K.; Ramesh, P.S.; Geetha, D. Structural, FTIR and photoluminescence studies of Fe doped ZnO nanopowder by co-precipitation method, Spectrochim. Acta—Part A Mol. Biomol. Spectrosc. 2014, 131, 183–188. [Google Scholar] [CrossRef]
  59. Jeyachitra, R.; Senthilnathan, V.; Senthil, T.S. Studies on electrical behavior of Fe doped ZnO nanoparticles prepared via co-precipitation approach for photo-catalytic application. J. Mater. Sci. Mater. Electron. 2018, 29, 1189–1197. [Google Scholar] [CrossRef]
  60. Sing, K.S.W.; Everett, D.H.; Haul, R.A.W.; Moscou, L.; Pieretti, R.A.; Rouquerol, J.; Siemieniewska, T. Reporting physisorption data for Gas/solid systems with special reference to the determination of Surface Area and Porosity. Pure Appl. Chem. 1985, 57, 603–619. [Google Scholar] [CrossRef]
  61. Tahir, M.; Tahir, B.; Amin, N.A.S.; Muhammad, A. Photocatalytic CO2 methanation over NiO/In2O3 promoted TiO2 nanocatalysts using H2O and/or H2 reductants. Energy Convers. Manag. 2016, 119, 368–378. [Google Scholar] [CrossRef]
  62. Rodríguez, J.L.; Poznyak, T.; Valenzuela, M.A.; Tiznado, H.; Chairez, I. Surface interactions and mechanistic studies of 2, 4-dichlorophenoxyacetic acid degradation by catalytic ozonation in presence of Ni/TiO2 Surface interactions and mechanistic studies of 2, 4-dichlorophenoxyacetic acid degradation by catalytic ozonatio. Chem. Eng. J. 2013, 222, 426–4334. [Google Scholar] [CrossRef]
  63. Mutuma, B.K.; Shao, G.N.; Kim, W.D.; Kim, H.T. Sol–gel synthesis of mesoporous anatase–brookite and anatase–brookite–rutile TiO2 nanoparticles and their photocatalytic properties. J. Colloid Interface Sci. 2015, 442, 1–7. [Google Scholar] [CrossRef] [PubMed]
  64. Ceballos-Chuc, M.C.; Ramos-Castillo, C.M.; Rodríguez-Pérez, M.; Ruiz-Gómez, M.Á.; Rodríguez-Gattorno, G.; Villanueva-Cab, J. Synergistic Correlation in the Colloidal Properties of TiO2 Nanoparticles and Its Impact on the Photocatalytic Activity. Inorganics 2022, 10, 125. [Google Scholar] [CrossRef]
  65. Bharti, B.; Kumar, S.; Lee, H.-N.; Kumar, R. Formation of oxygen vacancies and Ti3+ state in TiO2 thin film and enhanced optical properties by air plasma treatment. Sci. Rep. 2016, 6, 32355. [Google Scholar] [CrossRef] [PubMed]
  66. Nawaz, R.; Kait, C.F.; Chia, H.Y.; Isa, M.H.; Huei, L.W. Glycerol-mediated facile synthesis of colored titania nanoparticles for visible light photodegradation of phenolic compounds. Nanomaterials 2019, 9, 1586. [Google Scholar] [CrossRef]
  67. Reyes, M.H.; Camposeco, R.; González, V.R. Wastewater Contaminated with Hydrazine as Scavenger Agent for Hydrogen Production by Cu/Ti Nanostructures. Catalysts 2021, 11, 74. [Google Scholar] [CrossRef]
  68. Atuchin, V.V.; Kesler, V.G.; Pervukhina, N.V.; Zhang, Z. Ti 2p and O 1s core levels and chemical bonding in titanium-bearing oxides. J. Electron Spectrosc. Relat. Phenom. 2006, 152, 18–24. [Google Scholar] [CrossRef]
  69. Chenakin, S.; Kruse, N. Combining XPS and ToF-SIMS for assessing the CO oxidation activity of Au/TiO2 catalysts. J. Catal. 2018, 358, 224–236. [Google Scholar] [CrossRef]
  70. Chanda, A.; Rout, K.; Vasundhara, M.; Joshi, S.R.; Singh, J. Structural and magnetic study of undoped and cobalt doped TiO2 nanoparticles. RSC Adv. 2018, 8, 10939–10947. [Google Scholar] [CrossRef]
  71. Liu, Y.; Chen, P.; Fan, Y.; Fan, Y.; Shi, X.; Cui, G.; Tang, B. Grey Rutile TiO2 with Long-Term Photocatalytic Activity Synthesized Via Two-Step Calcination. Nanomaterials 2020, 10, 920. [Google Scholar] [CrossRef]
  72. Oku, M.; Matsuta, H.; Wagatsuma, K.; Waseda, Y.; Kohiki, S. Removal of inelastic scattering part from Ti2p XPS spectrum of TiO2 by deconvolution method using O1s as response function. J. Electron. Spectrosc. Relat. Phenom. 1999, 105, 211–218. [Google Scholar] [CrossRef]
  73. Iatsunskyi, I.; Kempiński, M.; Nowaczyk, G.; Jancelewicz, M.; Pavlenko, M.; Załęski, K.; Jurga, S. Structural and XPS studies of PSi/TiO2 nanocomposites prepared by ALD and Ag-assisted chemical etching. Appl. Surf. Sci. 2015, 347, 777–783. [Google Scholar] [CrossRef]
  74. Hinojosa-Reyes, M.; Zanella, R.; Maturano-Rojas, V.; Rodríguez-González, V. Gold-TiO2-Nickel catalysts for low temperature-driven CO oxidation reaction. Appl. Surf. Sci. 2016, 368, 224–232. [Google Scholar] [CrossRef]
  75. Amorós-Pérez, A.; Cano-Casanova, L.; Castillo-Deltell, A.; Lillo-Ródenas, M.; Román-Martínez, M. TiO2 Modification with Transition Metallic Species (Cr, Co, Ni, and Cu) for Photocatalytic Abatement of Acetic Acid in Liquid Phase and Propene in Gas Phase. Materials 2018, 12, 40. [Google Scholar] [CrossRef] [PubMed]
  76. Gomez-Solis, C.; Mendoza, R.; Rios-Orihuela, J.F.; Robledo-Trujillo, G.; Diaz-Torres, L.A.; Oliva, J.; Rodriguez-Gonzalez, V. Efficient solar removal of acetaminophen contaminant from water using flexible graphene composites functionalized with Ni@TiO2:W nanoparticles. J. Environ. Manag. 2021, 290, 112665. [Google Scholar] [CrossRef] [PubMed]
  77. Gupta, B.; Kumar, N.; Panda, K.; Kanan, V.; Joshi, S.; Visoly-Fisher, I. Role of oxygen functional groups in reduced graphene oxide for lubrication. Sci. Rep. 2017, 7, 45030. [Google Scholar] [CrossRef]
  78. Dougherty, A.; Harper, C.; Iskandar, F.; Arif, I.; Dougherty, G. In situ functionalization of gadolinium oxide nanoparticles with polyethylene glycol (PEG) by pulsed laser ablation in a liquid medium (PLAL). J. Sci. Adv. Mater. Devices 2018, 3, 419–427. [Google Scholar] [CrossRef]
  79. Sivaranjini, B.; Mangaiyarkarasi, R.; Ganesh, V.; Umadevi, S. Vertical Alignment of Liquid Crystals Over a Functionalized Flexible Substrate. Sci. Rep. 2018, 8, 8891. [Google Scholar] [CrossRef]
  80. Feng, M.; Lu, W.; Zhou, Y.; Zhen, R.; He, H.; Wang, Y.; Li, C. Synthesis of polypyrrole/nitrogen-doped porous carbon matrix composite as the electrode material for supercapacitors. Sci. Rep. 2020, 10, 15370. [Google Scholar] [CrossRef]
  81. Siah, W.R.; Roslan, N.A.; Lintang, H.O.; Shamsuddin, M.; Yuliati, L. Photocatalytic Removal of 2,4-D Herbicide on Lanthanum Oxide-Modified Titanium Dioxide. Adv. Mater. Res. 2015, 1112, 168–171. [Google Scholar] [CrossRef]
  82. Hanh, N.N.; Khoi, P.Q.; Thao, V.H. Photocatalytic degradation of 2,4-Dichlorophenoxyacetic acid on N-doped Ttitanium. Vietanm J. Chem. 2016, 54, 199–203. [Google Scholar] [CrossRef]
  83. Hoseini, S.N.; Pirzaman, A.K.; Aroon, M.A.; Pirbazari, A.E. Photocatalytic degradation of 2,4-dichlorophenol by Co-doped TiO2 (Co/TiO2) nanoparticles and Co/TiO2 containing mixed matrix membranes. J. Water Process Eng. 2017, 17, 124–134. [Google Scholar] [CrossRef]
  84. Shen, S.; Kronawitter, C.; Kiriakidis, G. An overview of photocatalytic materials. J. Mater. 2017, 3, 1–2. [Google Scholar] [CrossRef]
  85. Girón-Navarro, R.; Linares-Hernández, I.; Teutli-Sequeira, E.A.; Martínez-Miranda, V.; Santoyo-Tepole, F. Evaluation and comparison of advanced oxidation processes for the degradation of 2,4-dichlorophenoxyacetic acid (2,4-D): A review. Environ. Sci. Pollut. Res. 2021, 28, 26325–26358. [Google Scholar] [CrossRef] [PubMed]
  86. Valadez-Renteria, E.; Barrera-Rendon, E.; Oliva, J.; Rodriguez-Gonzalez, V. Flexible CuS/TiO2 based composites made with recycled bags and polystyrene for the efficient removal of the 4-CP pesticide from drinking water. Sep. Purif. Technol. 2021, 270, 118821. [Google Scholar] [CrossRef]
  87. Temerov, F.; Haapanen, J.; Mäkelä, J.M.; Saarinen, J.J. Photocatalytic Activity of Multicompound TiO2/SiO2 Nanoparticles. Inorganics 2021, 9, 21. [Google Scholar] [CrossRef]
  88. Huang, F.; Yan, A.; Zhao, H. Influences of doping on photocatalytic properties of TiO2 photocatalyst. In Semiconductor Photocatalysis—Materials, Mechanims and Applications, 1st ed.; Yan, A., Ed.; IntechOpen: London, UK, 2016; Volume 1, Chapter 2; pp. 21–80. [Google Scholar] [CrossRef]
  89. Wang, H.; Zhao, Y.; Su, Y.; Li, T.; Yao, M.; Qin, C. Fenton-like degradation of 2,4-dichlorophenol using calcium peroxide particles: Performance and mechanisms. RSC Adv. 2017, 7, 4563–4571. [Google Scholar] [CrossRef]
  90. Nejad, S.T.; Shahrnoy, A.A.; Mahjoub, A.R.; Saloumahaleh, N.E.; Khazaee, Z. Photodegradation of 2,4-dichlorophenol by supported Pd(X2) catalyst (X = Cl, Br, N3): A HOMO manipulating point of view. Environ. Sci. Pollut. Res. 2018, 25, 9969–9980. [Google Scholar] [CrossRef]
  91. Shahrnoy, A.A.; Mahjoub, A.R.; Morsali, A.; Dusek, M.; Eigner, V. Sonochemical synthesis of polyoxometalate based of ionic crystal nanostructure: A photocatalyst for degradation of 2,4-dichlorophenol. Ultrason. Sonochem. 2018, 40, 174–183. [Google Scholar] [CrossRef]
  92. Liu, Y.; Sun, B. Unusual Catalytic Effect of Fe3+ on 2,4-dichlorophenoxyacetic Acid Degradation by Radio Frequency Discharge in Aqueous Solution. Water 2022, 14, 1719. [Google Scholar] [CrossRef]
Figure 1. Scanning electron microscopy images: (a) TiO2; (b) Co/TiO2; (c) Cu/TiO2; (d) Fe/TiO2; and (e) Ni/TiO2.
Inorganics 10 00157 g001
Figure 2. Transmission Electron Microscopy images and particle diameter of photocatalysts: (a) TiO2; (b) Co/TiO2; (c) Cu/TiO2; (d) Fe/TiO2; and (e) Ni/TiO2.
Inorganics 10 00157 g002aInorganics 10 00157 g002b
Figure 3. SAED pattern images of: (a) TiO2; (b) Co/TiO2; (c) Cu/TiO2; (d) Fe/TiO2; and (e) Ni/TiO2.
Inorganics 10 00157 g003
Figure 4. UV-Vis spectra and determination of the band gap energies. (a) UV–vis absorption spectra of TiO2 nanoparticles and photocatalyst. (b) Tauc’s plot of pure TiO2 nanoparticles and photocatalyst.
Inorganics 10 00157 g004
Figure 5. X-ray diffraction patterns of photocatalysts.
Inorganics 10 00157 g005
Figure 6. FT-IR spectra of photocatalysts. (a) FT-IR peaks of pure TiO2 nanoparticles. (b) FT-IR spectra of modified-TiO2 with metallic ions.
Inorganics 10 00157 g006
Figure 7. Nitrogen adsorption-desorption isotherms and the corresponding pore size distribution curves (inset): (a) TiO2, (b) Co/TiO2, (c) Cu/TiO2, (d) Fe/TiO2 and (e) Ni/TiO2.
Inorganics 10 00157 g007
Figure 8. Ti 2p XPS spectrum of: (a) TiO2, (b) Co/TiO2, (c) Cu/TiO2, (d) Fe/TiO2 and (e) Ni/TiO2.
Inorganics 10 00157 g008
Figure 9. Higher-resolution deconvoluted XPS spectra of: (a) Co/TiO2, (b) Cu/TiO2, (c) Fe/TiO2 and (d) Ni/TiO2.
Inorganics 10 00157 g009
Figure 10. O 1s XPS spectrum of: (a) TiO2, (b) Co/TiO2, (c) Cu/TiO2, (d) Fe/TiO2 and (e) Ni/TiO2.
Inorganics 10 00157 g010
Figure 11. C 1s XPS spectrum of: (a) TiO2, (b) Co/TiO2, (c) Cu/TiO2, (d) Fe/TiO2 and (e) Ni/TiO2.
Inorganics 10 00157 g011
Figure 12. Degradation activity of 2,4-D (a) and percentage of degradation after 6 h of reaction (b). For the plot (b), all values are mean ± standard deviation of three determinations. Different letters in each column indicate significant statistical differences between treatments (p < 0.05).
Inorganics 10 00157 g012
Figure 13. Degradation activity of 2,4-DCP (a) and percentage of degradation after 6 h of reaction (b). For the plot (b), all values are mean ± standard deviation of three determinations. Different letters in each column indicate significant statistical differences between treatments (p < 0.05).
Inorganics 10 00157 g013
Figure 14. Experimental data and fitting assuming a pseudo-first order reaction rate: 2,4-D (a) and 2,4-DCP (b).
Inorganics 10 00157 g014
Figure 15. Removal of total organic carbon (TOC): 2,4-D (a) and 2,4-DCP (b).
Inorganics 10 00157 g015
Figure 16. Photocatalytic mechanisms diagram for the deposited-TiO2.
Inorganics 10 00157 g016
Table 1. Optical and textural properties for the TiO2 and deposited-TiO2 photocatalysts.
CatalystEg (eV)λ (nm)Average Crystallite Size (nm) *d-Spacing (nm)SBET (m2g−1)VP (cm3g−1)dP (nm)
TiO22.7742112.45 ± 0.200.3522920.370.09618.83
Co/TiO22.8041612.35 ± 0.200.3524320.10.09218.37
Cu/TiO22.5045110.42 ± 0.150.3546420.20.07715.19
Fe/TiO22.5344312.42 ± 0.210.3528418.40.05111.00
Ni/TiO22.8540814.23 ± 0.300.3522921.30.0499.153
Notes: Eg: Band gap energy; λ: Absorbance; *: Standard error; SBET: BET surface area; VP: pore volume; dp: average pore size.
Table 2. Unit cell parameters for the photocatalysts.
Sample a (Å)c (Å) c/a (Å)Volume (Å3)
TiO23.7889.5242.515136.643
Co/TiO23.7889.5202.513136.602
Cu/TiO23.8039.5612.514138.061
Fe/TiO23.7919.5322.514136.991
Ni/TiO23.7889.5202.513136.602
Table 3. Rate constant for the pseudo-first order kinetic equation and half-life time for the 2,4-D and 2,4-DCP degradation in the presence of TiO2 pure and deposited-TiO2 catalysts.
2,4-D2,4-DCP
k (min−1)t 1/2k (min−1)t 1/2
Photolysis0.000044,355.800.0021698.63
TiO20.0019287.680.0034154.84
Co/TiO20.00022259.480.0026281.43
Cu/TiO20.00002690.360.0045157.87
Fe/TiO20.00011257.890.0049157.48
Ni/TiO20.0037183.710.004649.24
Table 4. Coefficient of correlation of first-order kinetic equation, coefficient of correlation of zero-order degradation kinetic equation and coefficient of correlation of L-H first-order degradation kinetic equation.
2,4-D2,4-DCP
Kinetic Zero OrderKinetic First OrderKinetic
L-H Model
Kinetic Zero OrderKinetic First OrderKinetic
L-H Model
Photolysis0.54230.54230.89620.88460.88380.9541
TiO20.95070.95090.97420.89690.89540.9831
Co/TiO20.89420.89410.98040.91620.91540.9575
Cu/TiO20.79890.79880.98500.96690.96790.9932
Fe/TiO20.91970.91960.97830.94710.94640.9626
Ni/TiO20.92680.92560.97250.92380.92220.9740
Table 5. Mineralization (%) TOC for 2,4-D and 2,4-DCP.
CompoundPhotolysisTiO2Co/TiO2Cu/TiO2Fe/TiO2Ni/TiO2
2,4-D5.3%42.6%18.9%19.2%12.4%68.3%
2,4-DCP53.4%76.8%67.2%68.4%73.6%86.5%
Publisher’s Note: MDPI stays neutral with regard to jurisdictional claims in published maps and institutional affiliations.

