1. Introduction
Doppler frequency shift (DFS) and angle of arrival (AOA) measurement are widely investigated in radar [
1], electronic warfare [
2] and communication systems [
3], mainly because the location, direction and radial velocity of moving targets can be judged by these two parameters. Conventional electrical-based DFS and AOA measurement technologies [
4,
5,
6] suffer from bottlenecks such as electromagnetic interference and limited operation bandwidth. Therefore, to overcome the electronic bottleneck, microwave photonic measurement technologies for DFS and AOA are proposed and developed, which have the advantages of large working bandwidth, low loss, small size, and anti-electromagnetic interference.
Many photonic approaches for measuring the DFS [
7,
8,
9,
10] or the AOA [
11,
12,
13,
14,
15,
16,
17] have been reported. These two parameters meet the requirement of velocity measurement and localization of the target objects, respectively. However, the structures of the measurement systems for these two parameters are independent of each other. This requires system reconstruction or multi-step operation to achieve simultaneous measurement of velocity and position. Recently, in order to solve the problem of multi-parameter measurement systems, some methods to simultaneously implement measurements of DFS and AOA based on one system have been proposed [
18,
19,
20,
21,
22,
23,
24]. In [
18], simultaneous measurements of AOA and DFS are accomplished by connecting a phase modulator (PM) and a polarization-division-multiplexed Mach–Zehnder modulator (PDM-MZM) in series. Moreover, an optical filter is needed to eliminate the undesired sidebands, which increases the system complexity and flexibility. In [
19], only one dual-parallel Mach–Zehnder modulator (DPMZM) is used in the structure, and two channels are built by separating the upper and the lower sidebands through a wavelength-division multiplexer (WDM). It can realize the DFS measurement error of less than 0.07 Hz and the phase measurement error of less than 3.4° in the range of 300° without direction ambiguity. However, the usage of WDM limits the operating range of the system. In the systems of [
20,
21,
22], unwanted frequency components are eliminated by setting the reference signal frequency 2 MHz above the transmitted signal frequency instead of using a WDM or a filter. These measurement systems are simple and compact. Nevertheless, the received echo signals and the local oscillator signal are difficult to synchronize, which will affect the measurement accuracy.
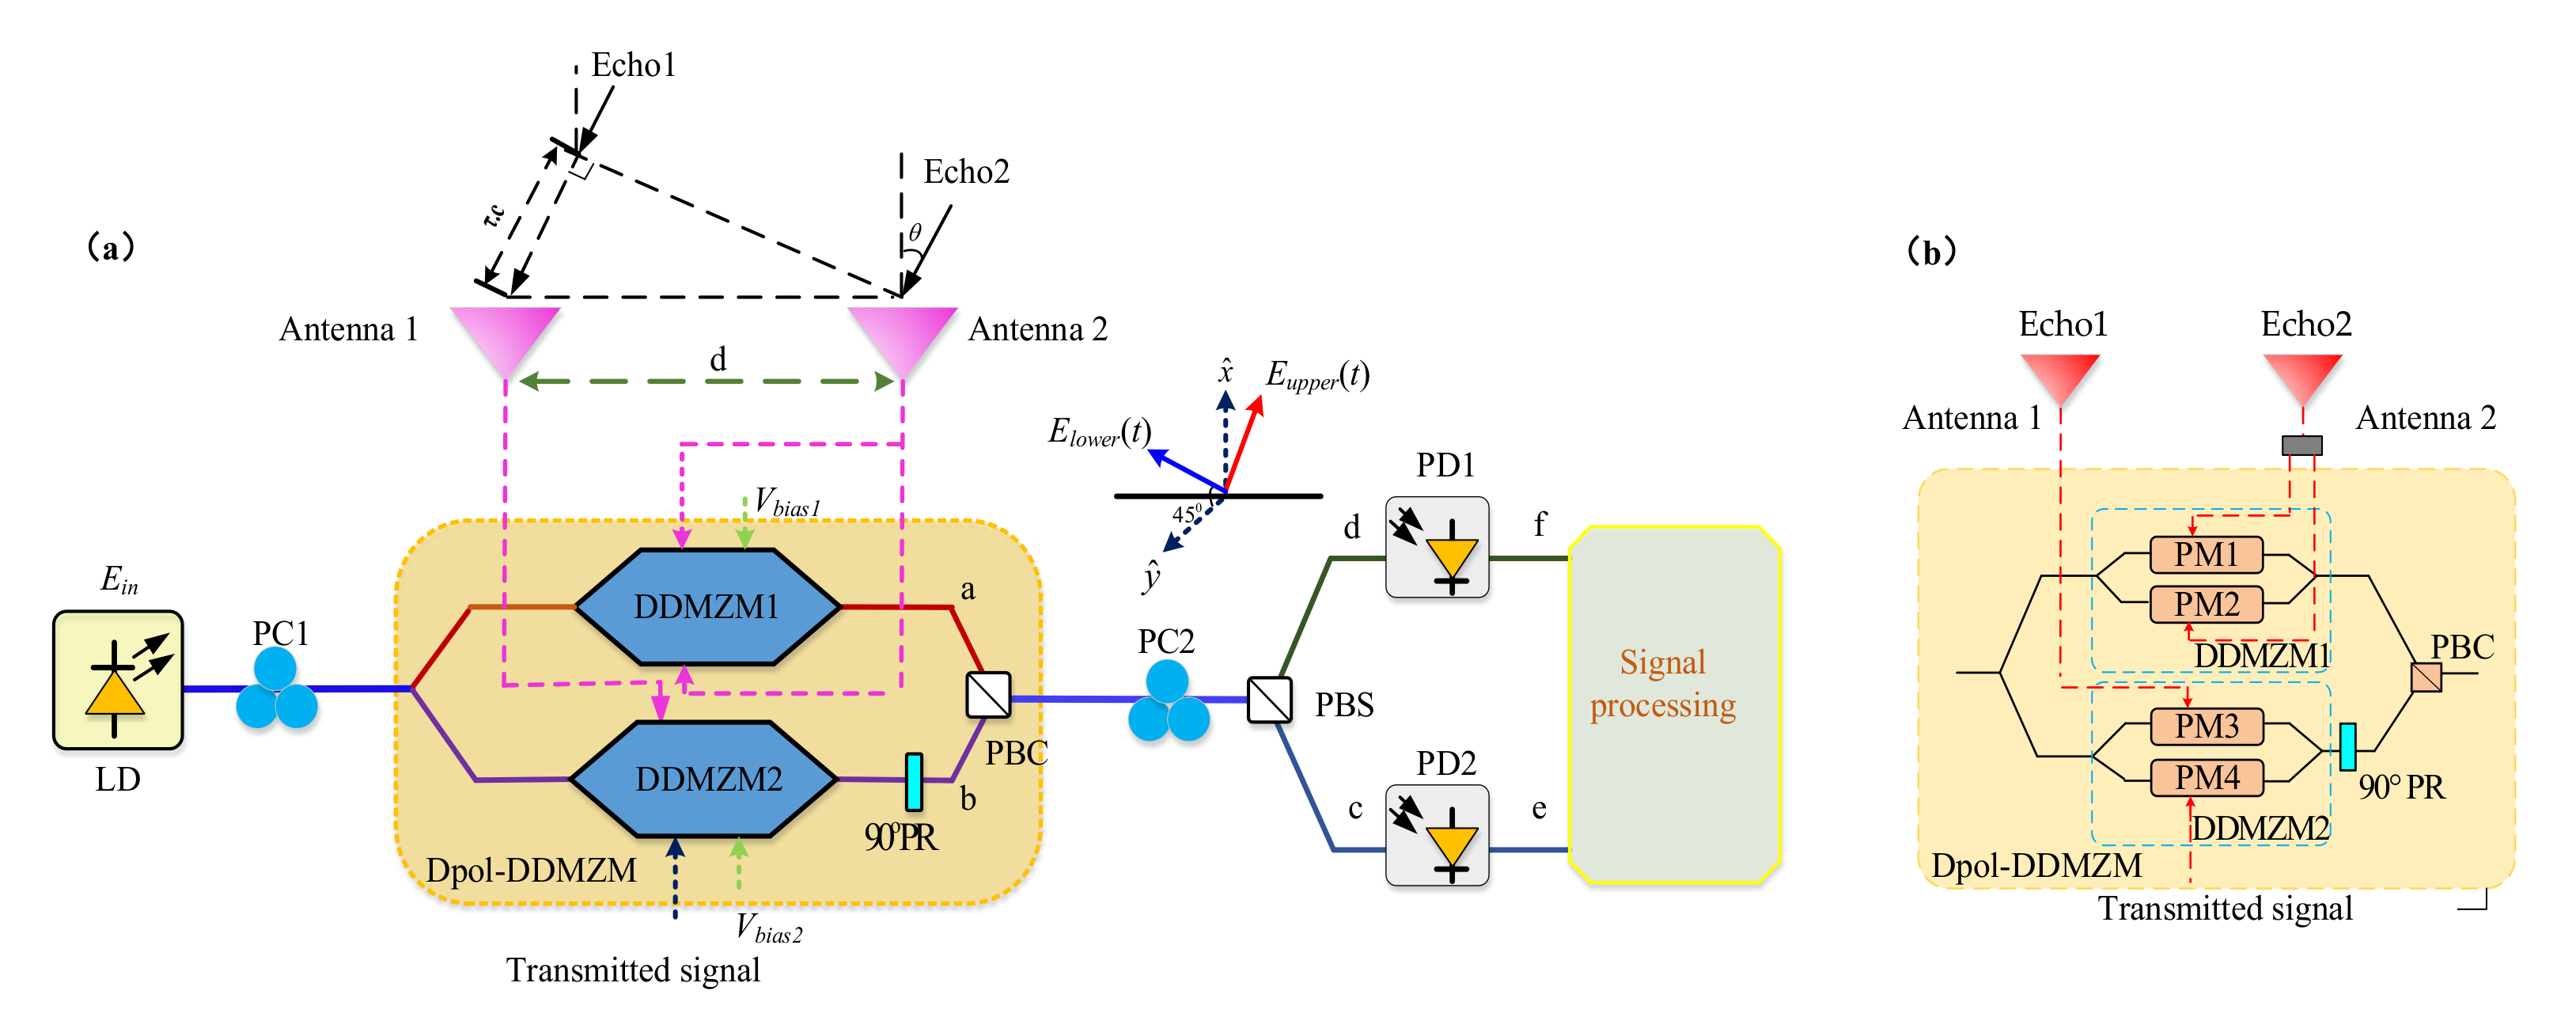
In this paper, we propose a photonic scheme to simultaneously implement the unambiguous measurement of the AOA and DFS utilizing an integrated dual-polarization dual-drive Mach–Zehnder modulator (DPol-DDMZM). An optical carrier is sent to the DPol-DDMZM. A transmitted signal is sent to one RF port of the sub-DDMZMs, and two echo signals are received by two antennas and are, respectively, fed into the other three RF ports of the two sub-DDMZMs. The modulated optical signals are demultiplexed by a polarization beam splitter (PBS) and divided into two branches. After photodetections (PDs), a pair of low-frequency electrical signals with a specific phase relationship is obtained. Here, an amplitude comparison function (ACF) which is a function of the power ratio between the two electrical signals is constructed, and the phase difference can be retrieved with the ratio of two detected microwave powers. Due to the monotonous relationship between the AOA and the phase difference, the unambiguous AOA can be realized in a range of 90°. The simulation results show that the AOA measurement error is less than ±2.8° in the range of 0° to 78°. Moreover, the value and the orientation of the DFS easily acquired by analyzing the spectrum of the low-frequency electrical signal with errors of less than ±0.05 Hz. This system has a simple structure and does not require any optical filter or WDM, which makes the system operating frequency can be tuned flexibly. Therefore, it is more suitable for modern electronic warfare systems.
2. Principle
The proposed scheme for the simultaneous measurement of DFS and AOA is shown in
Figure 1a. The echo signals are received by two antennas (Antenna 1 and Antenna 2), which are expressed as
VE1(
t) =
Veexp(
jωet) and
VE2(
t) =
Veexp(
j(
ωet +
φ)), respectively.
Ve,
ωe are the voltage and the angular frequency.
φ is a phase difference between the two received signals. It is caused by a certain distance
d between the two receiving antennas, which makes the echo signals have a certain time delay difference
τ. The AOA of a microwave signal is defined as
. The relationship between them can be given by
where
fe is the frequency of the incoming echo signal,
c is the velocity of electromagnetic radiation in the vacuum. Hence, the AOA can be expressed by the phase difference as
Doppler frequency shift (DFS) is defined as the frequency offset of the echo signal and the transmitted signal [
25]. The moving object’s radial velocity and motor direction are commonly obtained from DFS, which can be written
where,
fDFS,
ft is the frequency of DFS and the transmitted signal, respectively.
Referring to
Figure 1a, an optical carrier generated from a laser diode (LD) is injected into a DPol-DDMZM via a polarization controller (PC1). It is expressed as
Ein(
t) =
Ecexp(
jωct), where
Ec and
ωc are the amplitude and the angular frequency of the optical carrier. The echo1 received by antenna1 and transmitted microwave signal are sent to the two RF ports of DDMZM2, respectively. The echo2 received by antenna2 is divided by a splitter into two identical RF signals and sent to the two RF ports of DDMZM1, as shown in
Figure 1b.
Two sub-DDMZMs both work at the maximum transmission point (MATP) to achieve phase modulation. Under the small-signal condition, the output signals of the DDMZM1 and the DDMZM2 can be expressed as:
where,
tff is the insertion loss of the modulator,
ωe and ωt are the angular frequency of the echo and transmitted microwave signal, respectively.
me = πV
e/V
π and
mt = πV
t/V
π denote the modulation depth of the echo microwave signal and the transmitted microwave signal, respectively. Vt is the voltages of the transmitted microwave signal and V
π is the half-wave voltage of the sub-DDMZMs.
Jn(.) is the Bessel function of the first kind of n-th order. Moreover, due to the following 90°PR in the lower arm, this modulator is a polarization multiplexed device. The output expression of the DPol-DDMZM can be written as
where,
and
represent two orthogonal polarization states. Then the polarization multiplexed signal is rotated and aligned to one of the principal axes of the polarization beam splitter (PBS) with the angle of 45° via a PC2. Thus, the optical signals along the upper branch and the lower branch of the PBS can be concluded as:
Substituting Equations (5) and (6) into Equation (7), Equation (8) can be rewritten as:
The output optical signals are detected separately by two low-speed photodetectors (PDs), and then the output photocurrents at the angular frequency of
are as follows:
where,
A = 2 − cos
φ,
B = sin
φ,
C = cos
φ + 2. As can be seen that the value of DFS, i.e.,
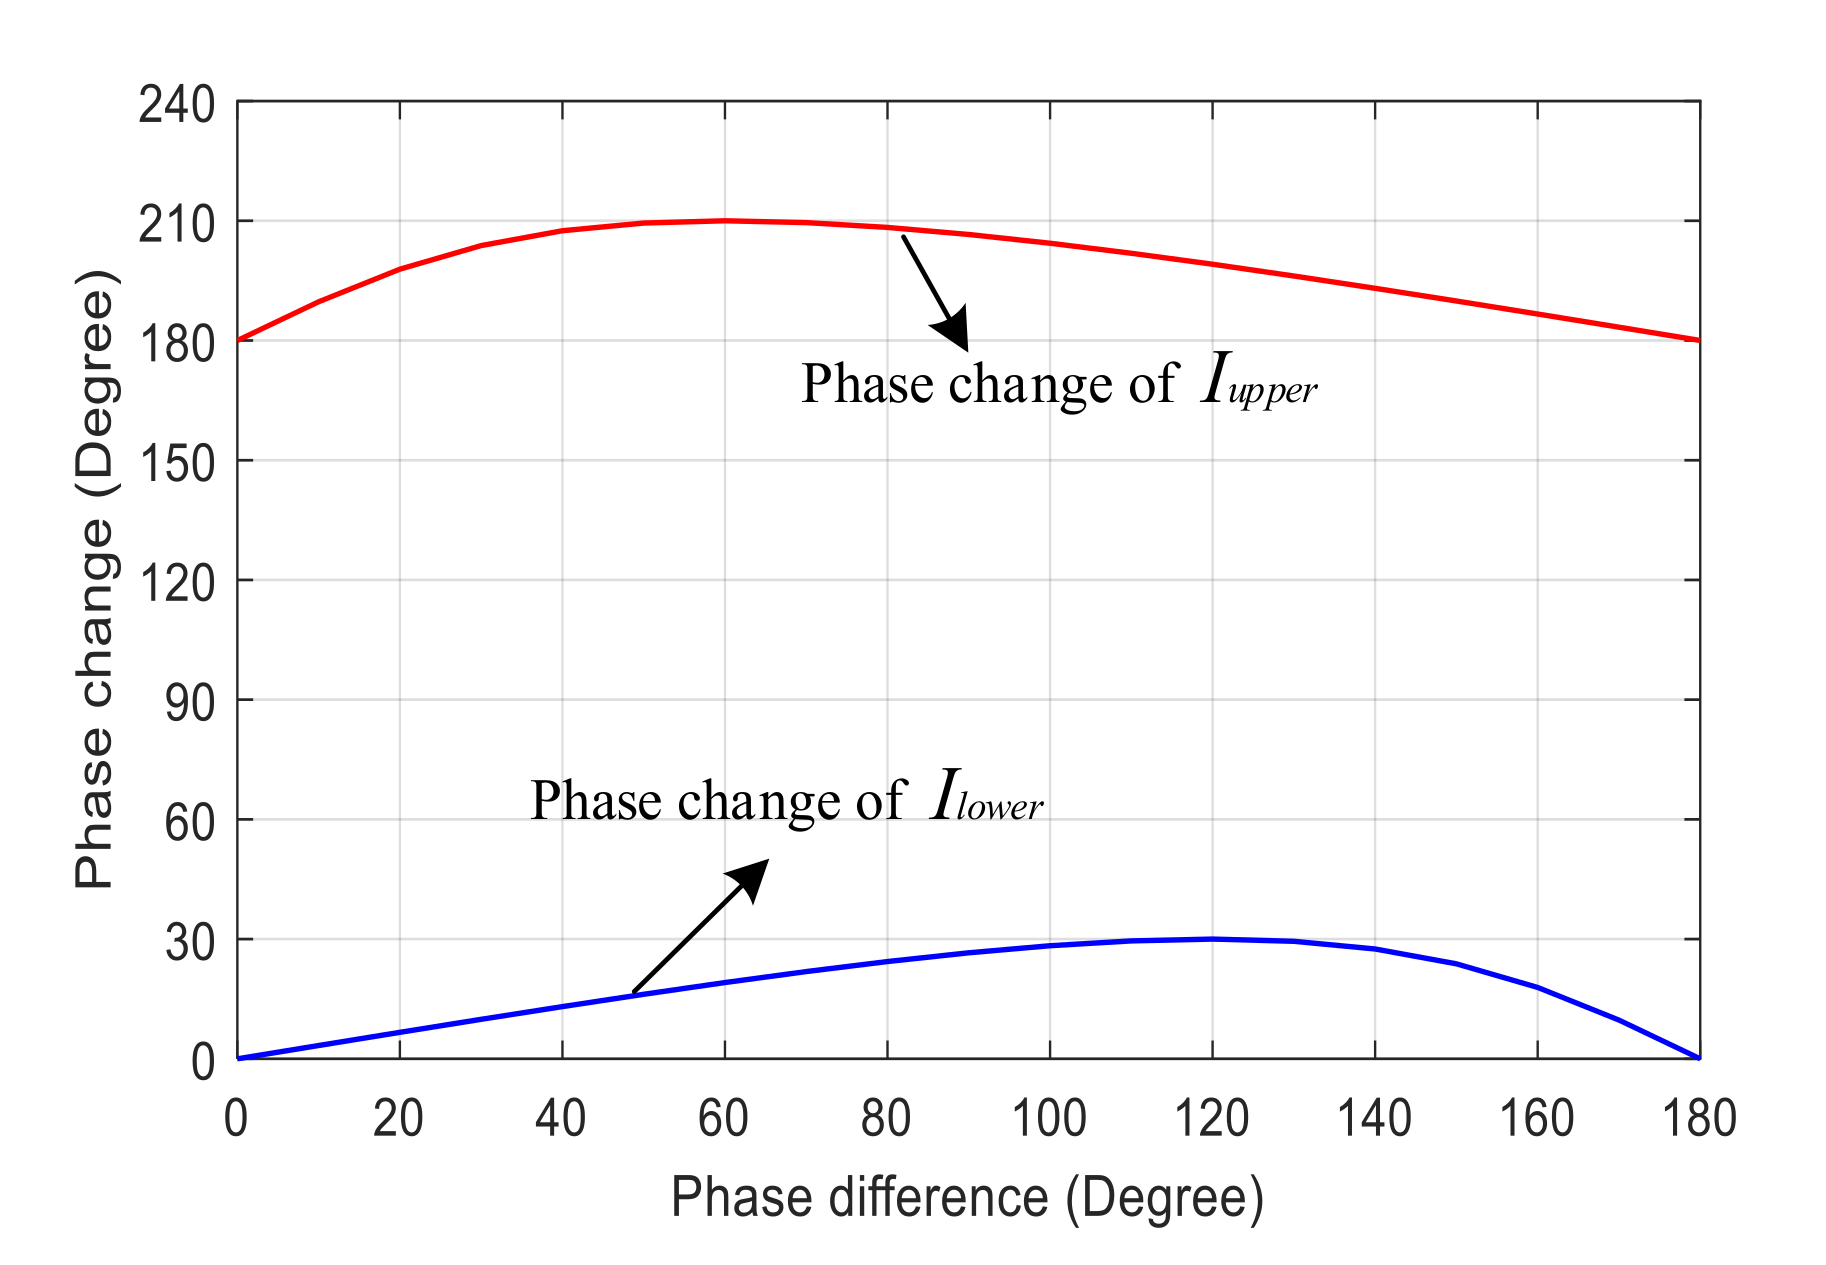
, can be figured out by processing the received electrical signals, and the moving direction of the target can also be distinguished by comparing the phase relationship of
Iupper and
Ilower. According to Equations (10) and (11), for the phase difference in the range of 0° to 180°, when the direction of the DFS is positive (
ωe >
ωt), the phase difference between
Iupper and
Ilower is from −180° to −234°. In contrast, the phase relationship between
Iupper and
Ilower is from 180° to 234° when the direction of the DFS is negative (
ωe <
ωt). Meanwhile, the phase of
Ilower changes by inches with
φ, but the phase of
Iupper varies greatly with
φ, as shown in
Figure 2. Therefore, the direction of the DFS can be accurately determined.
From Equation (10) or Equation (11), we can get the power of the frequency component that represents DFS frequency. It can be expressed as
However, according to Equation (12), we can find that the output powers, both the upper branch and the lower branch are related to the carrier power and modulation indices. This means that the phase difference cannot be determined unless the input signal power of the carrier signal and the microwave signal are known, and this problem is appeared in the previously reported AOA measurement systems [
14]. To solve this problem, amplitude comparison function (ACF) is introduced and given as the ratio between
Pupper and
Plower.
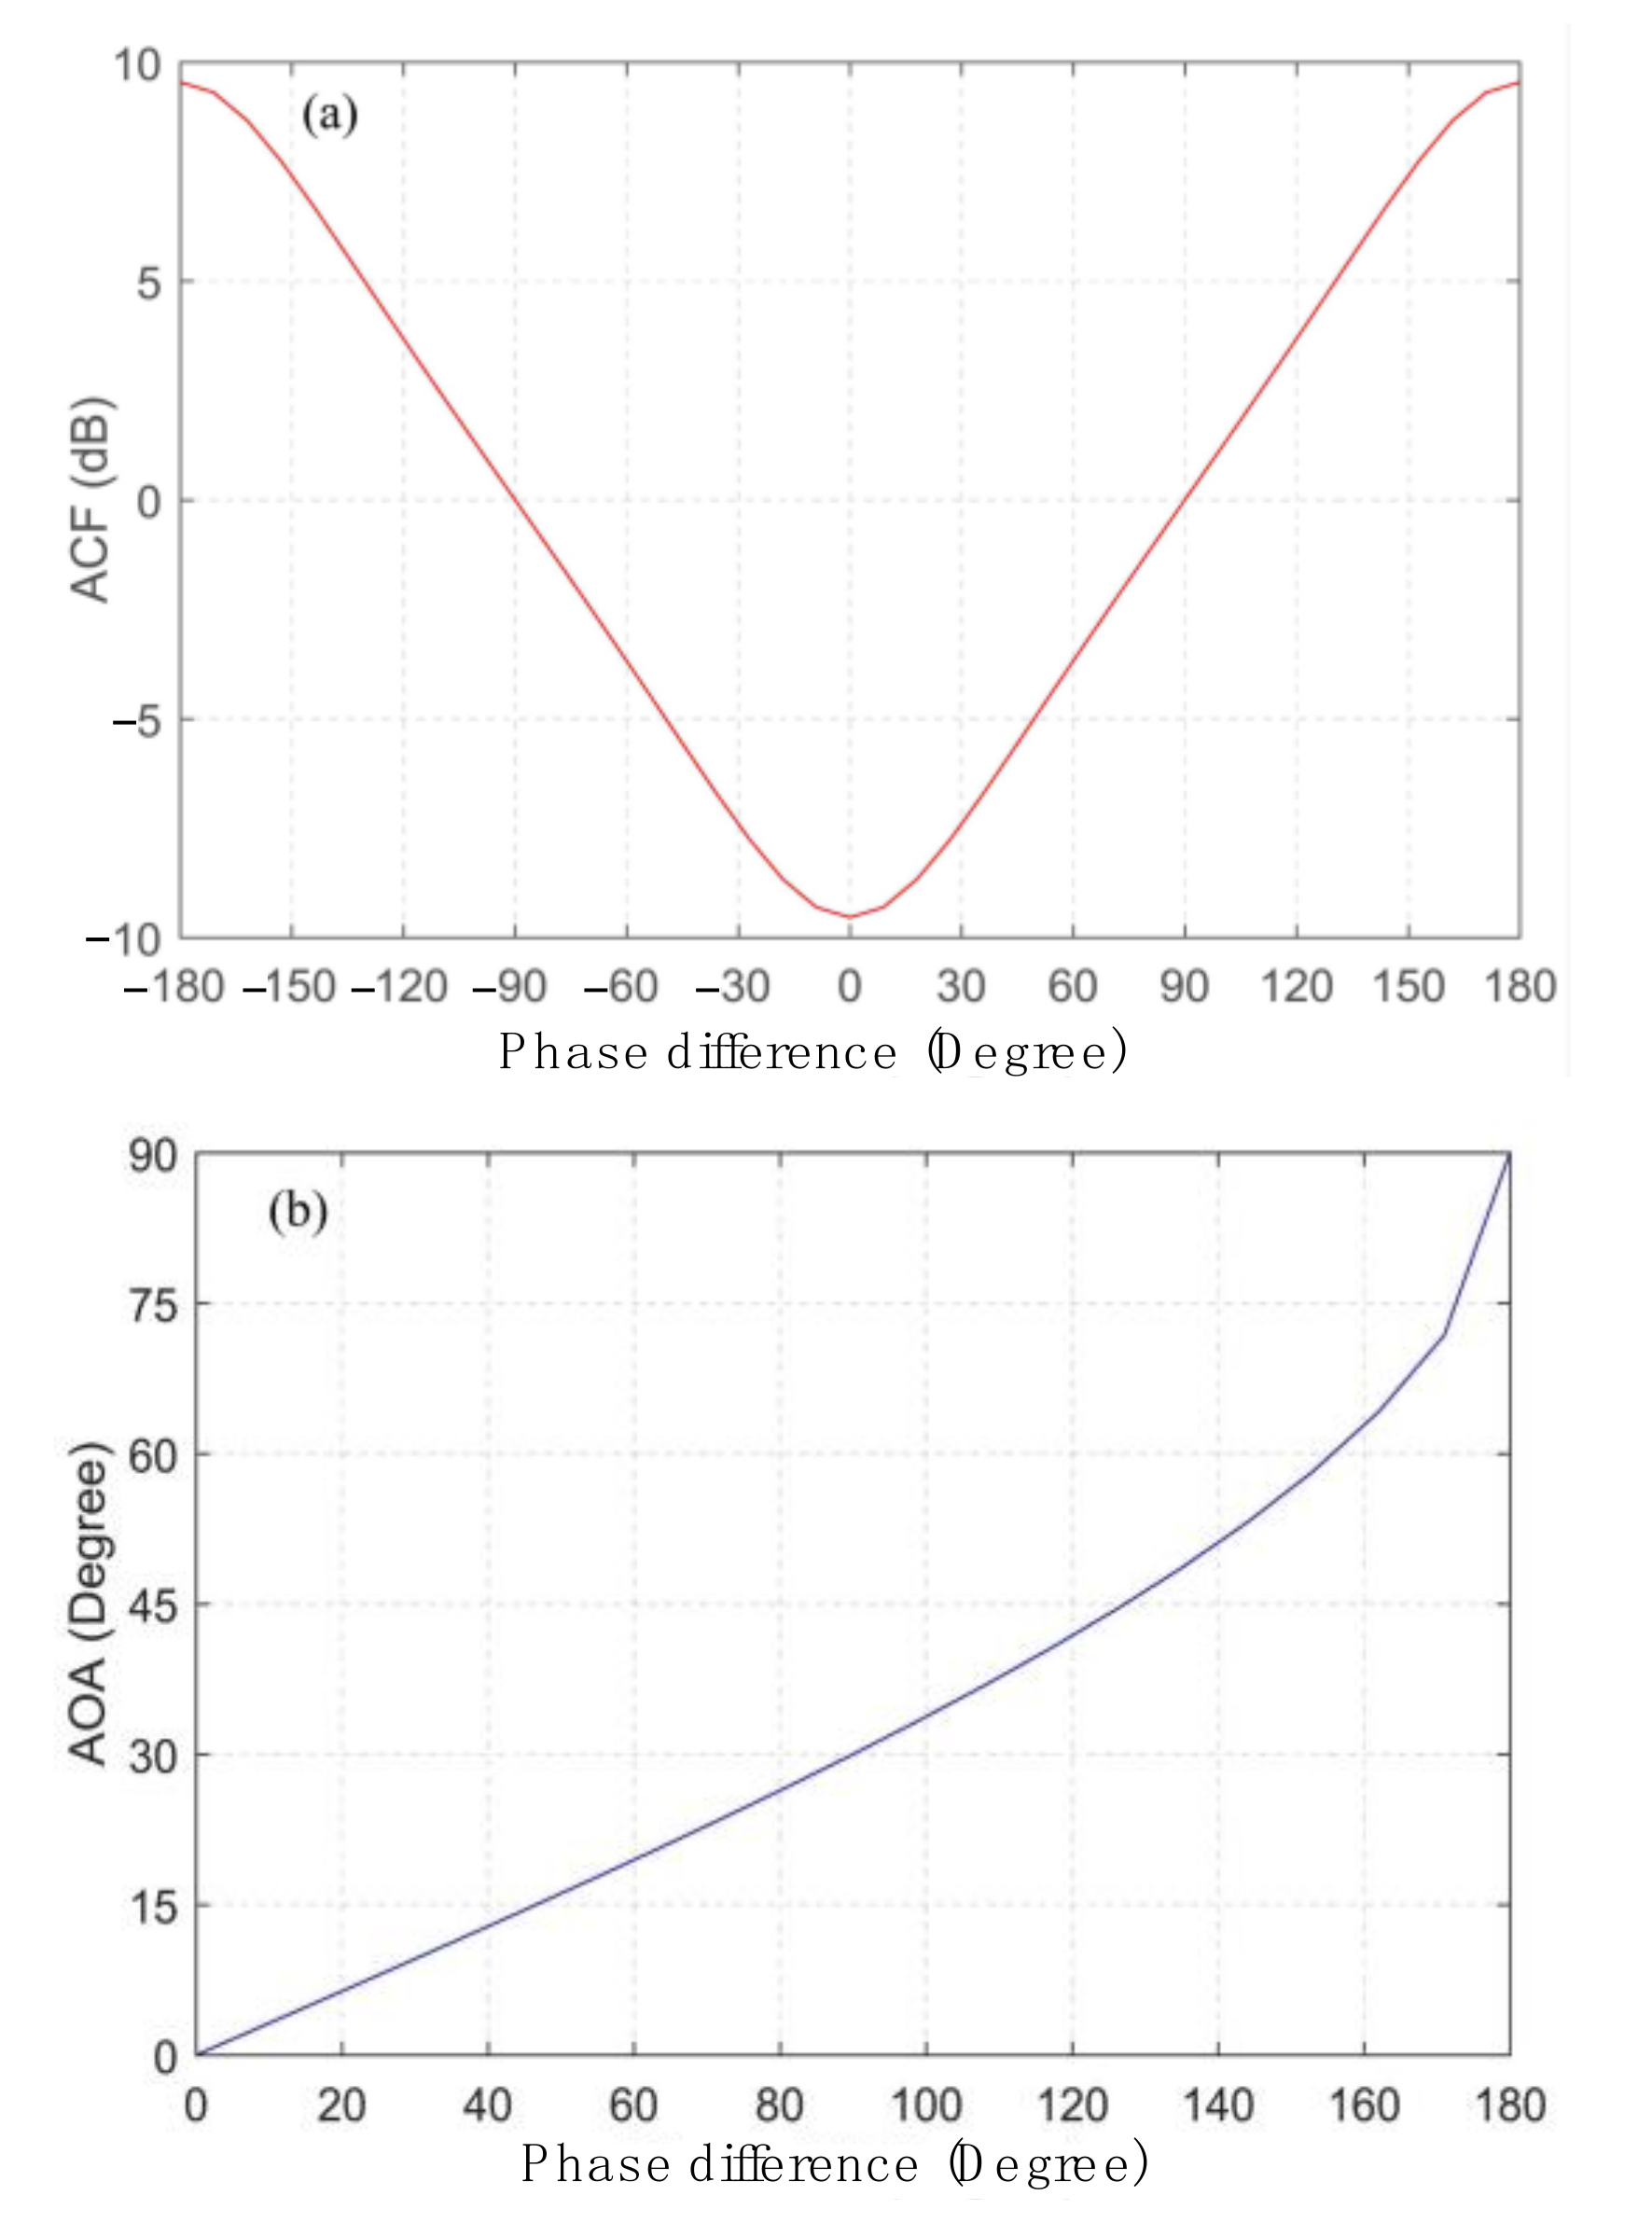
As expressed in Equation (13), a one-to-one mapping between the power ratio and the phase difference of echo signals is obtained, as shown in
Figure 3a. Furthermore, the incoming microwave signal phase difference is independent of the optical power and the input microwave power. It is obvious that when the power of the upper and lower branches is known, the phase difference can be calculated. Normally, the antenna separation is designed to be
d =
λ/2, where
λ is the incoming RF signal wavelength, to avoid the grating lobes in the radiation pattern [
26]. In this case, the AOA can be deduced from Equation (3) and the related numerical results are shown in
Figure 3b. From
Figure 3a, we can find that the phase shifts are symmetric between 0–180° and 0–(−180°) for ACF. Therefore, the system can realize the ambiguous phase measurement within the 180° phase range. The related AOA measurement range is from 0° to 90°.
3. Analysis and Simulation Results
To investigate its mechanism, simulations are performed via an OptiSystem 14.0. The setup can be found in
Figure 1. An optical carrier with a wavelength of 1552.5 nm and a linewidth of 1 MHz is generated from a CW laser. It is equally split and injected into the DPol-DDMZM after a polarization controller (PC1). To imitate the scene where the DFS effect exists between the transmitted signal (reference signal) and the echo signals (echo1 signal and echo2 signal), two electrical signals are generated by two RF sources. A phase shifter is added to the echo1 signal to control the phase difference between the two echo signals. The echo1 signal and the transmitted signal are fed to two ports of DDMZM2, respectively. The echo2 signal is equally split into two signals by a power splitter and fed to two ports of DDMZM1. Following the DPol-DDMZM, a polarization controller (PC2) is used to rotate the polarization multiplexed signal to align to the two principal axes of a PBS. Then, the optical signal is polarization de-multiplexed into two branches. The outputs of the PBS are connected with two low-speed PDs with the responsivity of 1 A/W.
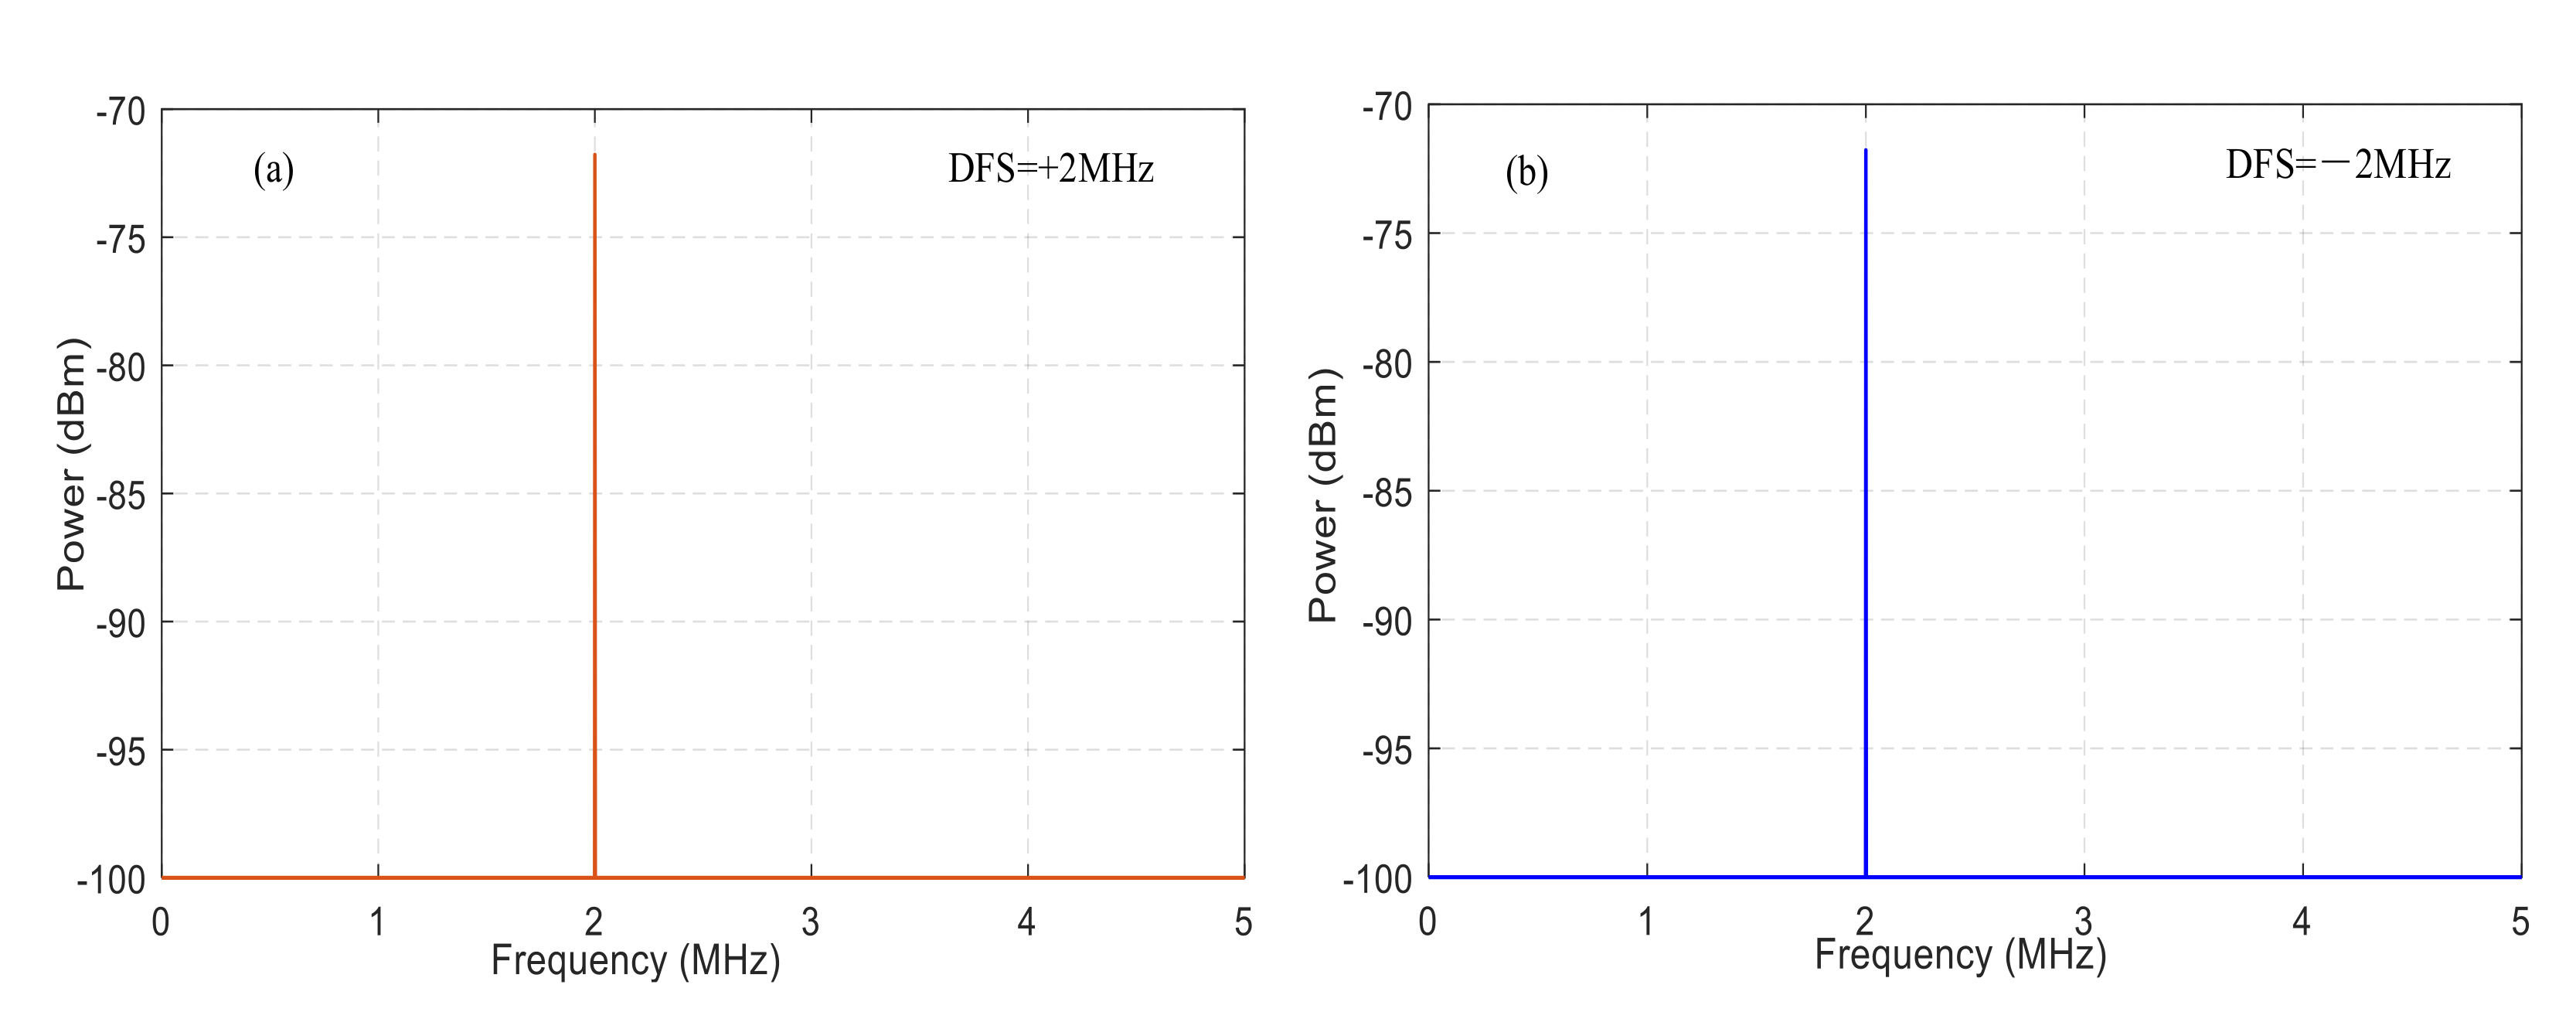
We set the transmitted signal frequency as 15 GHz with a power of 10 dBm. The echo microwave signal frequency is set to 15.002 GHz or 14.998 GHz with a power of 5 dBm. Therefore, a +2 MHz or −2 MHz of the DFS is generated, as shown in
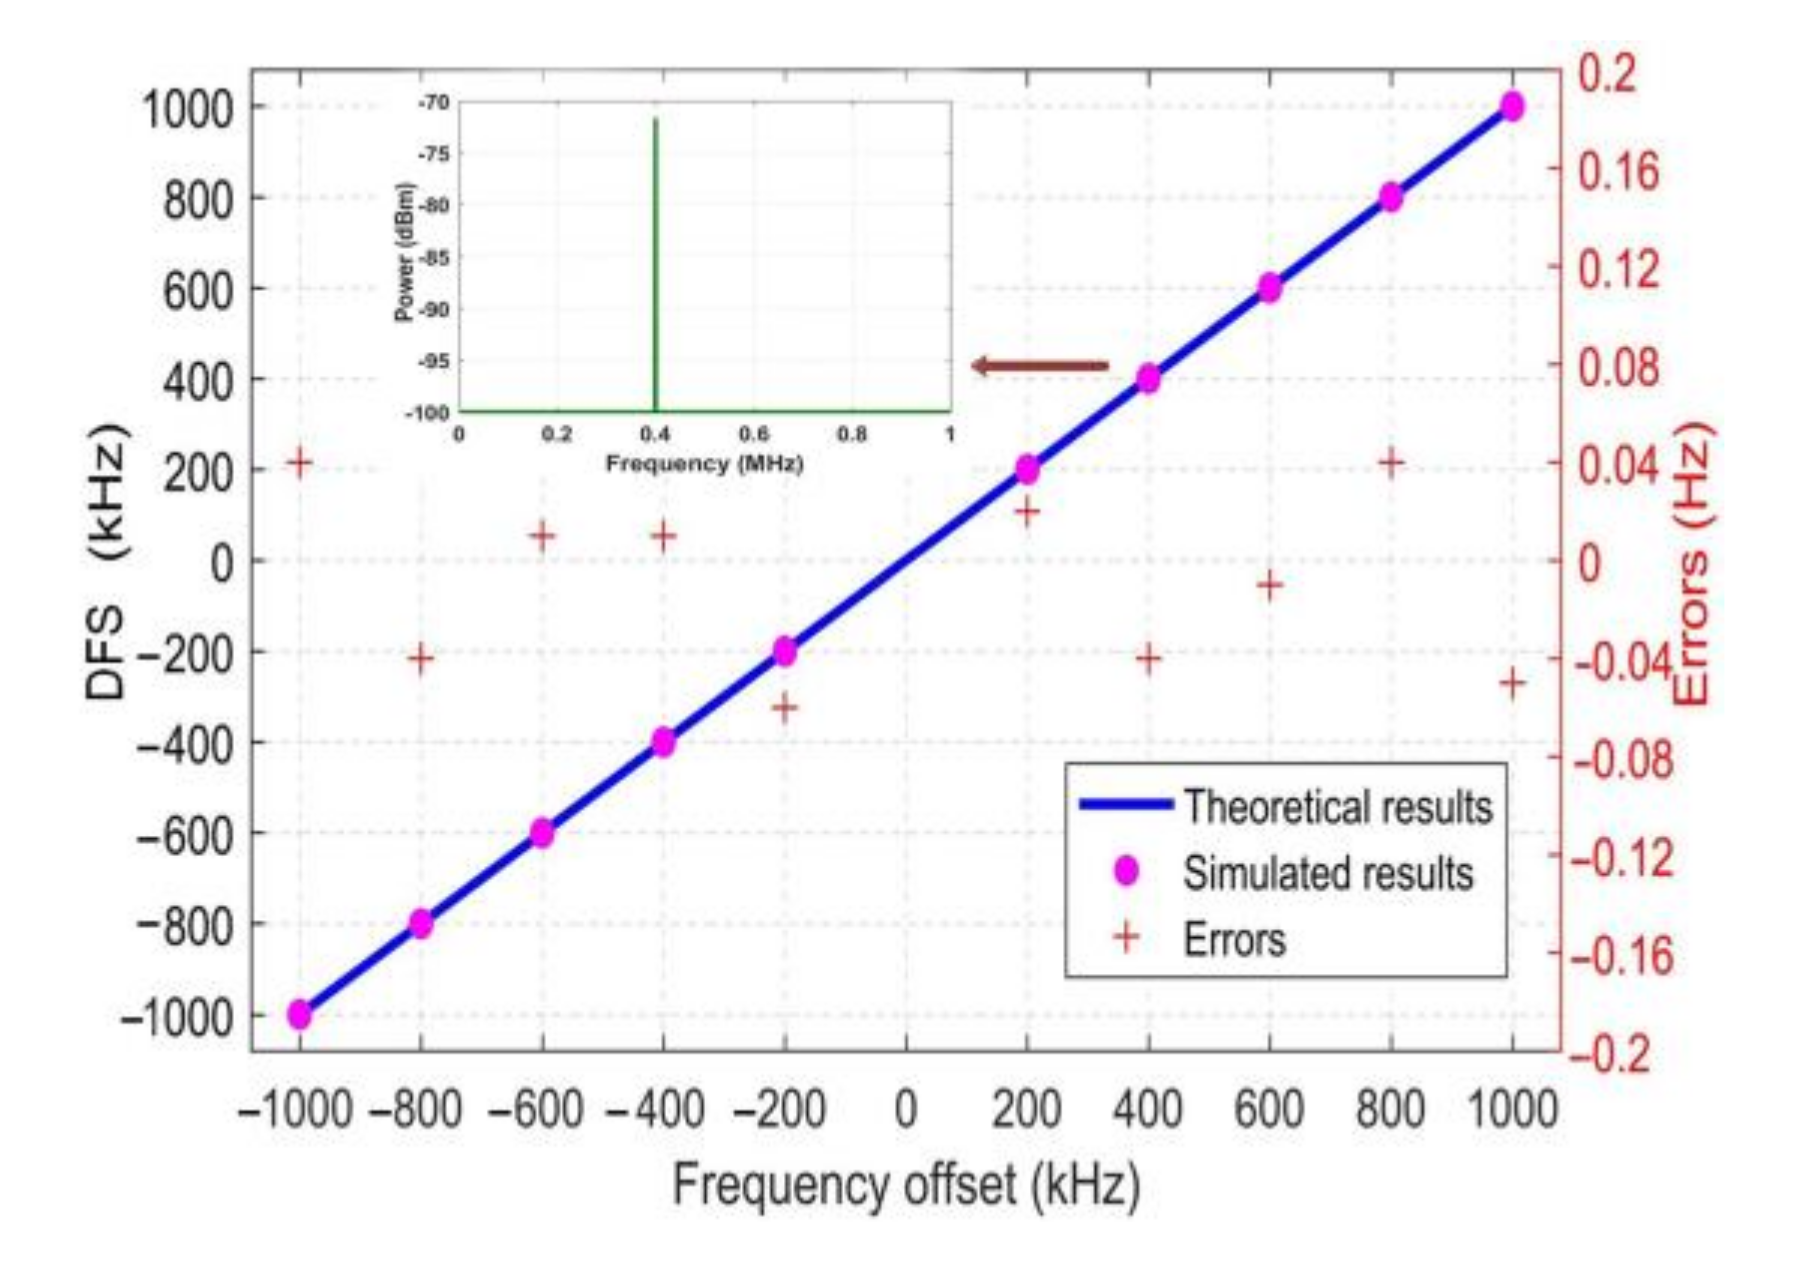
Figure 4a,b. It can be seen that the simulated DFS agrees well with the theoretical value. In order to check the accuracy of the simulation results of DFS, different DFSs are measured by tuning the frequency offset of the echo signal from −1 MHz to +1 MHz at intervals of 200 kHz, while the transmitted signal frequency is fixed at 15 GHz. The measured results are plotted in
Figure 5. It can be seen that the measured values agree well with the theoretical ones, and the maximum DFS measurement error is within 0.05 Hz as well. When the DFS is 400 kHz and the frequency of the echo signals is 15 GHz, the error of radial velocity is less than 5 × 10
−4 m/s according to Equation (4).
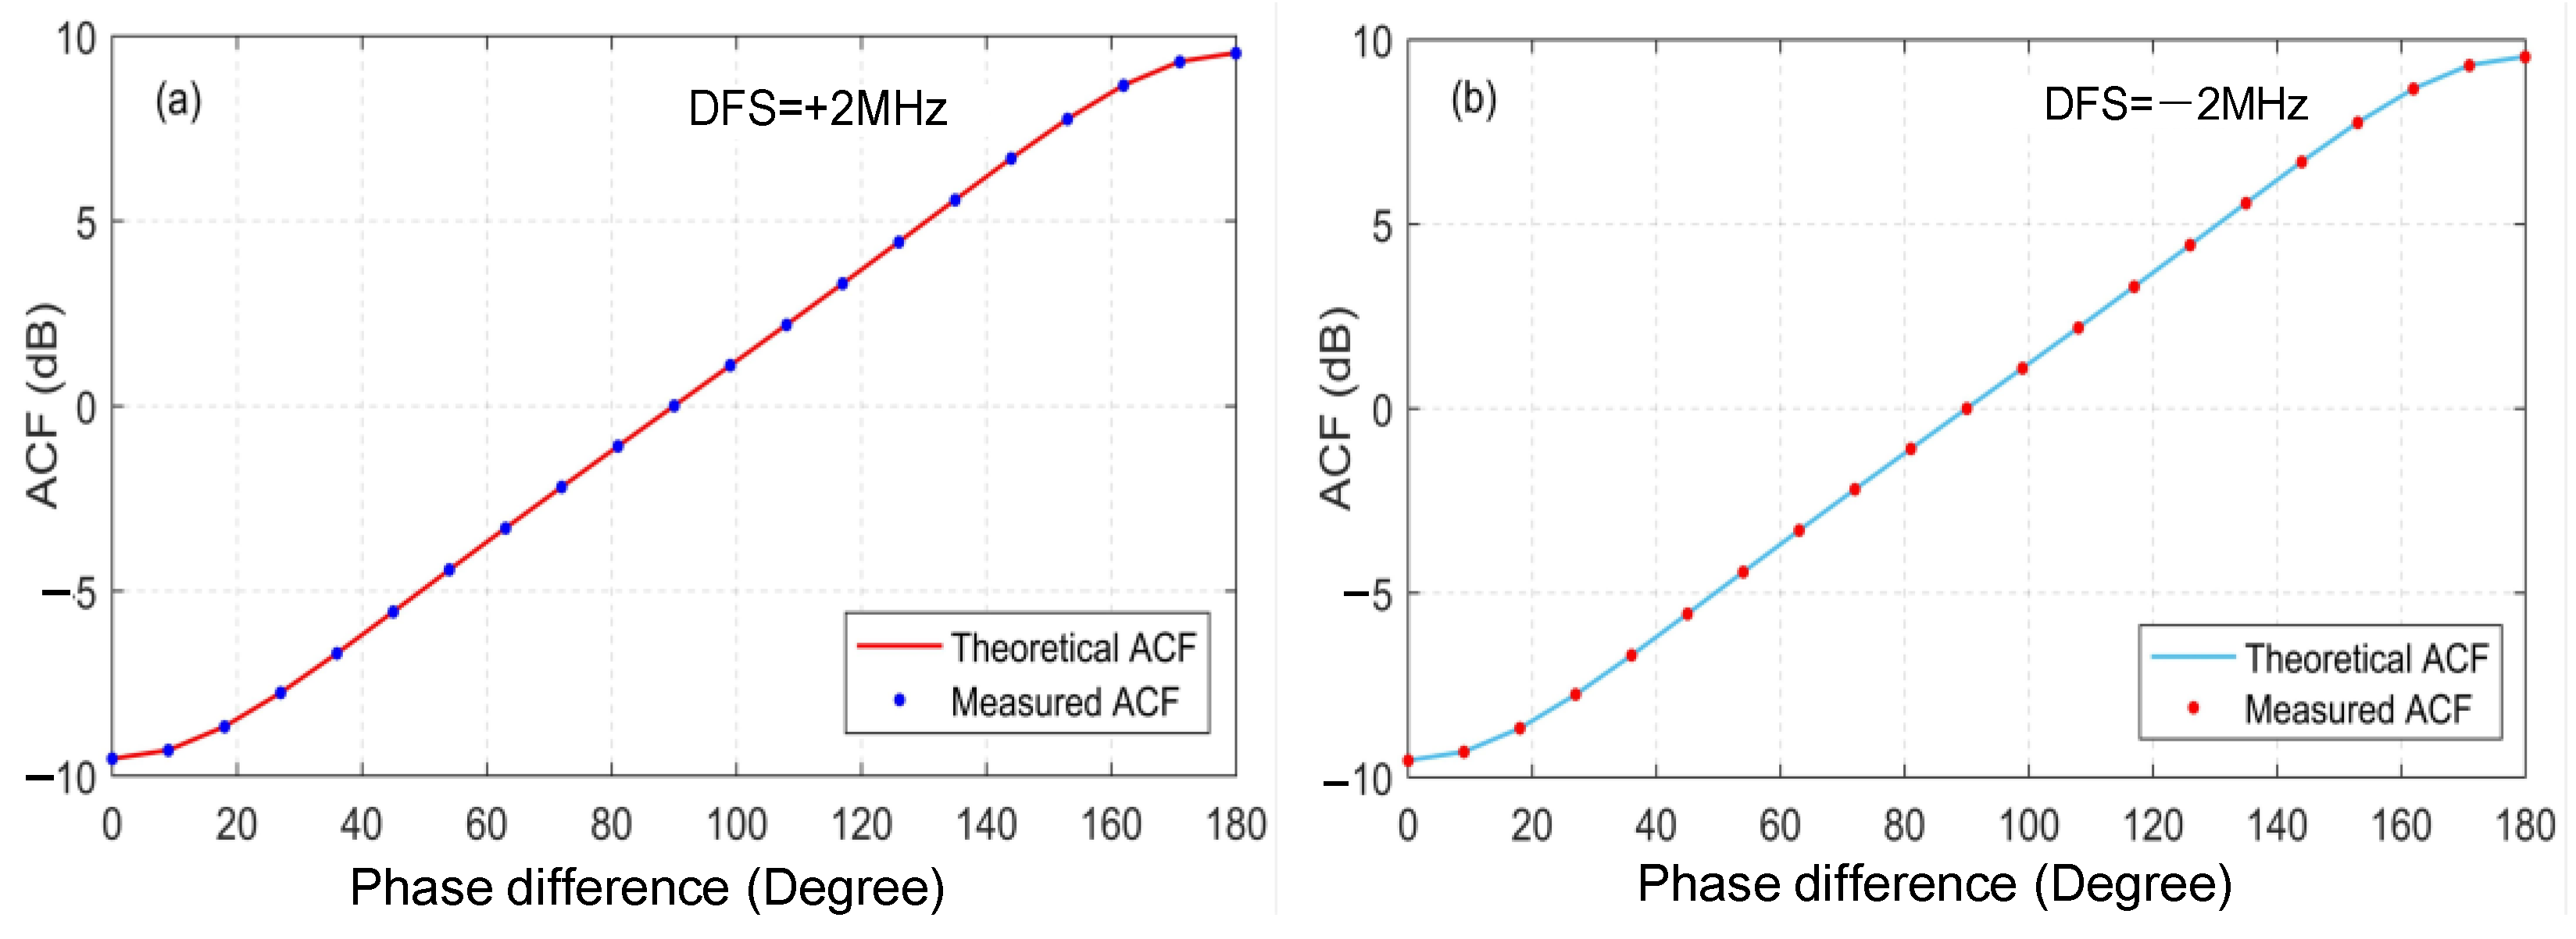
To validate the effectiveness of the AOA measurement, we can first achieve the phase difference and ACF mapping. Compared to the theoretical value according to Equation (13), it can be seen that the measured ACF agrees well with the theoretical value, as shown in
Figure 6a for +2 MHz and
Figure 6b for −2 MHz. Based on the measured value of ACF, the AOA can be deduced from Equation (3). As shown in
Figure 6c for +2 MHz and
Figure 6d for −2 MHz, the results denote a good AOA measurement ability that covers the range from 0° to 78°. The measurement errors of AOA are less than 2.8° in a range of 0° to 78° and the maximum error is less than 8° in a range of 79° to 90°. The reason for a large error around 90° is mainly due to the mathematical function relationship
= arcsin(φ/π) as
d =
λ/2, a small phase shift will bring a large change in AOA. In addition, comparing
Figure 6c,d, we find that DFS has no effect on the measurement of AOA in this system.
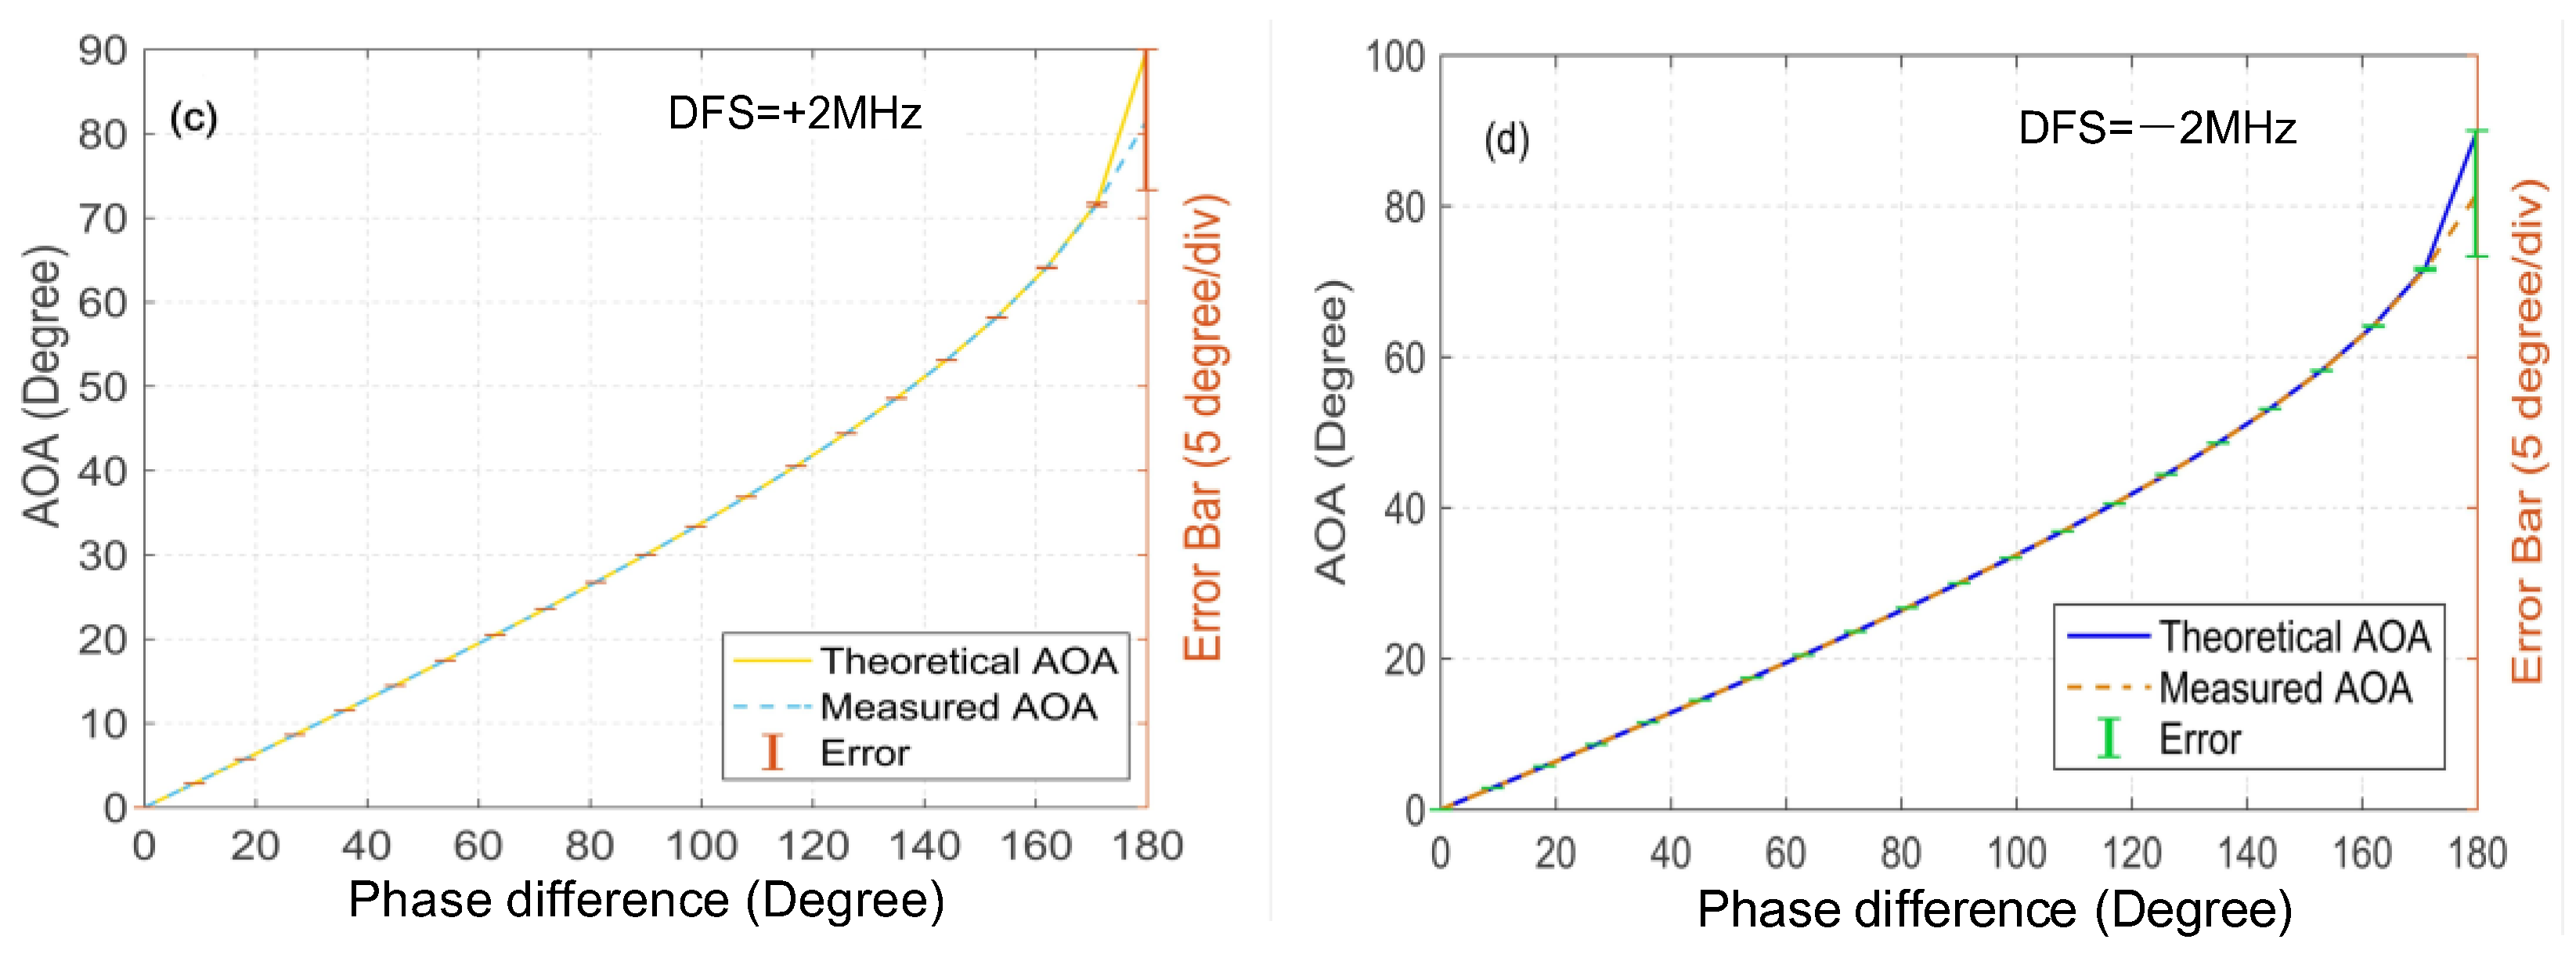
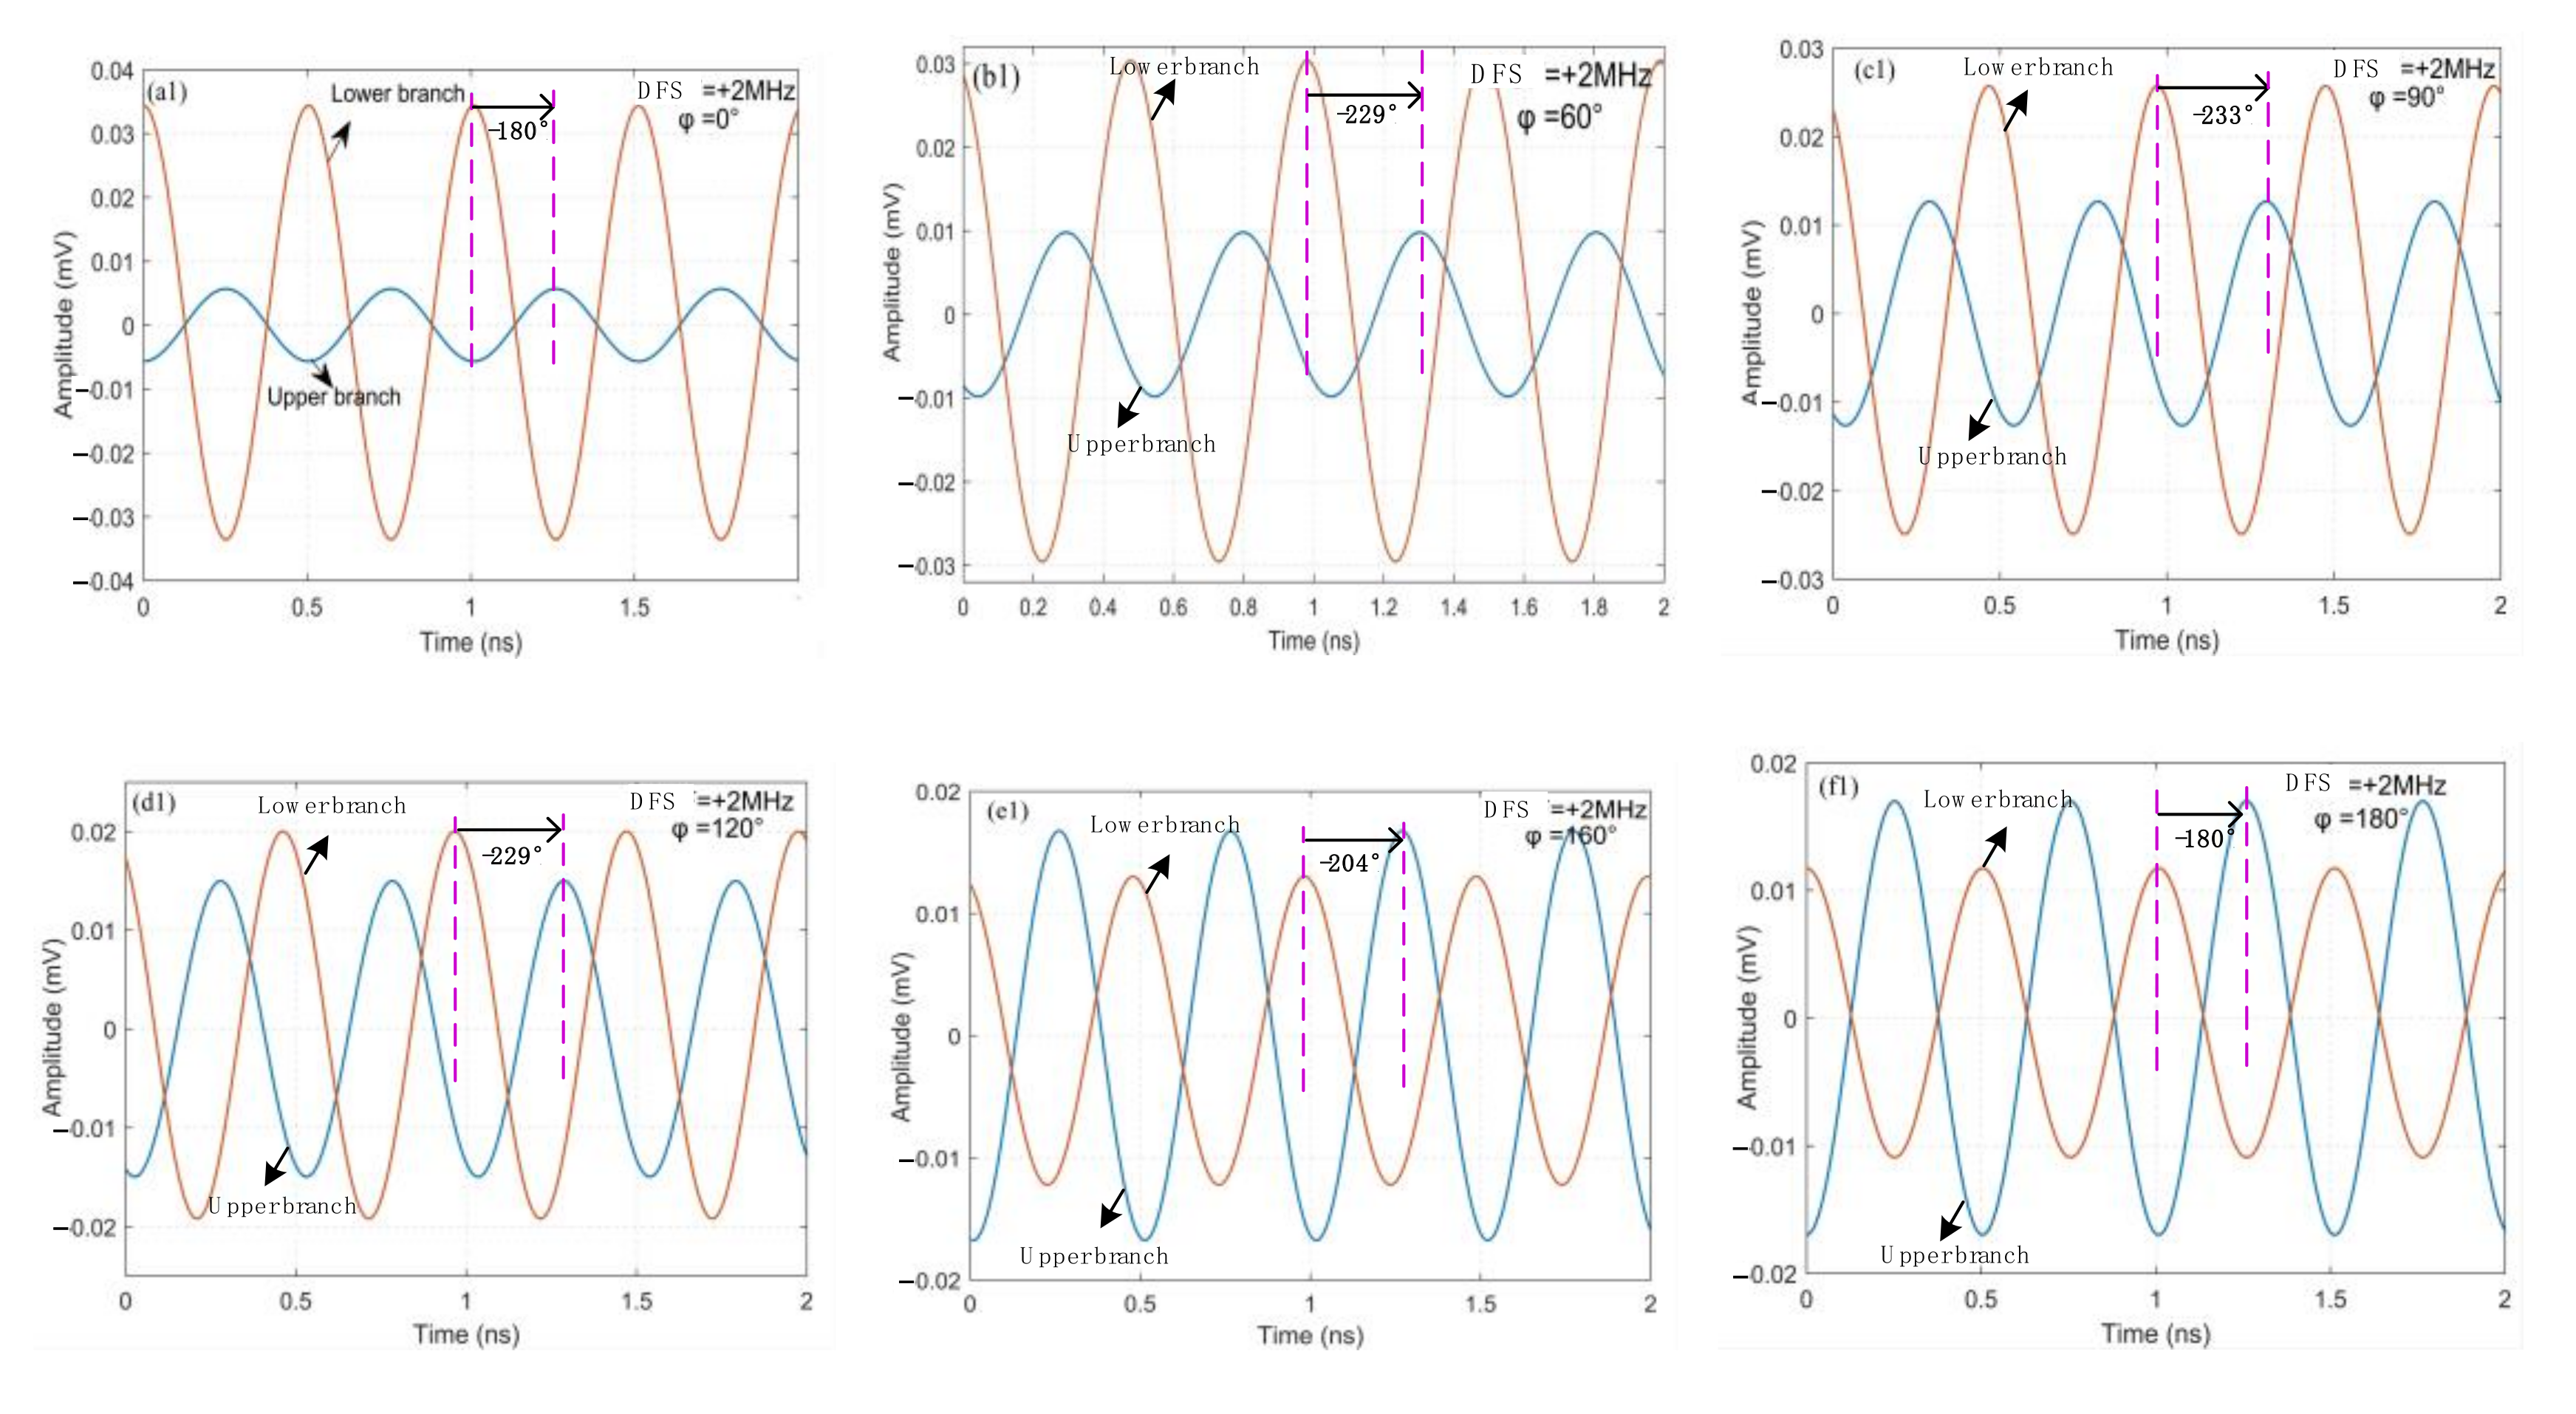
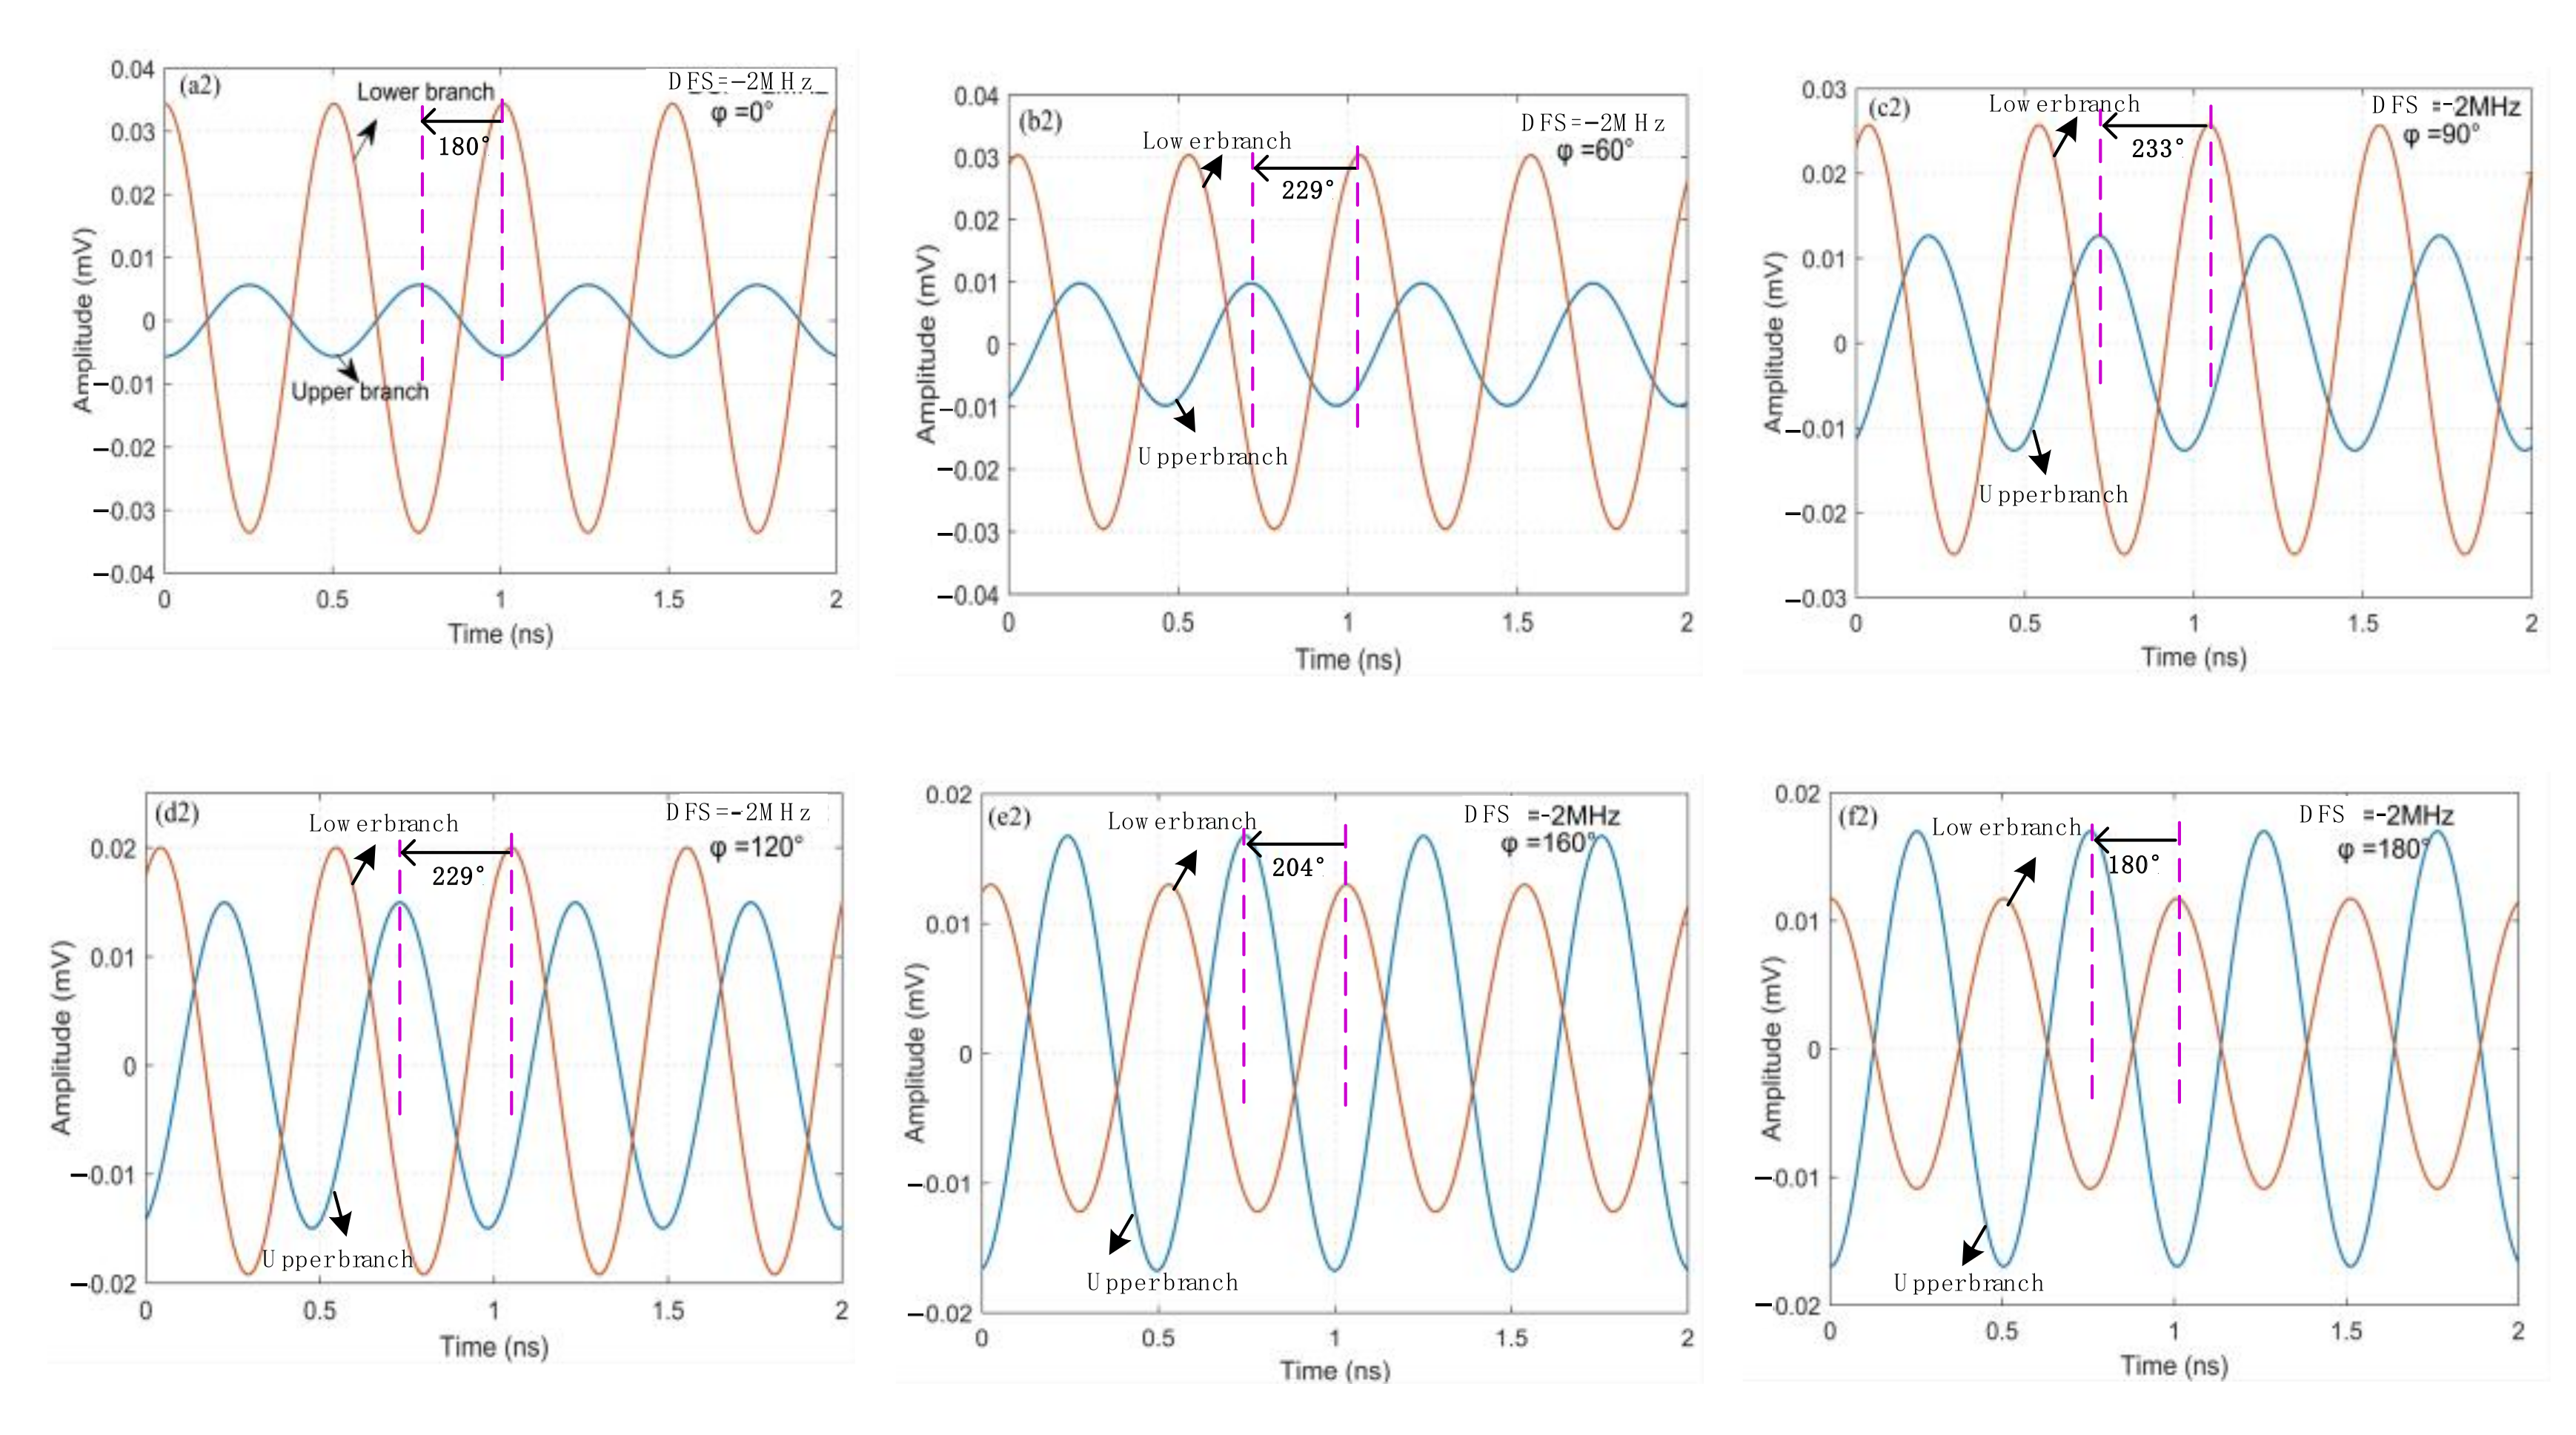
Subsequently, to clearly distinguish the direction of DFS, the signals of two channels are connected to a Dual Port RF Spectrum Analyzer to observe the phase relationship between the two signals as the phase difference in the range of 0° to 180°. Here, the phase difference between the echo signals of 0°, 60°, 90°, 120°, 160° and 180° are selected to observe the temporal waveforms when the DFS are +2 MHz and −2 MHz, as shown in
Figure 7(a1–f1) and
Figure 7(a2–f2), respectively. It is obvious that the phase relationship between
Iupper and
Ilower varies with the change of phase difference
φ. As can be seen from
Figure 7(a1–f1), when the DFS is set to be +2 MHz, the phase relationship between
Iupper and
Ilower is from −180° to −234°, and the waveform of the upper path is advanced with respect to that of the lower one, which indicates that the direction of the DFS is positive. In contrast, from
Figure 7(a2–f2) it can be found that the phase relationship between
Iupper and
Ilower is from 180° to 234°, and the phase in the upper branch is delayed with respect to that of the lower one when the DFS is set to be −2 MHz, which indicates that the direction of the DFS is negative. In addition, it can be found that the phase relation of the two channels is not blurred as the phase difference in the range of 0° to 180°, which means that the direction of DFS can be determined successfully and is not affected by the change of AOA.
Some instability factors that may cause measurement errors, including the DC drift, the lower extinction ratio of two DDMZMs and phase shift caused by splitter, are also considered and analyzed. Firstly, we assume that,
ɑ1,
ɑ2 are phase shifts introduced by the DC drift on DDMZM1 and DDMZM2,
ɑ3 is a phase shift introduced by the splitter that is used to split the echo2 signal into two signals,
a,
b and
c,
d represent the amplitude imbalance caused by suboptimal extinction ratio of DDMZM1 and DDMZM2, respectively. The optical field output from the DDMZM1 and DDMZM2 can be rewritten as
After two PDs, the photocurrents are as follows:
where,
,
,
. The power of the two electric signals can be given by
where,
. Equation (17) can be simplified as
where,
,
. As a result, the amplitude comparison function (ACF) can be given by
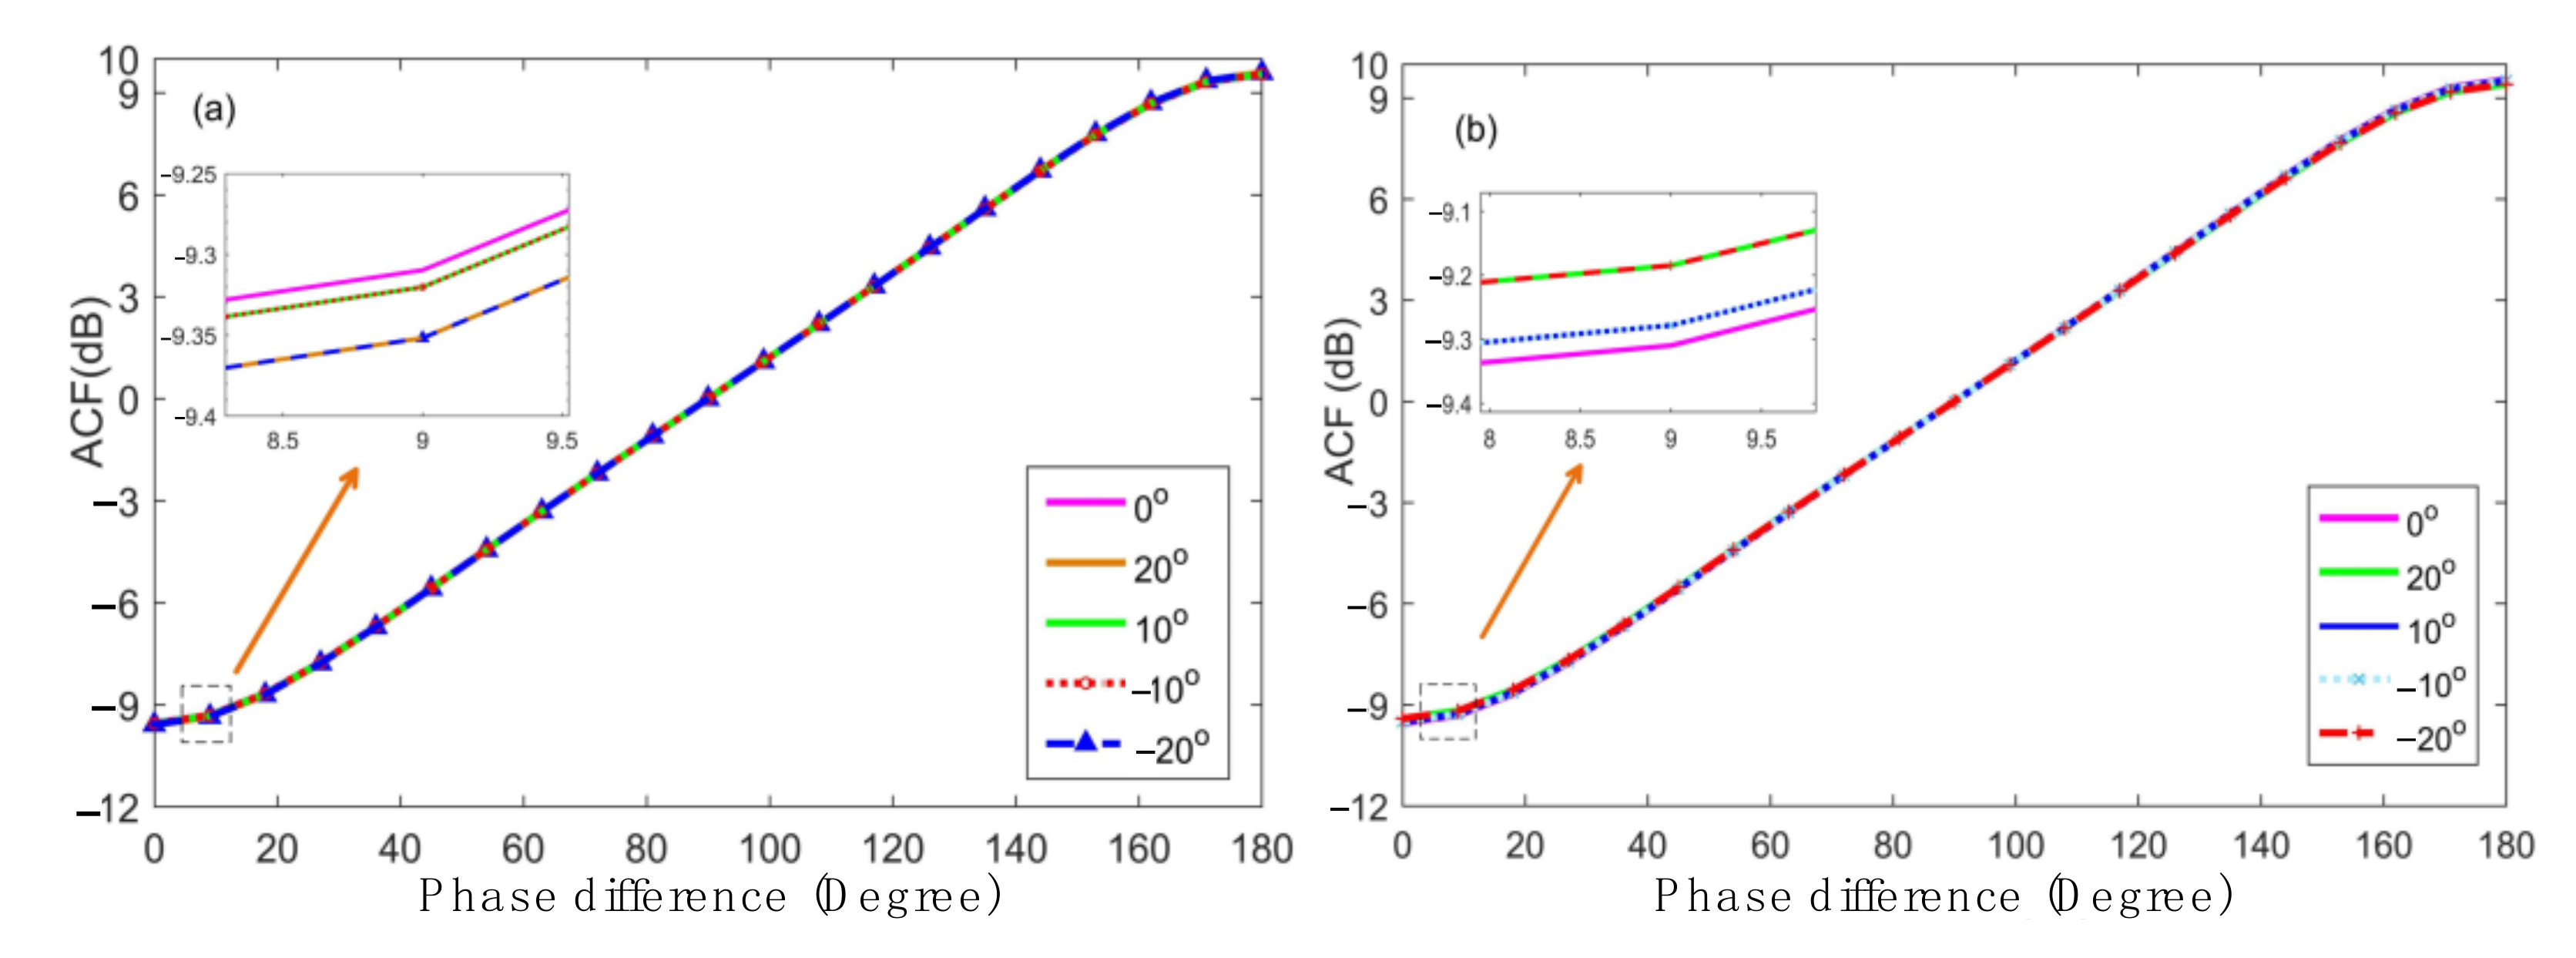
As can be seen from Equations (15) and (16), these factors affect the phase difference and the amplitude of the two photocurrent signals, which means that the DFS and AOA measurement accuracy will be affected. Luckily, using ACF can reduce the impact factors for AOA on measurement according to Equation (19). The curves between the power ratio and the phase difference under different conditions are shown in
Figure 8. Since
α1, α2 both have similar effects on ACF, here we only drew a curve of
α1. It can be seen from
Figure 8a that the phase shifts introduced by the DC drift on DDMZM affect the ACF curve, which means that it affects the value of phase difference. We also find that the ACF curve rotates around 90°, and the curve of
α1 deviation of 20° coincides with
α1 deviation of −20°, the same as 10° and −10°.
Figure 8b shows the influence of
α3 deviation of −20°, −10°, 0°, 10° and 20°, respectively. Conversely,
α3 causes the ACF curve to shift upward before 90° and downward after 90°. Compared with Ref. [
12] using three DC biases, the proposed scheme only needs to control two DC biases, so the errors caused by DC drifts can be effectively reduced and the system is more stable.
In the above analysis, the polarization angle drift of PC2 is maintained at 45°. In practice, the angle will be influenced by environmental perturbation in the real system. Therefore, the impact of imperfect polarization angle is also considered. Here, we take the polarization angle as
θ = 45° + ∆
θ, the photocurrents from the two PDs are as follows:
where, A = 2cos
θ − sin
θcos
φ,
B = sin
θsin
φ,
C = 2sin
θ + cos
θcos
φ,
D = cos
θsin
φ. The amplitude comparison function (ACF) can be derived as:
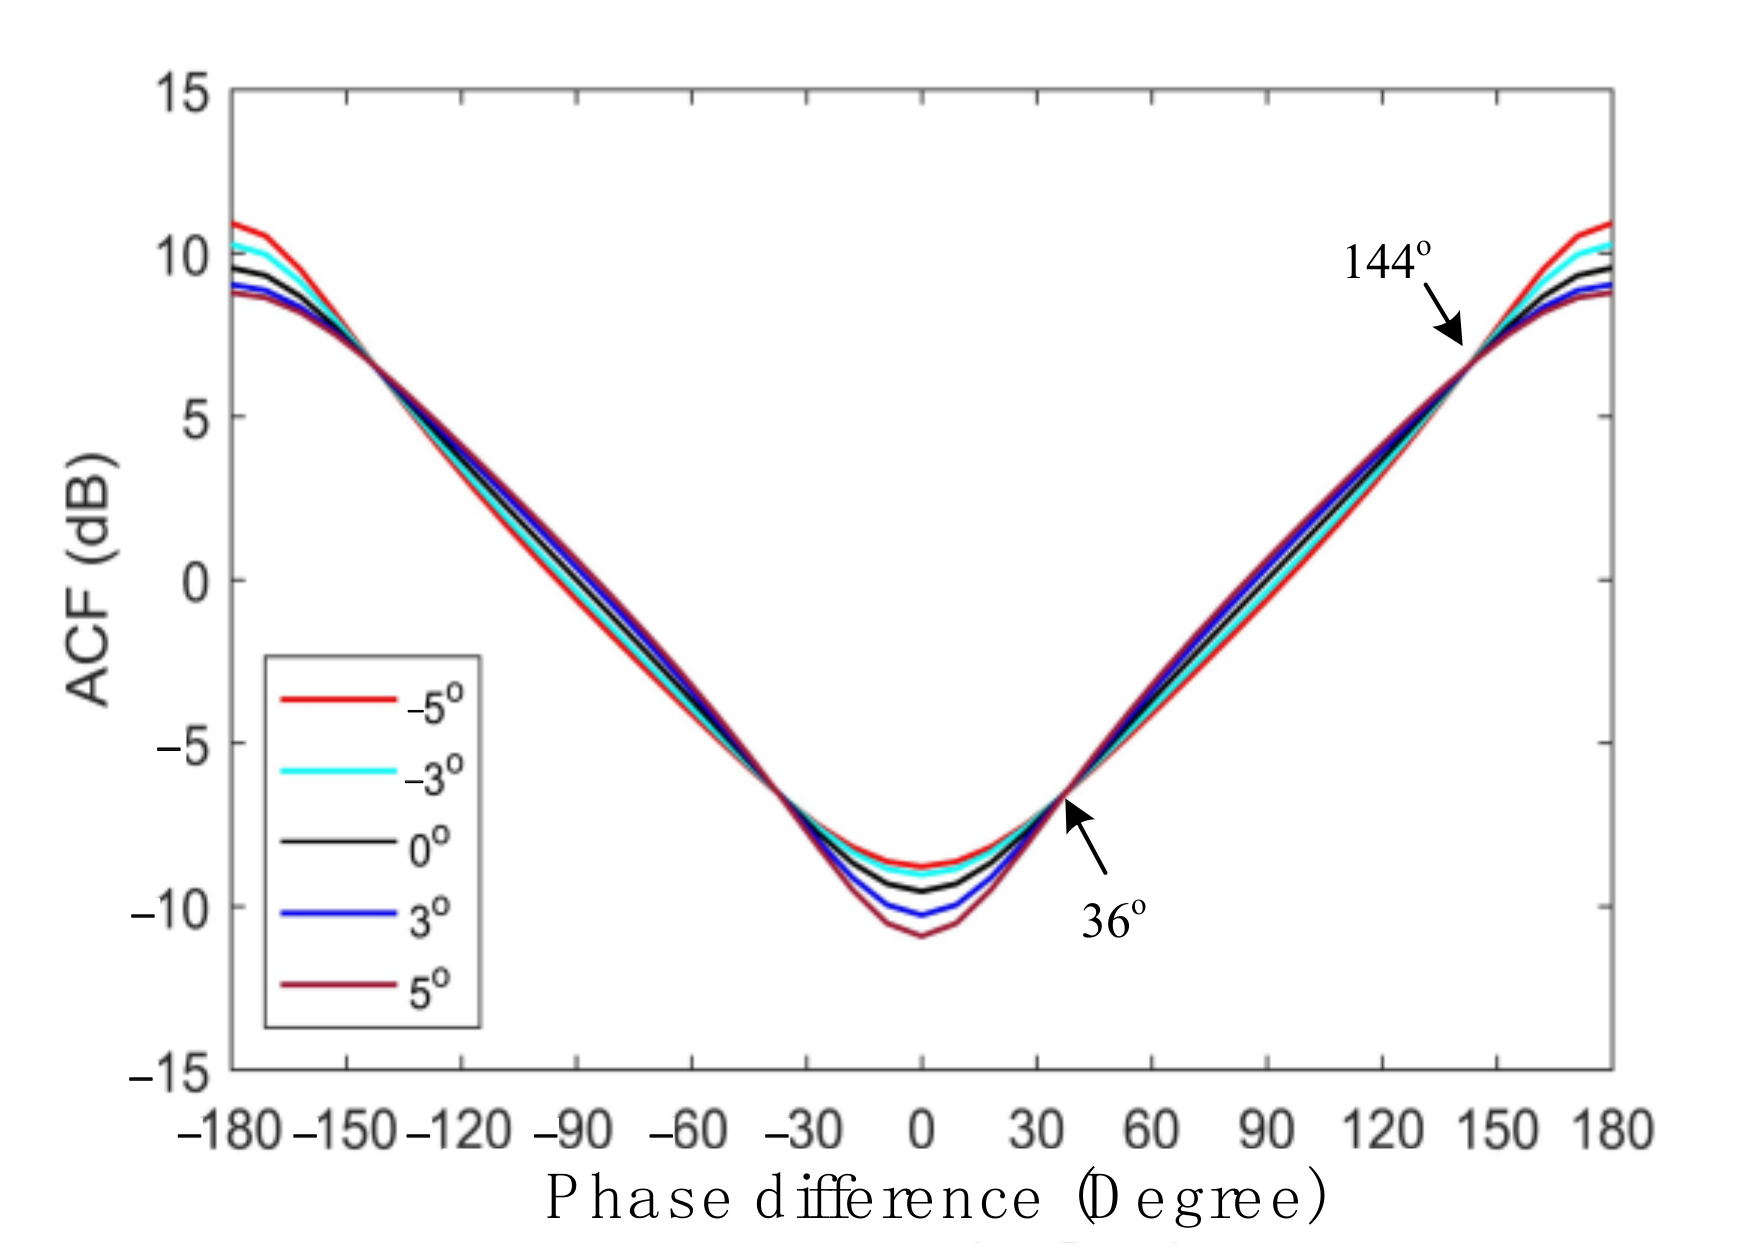
Figure 9 plots the impact of the polarization angle drift ∆
θ = 0°, ±3°, ±5°. It can be seen that the polarization angle drift can change the notch depth of the ACF curves, and curves intersect at the phase differences of 36° and 144°. It will influence the AOA measurement accuracy and the phase relationship between the upper branch and the lower branch for the DFS, but not the precise value of the DFS. In addition, although the phase relationship has changed between the upper branch and the lower branch, the direction of the DFS can still be accurately evaluated.
In order to improve the performance of the proposed scheme, integrated devices and a stable DC source can be used to reduce system instability. In addition, the polarization can also be stabilized by an electrical polarization controller or by using polarization-maintaining components.

 ,
, 


