Article

Improved Carrier-Envelope Phase Determination Method for Few-Cycle Laser Pulses Using High-Order Above-Threshold Ionization

1
State Key Laboratory of Magnetic Resonance and Atomic and Molecular Physics, Wuhan Institute of Physics and Mathematics, Innovation Academy for Precision Measurement Science and Technology, Chinese Academy of Sciences, Wuhan 430071, China
2
University of Chinese Academy of Sciences, Beijing 100049, China
3
Key Laboratory of High Energy Density Physics Simulation, Center for Applied Physics and Technology, Peking University, Beijing 100084, China
4
Institute of Applied Physics and Computational Mathematics, P.O. Box 8009, Beijing 100088, China
*
Author to whom correspondence should be addressed.
Photonics 2022, 9(8), 528; https://doi.org/10.3390/photonics9080528
Submission received: 10 July 2022 / Revised: 22 July 2022 / Accepted: 27 July 2022 / Published: 29 July 2022
(This article belongs to the Special Issue Novel Nonlinear Phenomena with Strong Laser Fields)

Abstract

:
Recent studies indicate that the stereo-ATI carrier-envelope phase meter (CEPM) is an effective method to determine the carrier-envelope phase (CEP) of each and every single few-cycle laser pulse. In this method, a two-dimensional parametric asymmetry plot (PAP), which can be obtained with the measured data in two short time-of-flight intervals, is applied to extract the CEP. Thus, part of the data containing useful CEP information is discarded in the PAP method. In this work, an improved method was developed to effectively exploit most of the experimental data. By this method, we achieve a CEP precision of 57 mrad over the entire 2 π range for 5.0 fs laser pulses.

1. Introduction

The technological advances in ultrafast lasers have permitted researchers to study the ionization dynamics of matter with laser pulses comprising only a few oscillation optical cycles (see, e.g., [1,2,3,4,5,6,7,8]). The electric field of a few-cycle laser pulse can be described by E ( τ ) = f ( τ ) E 0 cos ( ω τ + ϕ ) , where f ( τ ) is the envelope, E 0 is the electric field amplitude, ω is the carrier angular frequency, and ϕ is the carrier-envelope phase (CEP). If the pulse duration is close to an optical cycle, the electric field strength can be altered conspicuously by a controlled CEP. Indeed, the CEP effect has been shown to play a prominent role in controlling generation of attosecond pulses [2,9], ionization of atoms [6,10,11,12], ionization and dissociation of molecules [3,13] and clusters [14], strong-field interaction with nano-tips [15], and other nano-scale systems [16].
Methods for measuring the CEP of a few-cycle laser pulse have been well developed based on a series of techniques, such as f 2 f interferometry [17,18], frequency resolved optical grating employing photoionization [19], dispersive Fourier transform [20], angle-resolved photoelectron spectra of noble gas atoms in circularly polarized few-cycle pulses [21], etc. Recently, with the technique of f 2 f interferometry, an excellent CEP stability with a jitter of only 82 mrad (root-mean-square) [18] was achieved. Based on this achievement, recent work [22] on above-threshold ionization (ATI) of atomic cesium shows that the directional asymmetry in the energy spectra of backscattered electrons oscillates three times, rather than once, due to interference between quantum orbits as the CEP is changed from 0 to 2 π . In addition to the aforementioned work, since 2009, much attention has been paid to a CEP determination method by stereographic detection of the high-order ATI spectra of noble gas atoms [23], which is also dubbed stereo-ATI CEP meter (CEPM) [24]. The CEPM can be applied to perform real-time, every-single-shot CEP measurement with high precision [23,24] for a laser system with a high repetition rate, up to 100 kHz [25], and a high power, up to multi-terawatt [26]. If the measured CEP can be recorded in a computer along with the experimental data for each laser pulse, the CEP dependent experimental data can be extracted by the offline analysis. This technique is dubbed phase tagging [23,24], which has been applied to study the CEP effects for nonsequential [5,27] and sequential [28] double ionization and ionization and dissociation of H2 [29,30], and to develop the techniques of attosecond streaking [31] and refractive index dispersion measurement [32], etc.
Due to the strong CEP dependence of the involved high-order nonlinear processes, high precision of CEPM measurement can be achieved. The physical principle of CEPM relies on the radical CEP dependent left–right asymmetries of angle-resolved high-order ATI yields [33,34,35], and the CEP dependence of this asymmetry can be stronger by an order of magnitude than that of direct ATI [23]. In 2011, a precision of 113 mrad over the entire 2 π range was reported [24] for a typical CEPM. Moreover, it was documented that a better precision could be achieved for a shorter pulse duration [36]. In contrast, for a long acquisition time, drift of laser power (or intensity) will affect the precision of CEPM [37], which could be remedied by periodic recalibration. Recent progress indicates that a technique of intensity tagging [38,39] can be applied to reduce the influence of intensity fluctuations and increase the sensitivity of phase tagging. Up until now, as far as we know, the best precision of CEPM is 82 mrad for 3.5 fs laser pulses [25].
In this work, we propose a method for precisely determining the CEP of each and every single few-cycle laser pulse. Our method relies on a measurement of the left–right asymmetry of photoelectron kinetic energy/time-of-flight (TOF) distribution. To extract the CEP, our numerical procedure can exploit most of the TOF distribution, rather than only two asymmetric parameters that can be obtained by the data in two short TOF intervals. Technically, we have made several improvements of our homemade phase meter to optimize the signal-to-noise ratio (SNR), the intensity, and phase distribution in the vicinity of the focus. Moreover, the intensity tagging technique has also been applied to increase the CEP precision. According to the analysis, we have achieved a CEP precision of 57 mrad over the entire 2 π range for 5.0 fs laser pulses.
This paper is organized as follows. Our experimental setup is described in the following section. The methods of data processing and numerical solution of the time-dependent Schrödinger equation (TDSE) are briefly described in Section 3 and Section 4. In Section 5, the experimental and theoretical results are discussed. Finally, our conclusion is given in Section 6. Atomic units are used throughout unless otherwise indicated.

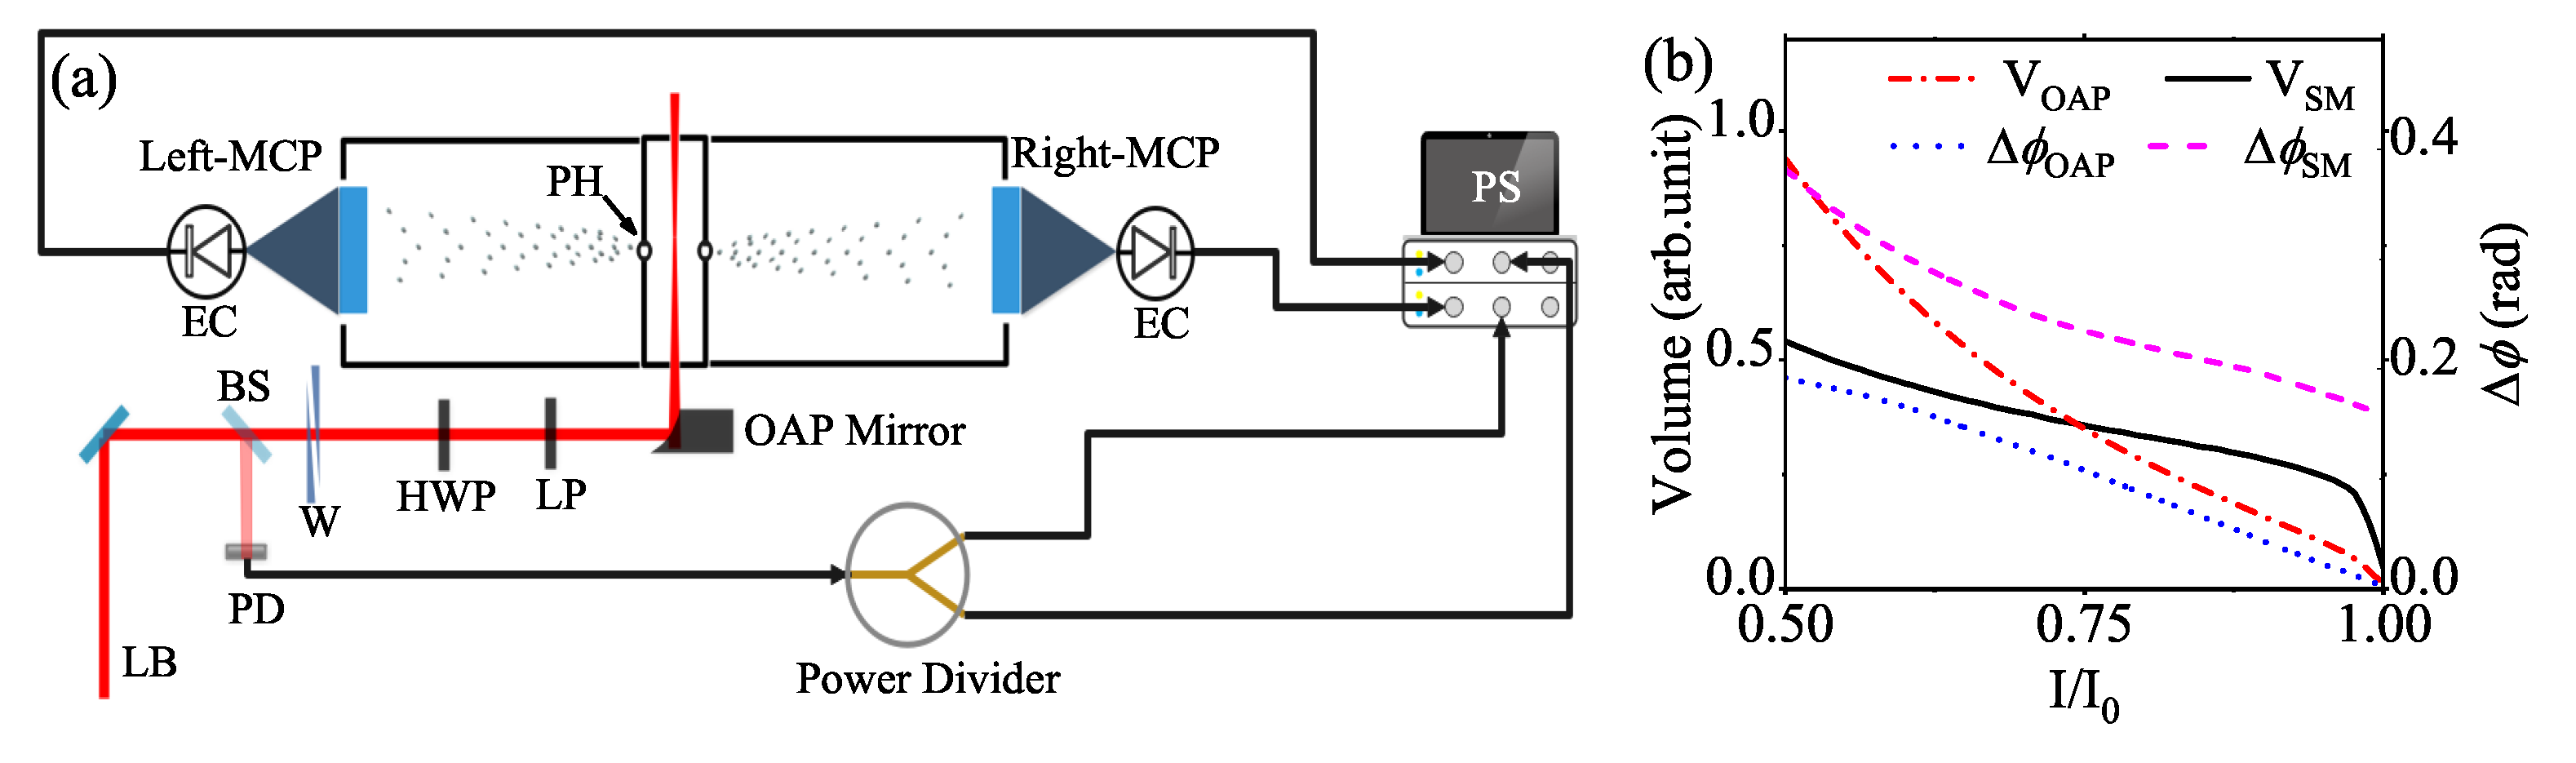
2. Experimental Setup

We have made several improvements of our homemade stereo-ATI photoelectron spectrometer, which has already been described in an earlier paper [40] and is schematically illustrated in Figure 1a. A commercial Ti:sapphire femtosecond laser system (FEMTOPOWER compact PRO CE-Phase HP/HR) can generate laser pulses with a duration of approximately 30 fs and a center wavelength of 800 nm. The laser beam is focused into a 1.1 m long, 300-micron diameter hollow-core fiber filled with 2.5 bar Ne. Spectral distribution of the beam is broadened in the hollow-core fiber. Subsequently, the laser pulses are compressed by a set of chirped mirrors and a pair of fused silica wedges. The pulse duration of the achieved few-cycle laser pulses is 5.0 fs, which is reformulated by an auto-correlator (FEMTOMETERTM), and the central wavelength of the few-cycle laser pulse is 780 nm. With a beam splitter, a small portion of the few-cycle laser beam is directed to and detected by a fast silicon photo-diode (PD) to perform the intensity tagging, which has reduced the single pulse energy uncertainty from 0.8% to approximately 0.2%, and, at the same time, to trigger a PXI system equipped with a pair of fast digitizers.
The main portion of the few-cycle laser beam is focused into the sample chamber filled with Xe by an off-axis parabolic (OAP) mirror with an effective focal length of 6 inches (152.4 mm). We replace the spherical mirror (SM), which is employed by a standard CEPM [23] and our earlier work [40], by an OAP mirror because, in a typical experimental configuration of a CEPM (see, e.g., the design of light path in [40,41]), it is impossible for the laser beam to be aligned perfectly perpendicular to the SM. Moreover, the deviation could be significant and cannot be conveniently determined. However, the OAP mirror employed here can provide an intensity distribution closer to a standard Gaussian distribution. Note that, in contrast to the well-understood intensity distribution, as documented, the spatially dependent CEP distribution of focused few-cycle pulses is very complex [42,43,44,45]. In Figure 1b, based on numerical calculations, we present the intensity dependence of the CEP range ( Δ ϕ ) and volume (V) of each iso-intensity shell in the vicinity of the focus of few-cycle laser pulses in the cases of an OAP mirror and an SM (incidence angle of 4 . 5 ) in a typical experimental configuration of CEPM, respectively. It can be found that, if an SM was applied, the volume of each iso-intensity shell would be larger for the intensities around the peak, which is relevant to comprehend our experimental results below. In contrast, in the case of an OAP mirror, the CEP range of each iso-intensity shell is significantly smaller in the whole intensity range explored. This would be helpful to optimize the CEP precision of our CEPM.
Instead of a pair of thin vertical slits, which are usually employed in a standard CEPM [23], two pinholes with a diameter of 0.7 mm, which are smaller than those used in [40], are employed for the photoelectrons to leave the sample chamber and fly towards the two micro-channel plate (MCP) detectors on both sides of the photoelectron spectrometer (left-MCP and right-MCP). The smaller pinholes can support a higher sample pressure (2.0 Pa) in the interaction region, and, in turn, improve the SNR. The low-energy electrons with kinetic energy of Ek < 42 eV are discriminated by an electrostatic repeller installed before each MCP detector. The laser intensity is determined by a comparison between the measured CEP-averaged photoelectron kinetic energy spectra (PES) and TDSE calculations with focal averaging effect included.

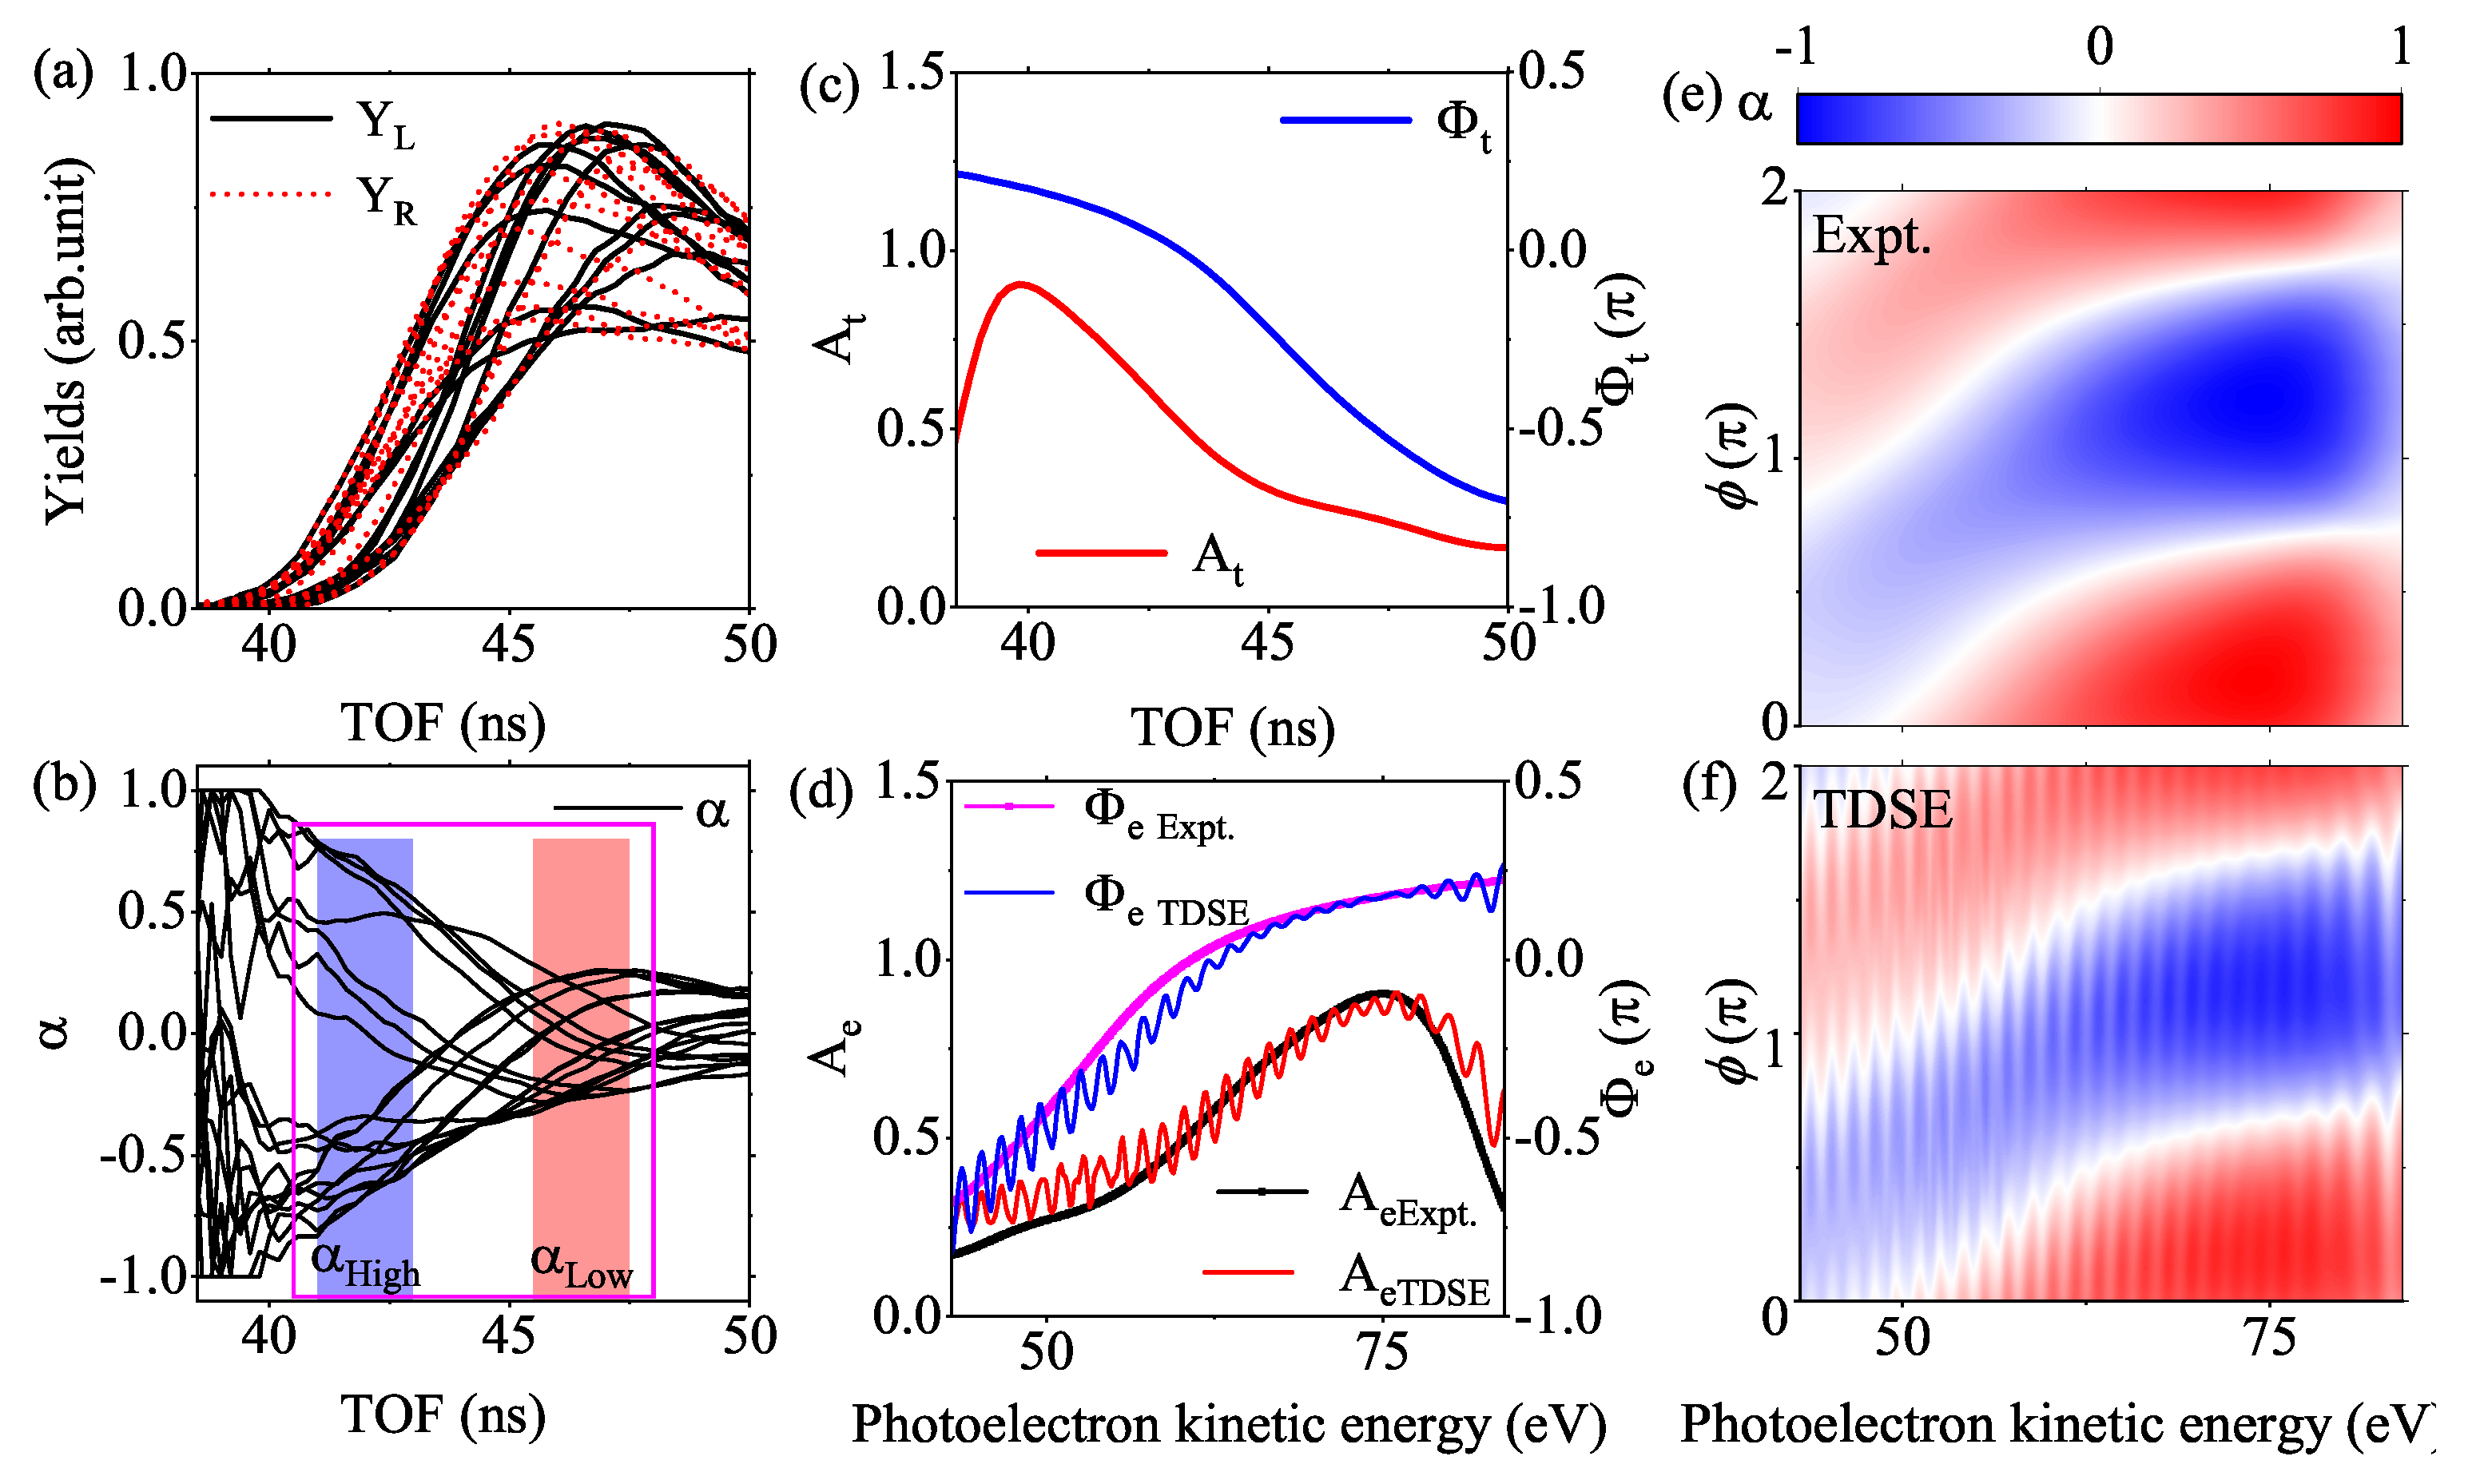
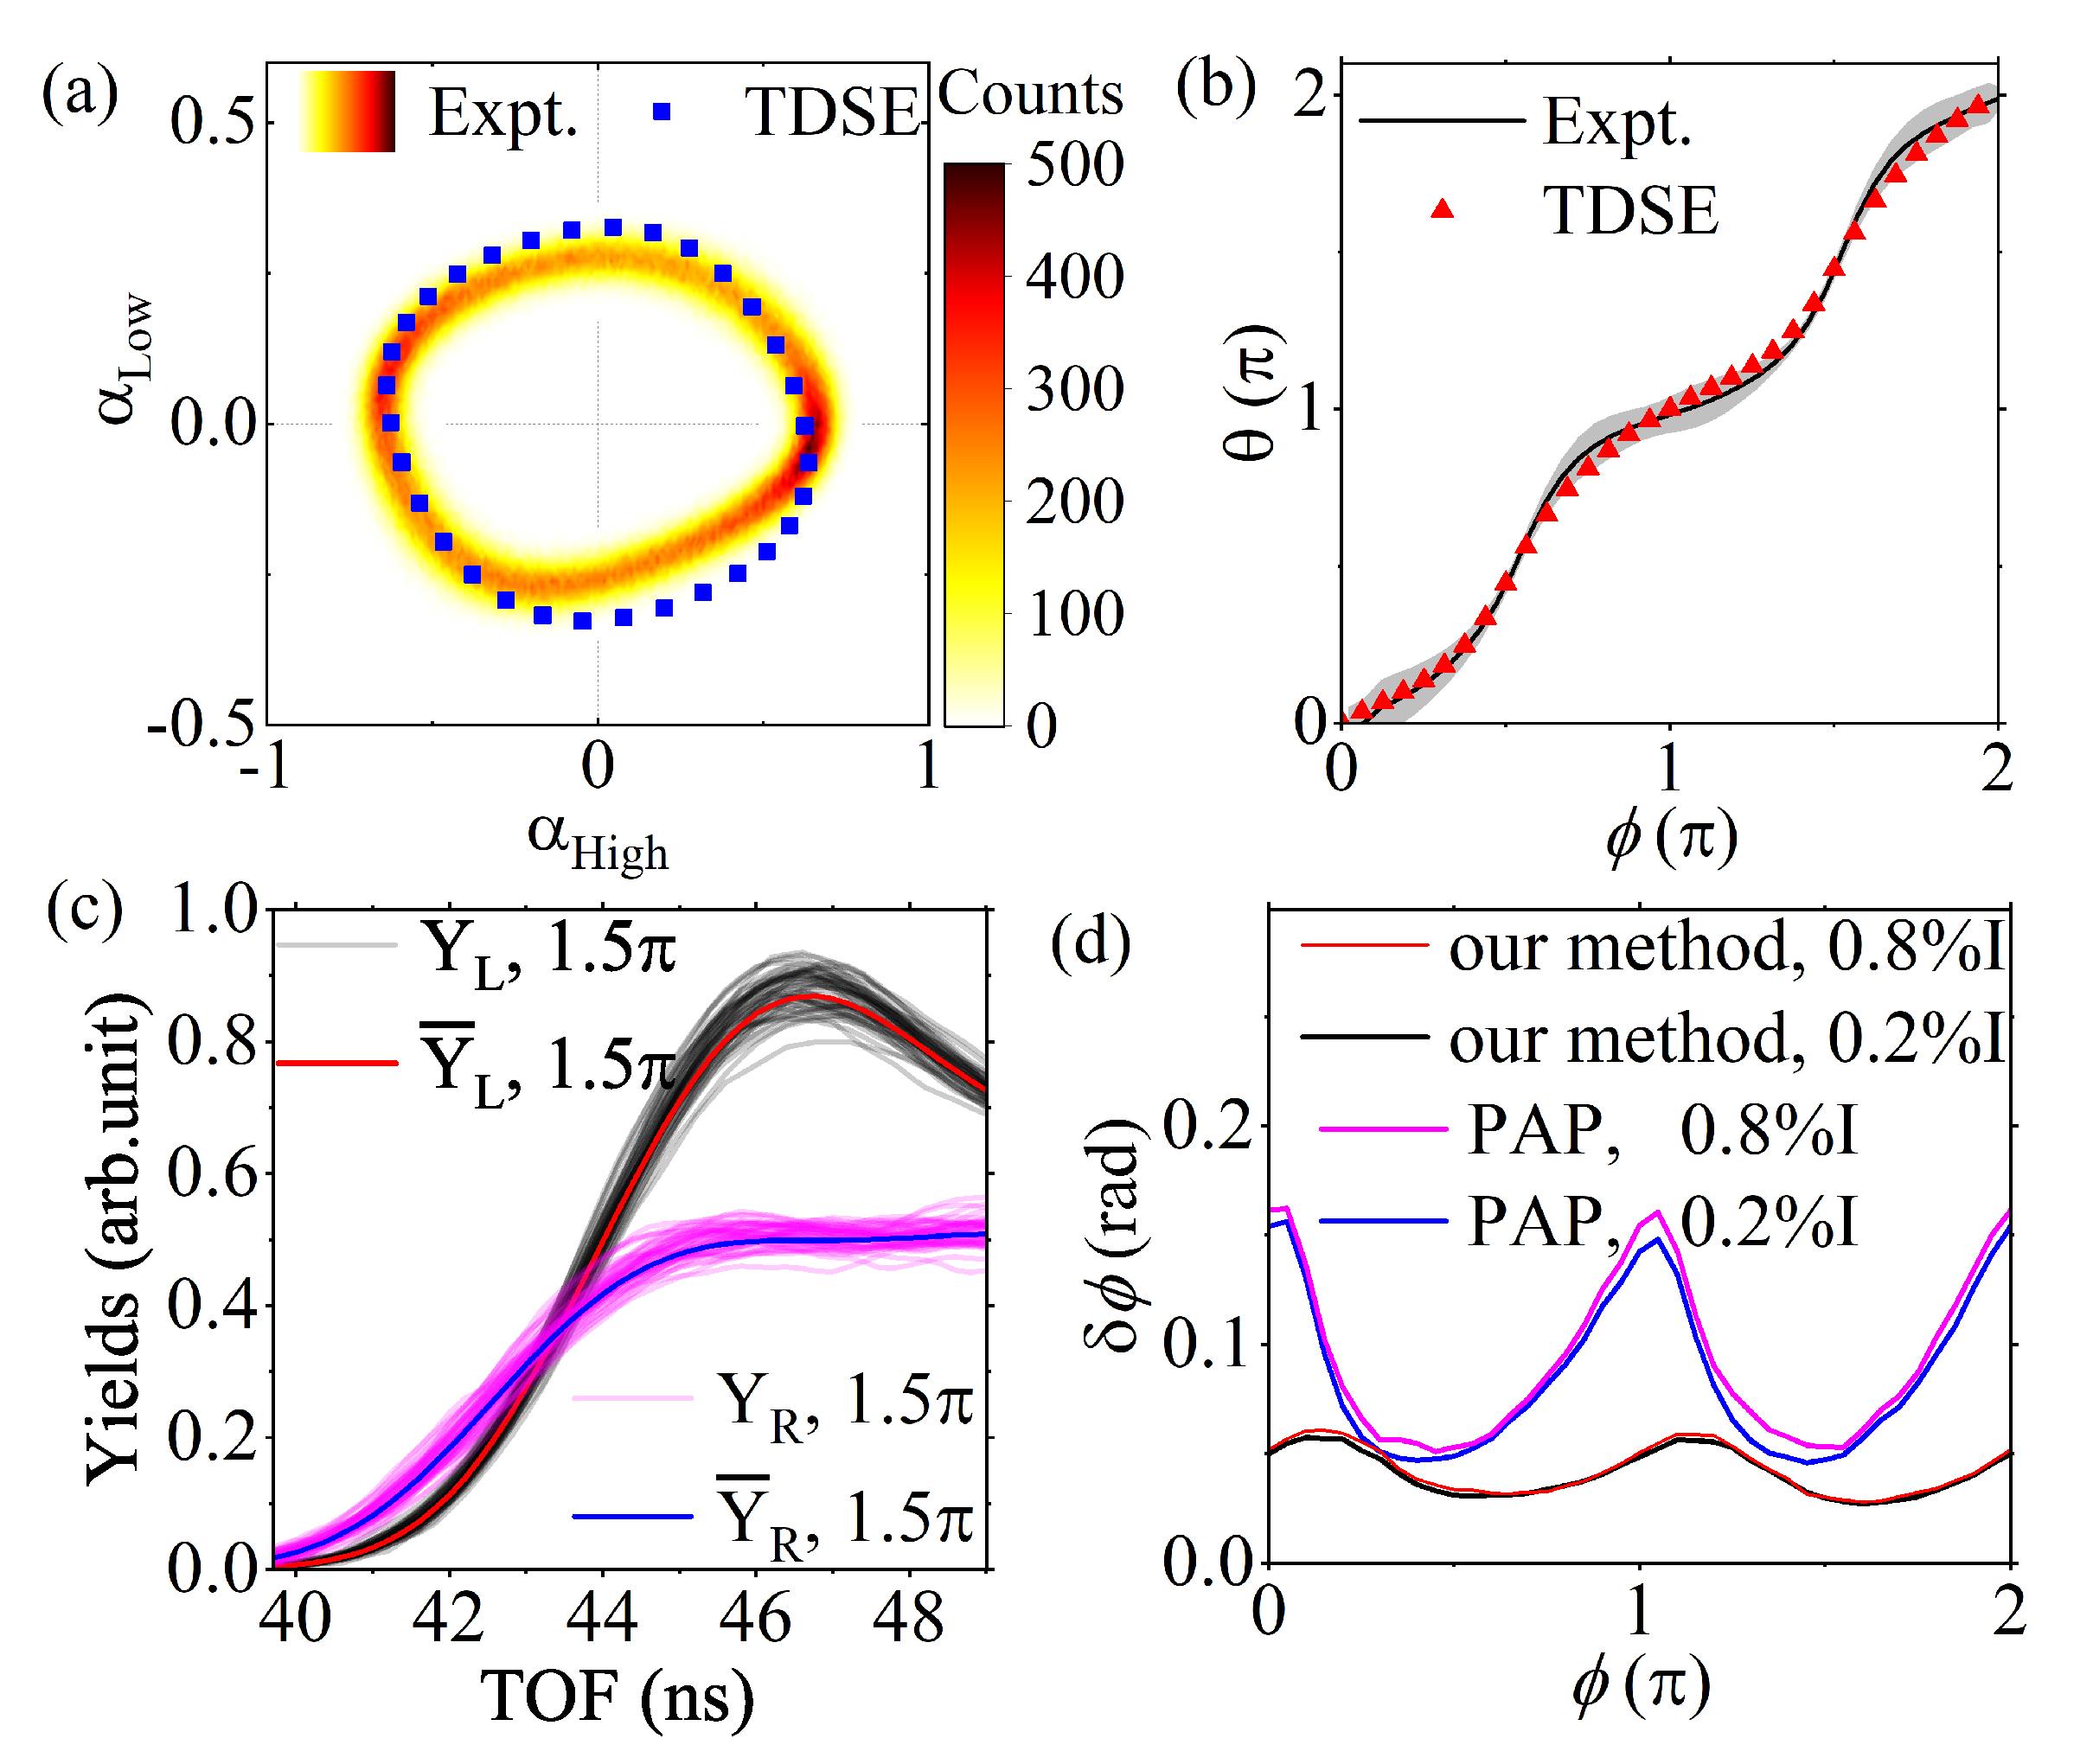
3. The Procedure to Extract the Absolute Carrier-Envelope Phase

With the procedure of the standard CEPM [23,40,41], one can choose two energy intervals (low and high), whose CEP dependence is offset by a constant phase of Φ, to achieve two corresponding asymmetry parameters, α L o w and α H i g h . The asymmetry parameter is defined by α ( ϕ , E k ) = ( Y L ( ϕ , E k ) Y R ( ϕ , E k ) ) / ( Y L ( ϕ , E k ) + Y R ( ϕ , E k ) ) , where Y L ( ϕ , E k ) and Y R ( ϕ , E k ) are the yields of photoelectrons emitted along the left and right directions (the opposing directions parallel to the laser polarization) with an energy of E k at a CEP of ϕ . The two asymmetry parameters can be plotted against each other in a two-dimensional parametric asymmetry plot (PAP), where a one-to-one correspondence between the polar angle ( θ ) and the CEP ( ϕ ) can be established. To achieve a good precision over the entire 2 π range, the polar angle ( θ ) is supposed to vary approximately linearly with rising CEP ( ϕ ), which means that the pattern of PAP distribution should be close to an annulus [24,41]. Thus, we have to make sure Φ = π / 2 and, at the same time, the oscillation amplitude of α L o w has to equal to that of α H i g h .
Experimentally, it is not always convenient to fulfill the two conditions noted above. It has been shown that the pattern of PAP distribution is sensitive to the pulse duration [46], laser intensity [38,39], and phase-volume effect [45]. The physical origin can be comprehended by the results in [40], where it was shown that, with rising E k , the oscillation amplitude of the asymmetry parameter shows a rapid rising trend until a maximum around the cutoff of ATI spectra, and a step structure appears at a relatively lower energy if an SM is employed in the CEPM for a 5.0 fs laser pulse. However, to ensure Φ = π / 2 , the energy intervals of α H i g h and α L o w have to be carefully chosen and, usually, the difference between the centers of the two intervals could be approximately 15 eV (see, e.g., [23]). It is easy to understand that one cannot obtain equal oscillation amplitudes of α H i g h and α L o w and, at the same time, maintain Φ = π / 2 for a pure rising trend of the oscillation amplitude of the asymmetry parameter. As demonstrated in [40], the step structure will give rise to more slowly varying oscillation amplitudes, which means the two conditions noted in the last paragraph can be approximately fulfilled. Nevertheless, in some cases, the PAP distribution is still different from a perfect annulus [23,38,39,46].
Here, we propose a dedicated data processing procedure that can exploit most of the effective experimental data to extract CEP. To this end, it is necessary to obtain the asymmetry of photoelectron kinetic energy or TOF spectra [23,24]. In Figure 2a, we present the typical photoelectron TOF spectra measured by the left and right detectors at a series of CEPs. In Figure 2b, we present the asymmetry of the photoelectron TOF spectra that are obtained by calculating the asymmetry parameter α ( ϕ , t ) , where t indicates TOF of the photoelectron, with the data in Figure 2a. As documented [23,24], the CEP dependence of the asymmetry of the photoelectron yields at a chosen kinetic energy or TOF is a sine/cosine curve. Thus, instead of choosing two energy/TOF intervals (low and high) [23,41], we decided to fit the α t ( ϕ ) at each TOF with the measured CEP dependent photoelectron yields in a wide TOF range, with a function of A t cos ( ϕ Φ t ) , to increase the precision of the extracted CEP.
α t ( ϕ ) = A t cos ( ϕ Φ t ) .
Note that, in the above equation, for each laser pulse, ϕ is a constant. In contrast, considering that the CEP is not actively stabilized during the measurement, the CEPs of our laser pulses could be assumed to be quasi-uniformly distributed over the range of 0 ϕ < 2 π . Thus, we can make an estimation of the amplitude of A t and the phase shift Φ t based on the statistical distribution of α t ( ϕ ) at each TOF before fitting. This procedure can significantly increase the fitting precision and efficiency. The amplitude of A t can be estimated by
A t = 2 · i = 1 i = N ( α t ( ϕ ) ) i 2 N ,
where N is the number of sampling pulses involved. Additionally, to make an estimation of Φ t , a simple transformation of Equation (1) can be obtained,
β t = α t ( ϕ ) A t = cos ( ϕ Φ t ) .
Then we calculate the derivative of the above equation with respect to t,
d β t d t = sin ( ϕ Φ t ) d Φ t d t .
With the above equation and considering that Φ t decreases with rising t [40], we get
d Φ t d t = d β t d t 1 β t 2 .
After an integration of the above equation and averaging over all the pulses, we get
Φ t = t 0 t n i = 1 i = N d β i d t 1 β i 2 N d t + Φ 0 ,
where Φ 0 is an arbitrary offset, indicating that only the relative CEP can be obtained if there is no more information available. With Equations (2) and (6) and the experimental data in the TOF range of high SNR (from 40.5 ns to 48.0 ns here (see Figure 2a,b)), we can make an estimate of A t and Φ t . Next, we put the initially estimated A t and Φ t into Equation (1) and fit the measured α t with the experimental data to achieve the initial ϕ . The obtained initial ϕ is further inserted into Equation (1) to fit the measured data again to achieve the more accurate A t and Φ t . The fitting procedure can be iterated until all the extracted parameters, including ϕ , A t , and Φ t , no longer change. Note that the determination of absolute CEP is finally achieved by a comparison with TDSE calculations. The obtained photoelectron TOF (kinetic energy) dependent A t ( A e ) and Φ t ( Φ e ) are presented in Figure 2c,d). Additionally, the CEP ( ϕ ) and photoelectron kinetic energy ( E k ) dependence of α ( ϕ , E k ) distributions are presented in Figure 2e.

4. Numerical Solution of the Time-Dependent Schrödinger Equation (TDSE)

To determine the absolute CEP, calculations based on numerical solutions of TDSE were performed and compared with the experimental data. The TDSE of Xe subject to a strong laser field is written as
i ψ ( r , τ ) τ = 1 2 2 + V m ( r ) + i A ( τ ) · ψ ( r , τ )
where A ( τ ) = τ E ( τ ) d τ is the laser field’s vector potential, and the model potential is given by [47,48]
V m ( r ) = 1 + a 1 e a 2 r + a 3 r e a 4 r + a 5 e a 6 r r .
The parameters in the above equation, for a Xe atom with an initial 5 p state oriented along the laser polarization, can be found in Ref [48]. The laser vector potential employed in the calculation is A ( τ ) = E 0 ω cos 2 ω τ 2 n sin ( ω τ + ϕ ) , where E 0 , ω = 0.0584 a.u., n = 5.27 , and ϕ are the peak amplitude, the central angular frequency, number of optical cycles and CEP of the laser field, respectively. These parameters are chosen according to the experimental configurations. The maximum angular momentum quantum number employed in the calculation is l m a x = 85 . The TDSE is solved numerically using the QPROP code [49]. To compare with the experimental data, we have calculated PES at a series of CEPs and intensities, which are varied in the steps of 0.0625 π and 0.1 × 10 13 W/cm2, respectively. The peak laser intensity is 1.2 × 10 14 W/cm2 in our TDSE calculations. These PES are focal averaged for both intensity [50,51] and CEP [42,43,44,45] according to the experimental configurations.

5. Results and Discussion

To validate our method, we compared the measured CEP ( ϕ ) and photoelectron kinetic energy ( E k ) dependence of α ( ϕ , E k ) distributions (Figure 2e) with the TDSE calculations (Figure 2f). The agreement between the experimental data and the focal-averaged calculations are good. Moreover, in Figure 2d, the E k dependence of asymmetry amplitude A e ( E k ) and phase Φ e ( E k ) extracted from the experimental data can be well reproduced by the TDSE calculations. Note that the step structure, which is obvious in an earlier work [40], disappears because of the altered intensity dependence of the volume of each iso-intensity shell in the vicinity of the focus of few-cycle laser pulses in our experimental setup (see Figure 1b).
Our experimental data were also processed with the standard CEPM procedure [23,24]. Two energy intervals of (61.3∼69.5 eV) and (47.0∼52.0 eV) (see the shaded areas in Figure 2b) were chosen to obtain the high ( α H i g h ) and low ( α L o w ) asymmetry parameters because of good SNR in these intervals and the smallest CEP uncertainty that can be eventually obtained. The achieved PAP distribution is presented in Figure 3a, where a potato-like distribution can be found. The deviation of the PAP distribution from a perfect annulus can be mainly attributed to the residual difference between the oscillation amplitudes of α H i g h and α L o w (see Figure 2d). This difference can become smaller if an SM is employed [40], because a step structure will appear and diminish the difference to a large extent. In our case, the application of an OAP enhanced the focusing averaging effect significantly (see Figure 1b) and eliminated the influence of the step structure.
In Figure 3b, we depict the CEP ( ϕ ) dependence of the polar angle ( θ ), which was extracted from the measured PAP. Apparently, this relationship is a complex combination of an oscillation and a linearly rising trend, instead of a simple line. As expected, the curve extracted from the experimental data can be well reproduced by the TDSE calculations. The grey shaded area indicates the uncertainties of the measured CEP by the standard CEPM procedure.
A Monte Carlo algorithm, which was proposed in Ref. [24], was employed to determine the uncertainties of the CEPs, which are measured by our procedure. As shown in Figure 3c, the reference spectra in both directions (indicated by Y ¯ L and Y ¯ R in Figure 3c) can be obtained by averaging the measured photoelectron TOF spectra over a small CEP range of ±5 mrad. The statistical error due to electron counting and intensity fluctuations is numerically simulated by the Monte Carlo algorithm. In this way, the uncertainties of CEP determined by our procedure are obtained and shown in Figure 3d.
To demonstrate the merit of our procedure, the uncertainties of CEPs determined by our procedure and also those of the standard CEPM are compared in Figure 3d. As shown in this panel, the CEP uncertainty of our method is significantly smaller than that of the method employing PAP distribution. Moreover, The CEP precision of the two methods, which is determined by the maximum of CEP uncertainties over the entire 2 π range in each case, is 57 mrad and 156 mrad, respectively.
To reveal the performance of the intensity tagging, the CEP dependent precision in the case of including all the experiment data is presented in Figure 3d. The corresponding intensity uncertainty is 0.8 % for a typical data acquiring time of approximately 4 min. As shown in Figure 3d, the increase of intensity uncertainty from approximately 0.2 % to 0.8 % gives rise to slightly larger uncertainties of CEP in the case of a standard CEPM procedure and almost identical CEP precision for our numerical procedure. This result indicates that our procedure will be less sensitive to the laser intensity fluctuation. Although the advantage of the intensity tagging is not significant in this experiment, its performance could be more prominent for the experiment with a longer data acquiring time (e.g., tens of hours) because of possible larger intensity fluctuation.

6. Conclusions

In this work, we demonstrate that, with an improved carrier-envelope phase determination method for few-cycle laser pulses, a CEP precision of 57 mrad over the entire 2 π range can be achieved for 5.0 fs laser pulses. In contrast, the CEP uncertainty becomes 156 mrad if the traditional method employing PAP distribution is applied for the same data. The improvement relies mainly on a dedicated data processing procedure that can effectively exploit most of the experimental data to extract the CEP. Moreover, we have made several technical improvements of our homemade phase meter to optimize the SNR, the intensity, and phase distribution in the vicinity of the focus. The intensity tagging technique was also applied to reduce the intensity uncertainty. A comparison between the experimental data and TDSE calculations indicates that our procedure is robust and reliable.

Author Contributions

Methodology, Y.Z. and W.Q.; validation, Y.Z., W.Q., M.W., M.Z., Z.W., and S.C.; data curation, Y.Z.; formal analysis, Y.Z. and W.Q.; writing—original draft preparation, Y.Z.; writing—review and editing, W.Q., X.L., and J.C.; visualization, Y.Z.; supervision, W.Q. and X.L.; funding acquisition, W.Q. and X.L. All authors have read and agreed to the published version of the manuscript.

Funding

This work is supported by the National Key Research and Development Program of China (Grant No. 2019YFA0307700), the National Natural Science Foundation of China (Nos. 11834015, 11974383 and 12121004), the Science and Technology Department of Hubei Province (Nos. 2019CFA035 and 2020CFA029).

Institutional Review Board Statement

Not applicable.

Informed Consent Statement

Not applicable.

Data Availability Statement

Not applicable.

Acknowledgments

We thank Xu Y.Q., Sun H.Y., Wan C.Z., Wang Y. and Chen Q.F. for technical support of laser system, electronic devices, and vacuum system.

Conflicts of Interest

The authors declare no conflict of interest.

References

  1. Paulus, G.G.; Grasbon, F.; Walther, H.; Villoresi, P.; Nisoli, M.; Stagira, S.; Priori, E.; De Silvestri, S. Absolute-phase phenomena in photoionization with few-cycle laser pulses. Nature 2001, 414, 182–184. [Google Scholar] [CrossRef] [PubMed]
  2. Baltuška, A.; Udem, T.; Uiberacker, M.; Hentschel, M.; Goulielmakis, E.; Gohle, C.; Holzwarth, R.; Yakovlev, V.S.; Scrinzi, A.; Hänsch, T.W.; et al. Attosecond control of electronic processes by intense light fields. Nature 2003, 421, 611–615. [Google Scholar] [CrossRef] [PubMed]
  3. Kling, M.F.; Siedschlag, C.; Verhoef, A.J.; Khan, J.I.; Schultze, M.; Uphues, T.; Ni, Y.; Uiberacker, M.; Drescher, M.; Krausz, F.; et al. Control of electron localization in molecular dissociation. Science 2006, 312, 246–248. [Google Scholar] [CrossRef] [PubMed]
  4. Milošević, D.B.; Paulus, G.G.; Bauer, D.; Becker, W. Above-threshold ionization by few-cycle pulses. J. Phys. B At. Mol. Opt. Phys. 2006, 39, R203–R262. [Google Scholar] [CrossRef]
  5. Bergues, B.; Kübel, M.; Johnson, N.G.; Fischer, B.; Camus, N.; Betsch, K.J.; Herrwerth, O.; Senftleben, A.; Sayler, A.M.; Rathje, T.; et al. Attosecond tracing of correlated electron-emission in non-sequential double ionization. Nat. Commun. 2012, 3, 813. [Google Scholar] [CrossRef] [Green Version]
  6. Liu, X.; Figueira de Morisson Faria, C. Nonsequential Double Ionization with Few-Cycle Laser Pulses. Phys. Rev. Lett. 2004, 92, 133006. [Google Scholar] [CrossRef] [Green Version]
  7. Li, H.; Gong, X.; Lin, K.; de Vivie-Riedle, R.; Tong, X.; Wu, J.; Kling, M.F. Sub-cycle directional control of the dissociative ionization of H2 in tailored femtosecond laser fields. J. Phys. B At. Mol. Opt. Phys. 2017, 50, 172001. [Google Scholar] [CrossRef] [Green Version]
  8. Alnaser, A.S.; Litvinyuk, I.V. Subfemtosecond directional control of chemical processes in molecules. J. Phys. B At. Mol. Opt. Phys. 2017, 50, 032002. [Google Scholar] [CrossRef]
  9. Sansone, G.; Benedetti, E.; Calegari, F.; Vozzi, C.; Avaldi, L.; Flammini, R.; Poletto, L.; Villoresi, P.; Altucci, C.; Velotta, R.; et al. Isolated single-cycle attosecond pulses. Science 2006, 314, 443–446. [Google Scholar] [CrossRef]
  10. Liu, X.; Rottke, H.; Eremina, E.; Sandner, W.; Goulielmakis, E.; Keeffe, K.O.; Lezius, M.; Krausz, F.; Lindner, F.; Schätzel, M.G.; et al. Nonsequential Double Ionization at the Single-Optical-Cycle Limit. Phys. Rev. Lett. 2004, 93, 263001. [Google Scholar] [CrossRef] [Green Version]
  11. Quan, W.; Xiao, Z.; Chen, Y.; Xu, S.; Lai, X.; Hua, L.; Gong, C.; Chen, J.; Liu, X. Nonsequential double ionization of Ne subject to few-cycle femtosecond laser pulses. Sci. Sin. Phys. Mech. Astron. 2017, 47, 033007. [Google Scholar] [CrossRef]
  12. Chen, Y.J.; Yu, S.G.; Lai, X.Y.; Quan, W.; Liu, X.J. Coulomb effect on the left–right asymmetry in photoelectron emission with few-cycle laser pulses. Phys. Lett. A 2016, 380, 2085–2089. [Google Scholar] [CrossRef]
  13. Rathje, T.; Sayler, A.M.; Zeng, S.; Wustelt, P.; Figger, H.; Esry, B.D.; Paulus, G.G. Coherent control at its most fundamental: Carrier-envelope-phase-dependent electron localization in photodissociation of a H2+ molecular ion beam target. Phys. Rev. Lett. 2013, 111, 093002. [Google Scholar] [CrossRef] [PubMed] [Green Version]
  14. Zherebtsov, S.; Fennel, T.; Plenge, J.; Antonsson, E.; Znakovskaya, I.; Wirth, A.; Herrwerth, O.; Süßmann, F.; Peltz, C.; Ahmad, I.; et al. Controlled near-field enhanced electron acceleration from dielectric nanospheres with intense few-cycle laser fields. Nat. Phys. 2011, 7, 656–662. [Google Scholar] [CrossRef]
  15. Krüger, M.; Schenk, M.; Hommelhoff, P. Attosecond control of electrons emitted from a nanoscale metal tip. Nature 2011, 475, 78–81. [Google Scholar] [CrossRef] [Green Version]
  16. Ciappina, M.F.; Pérez-Hernández, J.A.; Landsman, A.S.; Okell, W.A.; Zherebtsov, S.; Förg, B.; Schötz, J.; Seiffert, L.; Fennel, T.; Shaaran, T.; et al. Attosecond physics at the nanoscale. Rep. Prog. Phys. 2017, 80, 054401. [Google Scholar] [CrossRef] [Green Version]
  17. Jones, D.J.; Diddams, S.A.; Ranka, J.K.; Stentz, A.; Windeler, R.S.; Hall, J.L.; Cundiff, S.T. Carrier-envelope phase control of femtosecond mode-locked lasers and direct optical frequency synthesis. Science 2000, 288, 635–639. [Google Scholar] [CrossRef] [Green Version]
  18. Kurucz, M.; Flender, R.; Haizer, L.; Nagymihaly, R.S.; Cho, W.; Kim, K.T.; Toth, S.; Cormier, E.; Kiss, B. 2.3-cycle mid-infrared pulses from hybrid thin-plate post-compression at 7 W average power. Opt. Commun. 2020, 472, 126035. [Google Scholar] [CrossRef]
  19. Peters, W.K.; Jones, T.; Efimov, A.; Pedersoli, E.; Foglia, L.; Mincigrucci, R.; Nikolov, I.; Trebino, R.; Danailov, M.B.; Capotondi, F.; et al. All-optical single-shot complete electric field measurement of extreme ultraviolet free electron laser pulses. Optica 2021, 8, 545–550. [Google Scholar] [CrossRef]
  20. Kurucz, M.; Tóth, S.; Flender, R.; Haizer, L.; Kiss, B.; Persielle, B.; Cormier, E. Single-shot CEP drift measurement at arbitrary repetition rate based on dispersive Fourier transform. Opt. Express 2019, 27, 13387–13399. [Google Scholar] [CrossRef]
  21. Fukahori, S.; Ando, T.; Miura, S.; Kanya, R.; Yamanouchi, K.; Rathje, T.; Paulus, G.G. Determination of the absolute carrier-envelope phase by angle-resolved photoelectron spectra of Ar by intense circularly polarized few-cycle pulses. Phys. Rev. A 2017, 95, 053410. [Google Scholar] [CrossRef]
  22. Kübel, M.; Wustelt, P.; Zhang, Y.; Skruszewicz, S.; Hoff, D.; Würzler, D.; Kang, H.; Zille, D.; Adolph, D.; Paulus, G.G.; et al. High-Order Phase-Dependent Asymmetry in the Above-Threshold Ionization Plateau. Phys. Rev. Lett. 2021, 126, 113201. [Google Scholar] [CrossRef] [PubMed]
  23. Wittmann, T.; Horvath, B.; Helml, W.; Schätzel, M.G.; Gu, X.; Cavalieri, A.L.; Paulus, G.G.; Kienberger, R. Single-shot carrier–envelope phase measurement of few-cycle laser pulses. Nat. Phys. 2009, 5, 357–362. [Google Scholar] [CrossRef]
  24. Sayler, A.M.; Rathje, T.; Müller, W.; Rühle, K.; Kienberger, R.; Paulus, G.G. Precise, real-time, every-single-shot, carrier-envelope phase measurement of ultrashort laser pulses. Opt. Lett. 2011, 36, 1–3. [Google Scholar] [CrossRef] [PubMed]
  25. Hoff, D.; Furch, F.J.; Witting, T.; Rühle, K.; Adolph, D.; Sayler, A.M.; Vrakking, M.J.J.; Paulus, G.G.; Schulz, C.P. Continuous every-single-shot carrier-envelope phase measurement and control at 100 kHz. Opt. Lett. 2018, 43, 3850–3853. [Google Scholar] [CrossRef] [PubMed]
  26. Adolph, D.; Möller, M.; Bierbach, J.; Schwab, M.; Sävert, A.; Yeung, M.; Sayler, A.M.; Zepf, M.; Kaluza, M.C.; Paulus, G.G. Real-time, single-shot, carrier-envelope-phase measurement of a multi-terawatt laser. Appl. Phys. Lett. 2017, 110, 081105. [Google Scholar] [CrossRef] [Green Version]
  27. Johnson, N.G.; Herrwerth, O.; Wirth, A.; De, S.; Ben-Itzhak, I.; Lezius, M.; Bergues, B.; Kling, M.F.; Senftleben, A.; Schröter, C.D.; et al. Single-shot carrier-envelope-phase-tagged ion-momentum imaging of nonsequential double ionization of argon in intense 4-fs laser fields. Phys. Rev. A 2011, 83, 013412. [Google Scholar] [CrossRef] [Green Version]
  28. Schöffler, M.S.; Xie, X.; Wustelt, P.; Möller, M.; Roither, S.; Kartashov, D.; Sayler, A.M.; Baltuska, A.; Paulus, G.G.; Kitzler, M. Laser-subcycle control of sequential double-ionization dynamics of helium. Phys. Rev. A 2016, 93, 063421. [Google Scholar] [CrossRef]
  29. Kangaparambil, S.; Hanus, V.; Dorner-Kirchner, M.; He, P.; Larimian, S.; Paulus, G.; Baltuška, A.; Xie, X.; Yamanouchi, K.; He, F.; et al. Generalized Phase Sensitivity of Directional Bond Breaking in the Laser-Molecule Interaction. Phys. Rev. Lett. 2020, 125, 023202. [Google Scholar] [CrossRef]
  30. Hanus, V.; Kangaparambil, S.; Larimian, S.; Dorner-Kirchner, M.; Xie, X.; Schöffler, M.S.; Paulus, G.G.; Baltuška, A.; Staudte, A.; Kitzler-Zeiler, M. Experimental Separation of Subcycle Ionization Bursts in Strong-Field Double Ionization of H2. Phys. Rev. Lett. 2020, 124, 103201. [Google Scholar] [CrossRef] [Green Version]
  31. Kim, Y.H.; Ivanov, I.A.; Hwang, S.I.; Kim, K.; Nam, C.H.; Kim, K.T. Attosecond streaking using a rescattered electron in an intense laser field. Sci. Rep. 2020, 10, 22075. [Google Scholar] [CrossRef] [PubMed]
  32. Hansinger, P.; Töpfer, P.; Dimitrov, N.; Adolph, D.; Hoff, D.; Rathje, T.; Sayler, A.M.; Dreischuh, A.; Paulus, G.G. Refractive index dispersion measurement using carrier-envelope phasemeters. New J. Phys. 2017, 19, 023040. [Google Scholar] [CrossRef] [Green Version]
  33. Paulus, G.G.; Lindner, F.; Walther, H.; Baltuška, A.; Goulielmakis, E.; Lezius, M.; Krausz, F. Measurement of the Phase of Few-Cycle Laser Pulses. Phys. Rev. Lett. 2003, 91, 253004. [Google Scholar] [CrossRef] [PubMed]
  34. Milošević, D.B.; Paulus, G.G.; Becker, W. High-order above-threshold ionization with few-cycle pulse: A meter of the absolute phase. Opt. Express 2003, 11, 1418–1429. [Google Scholar] [CrossRef] [PubMed]
  35. Chelkowski, S.; Bandrauk, A.D. Asymmetries in strong-field photoionization by few-cycle laser pulses: Kinetic-energy spectra and semiclassical explanation of the asymmetries of fast and slow electrons. Phys. Rev. A 2005, 71, 053815. [Google Scholar] [CrossRef]
  36. Möller, M.; Sayler, A.M.; Rathje, T.; Chini, M.; Chang, Z.; Paulus, G.G. Precise, real-time, single-shot carrier-envelope phase measurement in the multi-cycle regime. Appl. Phys. Lett. 2011, 99, 121108. [Google Scholar] [CrossRef]
  37. Kübel, M.; Betsch, K.J.; Johnson, N.G.; Kleineberg, U.; Moshammer, R.; Ullrich, J.; Paulus, G.G.; Kling, M.F.; Bergues, B. Carrier-envelope-phase tagging in measurements with long acquisition times. New J. Phys. 2012, 14, 093027. [Google Scholar] [CrossRef]
  38. Chew, S.; Gliserin, A.; Schmidt, J.; Kleineberg, U. Increasing the Sensitivity of Carrier-Envelope-Phase Tagging in Photoemission From Solids by Single-Shot Intensity Correction. Phys. Rev. Appl. 2019, 11, 054080. [Google Scholar] [CrossRef]
  39. Chew, S.H.; Gliserin, A.; Schmidt, J.; Bian, H.; Nobis, S.; Schertz, F.; Kübel, M.; Yang, Y.Y.; Loitsch, B.; Stettner, T.; et al. Laser intensity effects in carrier-envelope phase-tagged time of flight-photoemission electron microscopy. Appl. Phys. B 2016, 122, 102. [Google Scholar] [CrossRef] [Green Version]
  40. Zhou, Y.; Guo, L.; Quan, W.; Wei, M.; Zhao, M.; Xu, S.; Xiao, Z.; Sun, R.; Wang, Y.; Lai, X.; et al. Carrier-envelope phase dependence of high-order above-threshold ionization by few-cycle laser pulses. J. Phys. B At. Mol. Opt. Phys. 2021, 54, 144008. [Google Scholar] [CrossRef]
  41. Rathje, T.; Johnson, N.G.; Möller, M.; Süßmann, F.; Adolph, D.; Kübel, M.; Kienberger, R.; Kling, M.F.; Paulus, G.G.; Sayler, A.M. Review of attosecond resolved measurement and control via carrier–envelope phase tagging with above-threshold ionization. J. Phys. B At. Mol. Opt. Phys. 2012, 45, 074003. [Google Scholar] [CrossRef]
  42. Porras, M.A. Characterization of the electric field of focused pulsed Gaussian beams for phase-sensitive interactions with matter. Opt. Lett. 2009, 34, 1546–1548. [Google Scholar] [CrossRef] [PubMed]
  43. Hoff, D.; Krüger, M.; Maisenbacher, L.; Sayler, A.M.; Paulus, G.G.; Hommelhoff, P. Tracing the phase of focused broadband laser pulses. Nat. Phys. 2017, 13, 947–951. [Google Scholar] [CrossRef] [Green Version]
  44. Hoff, D.; Krüger, M.; Maisenbacher, L.; Paulus, G.G.; Hommelhoff, P.; Sayler, A.M. Using the focal phase to control attosecond processes. J. Opt. 2017, 19, 124007. [Google Scholar] [CrossRef]
  45. Zhang, Y.; Zille, D.; Hoff, D.; Wustelt, P.; Würzler, D.; Möller, M.; Sayler, A.M.; Paulus, G.G. Observing the Importance of the Phase-Volume Effect for Few-Cycle Light-Matter Interactions. Phys. Rev. Lett. 2020, 124, 133202. [Google Scholar] [CrossRef] [PubMed]
  46. Sayler, A.M.; Rathje, T.; Müller, W.; Kürbis, C.; Rühle, K.; Stibenz, G.; Paulus, G.G. Real-time pulse length measurement of few-cycle laser pulses using above-threshold ionization. Opt. Express 2011, 19, 4464–4471. [Google Scholar] [CrossRef]
  47. Tong, X.M.; Lin, C.D. Empirical formula for static field ionization rates of atoms and molecules by lasers in the barrier-suppression regime. J. Phys. B At. Mol. Opt. Phys. 2005, 38, 2593–2600. [Google Scholar] [CrossRef]
  48. Milošević, D.B.; Becker, W.; Okunishi, M.; Prümper, G.; Shimada, K.; Ueda, K. Strong-field electron spectra of rare-gas atoms in the rescattering regime: Enhanced spectral regions and a simulation of the experiment. J. Phys. B At. Mol. Opt. Phys. 2010, 43, 015401. [Google Scholar] [CrossRef]
  49. Bauer, D.; Koval, P. Qprop: A Schrödinger-solver for intense laser–atom interaction. Comput. Phys. Commun. 2006, 174, 396–421. [Google Scholar] [CrossRef] [Green Version]
  50. Kopold, R.; Becker, W.; Kleber, M.; Paulus, G.G. Channel-closing effects in high-order above-threshold ionization and high-order harmonic generation. J. Phys. B At. Mol. Opt. Phys. 2002, 35, 217–232. [Google Scholar] [CrossRef]
  51. Xu, S.; Liu, M.; Hu, S.; Shu, Z.; Quan, W.; Xiao, Z.; Zhou, Y.; Wei, M.; Zhao, M.; Sun, R.; et al. Observation of a transition in the dynamics of strong-field atomic excitation. Phys. Rev. A 2020, 102, 043104. [Google Scholar] [CrossRef]
Figure 1. (a) Schematic view of the experimental setup. Laser beam (LB) with polarization along the horizontal direction is introduced into the sample chamber by a off-axis parabolic (OAP) mirror. The photoelectrons produced at the laser focus fly towards left and right MCP detectors through two pinholes (PH). The signals recorded by the MCP detectors are extracted by two homemade electronic circuits (EC). The photoelectron signals are sent to a PXI system (PS) equipped with a pair of fast digitizers. By a beam splitter (BS), a small portion of laser is directed and detected by a photo-diode (PD). The PD output is further split evenly by a power divider to trigger the PS and perform intensity tagging. A pair of fused silica wedges (W) are applied to compensate the residual positive chirp of the laser beam. A combination of an achromatic broadband half-wave plate (HWP) and a commercial (Edmund #36-652) linear polarization (LP) is applied to alter the laser intensity. See text for more details. (b) The intensity dependence of the CEP range ( Δ ϕ ) and volume (V) of each iso-intensity shell of few-cycle laser pulses focused by an OAP mirror and a spherical mirror (SM), respectively.
Photonics 09 00528 g001
Figure 2. (a) Typical time-of-flight (TOF) photoelectron distributions measured by the left and right detectors of CEPM at a series of CEPs. (b) The TOF-dependence of the left-right asymmetry ( α ( ϕ , t ) ) at a series of CEPs. (c) The extracted TOF-dependent asymmetry amplitude ( A t ) and phase shift ( Φ t ) with our data processing procedure. (d) A comparison between the extracted energy-dependent asymmetry amplitude ( A e ) and phase shift ( Φ e ) and the TDSE calculations. We also present the measured (e) and calculated (f) 2-dimensional α ( E k , ϕ ) distributions. See text for more details.
Photonics 09 00528 g002
Figure 3. (a) The PAP obtained with the typical CEPM procedure with the data given in Figure 2 and TDSE calculations. (b) The polar angle ( θ ) as a function of CEP extracted from the PAP in (a). The gray shaded area indicates the uncertainties of the experimental data. (c) The photoelectron TOF spectra measured by the left ( Y L ) and right ( Y R ) detectors over a small CEP range of ϕ = 1.5 π ± 5 mrad determined by our procedure for 50 pulses, which are randomly chosen from 1033 pulses for better visualization of the jitter, and the averaged curve of Y ¯ L and Y ¯ R . (d) A comparison of the CEP dependence of measurement precision ( δ ϕ ) of our procedure and the standard method employing PAP. See text for more details.
Photonics 09 00528 g003
Publisher’s Note: MDPI stays neutral with regard to jurisdictional claims in published maps and institutional affiliations.

