Photoacoustic Detection of Pollutants Emitted by Transportation System for Use in Automotive Industry


 and
and
Abstract
:1. Introduction
- Photoacoustic spectroscopy does not need an optical detector. Accordingly, it has no choice for detecting wavelengths; therefore, it is possible to apply it to all wavelengths, from ultraviolet to infrared and terahertz.
- The zero-background feature lets the detector and preamplifier operate on a zero signal in a wide dynamic range.
2. Materials and Methods
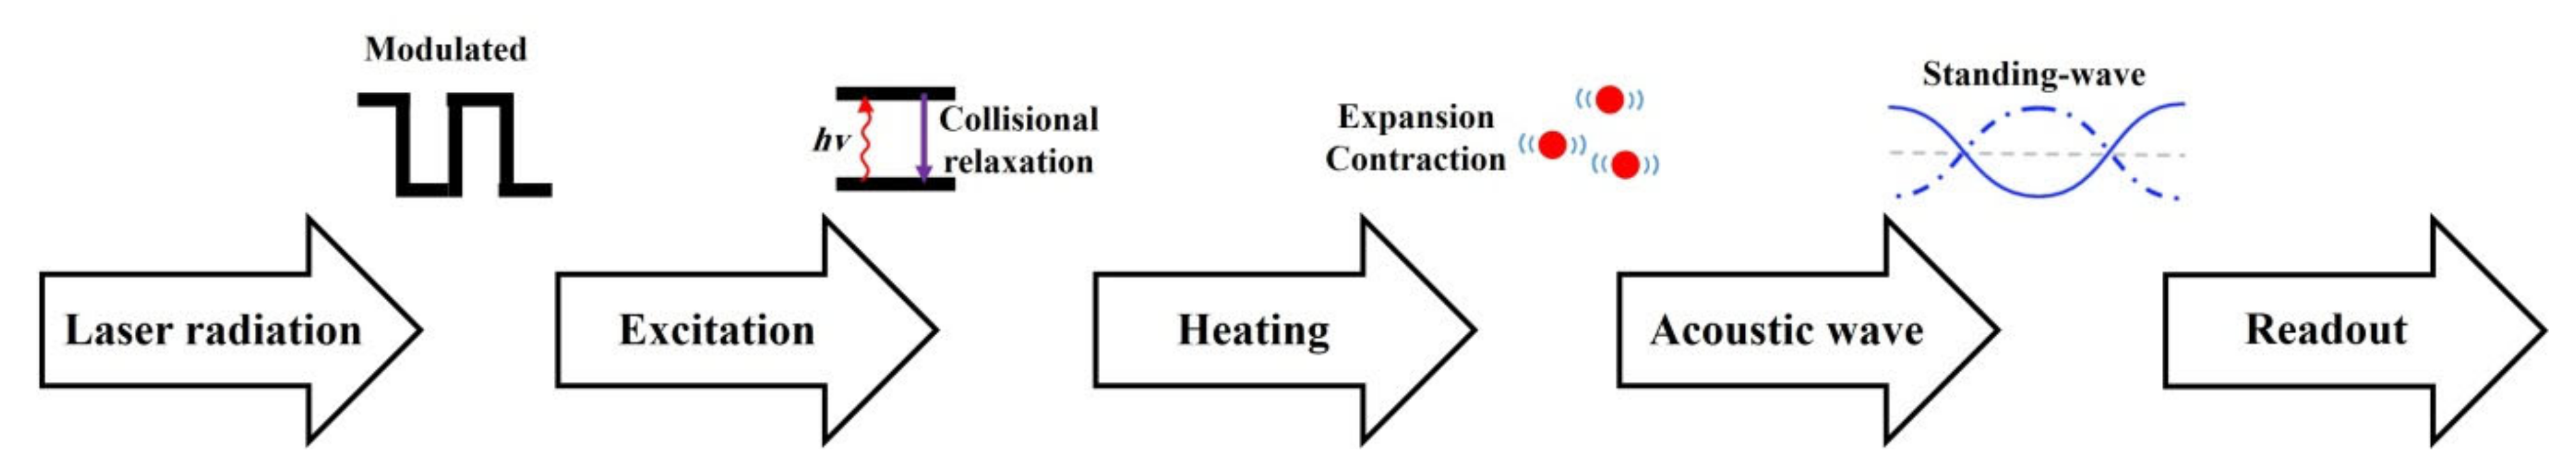
2.1. Theory
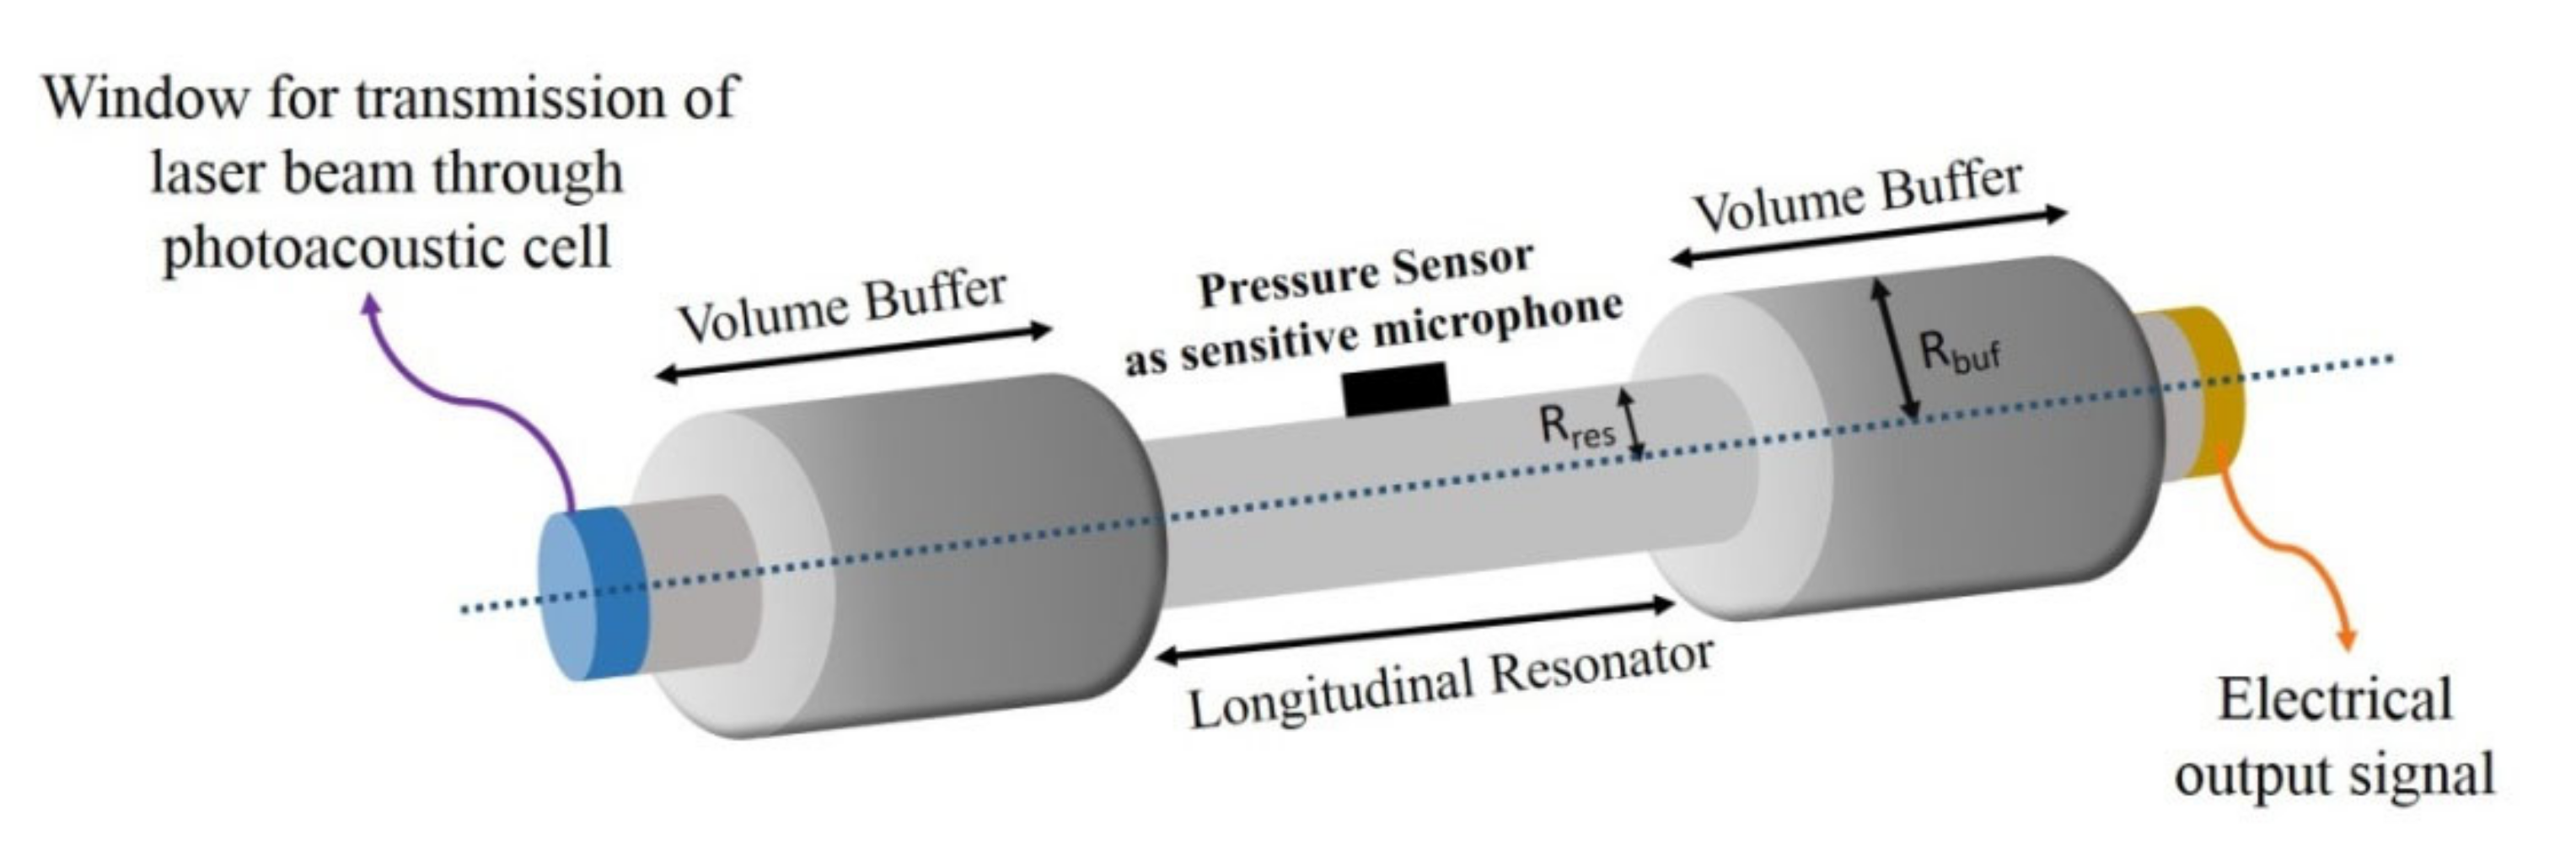
2.2. Cell Design
- In photoacoustic spectroscopy, the signal is inversely related to the volume of the resonant cell, and this relation has led to the miniaturization of photoacoustic cells with great interest in recent years [37];
- Moreover, in photoacoustic spectroscopy, the detection limit is almost independent of the length of the laser–gas interaction, so this feature makes sensitivity and miniaturization possible in a photoacoustic spectroscopy system [38];
- Conventional photoacoustic gas analyzers mainly demand a large volume of the gas sample and are not suitable for detection applications in confined spaces [39].
2.3. Numerical Modeling
3. Results and Discussion
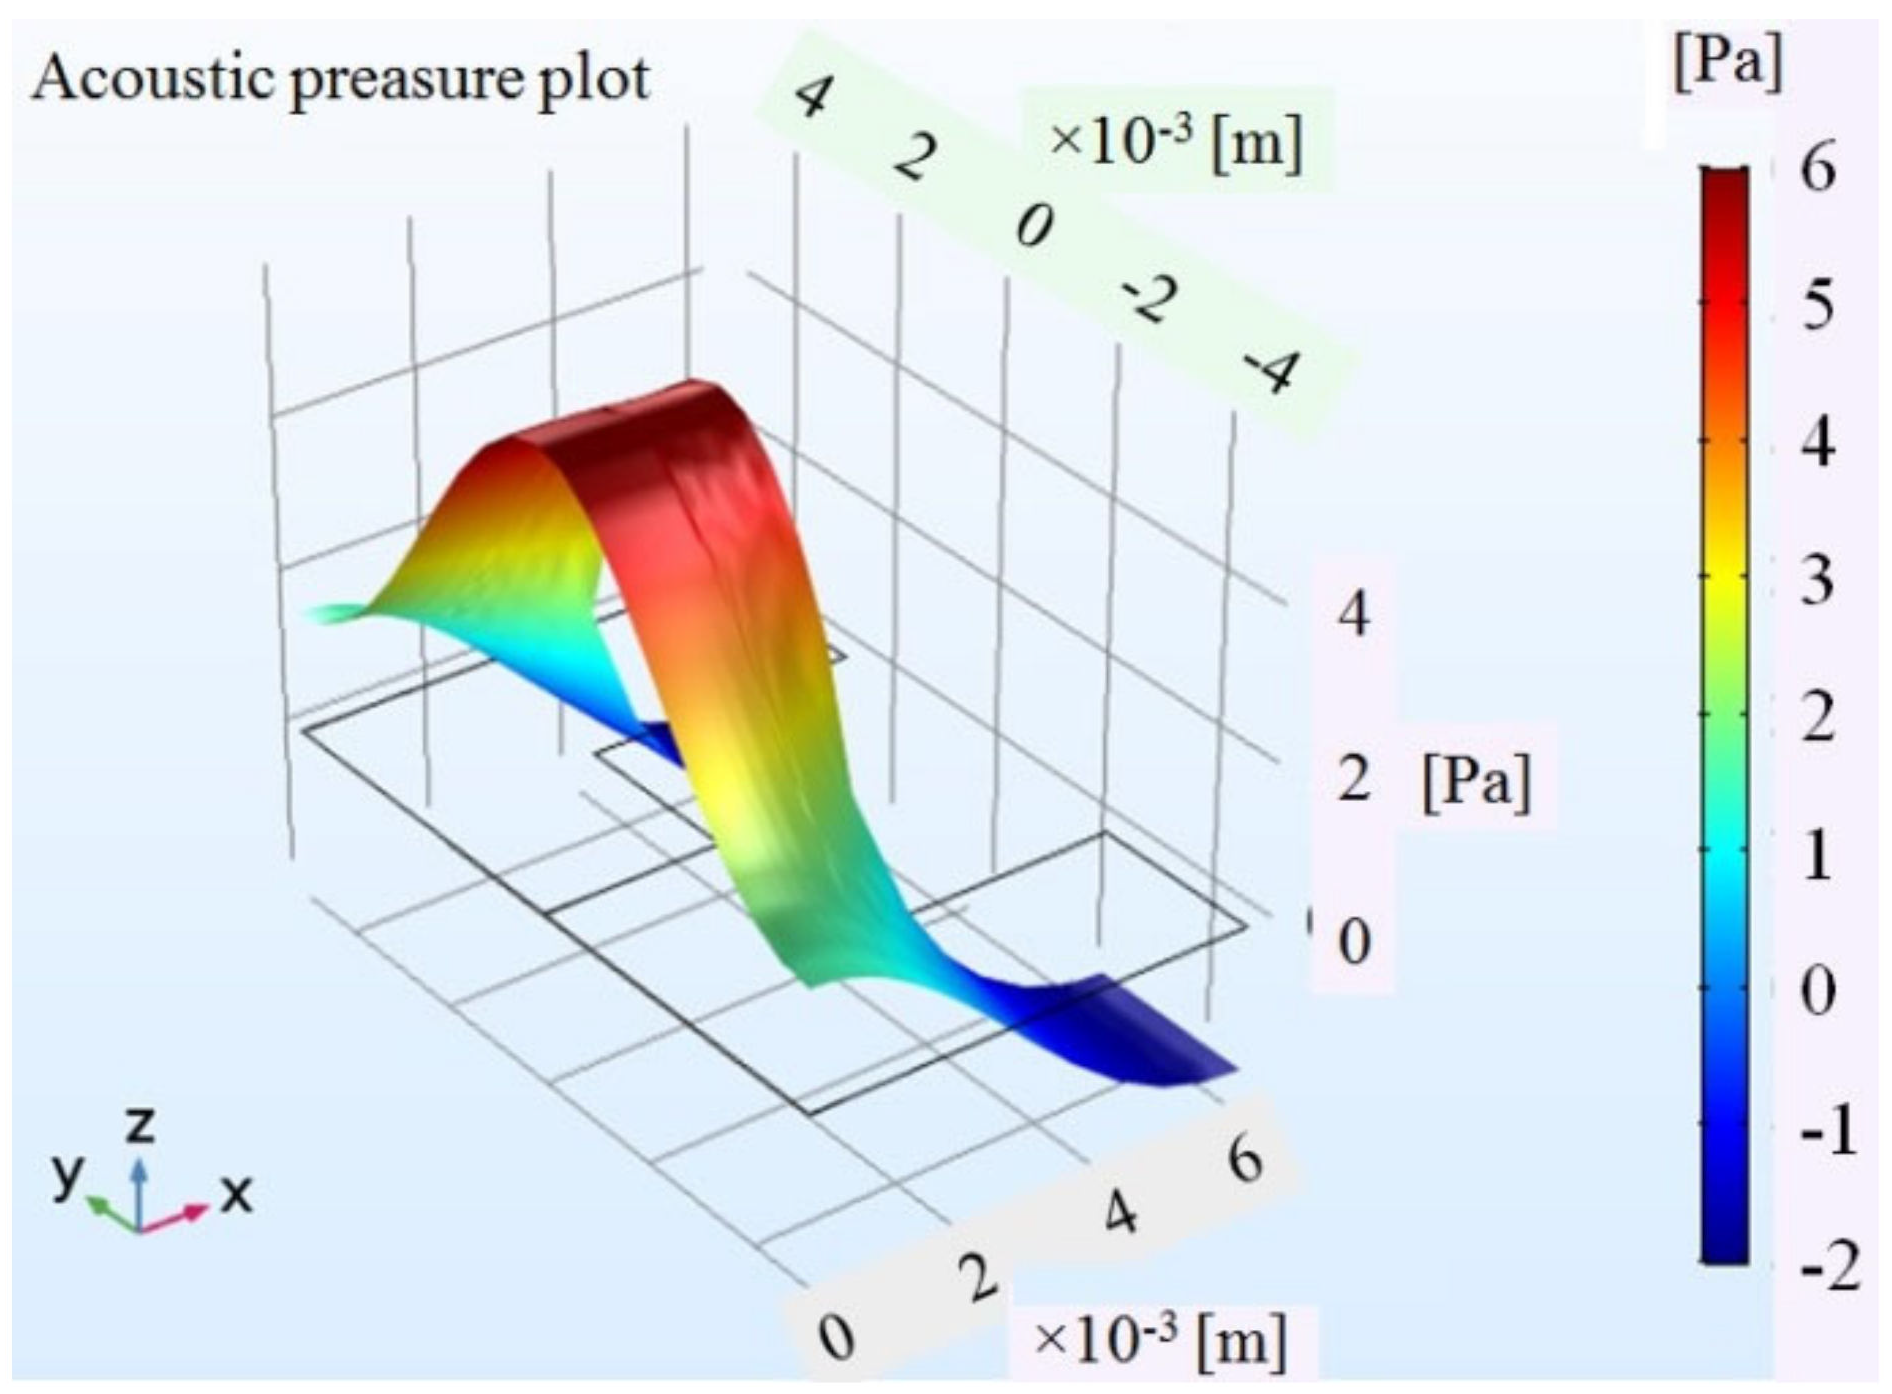
3.1. Acooustic Pressure
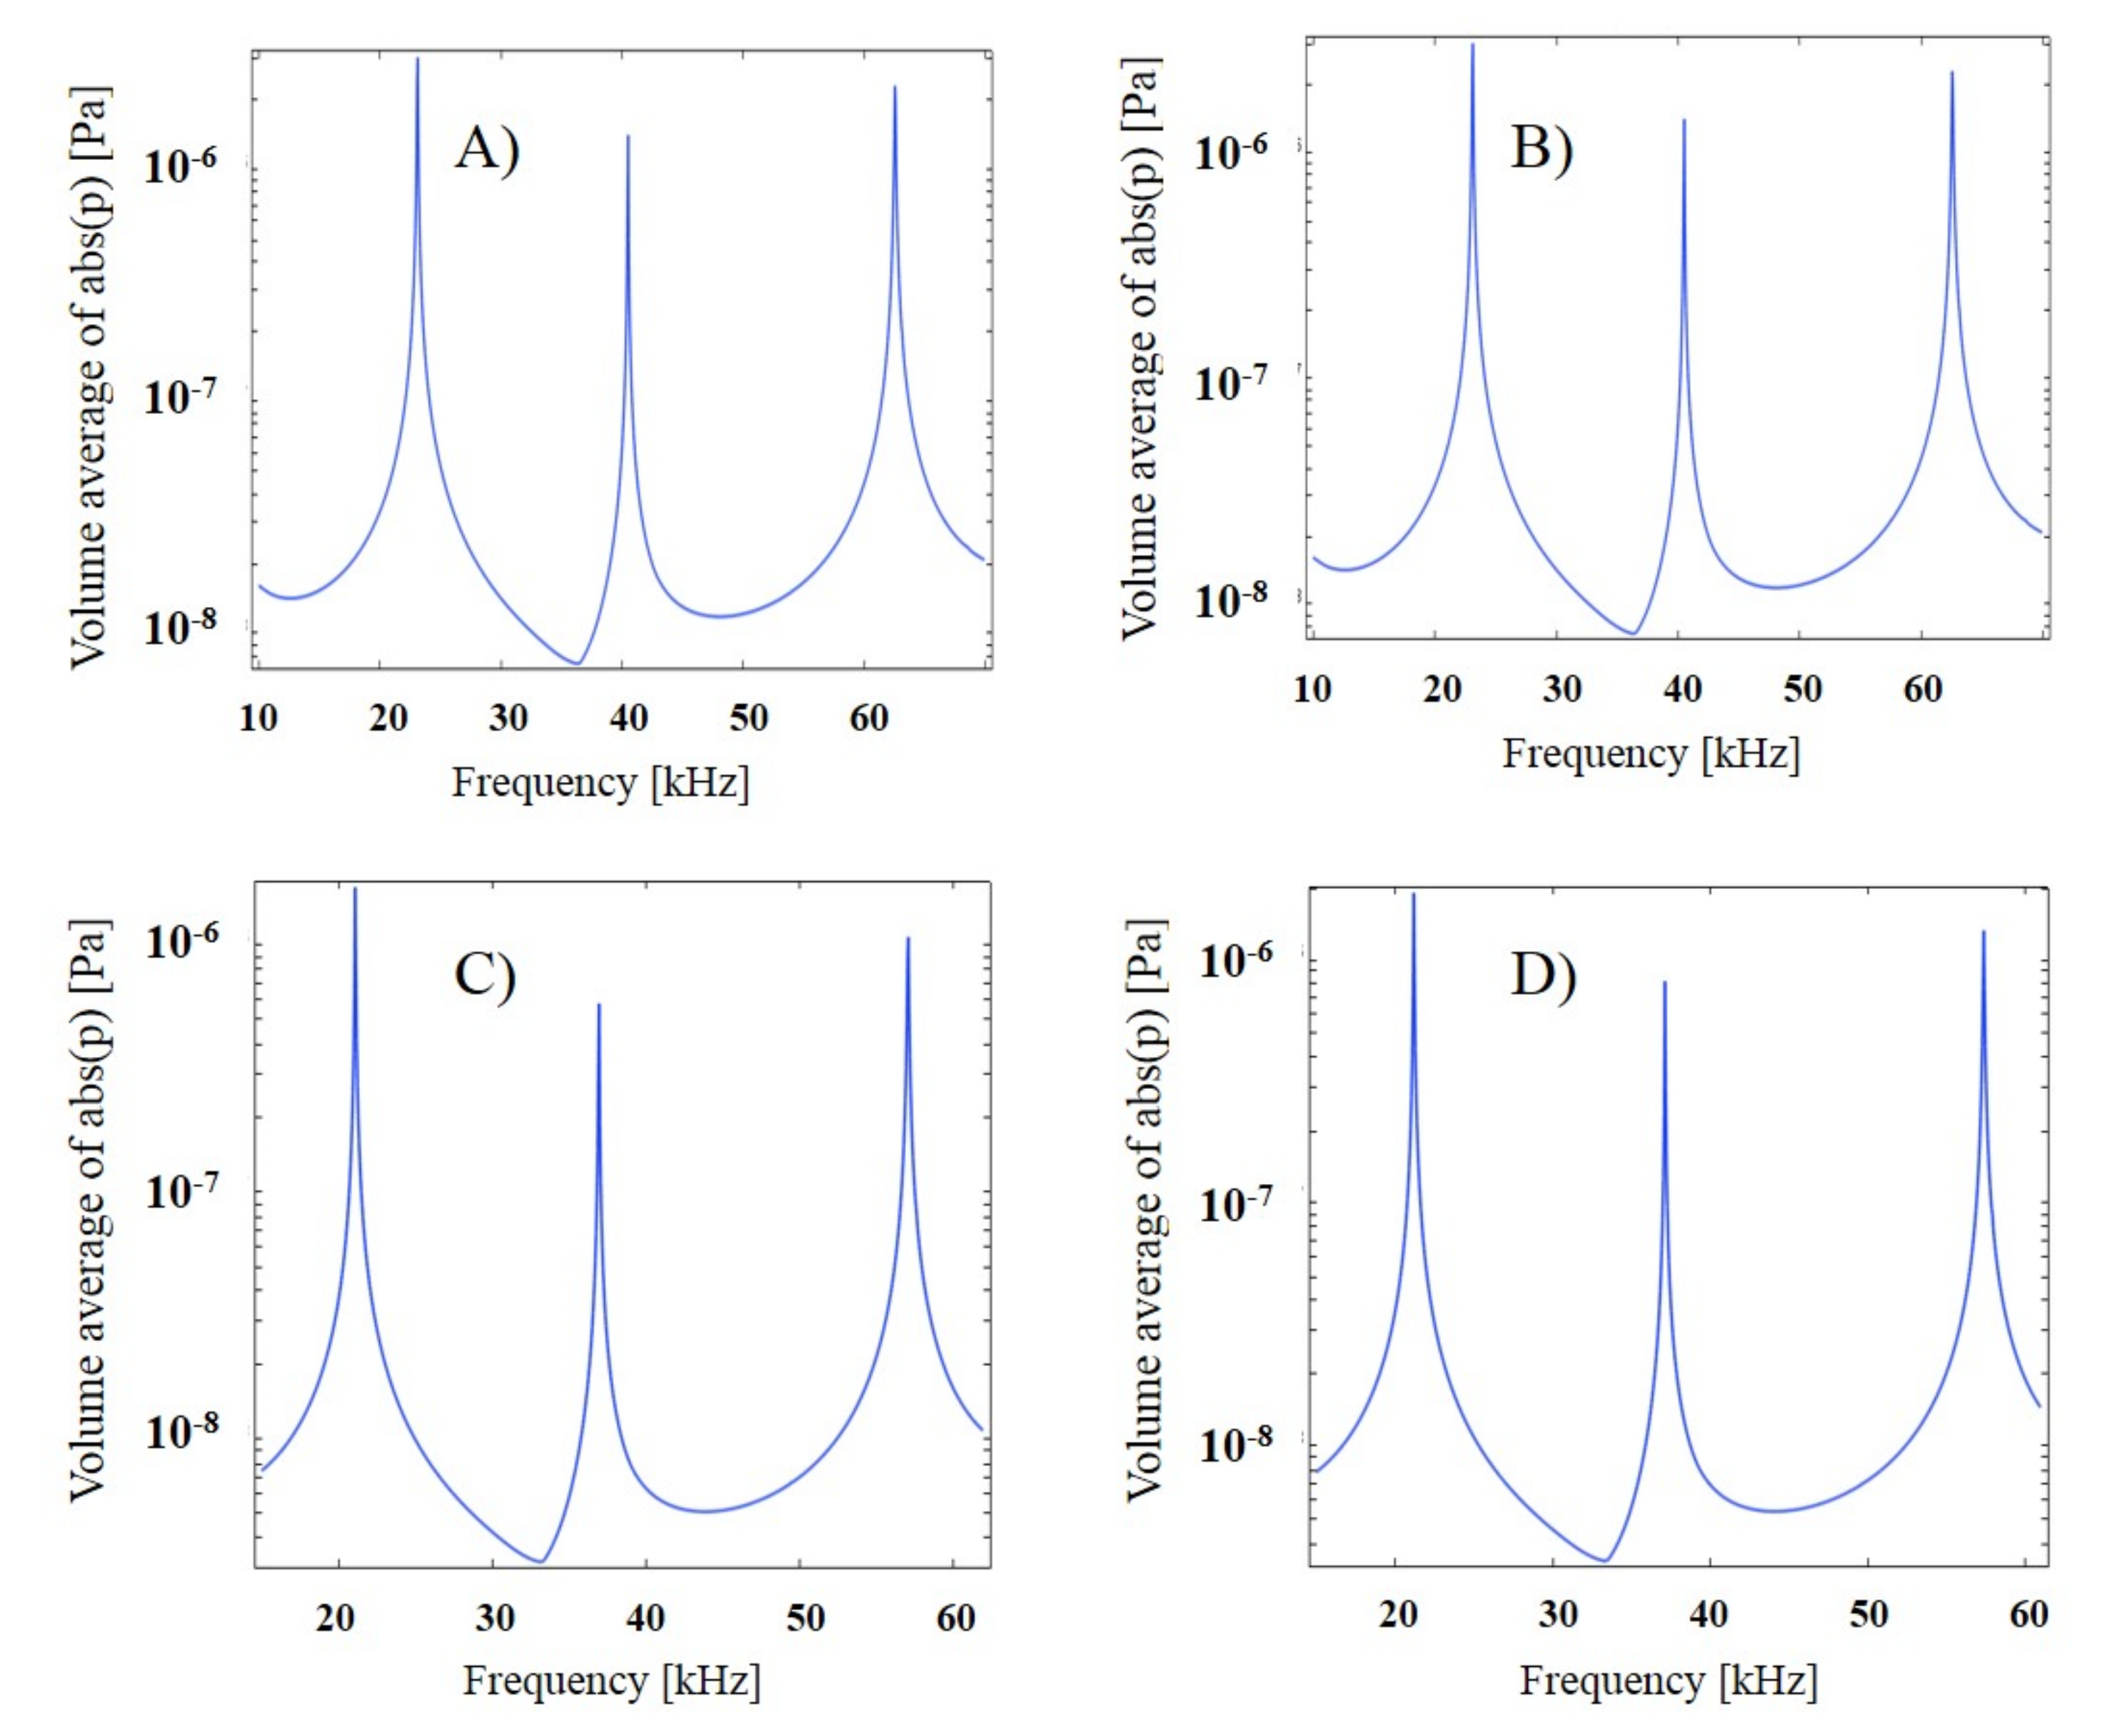
3.2. Frequency Response
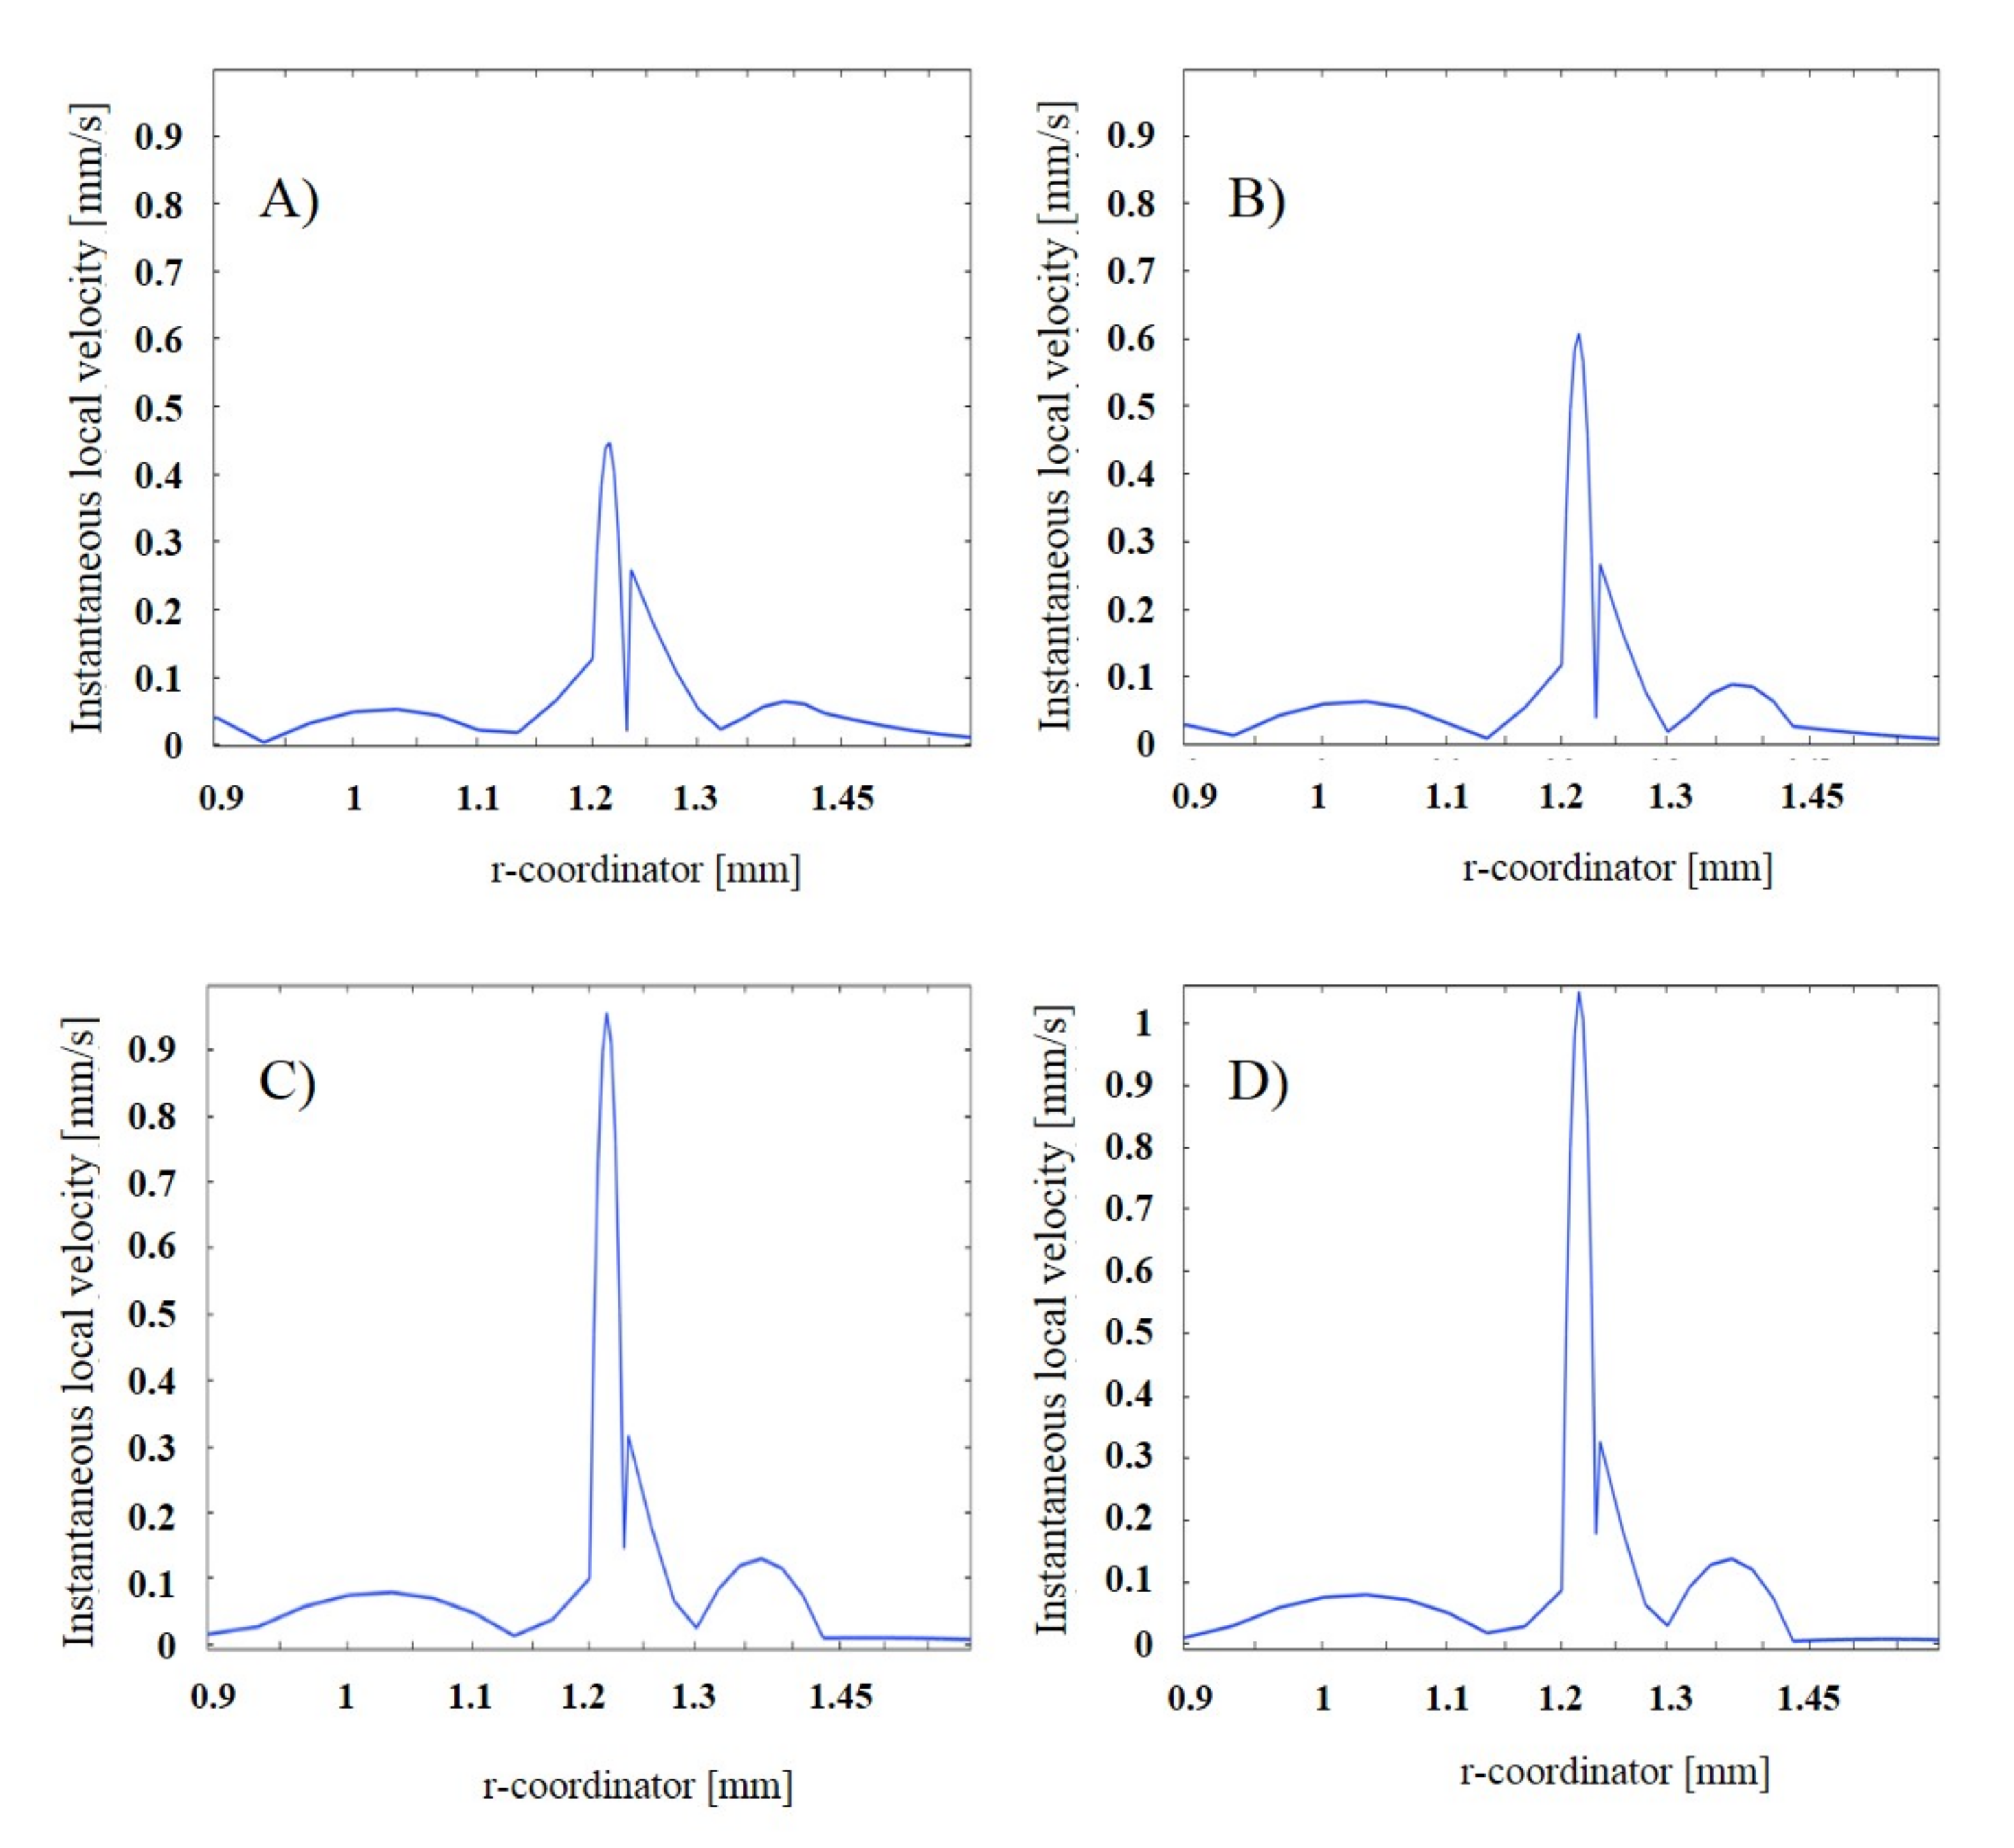
3.3. Acoustic Velocity
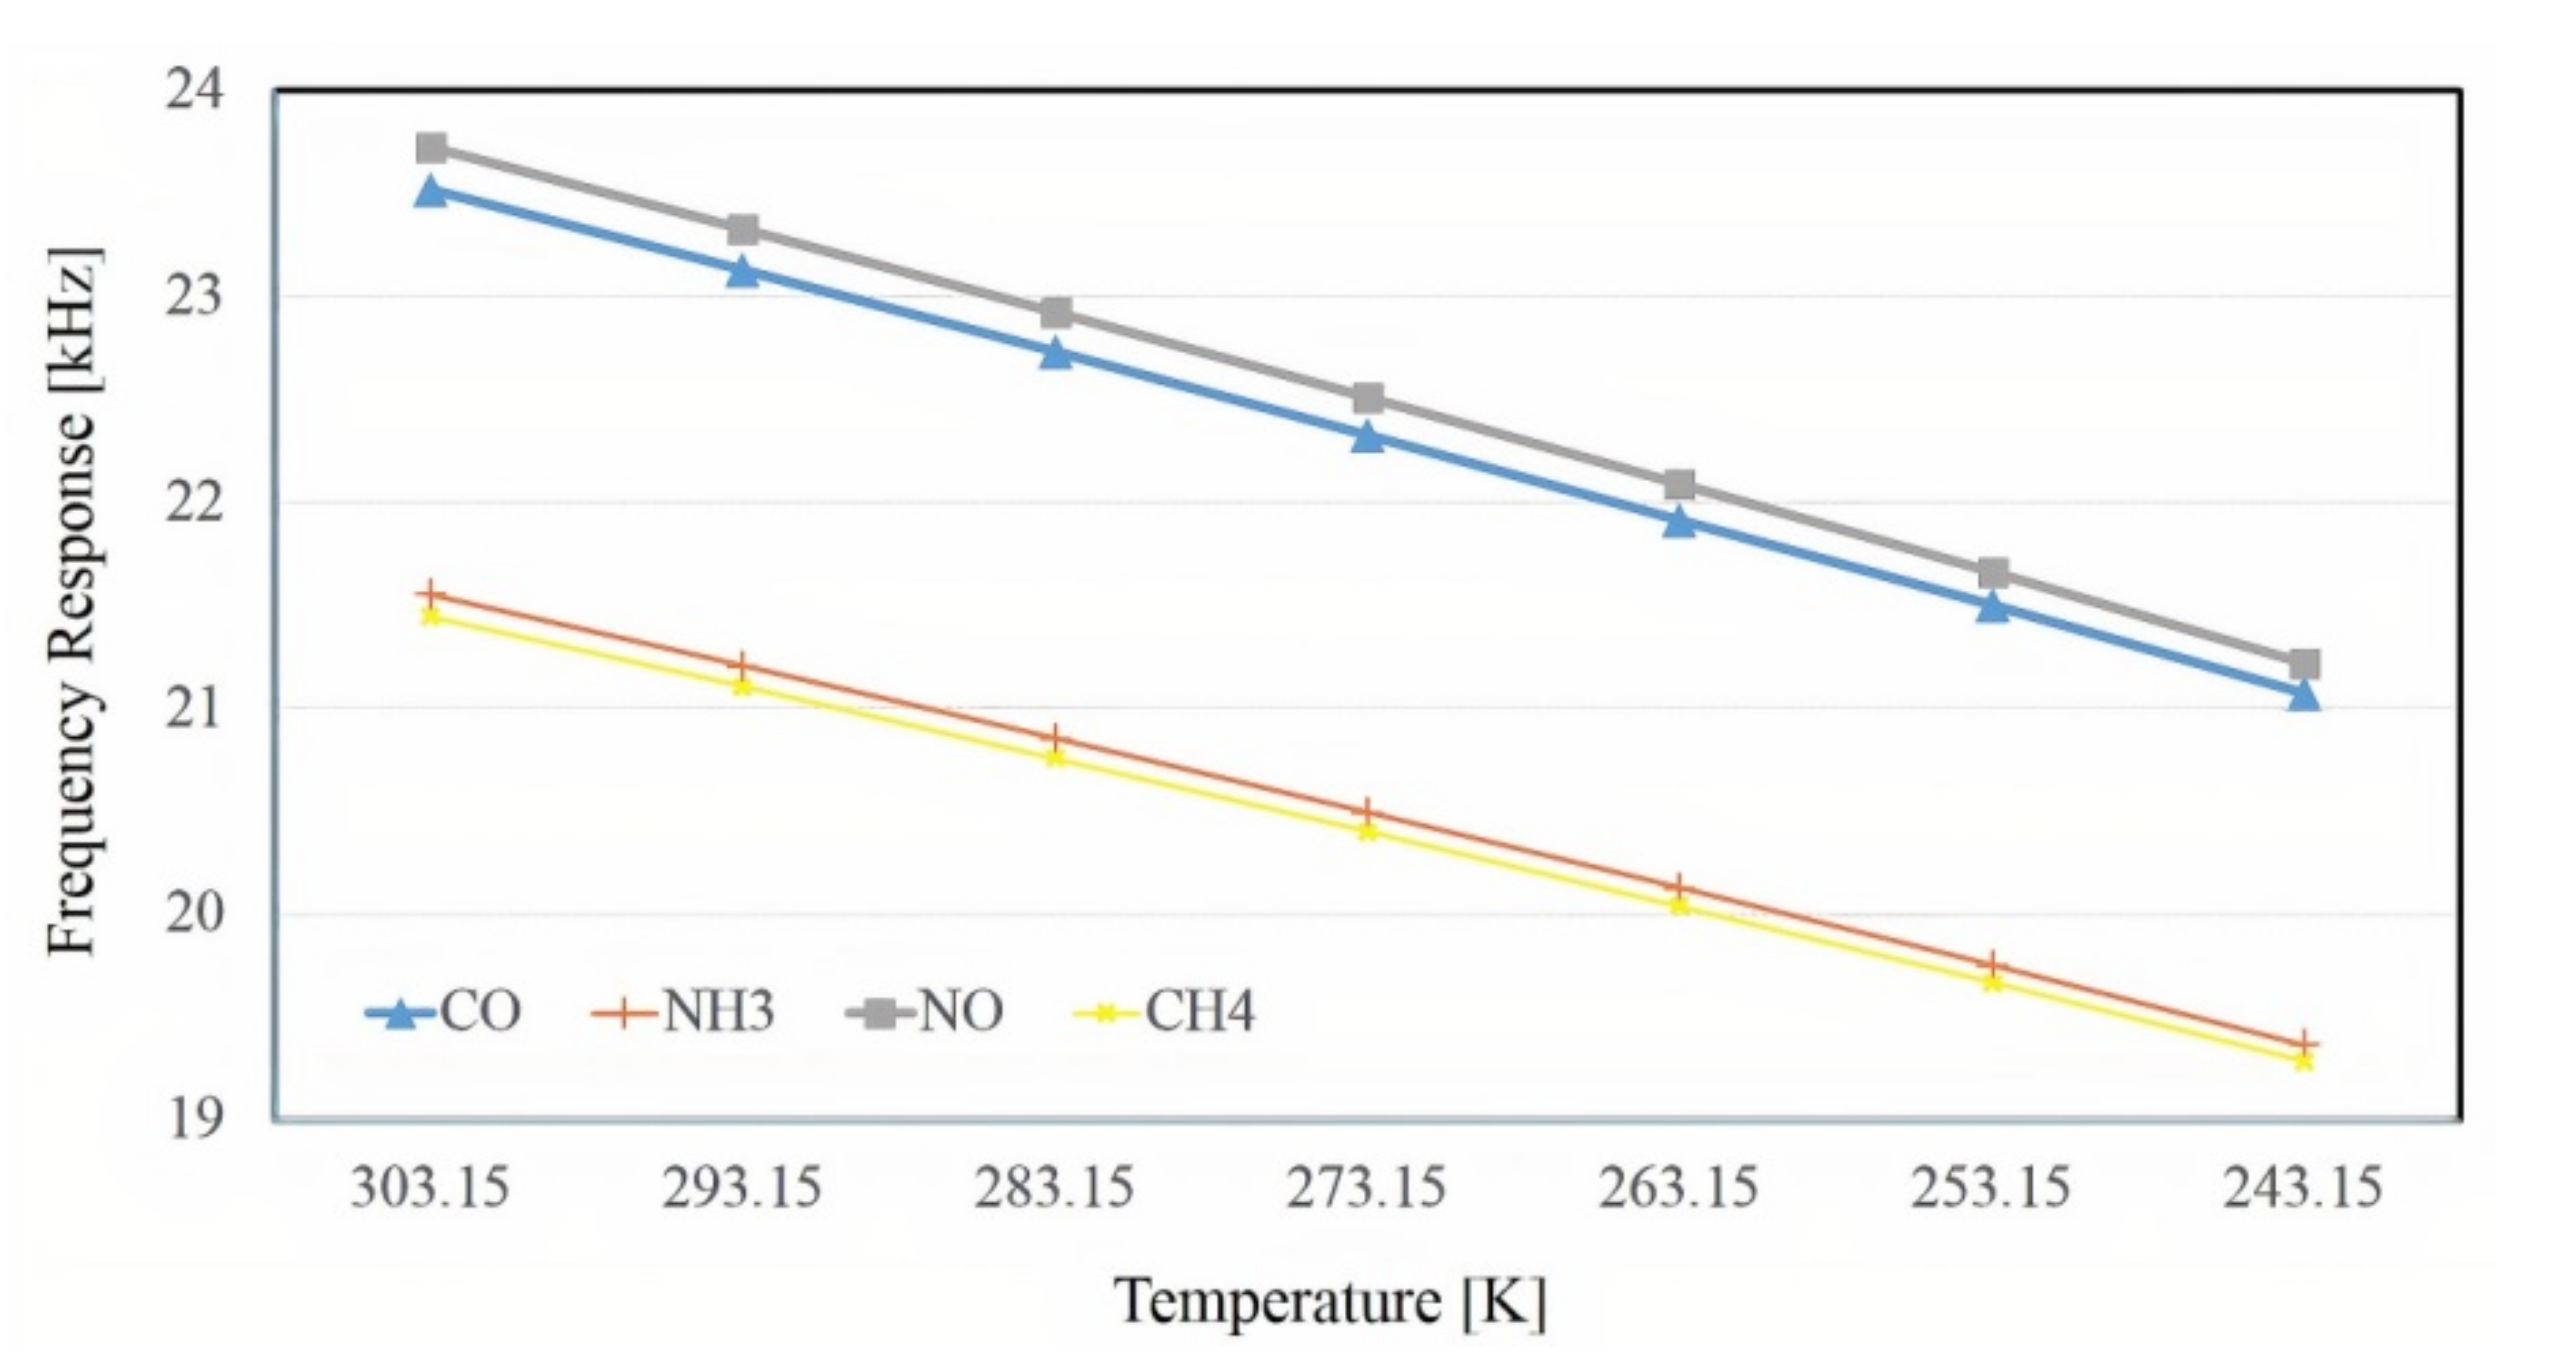
3.4. Frequency Response Changes with Temperature Changes
3.5. Quality Factor
4. Conclusions
Author Contributions
Funding
Institutional Review Board Statement
Informed Consent Statement
Data Availability Statement
Acknowledgments
Conflicts of Interest
References
- Zhao, Y.; Wang, Y.; Liang, C.; Wang, J.; Fang, J.; Zhou, M. Study of Mixed Pollution of Haze and Dust in Jinan Based on LiDAR. Photonics 2022, 9, 144. [Google Scholar] [CrossRef]
- Restaino, S.R.; Wilcox, C.C.; Andrews, J.R.; Santiago, F.; Martinez, T. Session V. Wavefront sensors, control systems and strategies.-Test Bed Systems for AO. In Proceedings of the 8th International Workshop on Adaptive Optics for Industry and Medicine, Padova, Italy, 3–10 July 2020. [Google Scholar]
- Yuan, Q.; Mirzajani, H.; Evans, B.; Greenbaum, E.; Wu, J. A disposable bulk-acoustic-wave microalga trapping device for real-time water monitoring. Sens. Actuators B Chem. 2020, 304, 127388. [Google Scholar] [CrossRef]
- Korwan, D.; Bevilacqua, R.; Restaino, S.; Bobak, J.; Santiago, F.; Hoppel, K.; Bailey, S.; Noel, S.; Carstins, J.; Randall, C.; et al. The GLO (GFCR Limb Occultation) sensor: A new sensor concept for upper troposphere and lower stratosphere (UTLS) composition and transport studies. In CubeSats and SmallSats for Remote Sensing III; SPIE: Bellingham, WA, USA, 2019; Volume 11131, pp. 154–163. [Google Scholar]
- Fulton, L.; Lah, O.; Cuenot, F. Transport Pathways for Light Duty Vehicles: Towards a 2 Scenario. Sustainability 2013, 5, 1863–1874. [Google Scholar] [CrossRef] [Green Version]
- Geiser, P.; Avetisov, V.; Espinoza-Nava, L.; Menegazzo, N.; Kaspersen, P. Continuous Emission Monitoring of Tetrafluoromethane Using Quantum Cascade Lasers. Photonics 2016, 3, 16. [Google Scholar] [CrossRef] [Green Version]
- Gadedjisso-Tossou, K.S.; Stoychev, L.I.; Mohou, M.A.; Cabrera, H.; Niemela, J.; Danailov, M.B.; Vacchi, A. Cavity ring-down spectros-copy for molecular trace gas detection using a pulsed DFB QCL emitting at 6.8 µm. Photonics 2020, 7, 74. [Google Scholar] [CrossRef]
- Montoya, O.D.; Gil-González, W.; Hernández, J.C. Optimal selection and location of bess systems in medium-voltage rural dis-tribution networks for minimizing greenhouse gas emissions. Electronics 2020, 9, 2097. [Google Scholar] [CrossRef]
- El Shamy, R.S.; Swillam, M.A.; ElRayany, M.M.; Sultan, A.; Li, X. Compact Gas Sensor Using Silicon-on-Insulator Loop-Terminated Mach–Zehnder Interferometer. Photonics 2021, 9, 8. [Google Scholar] [CrossRef]
- Li, L.; Hao, H. Simulated Study of High-Sensitivity Gas Sensor with a Metal-PhC Nanocavity via Tamm Plasmon Polaritons. Photonics 2021, 8, 506. [Google Scholar] [CrossRef]
- Lopatin, O.P. Gas-diesel engine exhaust gas recirculation. IOP Conf. Ser. Earth Environ. Sci. 2020, 548, 062023. [Google Scholar] [CrossRef]
- Soh, A.C.; Hassan, M.K.; Ishak, A.J. Vehicle gas leakage detector. Pac. J. Sci. Technol. 2010, 11, 66–76. [Google Scholar]
- Pungjunun, K.; Chaiyo, S.; Praphairaksit, N.; Siangproh, W.; Ortner, A.; Kalcher, K.; Chailapakul, O.; Mehmeti, E. Electrochemical detection of NOx gas based on disposable paper-based analytical device using a copper nanoparticles-modified screen-printed graphene electrode. Biosens. Bioelectron. 2019, 143, 111606. [Google Scholar] [CrossRef] [PubMed]
- Cihelka, J.; Horká, V.; Civis, S. Diode laser photoacoustic detection of automobile exhaust emissions. In Proceedings of the 2005 7th International Conference Transparent Optical Networks, Barcelona, Spain, 7 July 2005; Volume 1, pp. 349–354. [Google Scholar]
- Wei, S.; Ding, T.; Zhang, S.; Tao, P.; Chen, J. Analysis of vehicle CO and NOx road emissions test based on PEMS. Energy Sources Part A Recover. Util. Environ. Eff. 2020, 1–15. [Google Scholar] [CrossRef]
- Tucki, K.; Mruk, R.; Orynycz, O.; Botwińska, K.; Gola, A.; Bączyk, A. Toxicity of Exhaust Fumes (CO, NOx) of the Compression-Ignition (Diesel) Engine with the Use of Simulation. Sustainability 2019, 11, 2188. [Google Scholar] [CrossRef] [Green Version]
- Schifter, I.; Díaz, L.; Sánchez-Reyna, G.; González-Macías, C.; González, U.; Rodríguez, R. Influence of gasoline olefin and aromatic content on exhaust emissions of 15% ethanol blends. Fuel 2020, 265, 116950. [Google Scholar] [CrossRef]
- Zhang, M.; Shi, L.; Ma, X.; Zhao, Y.; Gao, L. Study on Comprehensive Assessment of Environmental Impact of Air Pollution. Sustainability 2021, 13, 476. [Google Scholar] [CrossRef]
- Mohebbifar, M. The laser power effect on the performance of gas leak detector based on laser photo-acoustic spectroscopy. Sens. Actuators A Phys. 2020, 305, 111914. [Google Scholar] [CrossRef]
- Rück, T.; Bierl, R.; Matysik, F.M. Low-cost photoacoustic NO2 trace gas monitoring at the pptV-level. Sens. Actuators A Phys. 2017, 263, 501–509. [Google Scholar] [CrossRef]
- Dumitras, D.C.; Petrus, M.; Bratu, A.-M.; Popa, C. Applications of Near Infrared Photoacoustic Spectroscopy for Analysis of Human Respiration: A Review. Molecules 2020, 25, 1728. [Google Scholar] [CrossRef]
- Schmithausen, A.J.; Trimborn, M.; Büscher, W. Methodological comparison between a novel automatic sampling system for gas chromatography versus photoacoustic spectroscopy for measuring greenhouse gas emissions under field con-ditions. Sensors 2016, 16, 1638. [Google Scholar] [CrossRef] [Green Version]
- Hassouna, M.; Robin, P.; Charpiot, A.; Edouard, N.; Méda, B. Infrared photoacoustic spectroscopy in animal houses: Effect of non-compensated interferences on ammonia, nitrous oxide and methane air concentrations. Biosyst. Eng. 2013, 114, 318–326. [Google Scholar] [CrossRef]
- Zelinger, Z.; Střižı́k, M.; Kubát, P.; Jaňour, Z.; Berger, P.; Černý, A.; Engst, P. Laser remote sensing and photoacoustic spectrometry applied in air pollution investigation. Opt. Lasers Eng. 2004, 42, 403–412. [Google Scholar] [CrossRef]
- Yang, T.; Chen, W.; Wang, P. A review of all-optical photoacoustic spectroscopy as a gas sensing method. Appl. Spectrosc. Rev. 2020, 56, 143–170. [Google Scholar] [CrossRef]
- Marinov, D.; Sigrist, M.W. Monitoring of road-traffic emissions with a mobile photoacoustic system Dedicated to Professor Silvia Braslavsky to mark her great contribution to photochemistry and photobiology particularly in the field of photothermal methods. Photochem. Photobiol. Sci. 2003, 2, 774–778. [Google Scholar] [CrossRef]
- Routley, V. Motor vehicle exhaust gas suicide: Review of countermeasures. Crisis 2007, 28, 28–35. [Google Scholar] [CrossRef]
- Dayton, D.C.; Gonglewski, J.D.; Browne, S.L.; Restaino, S.R. MEMS adaptive optics: Field demonstration. In Optics in Atmospheric Propagation and Adaptive Systems V; SPIE: Bellingham, WA, USA , 2003; Volume 4884, pp. 186–195. [Google Scholar]
- Parvitte, B.; Risser, C.; Vallon, R.; Zeninari, V. Complete characterization of trace gas photoacoustic sensors using a finite element method. In Propagation Through and Characterization of Distributed Volume Turbulence; Optica Publishing Group: Washington, DC, USA, 2014; p. JTu4A-32. [Google Scholar]
- Alimujiang, A.; Jiang, P. Synergy and co-benefits of reducing CO2 and air pollutant emissions by promoting electric vehicles—A case of Shanghai. Energy Sustain. Dev. 2020, 55, 181–189. [Google Scholar] [CrossRef]
- Vafaie, R.H.; Nojavan, S.; Jermsittiparsert, K. Designing a miniaturized photoacoustic sensor for detecting hydrogen gas. Int. J. Hydrogen Energy 2020, 45, 21148–21156. [Google Scholar] [CrossRef]
- Mannoor, M.; Hwang, J.; Kang, S. Numerical study of geometrical effects on the performance of an H-type cylindrical resonant photoacoustic cell. J. Mech. Sci. Technol. 2018, 32, 5671–5683. [Google Scholar] [CrossRef]
- Parvitte, B.; Risser, C.; Vallon, R.; Zéninari, V. Quantitative simulation of photoacoustic signals using finite element modelling software. Appl. Phys. A 2013, 111, 383–389. [Google Scholar] [CrossRef]
- Baumann, B.; Kost, B.; Groninga, H.; Wolff, M. Eigenmode analysis of photoacoustic sensors via finite element method. Rev. Sci. Instruments 2006, 77, 044901. [Google Scholar] [CrossRef]
- Duggen, L.; Lopes, N.; Willatzen, M.; Rubahn, H.-G. Finite Element Simulation of Photoacoustic Pressure in a Resonant Photoacoustic Cell Using Lossy Boundary Conditions. Int. J. Thermophys. 2011, 32, 774–785. [Google Scholar] [CrossRef]
- Kost, B.; Baumann, B.; Germer, M.; Wolff, M.; Rosenkranz, M. Numerical shape optimization of photoacoustic resonators. Appl. Phys. A 2010, 102, 87–93. [Google Scholar] [CrossRef]
- Glière, A.; Rouxel, J.; Parvitte, B.; Boutami, S.; Zéninari, V. A Coupled Model for the Simulation of Miniaturized and Integrated Photoacoustic Gas Detector. Int. J. Thermophys. 2013, 34, 2119–2135. [Google Scholar] [CrossRef]
- Firebaugh, S.L.; Jensen, K.F.; Schmidt, M.A. Miniaturization and integration of photoacoustic detection. J. Appl. Phys. 2002, 92, 1555–1563. [Google Scholar] [CrossRef]
- Zhou, S.; Slaman, M.; Iannuzzi, D. Demonstration of a highly sensitive photoacoustic spectrometer based on a miniaturized all-optical detecting sensor. Opt. Express 2017, 25, 17541. [Google Scholar] [CrossRef] [PubMed]
- Li, J.; Chen, W.; Yu, B. Recent Progress on Infrared Photoacoustic Spectroscopy Techniques. Appl. Spectrosc. Rev. 2011, 46, 440–471. [Google Scholar] [CrossRef]
- Durantin, C.; Rouxel, J.; Désidéri, J.A.; Gliere, A. Optimization of photoacoustics gas sensor using multifidelity RBF metamodeling. In Proceedings of the VII European Congress on Computational Methods in Applied Sciences and Engineering (ECCOMAS Congress, Crete, Greece, 5–10 June 2016. [Google Scholar]
- Cai, Y.; Arsad, N.; Li, M.; Wang, Y. Buffer structure optimization of the photoacoustic cell for trace gas detection. Optoelectron. Lett. 2013, 9, 233–237. [Google Scholar] [CrossRef]
- Köhring, M.; Böttger, S.; Willer, U.; Schade, W. Temperature effects in tuning fork enhanced interferometric photoacoustic spec-troscopy. Opt. Express 2013, 21, 20911–20922. [Google Scholar] [CrossRef]
- Ishaku, L.; Hutson, D. A Resonant Photoacoustic CO 2 Sensor Based on MID-IR LED and MEMS Microphone Technology Op-erating at 4.3 µM. Innov. Syst. Des. Eng. 2016, 7. [Google Scholar]
- Bernd Baumann, M.; Kost, B.; Groninga, H. Calculation of Quality Factors and Amplitudes of Photoacoustic Resonators. Available online: https://www.academia.edu/download/42648873/Calculation_of_Quality_Factors_and_Ampli20160213-7343-wzqbds.pdf (accessed on 2 July 2022).
- El-Busaidy, S.A.S.; Baumann, B.; Wolff, M.; Duggen, L. Modelling of open photoacoustic resonators. Photoacoustics 2020, 18, 100161. [Google Scholar] [CrossRef]
- Yu, Y.; Tian, C.; Wang, Z.; Qian, S.; Yan, C.; Zhang, H. Multicomponent gas detection technology of FDM and TDM based on pho-toacoustic spectroscopy. Appl. Opt. 2021, 60, 838–843. [Google Scholar] [CrossRef]
- Ishaku, L.A.; Hutson, D.; Gibson, D. Temperature effects on photoacoustic carbon dioxide sensor developed using mid-IR LED. In Proceedings of the 2018 IEEE International Instrumentation and Measurement Technology Conference (I2MTC), Houston, TX, USA, 14–17 May 2018; pp. 1–6. [Google Scholar]
- Zhong, C.; Li, H.; Zhou, Y.; Lv, Y.; Chen, J.; Li, Y. Virtual synchronous generator of PV generation without energy storage for frequency support in autonomous microgrid. Int. J. Electr. Power Energy Syst. 2022, 134, 107343. [Google Scholar] [CrossRef]
- Cotterell, M.I.; Ward, G.P.; Hibbins, A.P.; Haywood, J.M.; Wilson, A.; Langridge, J.M. Optimizing the performance of aerosol photoa-coustic cells using a finite element model. Part 1: Method validation and application to single-resonator multipass cells. Aerosol Sci. Technol. 2019, 53, 1107–11027. [Google Scholar] [CrossRef] [Green Version]
- Wei, G.; Fan, X.; Xiong, Y.; Lv, C.; Li, S.; Lin, X. Highly disordered VO2 films: Appearance of electronic glass transition and potential for device-level overheat protection. Appl. Phys. Express 2022, 15, 043002. [Google Scholar] [CrossRef]
- Cernat, R.; Matei, C.; Bratu, A.M.; Popa, C.; Dutu, D.C.; Patachia, M.; Petrus, M.; Banita, S.; Dumitras, D.C. Laser photoacoustic spec-troscopy method for measurements of trace gas concentration from human breath. Rom. Rep. Phys. 2010, 62, 610–616. [Google Scholar]
- Luo, G.; Zhang, H.; Yuan, Q.; Li, J.; Wang, F.-Y. ESTNet: Embedded Spatial-Temporal Network for Modeling Traffic Flow Dynamics. IEEE Trans. Intell. Transp. Syst. 2022, 1–12. [Google Scholar] [CrossRef]


| Gas | First Natural Frequency (kHz) | Second Natural Frequency (kHz) | Third Natural Frequency (khz) | Quality Factor |
|---|---|---|---|---|
| Nitric acid | 23.329 | 40.891 | 63.158 | 33.32 |
| Ammonia | 21.206 | 37.157 | 57.4 | 30.19 |
| Carbon monoxide | 23.131 | 40.538 | 62.617 | 57.827 |
| Methane | 21.106 | 36.985 | 57.133 | 21.1 |
Publisher’s Note: MDPI stays neutral with regard to jurisdictional claims in published maps and institutional affiliations. |
© 2022 by the authors. Licensee MDPI, Basel, Switzerland. This article is an open access article distributed under the terms and conditions of the Creative Commons Attribution (CC BY) license (https://creativecommons.org/licenses/by/4.0/).
Share and Cite
Vafaie, R.H.; Pour, R.S.; Mohammadzadeh, A.; Asad, J.H.; Mosavi, A. Photoacoustic Detection of Pollutants Emitted by Transportation System for Use in Automotive Industry. Photonics 2022, 9, 526. https://doi.org/10.3390/photonics9080526
Vafaie RH, Pour RS, Mohammadzadeh A, Asad JH, Mosavi A. Photoacoustic Detection of Pollutants Emitted by Transportation System for Use in Automotive Industry. Photonics. 2022; 9(8):526. https://doi.org/10.3390/photonics9080526
Chicago/Turabian StyleVafaie, Reza Hadjiaghaie, Roya Shafiei Pour, Ardashir Mohammadzadeh, Jihad H. Asad, and Amir Mosavi. 2022. "Photoacoustic Detection of Pollutants Emitted by Transportation System for Use in Automotive Industry" Photonics 9, no. 8: 526. https://doi.org/10.3390/photonics9080526