The Effect of Non-Uniform Irradiation on Laser Photovoltaics: Experiments and Simulations

Abstract
:1. Introduction
2. Experimental Method and Results
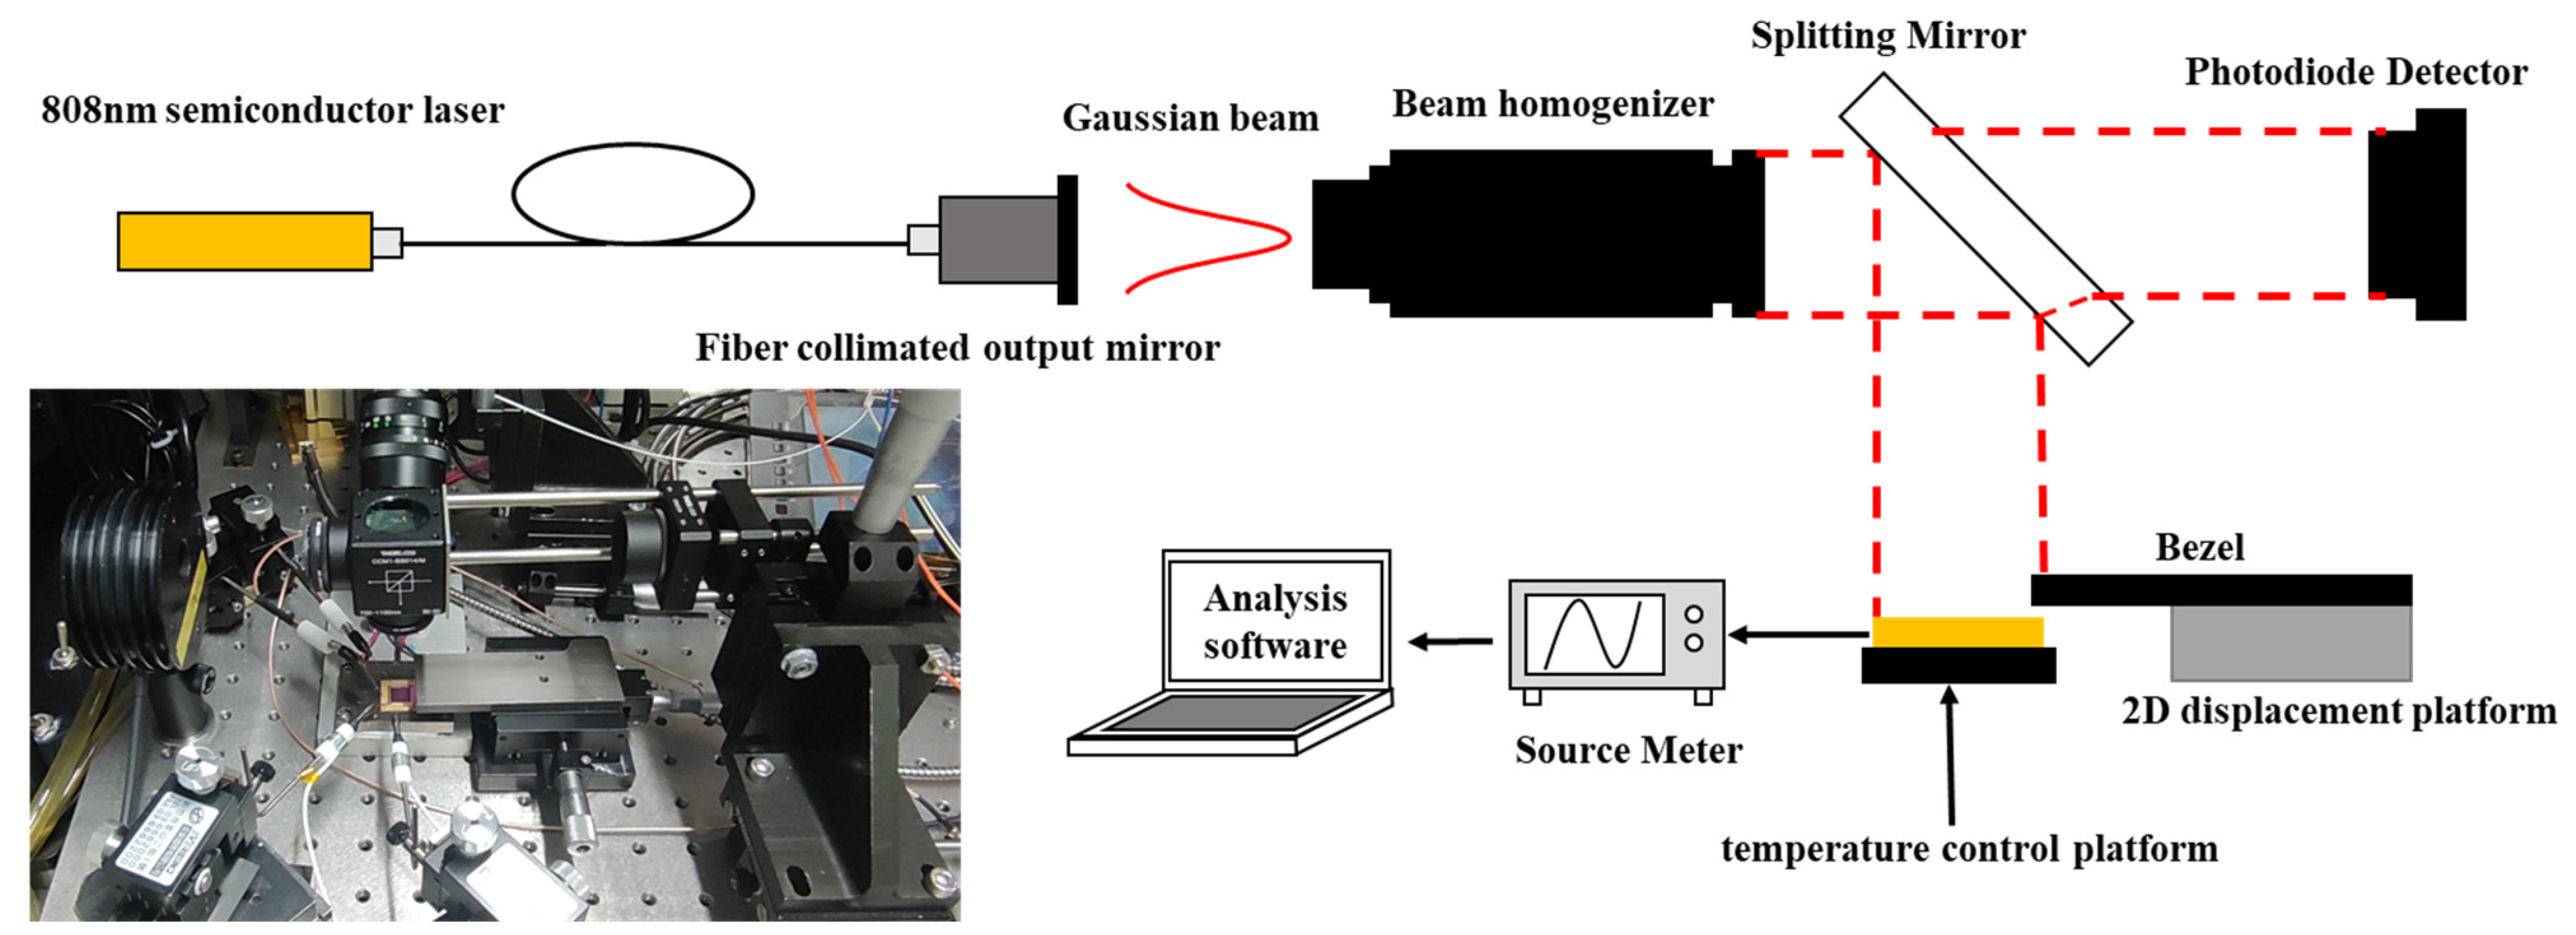
2.1. Experimental Scheme
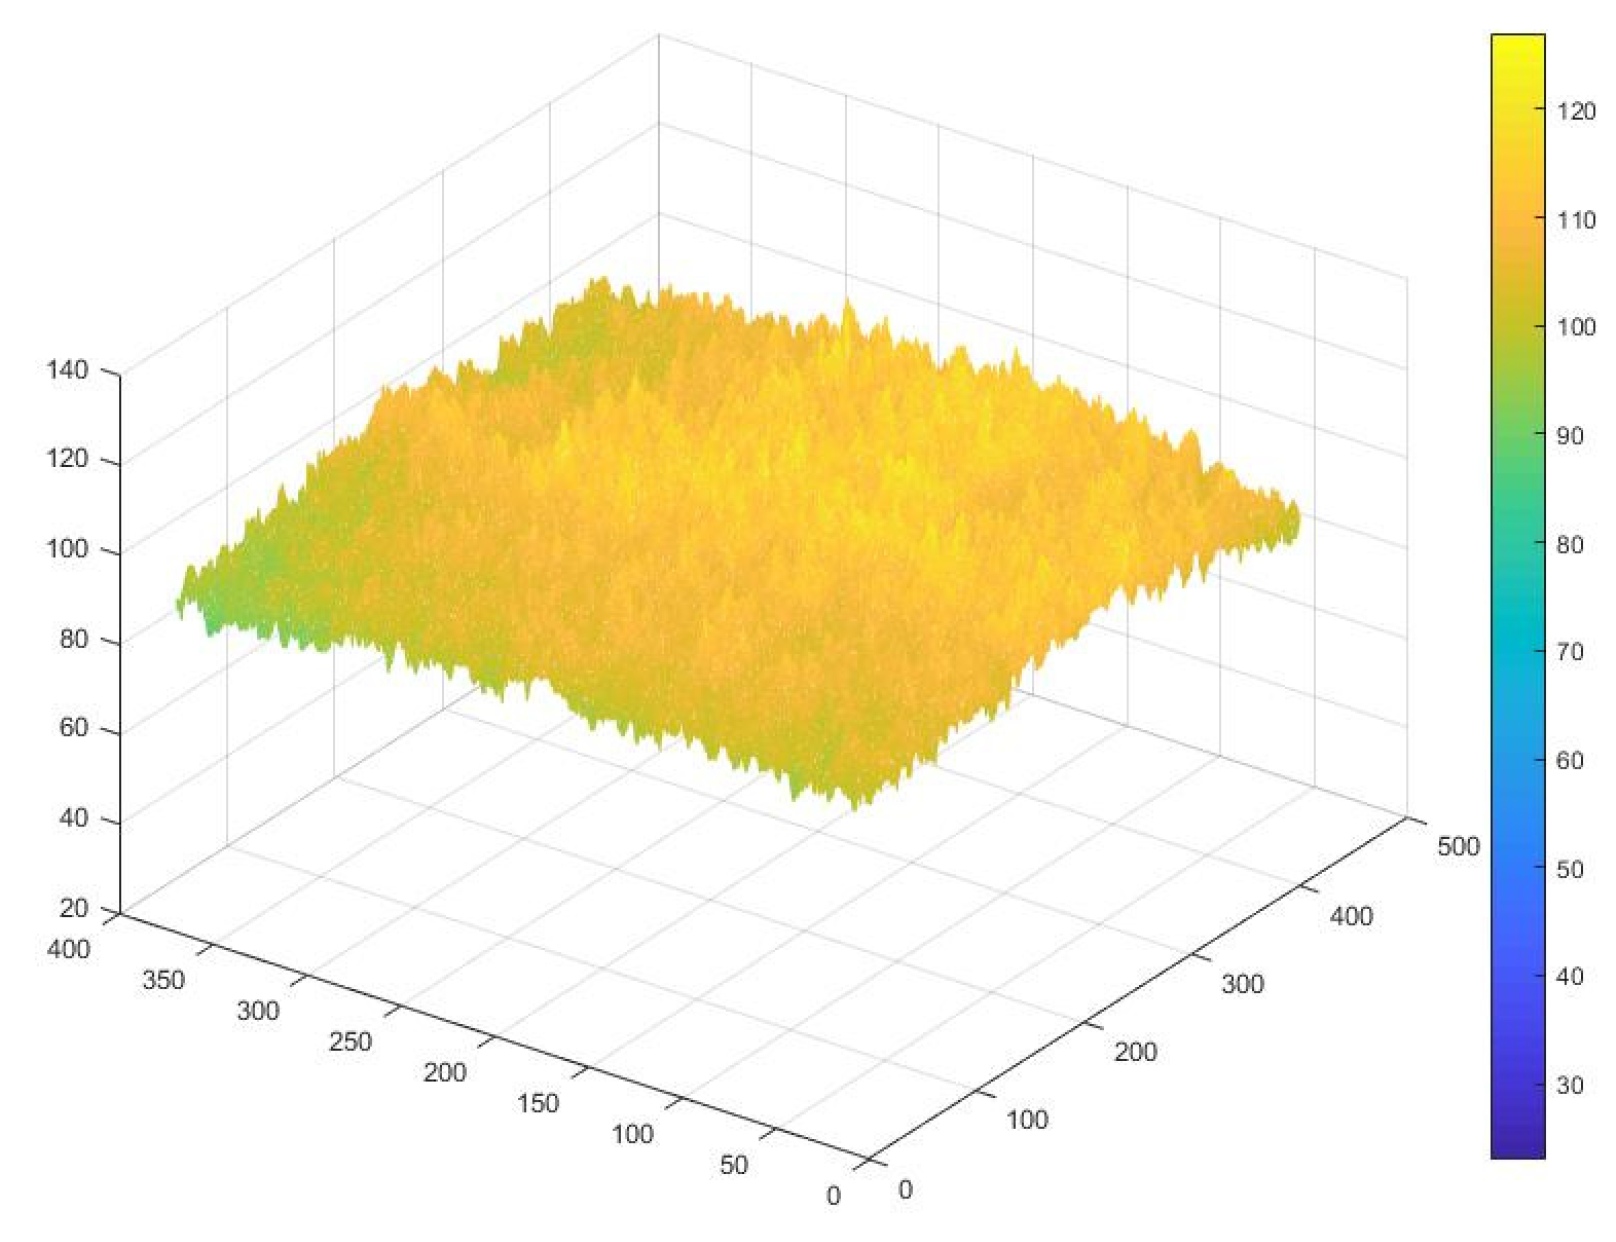
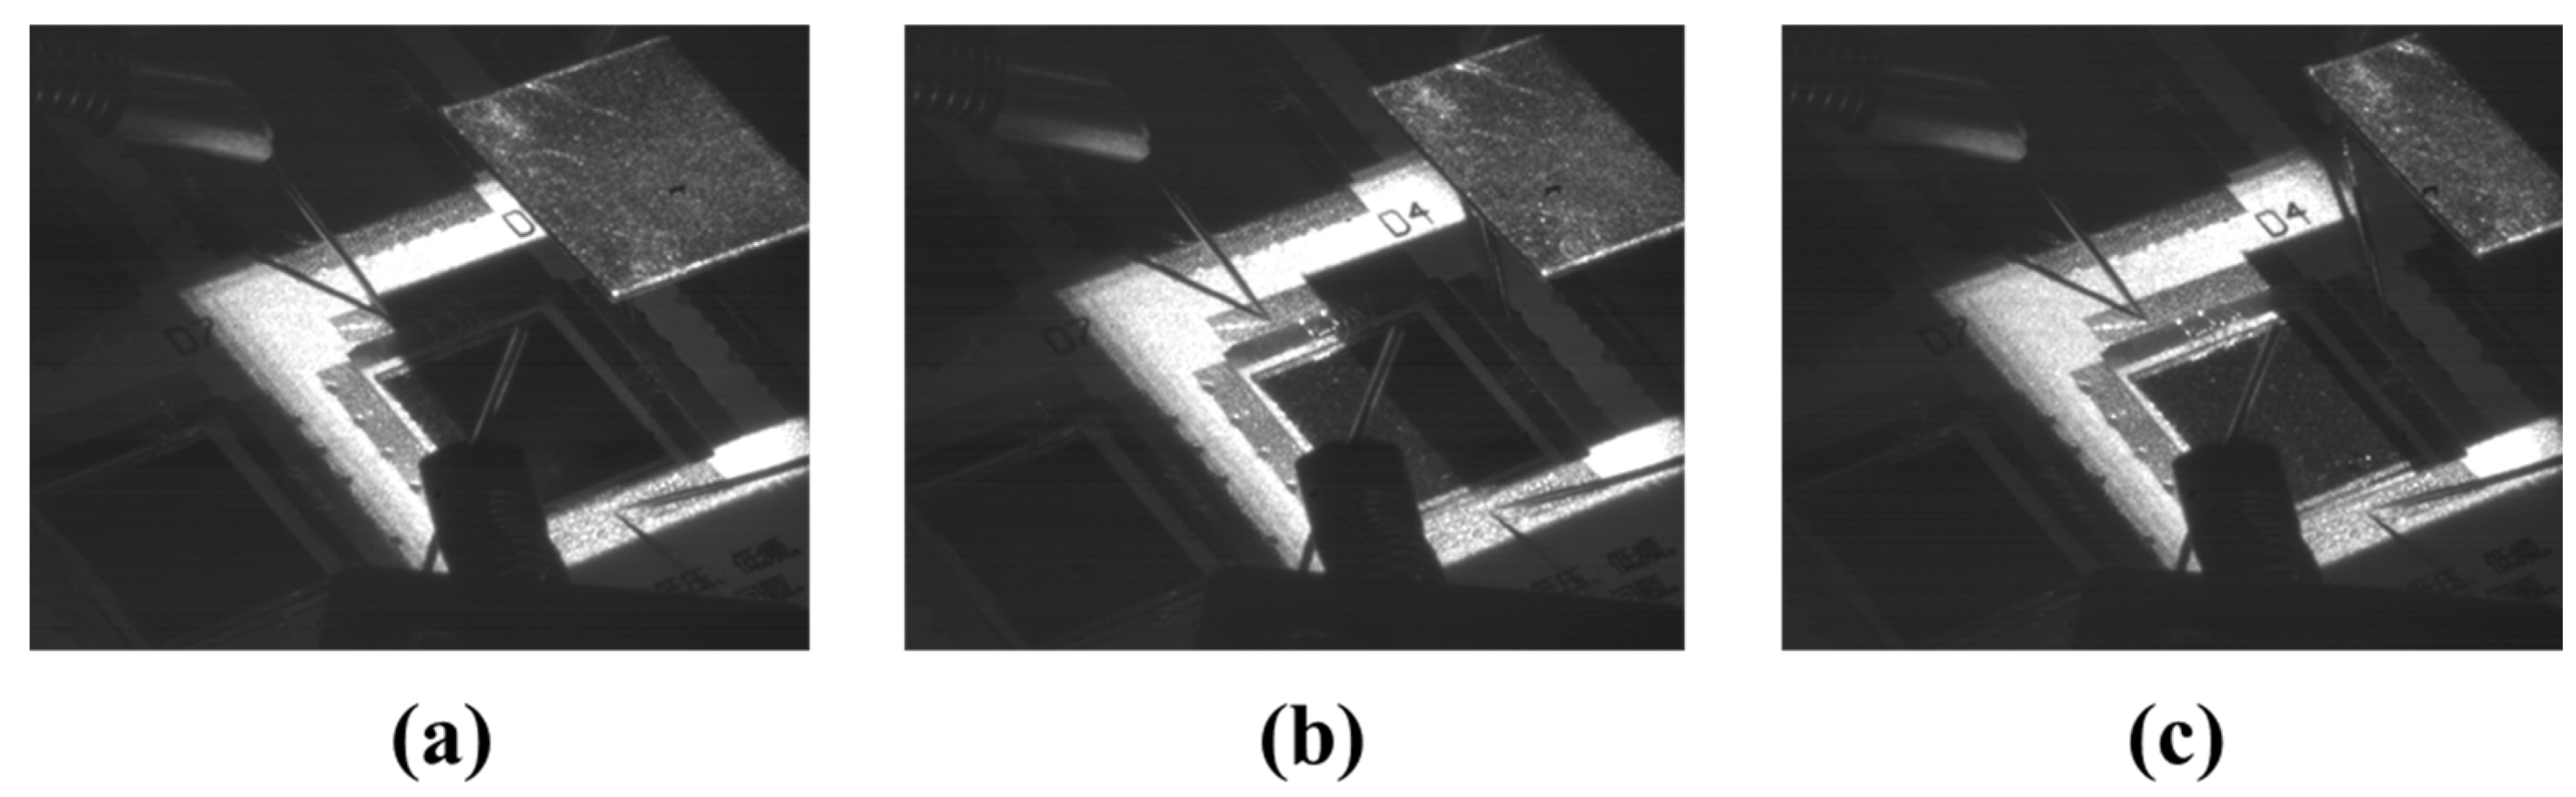
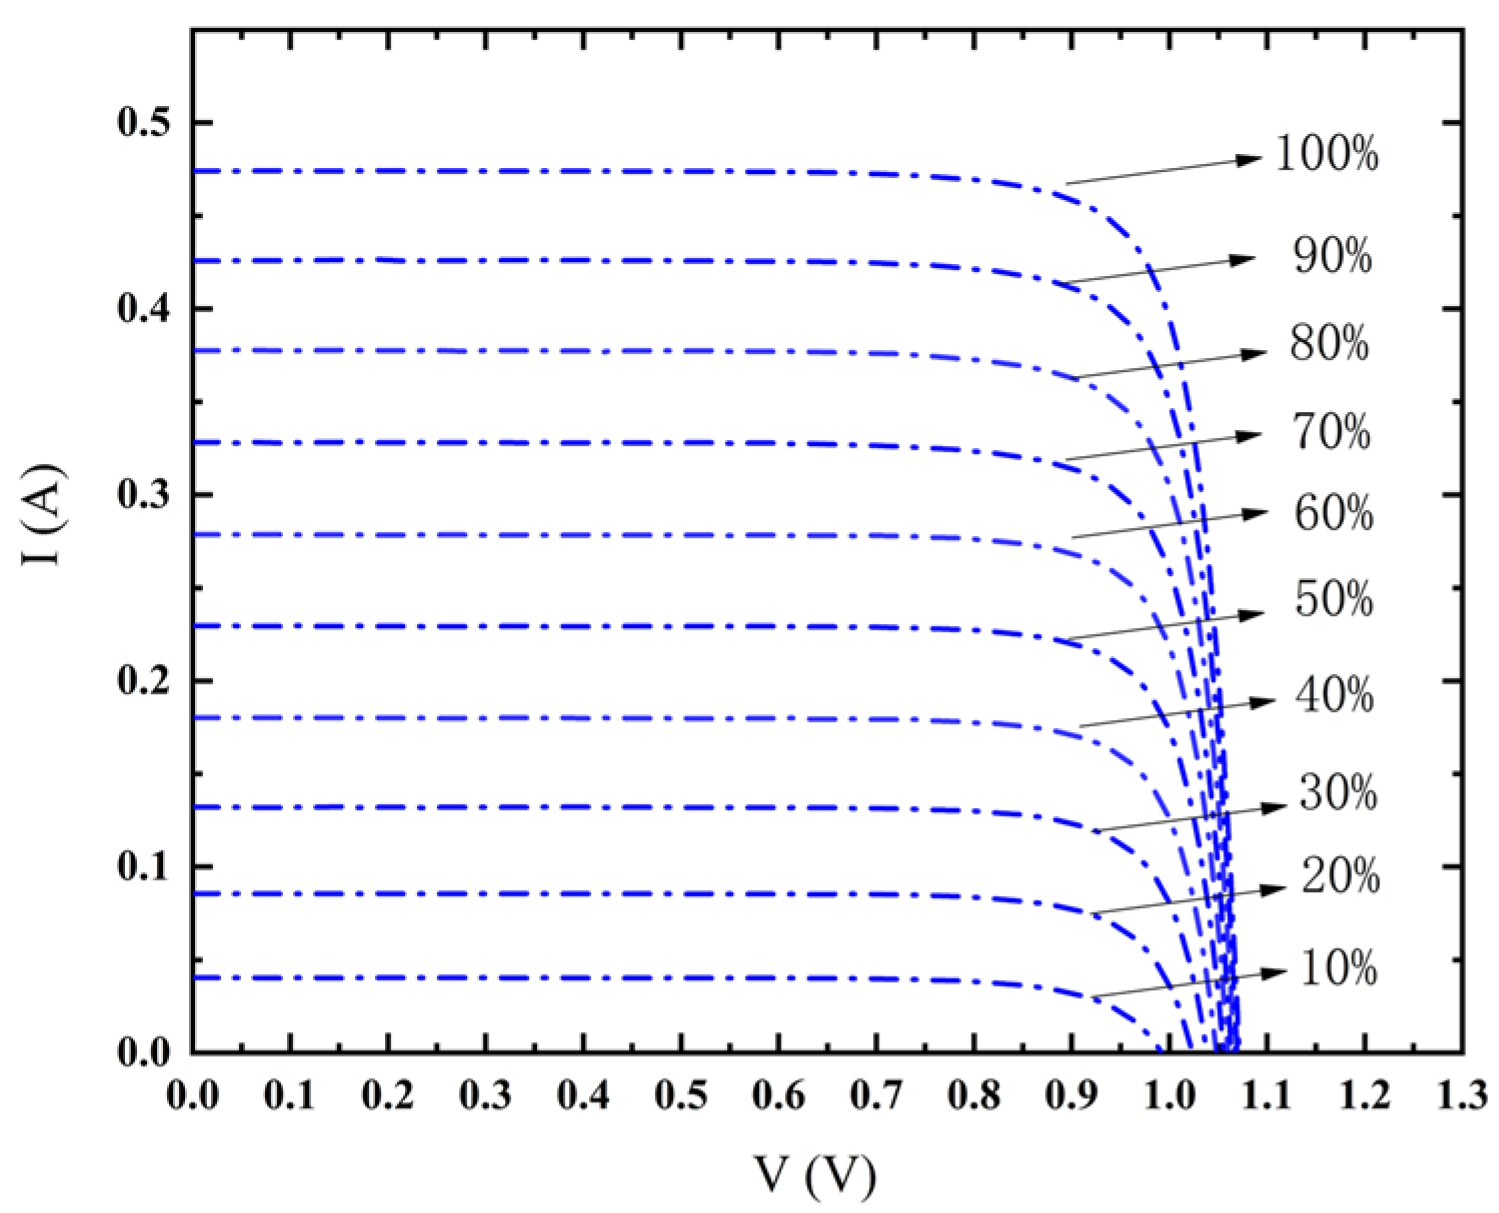
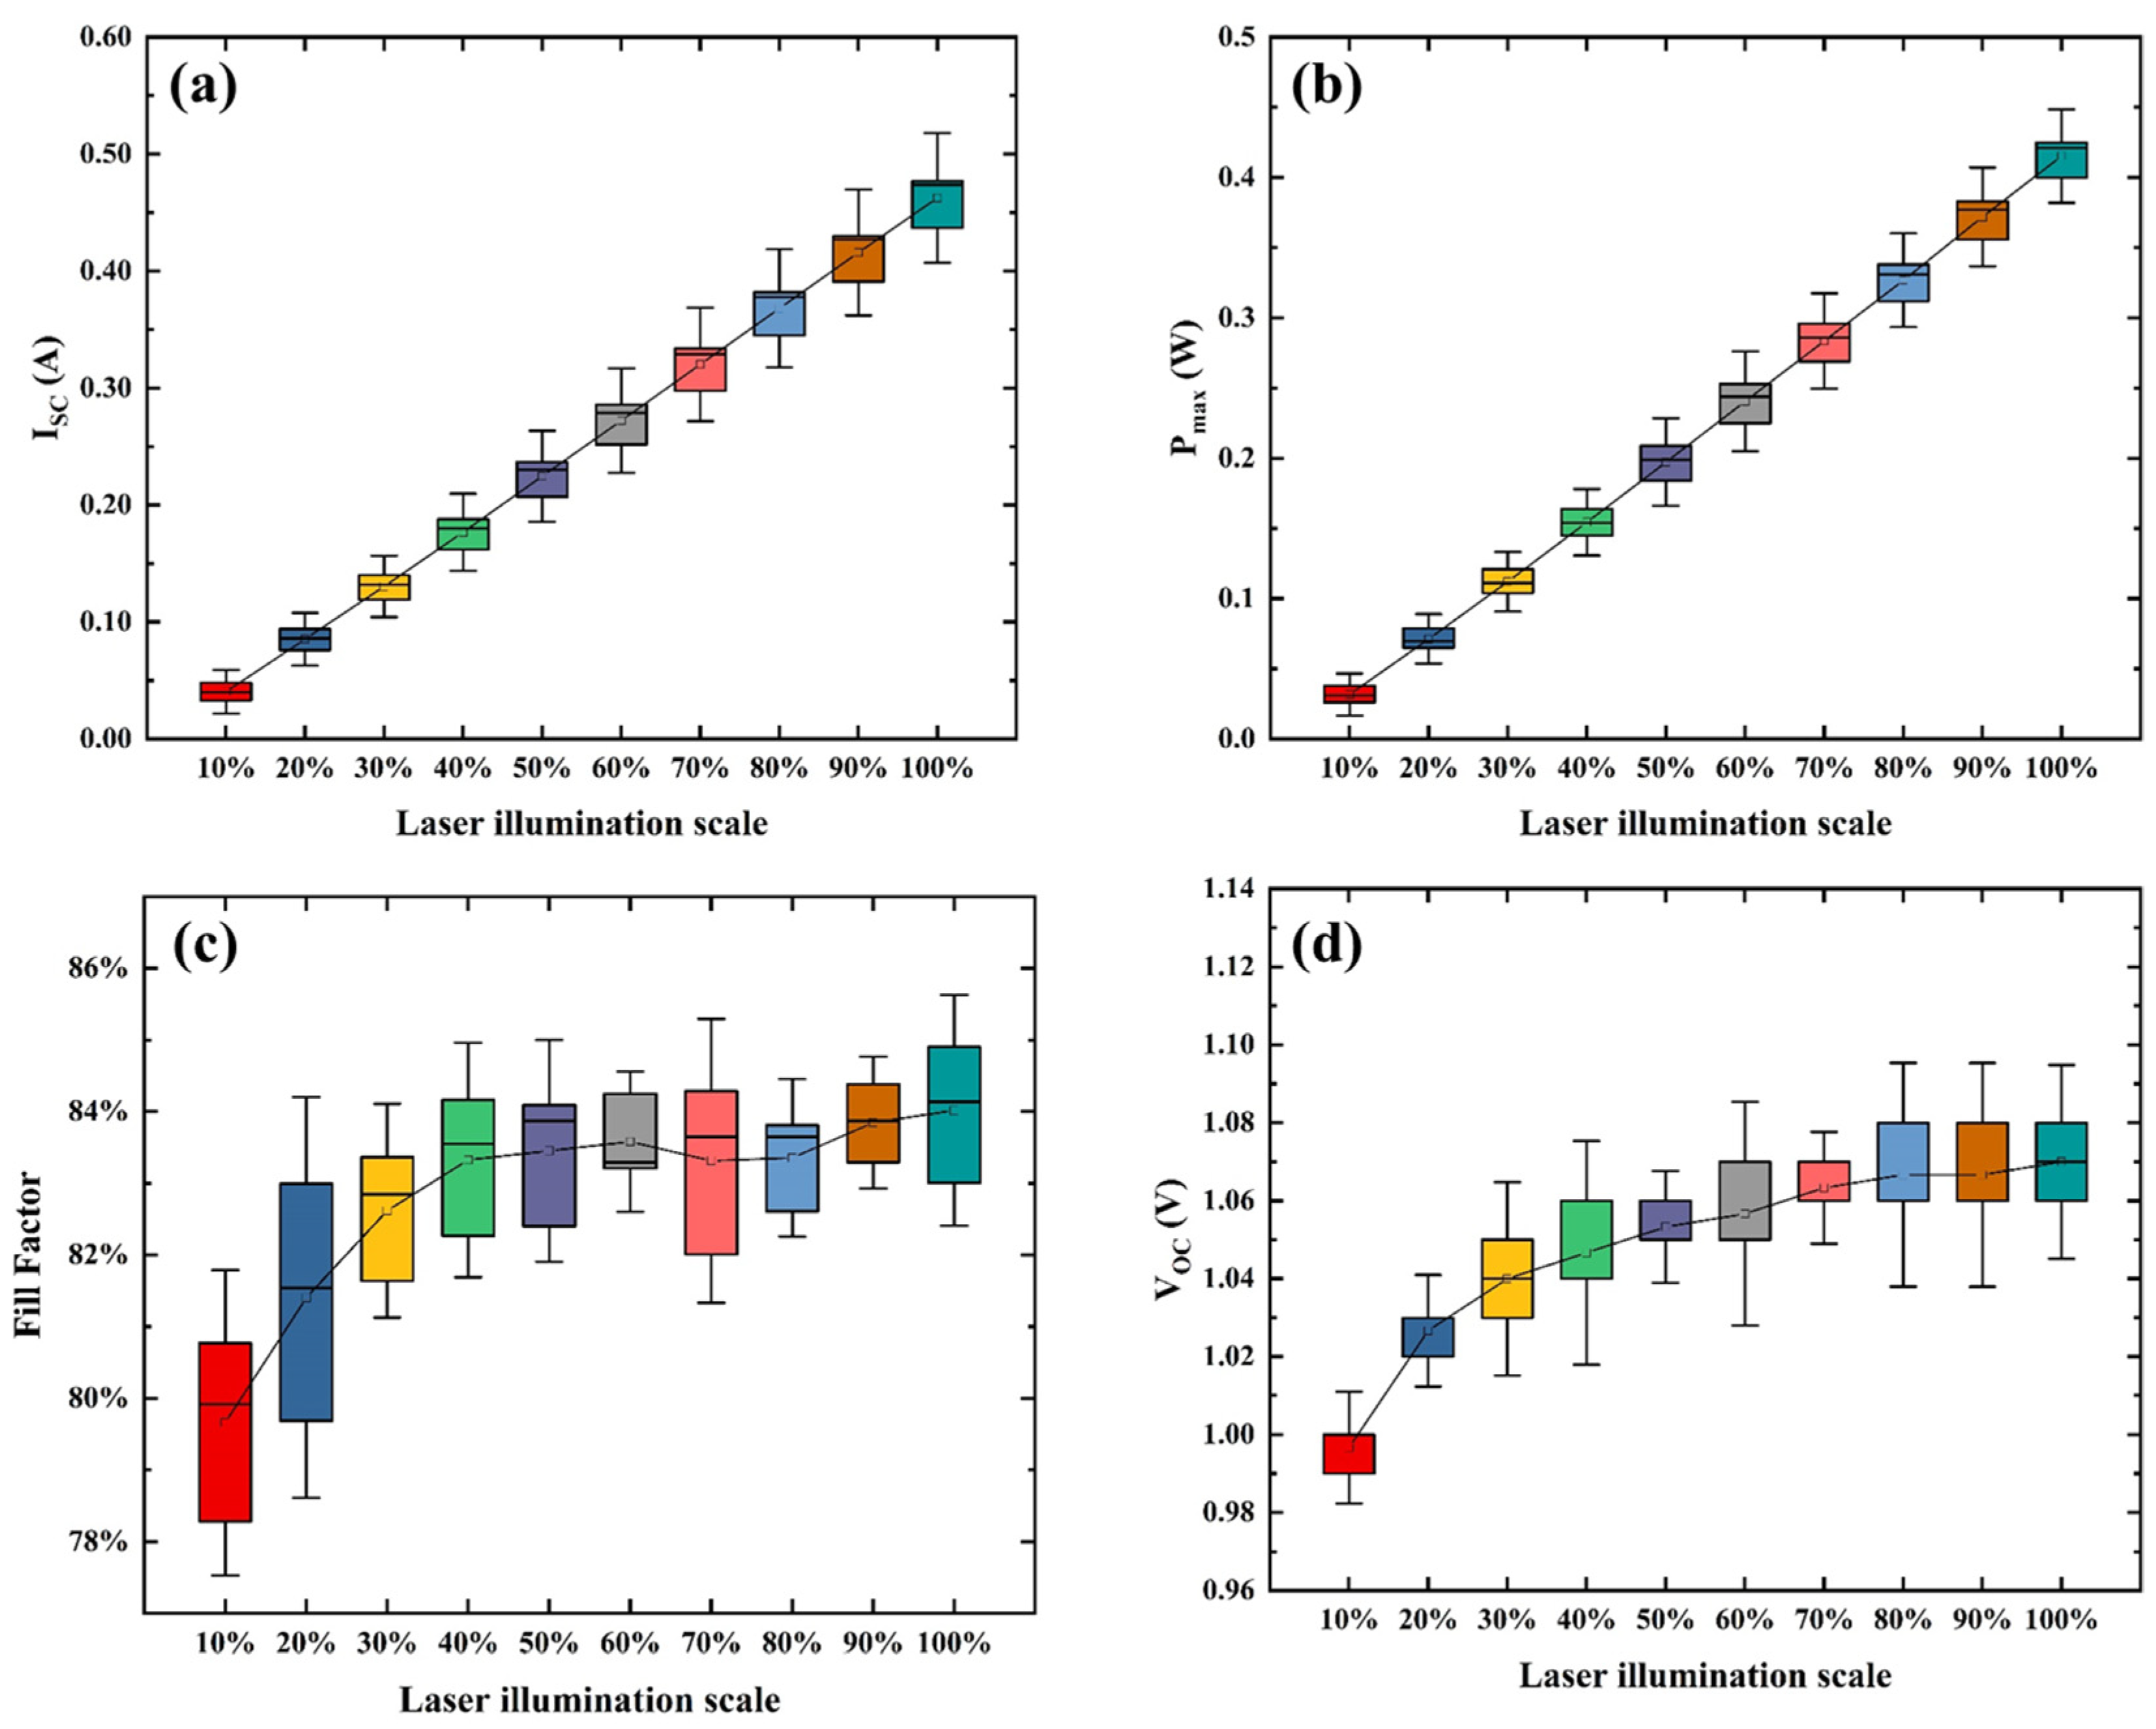
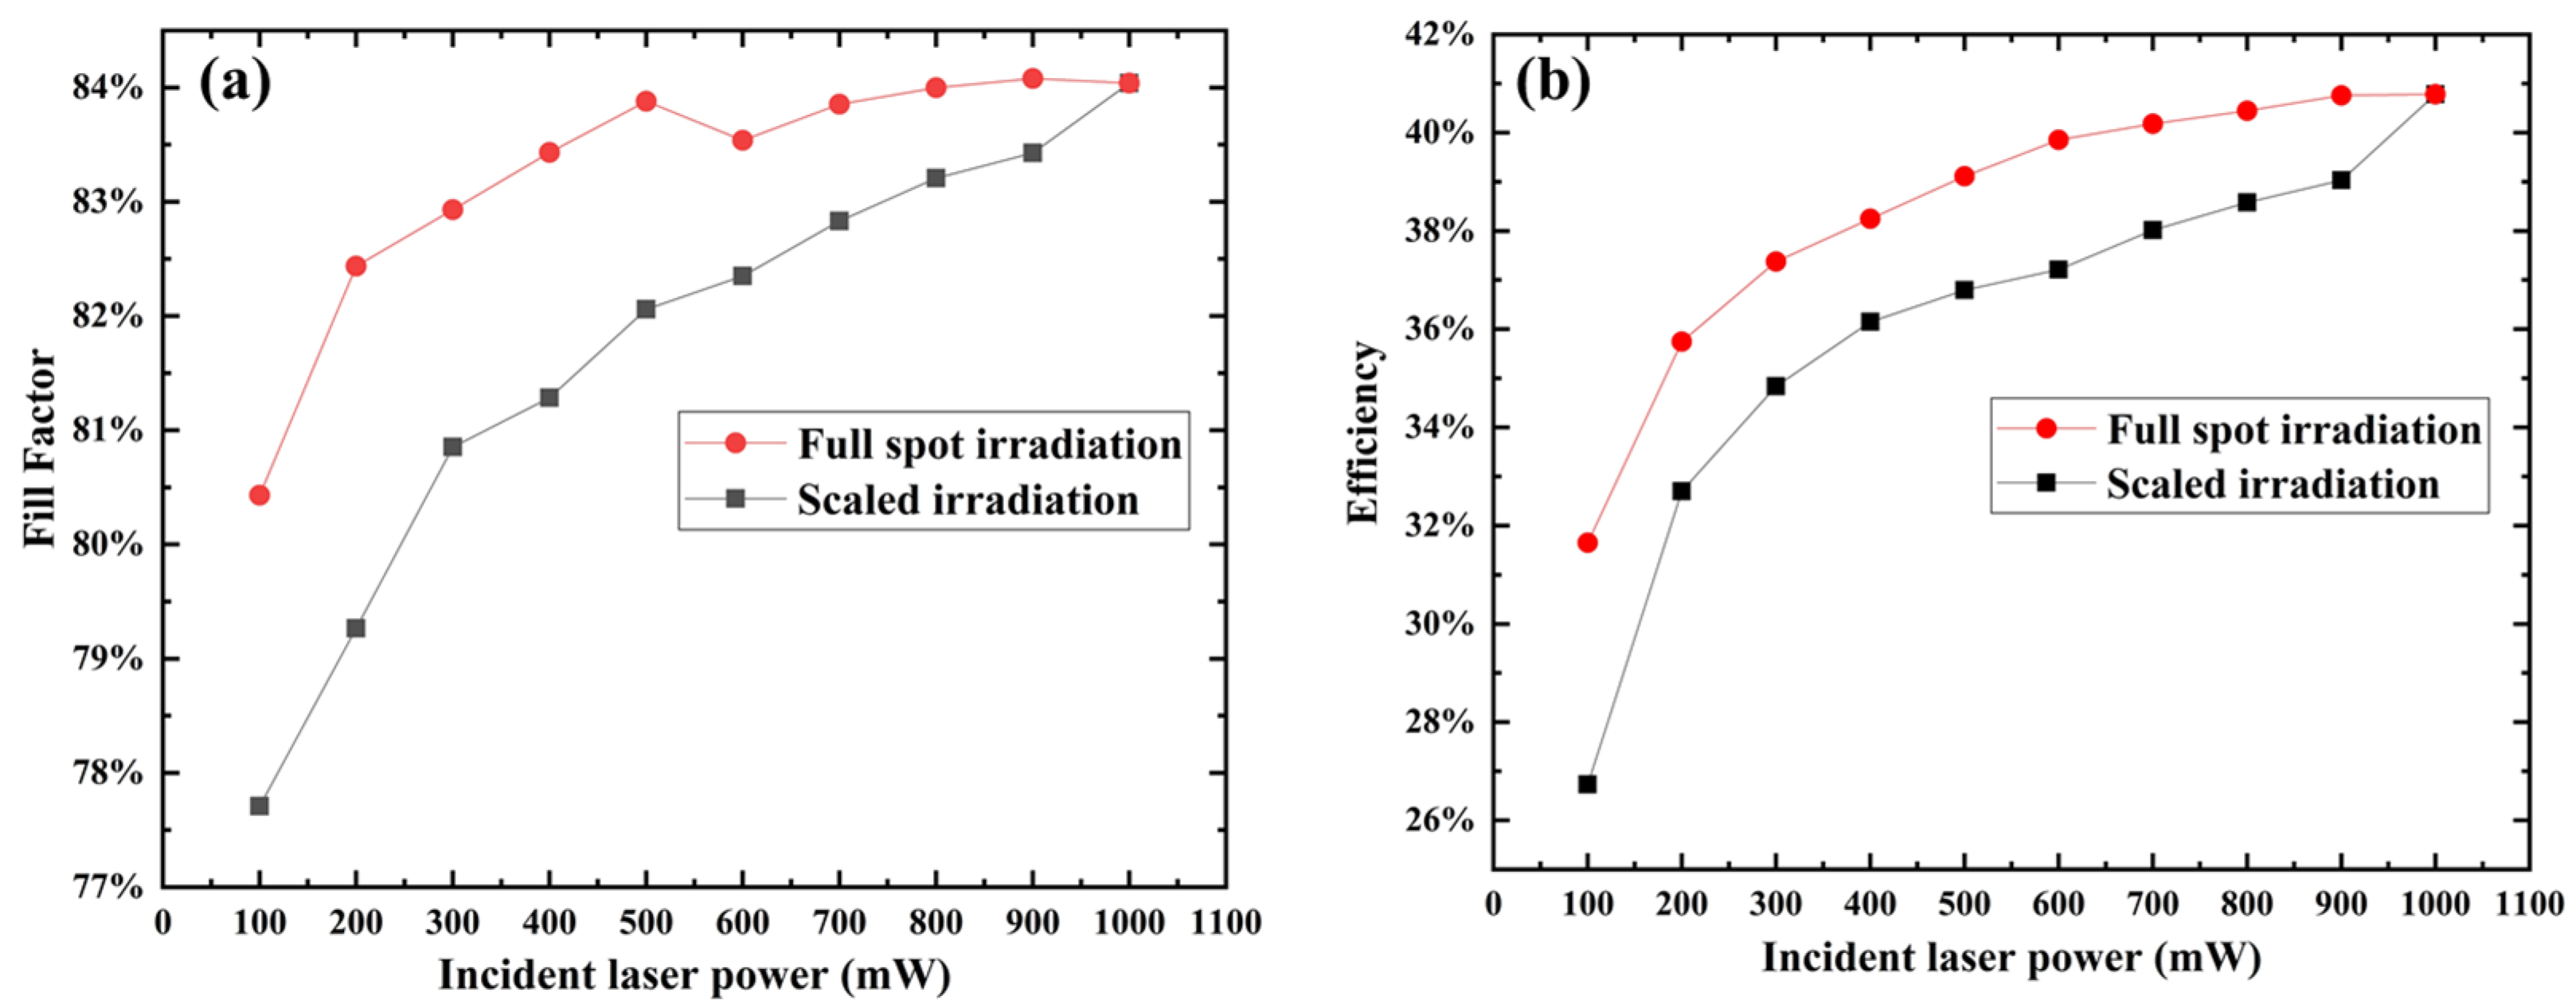
2.2. Experimental Results and Discussion
3. Results Simulation Results and Discussion
3.1. Theoretical Models for Numerical Simulations
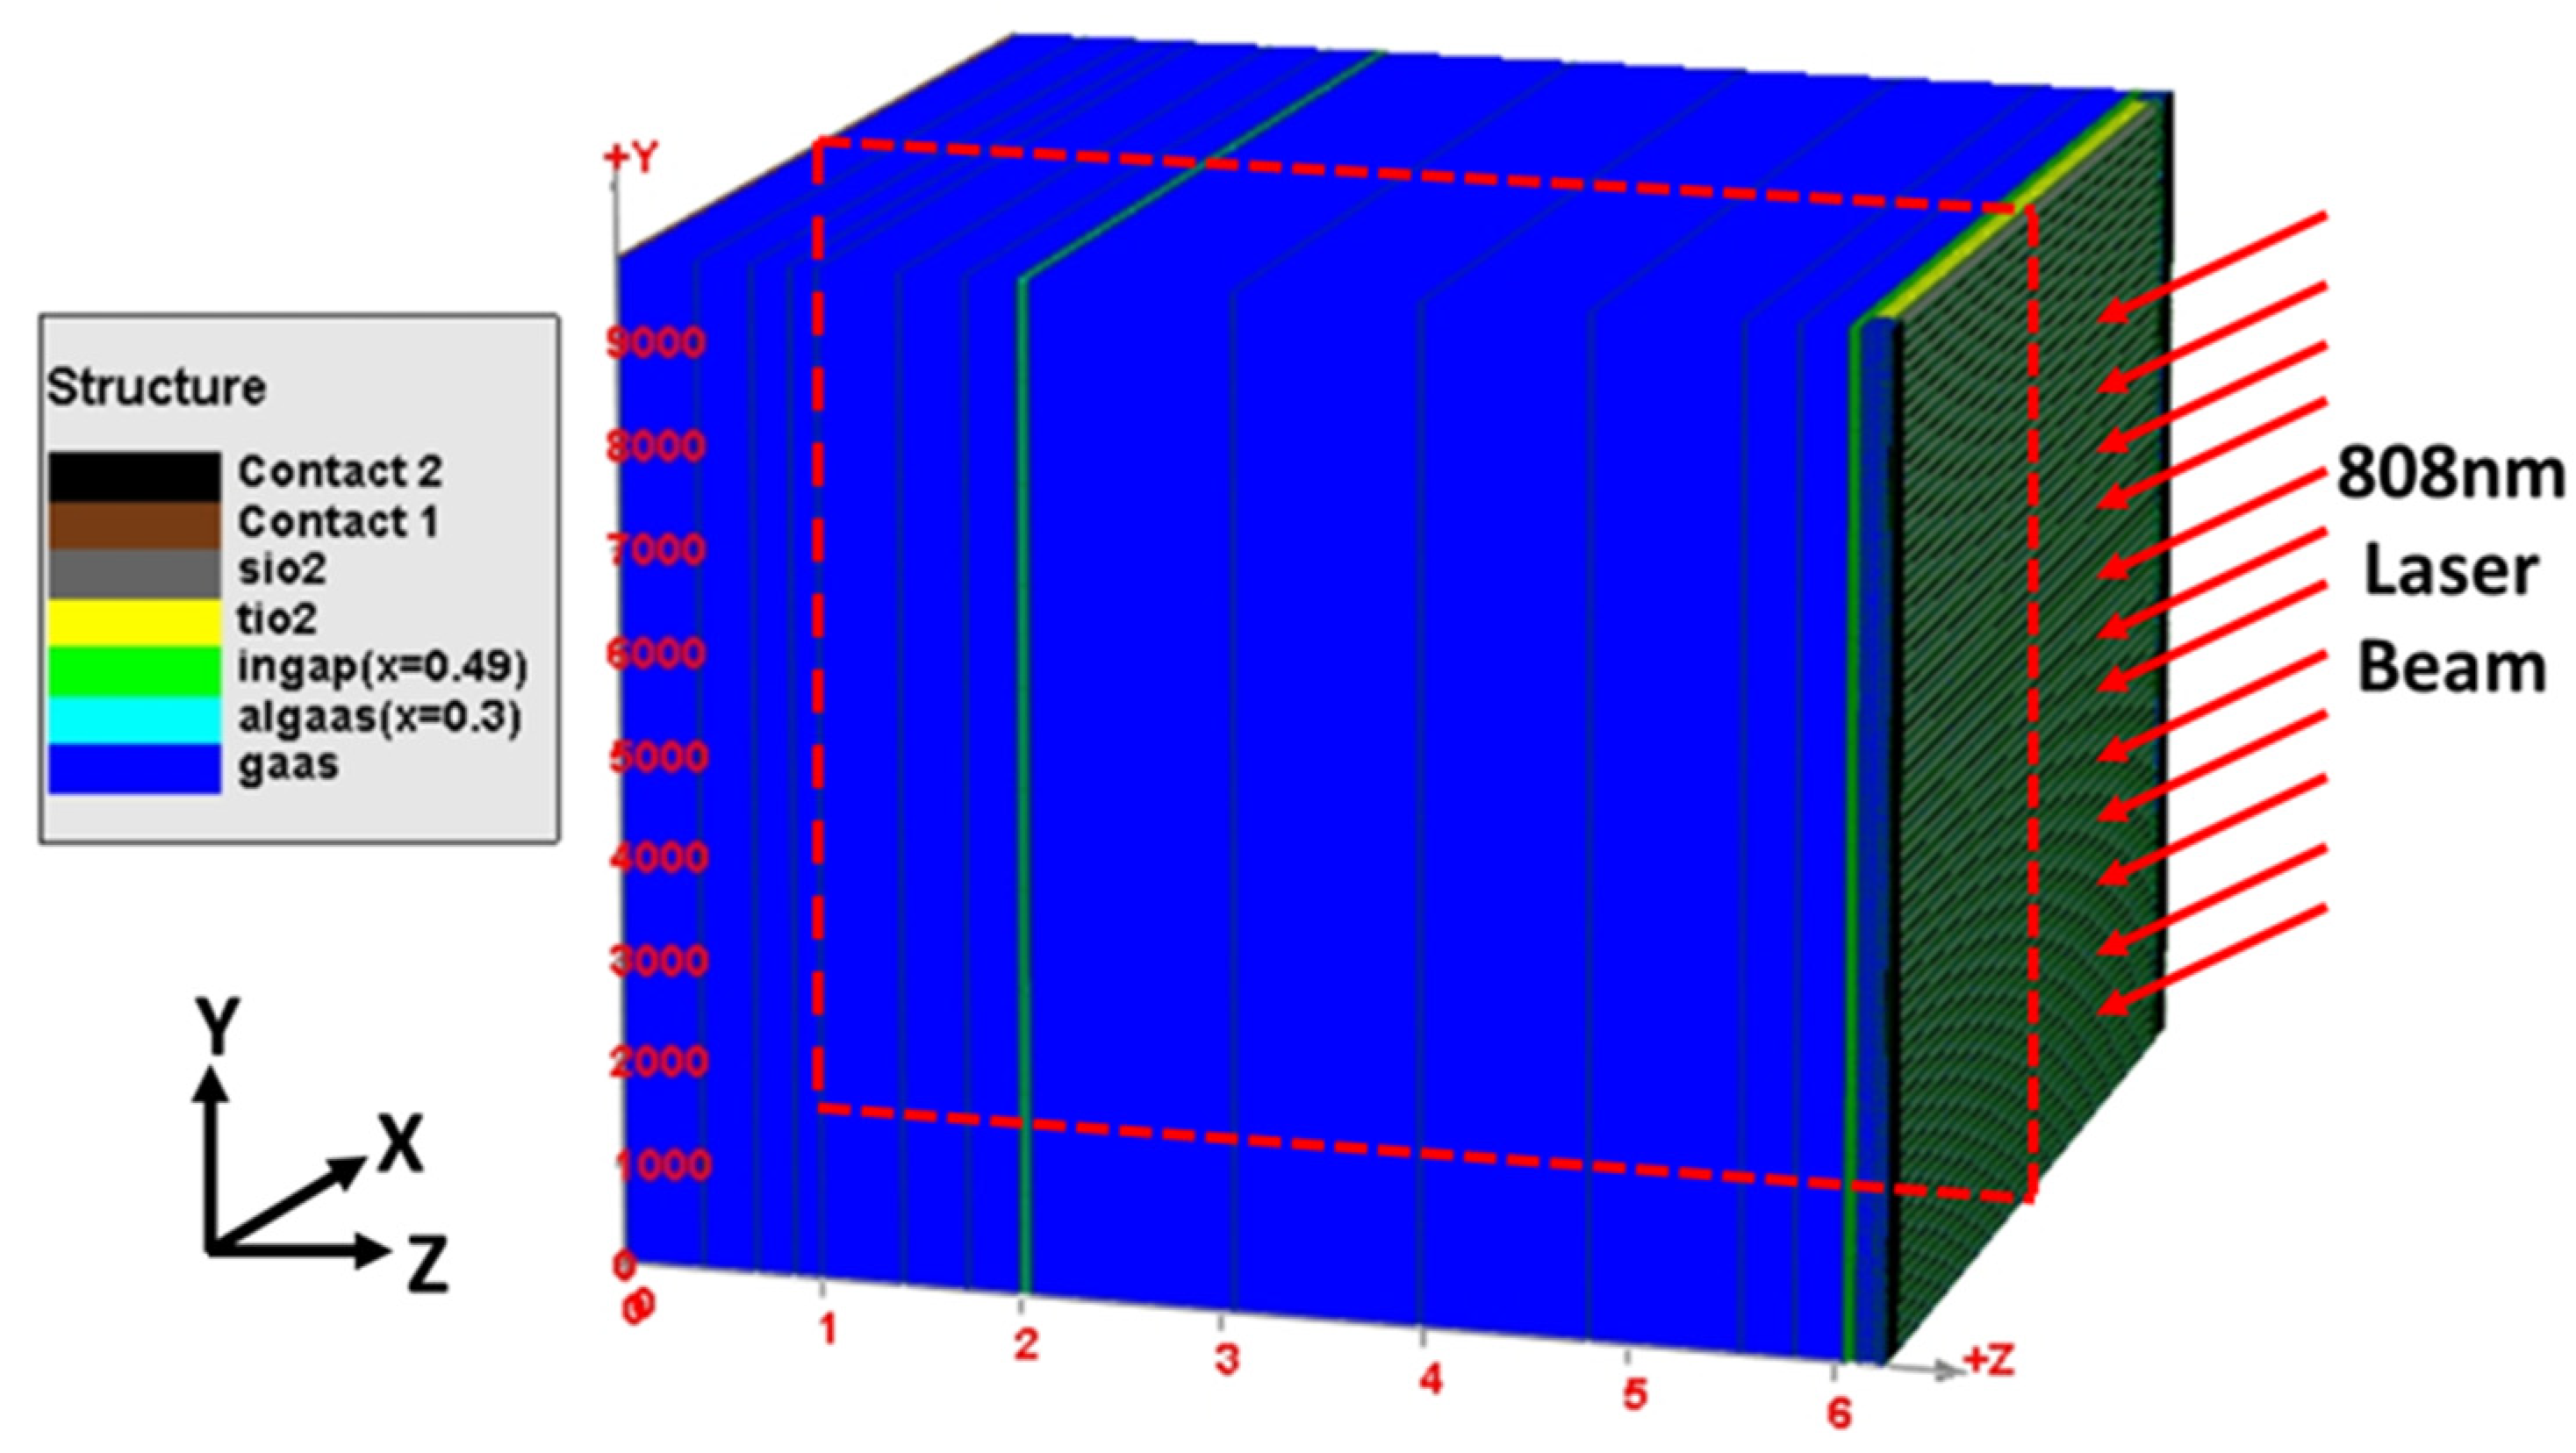
3.2. Simulation Details
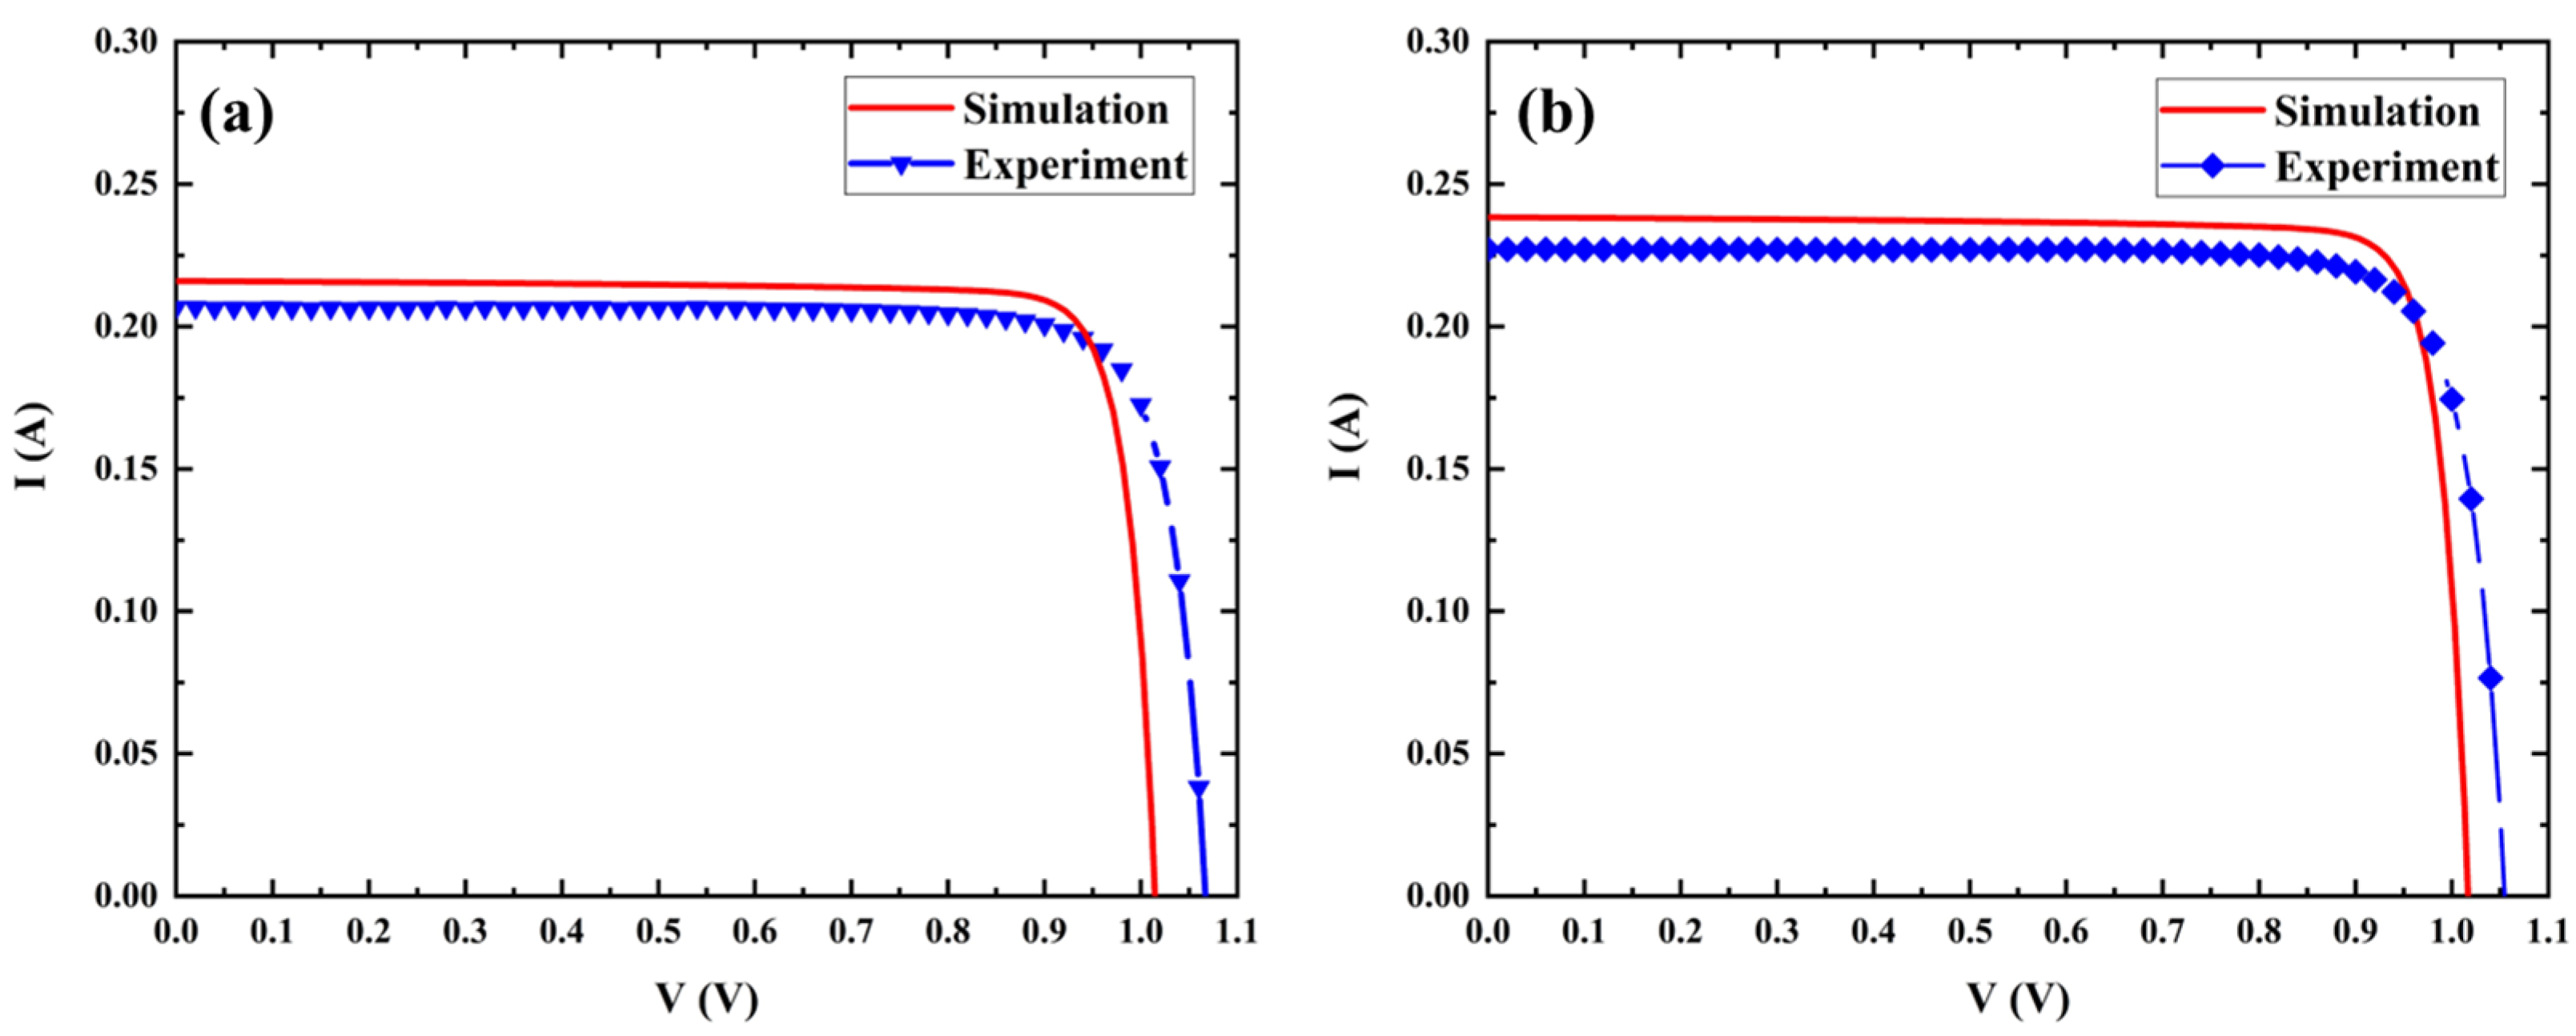
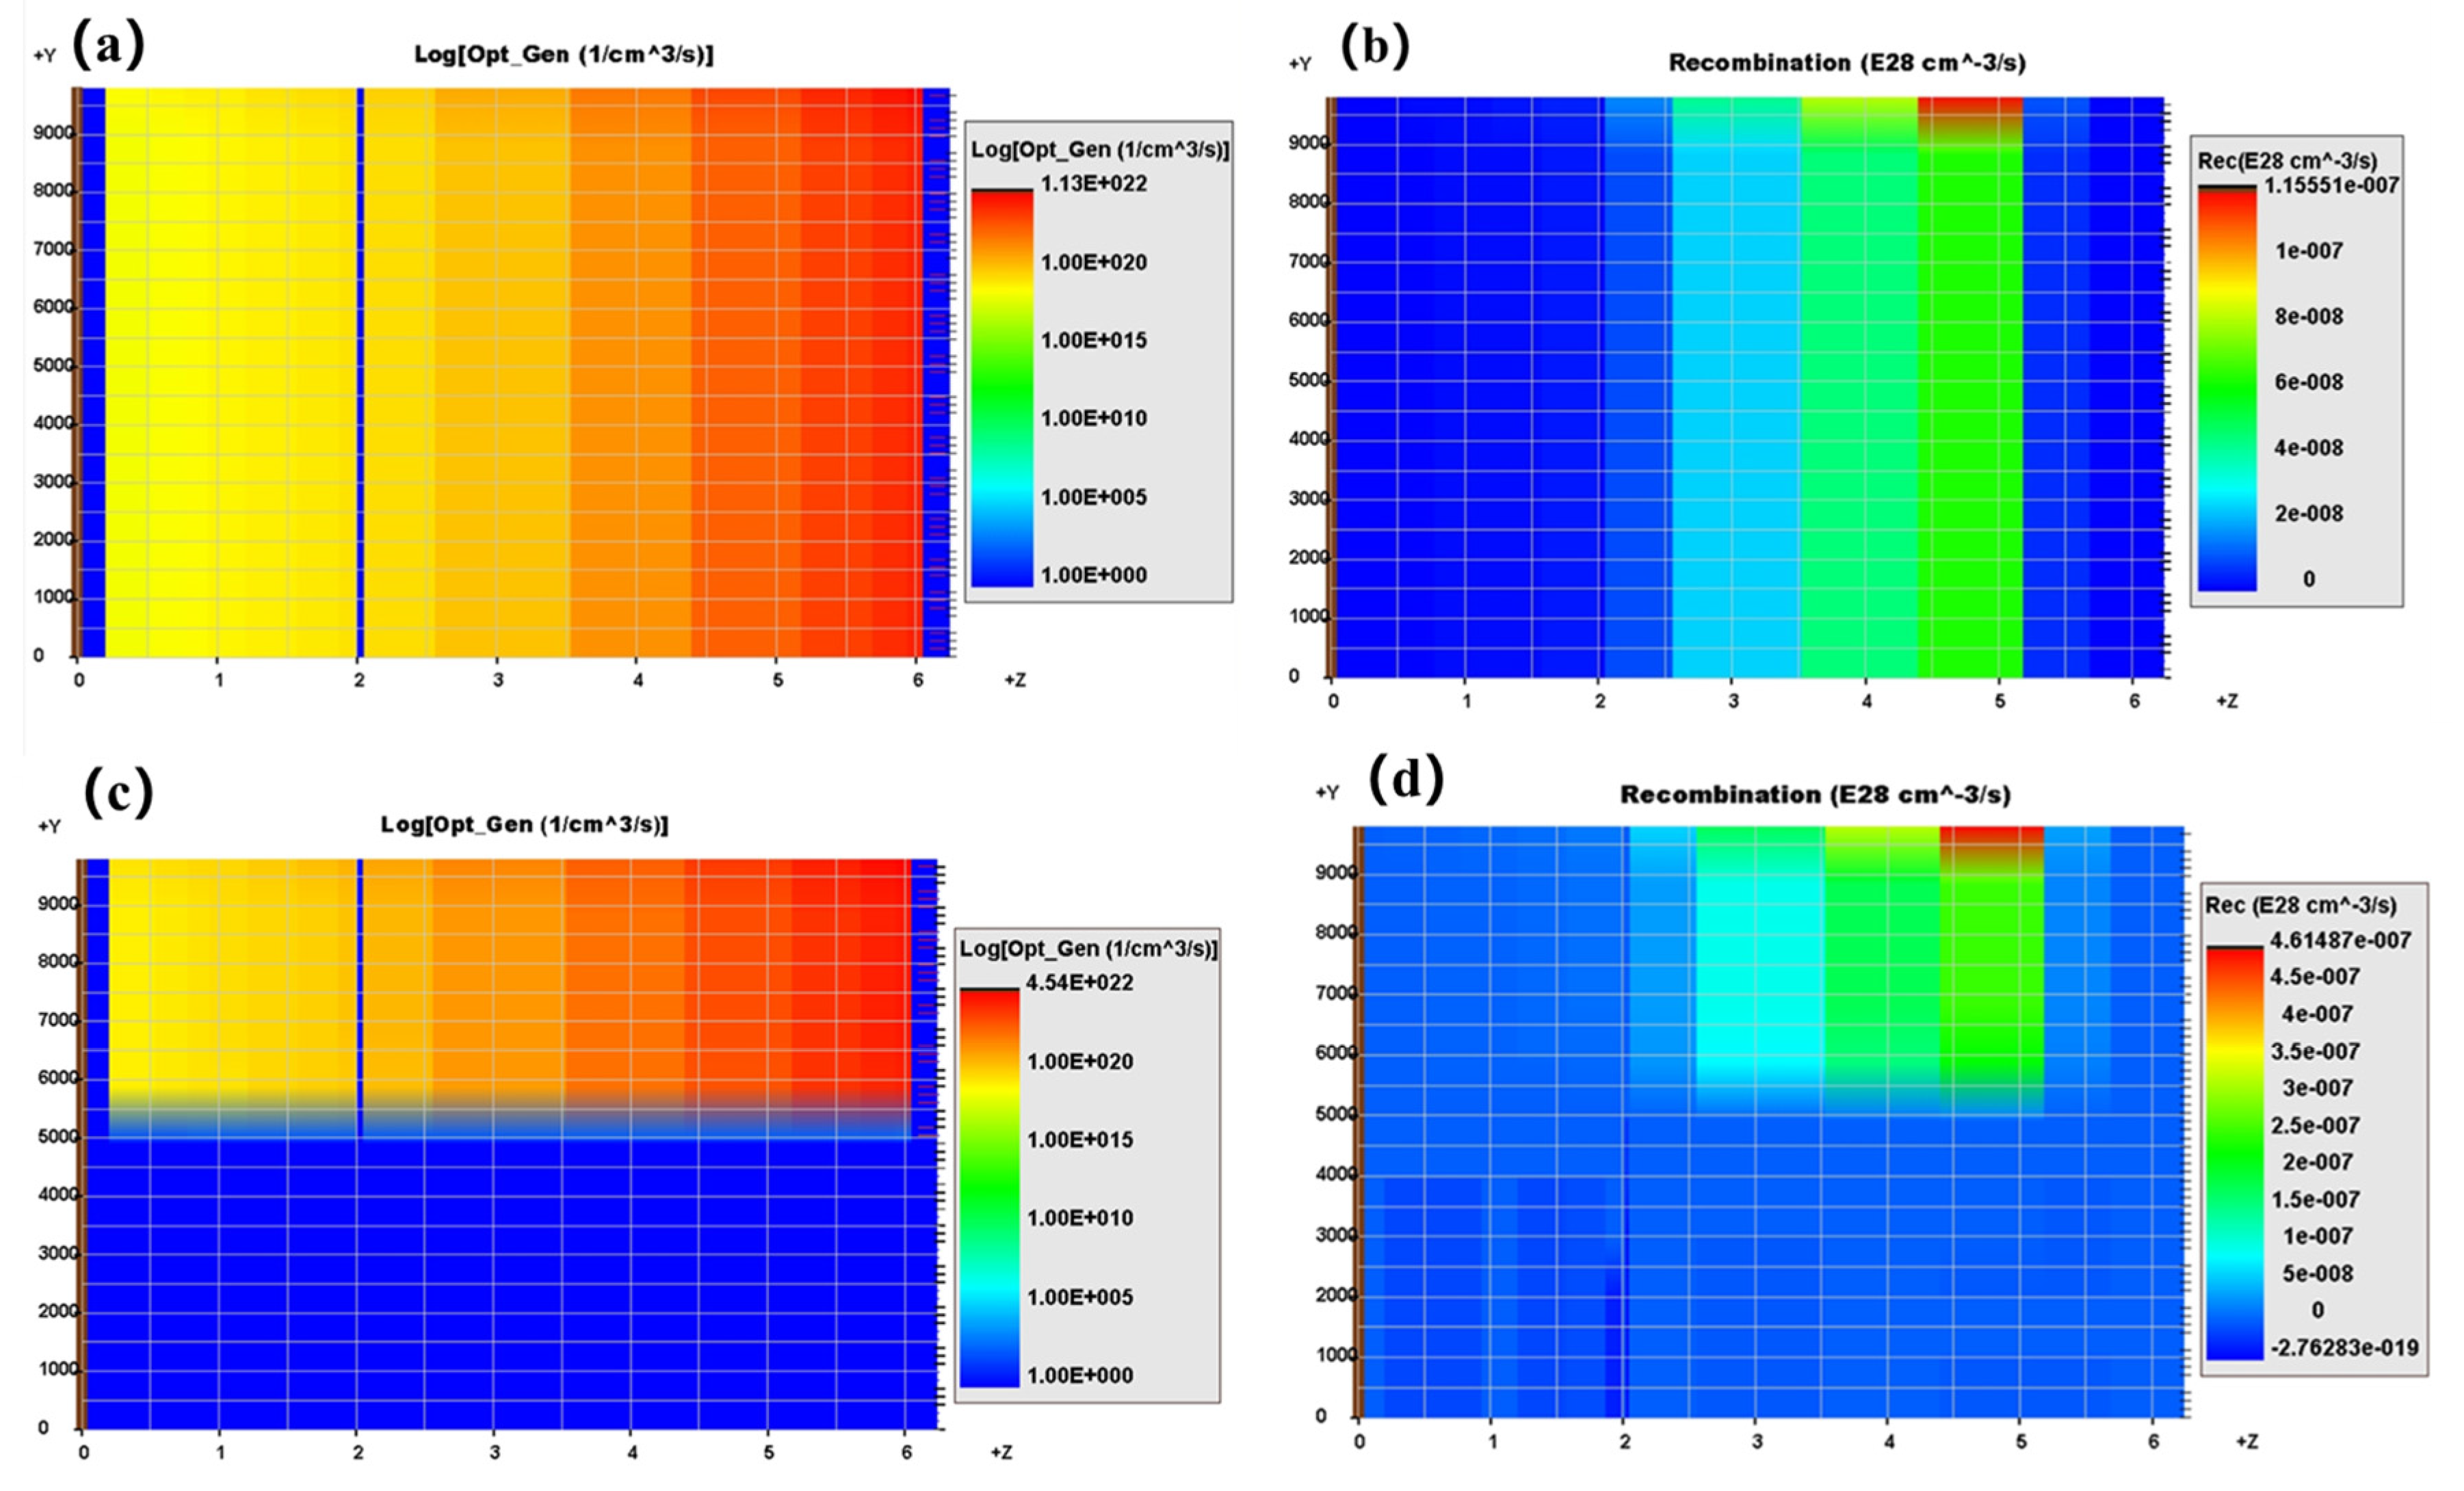
3.3. Simulation Results and Analysis
4. Conclusions
Author Contributions
Funding
Acknowledgments
Conflicts of Interest
References
- Xu, W.; Wang, C.; Lu, C.; Liu, P.; Wang, X.; Wang, M.; Xu, L. Research Status and Key Technologies of Long-Distance Laser Energy Transmission System. In Proceedings of the International Conference in Communications, Signal Processing, and Systems, Changbaishan, China, 4–5 July 2020; pp. 1457–1465. [Google Scholar]
- Fafard, S.; Masson, D.; Werthen, J.-G.; Liu, J.; Wu, T.-C.; Hundsberger, C.; Schwarzfischer, M.; Steinle, G.; Gaertner, C.; Piemonte, C.; et al. Power and Spectral Range Characteristics for Optical Power Converters. Energies 2021, 14, 4395. [Google Scholar] [CrossRef]
- Li, X. Output Characteristics of GaAs Cell Irradiated by Laser. Photon Sens. 2018, 8, 228–233. [Google Scholar] [CrossRef] [Green Version]
- Wagner, L.; Reichmuth, S.K.; Philipps, S.P.; Oliva, E.; Bett, A.W.; Helmers, H. Integrated series/parallel connection for photovoltaic laser power converters with optimized current matching. Prog. Photovolt. Res. Appl. 2021, 29, 172–180. [Google Scholar] [CrossRef]
- Pena, R.; Algora, C.J.P.i.P.R. Applications. Evaluation of mismatch and non-uniform illumination losses in monolithically series-connected GaAs photovoltaic converters. Prog. Photovolt. Res. Appl. 2003, 11, 139–150. [Google Scholar] [CrossRef]
- Valdivia, C.E.; Wilkins, M.M.; Chahal, S.S.; Proulx, F.; Provost, P.-O.; Masson, D.P.; Fafard, S.; Hinzer, K. Many-junction photovoltaic device performance under non-uniform high-concentration illumination. AIP Conf. Proc. 2017, 1881, 070005. [Google Scholar]
- Komuro, Y.; Honda, S.; Kurooka, K.; Warigaya, R.; Tanaka, F.; Uchida, S. A 43.0% efficient GaInP photonic power converter with a distributed Bragg reflector under high-power 638 nm laser irradiation of 17 W cm−2. Appl. Phys. Express 2021, 14, 052002. [Google Scholar] [CrossRef]
- Fafard, S.; Masson, D.P.J.J.o.A.P. Perspective on photovoltaic optical power converters. J. Appl. Phys. 2021, 130, 160901. [Google Scholar] [CrossRef]
- Algora, C.; García, I.; Delgado, M.; Peña, R.; Vázquez, C.; Hinojosa, M.; Rey-Stolle, I. Beaming power: Photovoltaic laser power converters for power-by-light. Joule 2021, 6, 340–368. [Google Scholar] [CrossRef]
- Kalyuzhnyy, N.; Evstropov, V.V.; Mintairov, S.; Salii, R.; Shvarts, M.Z. Performance of InGaAs metamorphic laser power converters at different conditions. J. Phys. Conf. Ser. 2019, 1410, 012094. [Google Scholar] [CrossRef]
- Goma, S.; Yoshioka, K.; Saitoh, T. Effect of concentration distribution on cell performance for low-concentrators with a three-dimensional lens. Sol. Energy Mater. Sol. Cells 1997, 47, 339–344. [Google Scholar] [CrossRef]
- Herrero, R.; Victoria, M.; Domínguez, C.; Askins, S.; Antón, I.; Sala, G. Concentration photovoltaic optical system irradiance distribution measurements and its effect on multi-junction solar cells. Prog. Photovolt. Res. Appl. 2012, 20, 423–430. [Google Scholar] [CrossRef] [Green Version]
- Baig, H.; Heasman, K.C.; Mallick, T.K. Non-uniform illumination in concentrating solar cells. Renew. Sustain. Energy Rev. 2012, 16, 5890–5909. [Google Scholar] [CrossRef]
- Li, Z.; Xiao, Y.; Li, Z.S. Modeling of multi-junction solar cells by Crosslight APSYS. In Proceedings of the High and Low Concentration for Solar Electric Applications, San Dieg, CA, USA, 14 August 2006; pp. 29–36. [Google Scholar]
- Zhao, Y.; Liang, P.; Ren, H.; Han, P. Enhanced efficiency in 808 nm GaAs laser power converters via gradient doping. AIP Adv. 2019, 9, 105206. [Google Scholar] [CrossRef]
- Shan, T.; Qi, X. Design and optimization of GaAs photovoltaic converter for laser power beaming. Infrared Phys. Technol. 2015, 71, 144–150. [Google Scholar] [CrossRef]
- Sharma, P.; Walker, A.W.; Wheeldon, J.F.; Schriemer, H.; Hinzer, K. Optimization of finger spacing for concentrator photovoltaic cells under non-uniform illumination using SPICE. Photonics North 2013, 891505, 25–32. [Google Scholar] [CrossRef]
- Sharma, P.; Wilkins, M.; Schriemer, H.; Hinzer, K. Modeling nonuniform irradiance and chromatic aberration effects in a four junction solar cell using SPICE. In Proceedings of the 2014 IEEE 40th Photovoltaic Specialist Conference (PVSC), Denver, CO, USA, 8–13 June 2014; pp. 3293–3297. [Google Scholar]


| Laser Illumination Scale | 100% | 90% | 80% | 70% | 60% | 50% | 40% | 30% | 20% | 10% |
|---|---|---|---|---|---|---|---|---|---|---|
| series resistance (Ω) | 0.32 | 0.44 | 0.46 | 0.49 | 0.69 | 0.74 | 1.02 | 1.54 | 2.23 | 5.17 |
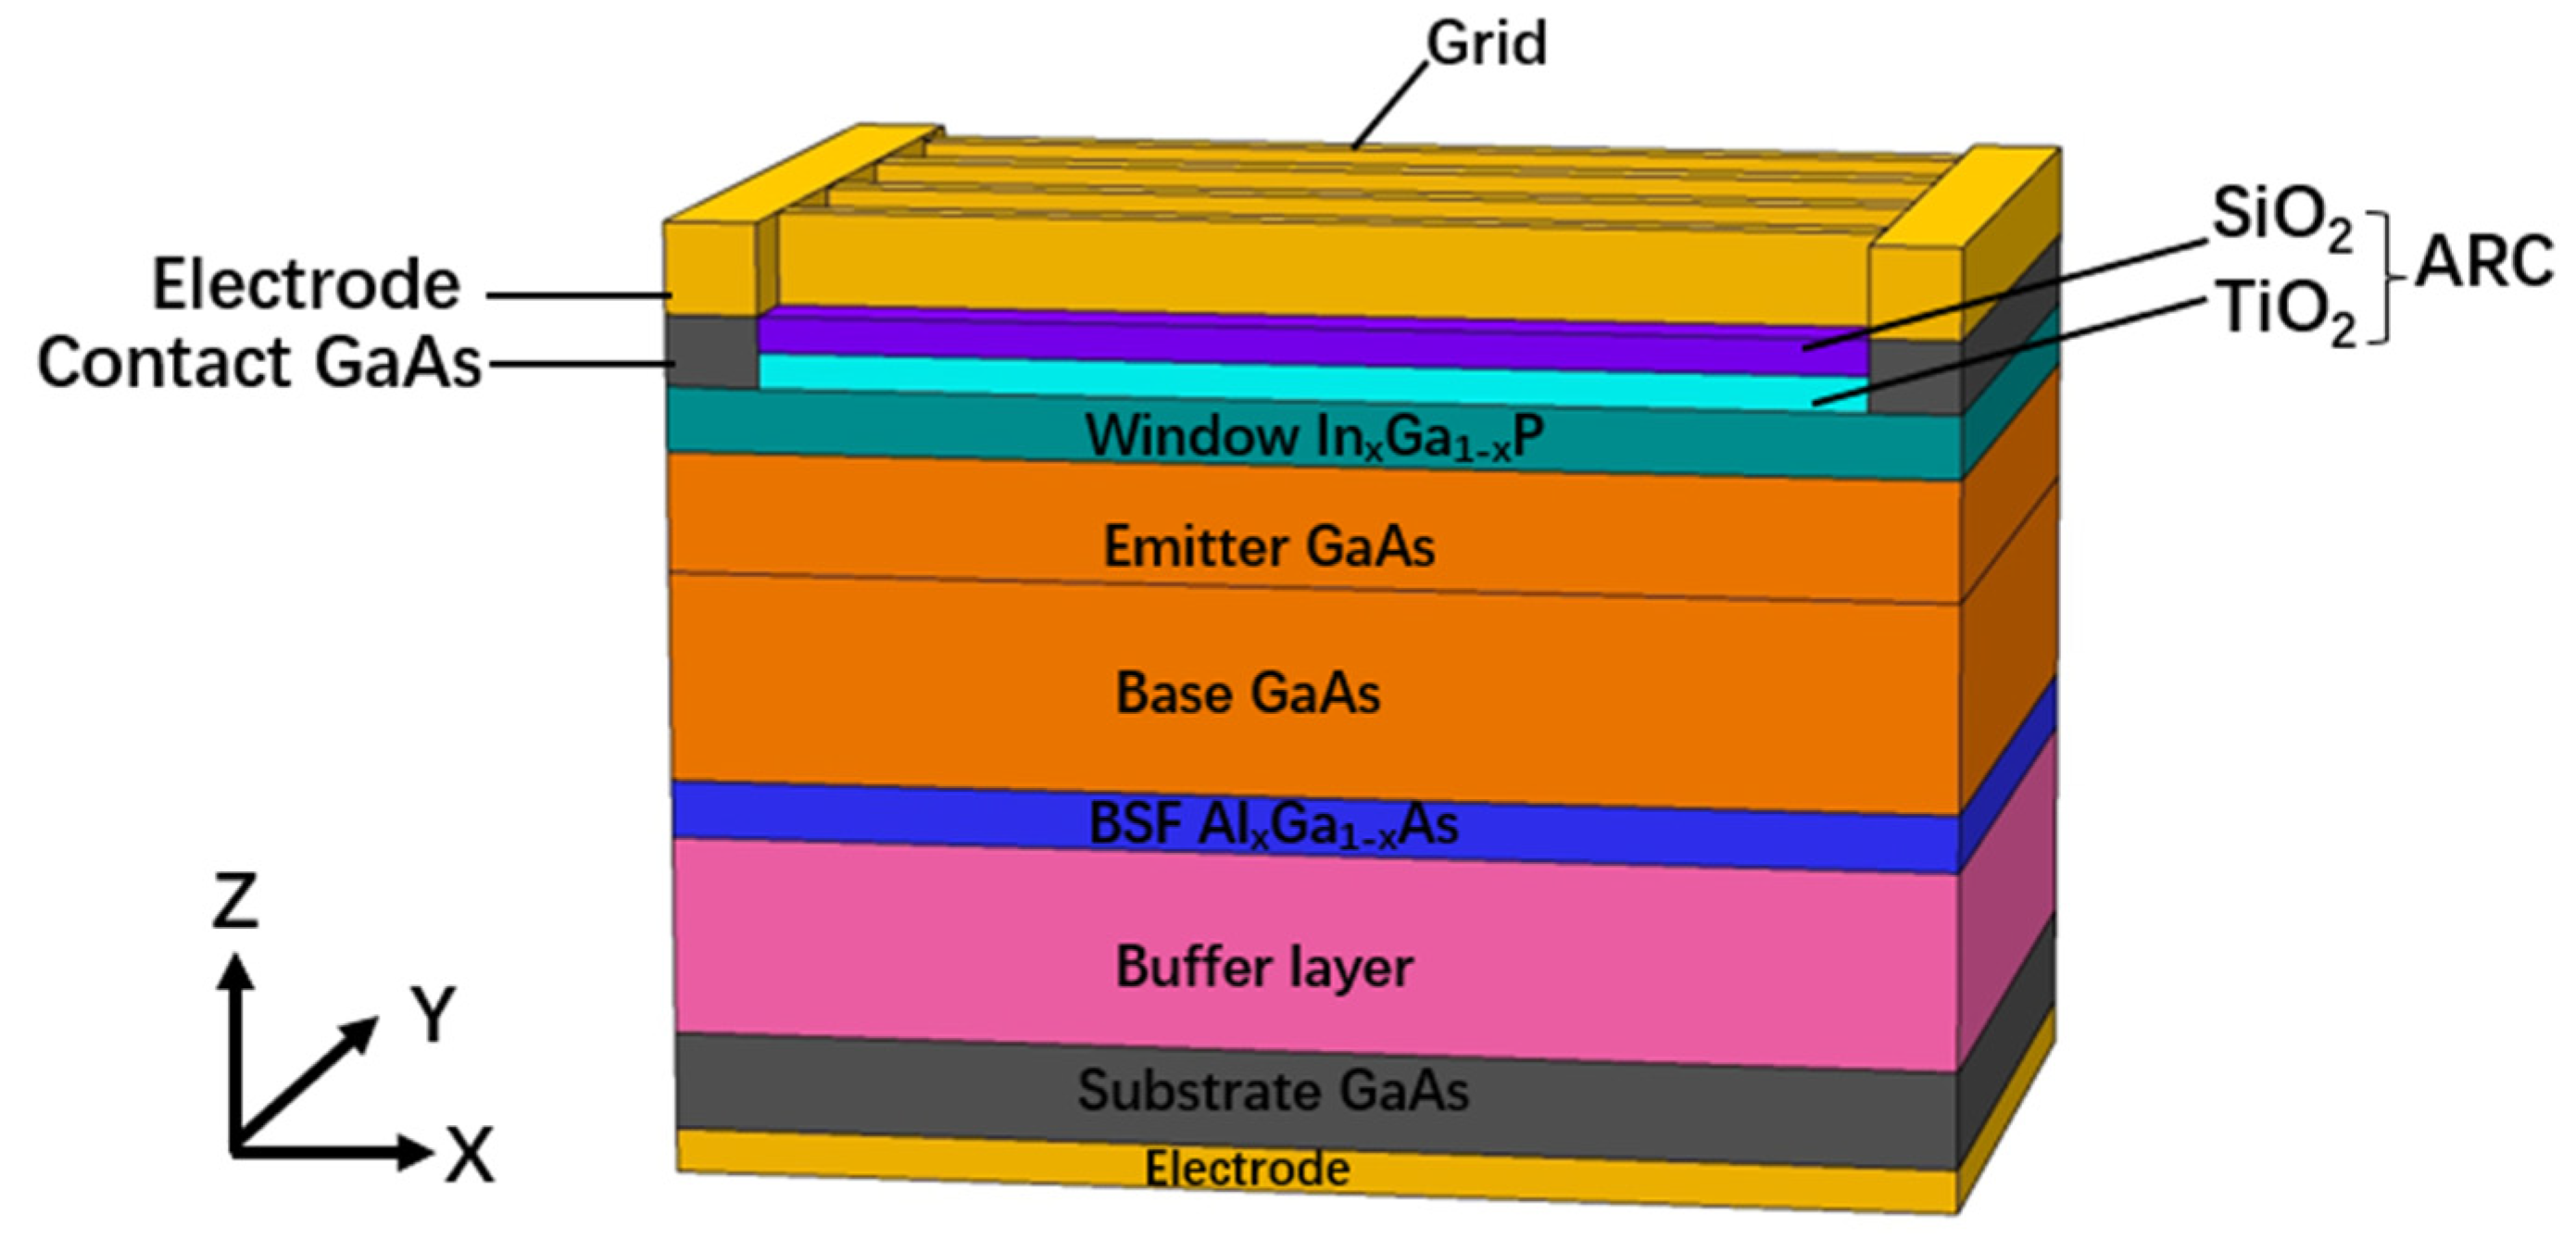
| Layer | Material | Doping Type | Doping (cm−3) | Thickness (nm) |
|---|---|---|---|---|
| Buffer | GaAs | p+ | 5.00 × 10¹⁸ | 1000 |
| BSF | AlxGa(1−x)As(x = 30%) | p+ | 5.00 × 10¹⁸ | 50 |
| Base | GaAs | p | 1.00 × 10¹⁷ | 3500 |
| Emitter | GaAs | n | 2.00 × 10¹⁸ | 500 |
| Window | InxGa(1−x)P(x = 49%) | n+ | 5.00 × 10¹⁸ | 50 |
| Cap | GaAs | n++ | 5.00 × 10¹⁹ | 200 |
| ARC | 90 nm TiO2 + 60 nmSiO2 (R = 0.8%) | |||
Publisher’s Note: MDPI stays neutral with regard to jurisdictional claims in published maps and institutional affiliations. |
© 2022 by the authors. Licensee MDPI, Basel, Switzerland. This article is an open access article distributed under the terms and conditions of the Creative Commons Attribution (CC BY) license (https://creativecommons.org/licenses/by/4.0/).
Share and Cite
Wang, H.; Wang, J.; Yang, H.; Deng, G.; Yang, Q.; Niu, R.; Gou, Y. The Effect of Non-Uniform Irradiation on Laser Photovoltaics: Experiments and Simulations. Photonics 2022, 9, 493. https://doi.org/10.3390/photonics9070493
Wang H, Wang J, Yang H, Deng G, Yang Q, Niu R, Gou Y. The Effect of Non-Uniform Irradiation on Laser Photovoltaics: Experiments and Simulations. Photonics. 2022; 9(7):493. https://doi.org/10.3390/photonics9070493
Chicago/Turabian StyleWang, Hao, Jun Wang, Huomu Yang, Guoliang Deng, Qingdong Yang, Ruijun Niu, and Yudan Gou. 2022. "The Effect of Non-Uniform Irradiation on Laser Photovoltaics: Experiments and Simulations" Photonics 9, no. 7: 493. https://doi.org/10.3390/photonics9070493