High-Harmonic Generation Using a Single Dielectric Nanostructure


School of Mechanical Engineering, Chonnam National University, 77 Yongbong-ro, Buk-gu, Gwangju 61186, Korea
Photonics 2022, 9(6), 427; https://doi.org/10.3390/photonics9060427
Submission received: 13 April 2022
/
Revised: 5 June 2022
/
Accepted: 14 June 2022
/
Published: 17 June 2022
Abstract
:High-harmonic generation (HHG) from solids is a novel method used to emanate coherent extreme-ultraviolet (EUV) pulses. The efficiency of plasmonic HHG can be improved by enhancing the field of nanostructures. However, the nanostructures used for plasmonic HHG have a limitation owing to the damage caused by the amplified field. This study presents a single conical sapphire nanostructure used as a compact HHG emitter that generates high-order harmonics with wavelengths up to approximately 60 nm without causing severe damage. We compare the structure with a gold-layered conical sapphire structure and a bulk sapphire. The conical sapphire structure has a higher damage threshold and reusability for EUV generation even though it has a lower HHG intensity than that of the gold-layered conical sapphire structure because of the lower intensity enhancement. The measured signal intensity of the high-order harmonics in the EUV band from the conical sapphire structure is ten times higher than that of the bulk sapphire. The results confirm the possibility of creating a compact EUV light source for nanoscale applications.
1. Introduction
High-harmonic generation (HHG) is a nonlinear phenomenon induced by an interaction between the high peak power of a laser pulse and the electrons in the materials exposed to the pulse [1,2]. HHG can produce attosecond and coherent light pulses in extreme ultraviolet (EUV) and X-ray bands by generating coherent harmonic signals [3,4,5]. The pump–probe technique, which is based on attosecond pulses, can measure the ultrafast physical phenomena in atoms and molecules, such as electron ionization [6], electron migration [7,8], transient absorption [9,10], and Auger effects [11]. Coherent pulses in EUV and X-ray have been applied to ultra-precise patterning and lithography [12].
Since HHG was first observed in atomic gas [13], where it was described by the three-step model [1,2,14], it has been reported in various gases over the last few decades [15,16]. Recently, it has been reported that crystalline-structure-based solids can generate high-order harmonic signals with high efficiency [17,18,19]. The mechanism of HHG in solids is still a subject of intense investigation [20,21,22,23]. Intense driving laser pulses transfer the energy to the electrons in the energy band structure of the crystal, and the intra-band and inter-band electron transitions generate the harmonics [24]. The path of the electrons in the energy band structure is determined by the relationship between the crystal direction and the polarization of the driving laser. The path varies the efficiency of HHG [25,26,27]. Surface-patterned dielectrics can tailor the propagation of the harmonics using refraction and diffraction on the surfaces of the structures [28,29].
To replace a large and complex laser amplification system for HHG in solids, nanoscale plasmonic field enhancement has been used to provoke HHG with a metal/dielectric hybrid structure [30]. The structure was designed to optimize the plasmonic resonance enhancement of the driving laser pulses from a Ti:sapphire femtosecond pulse oscillator with a 75 MHz repetition rate. It emanated coherent odd-order extreme ultraviolet harmonics without the dominance of fluorescence lines. However, the metal–sapphire nanostructure was susceptible to thermal damage, and its deformed structure deteriorated the HHG. In addition, the all-dielectric structure enhanced the HHG by boosting driving laser pulses using a single nanostructured semiconductor [31]. They demonstrated an apparent enhancement of harmonics in ultraviolet and visible bands by at least two orders of magnitude with a zinc oxide nanostructure. The structure also has a limitation in that robust field amplification can damage the structure and degenerate harmonic generation.
In this study, we designed a single conical sapphire nanostructure and compared it with the metal–sapphire nanostructure [30] and bulk sapphire based on the HHG in the EUV band and the damage results according to the field enhancements.
2. Theoretical Analysis and Experimental Setup
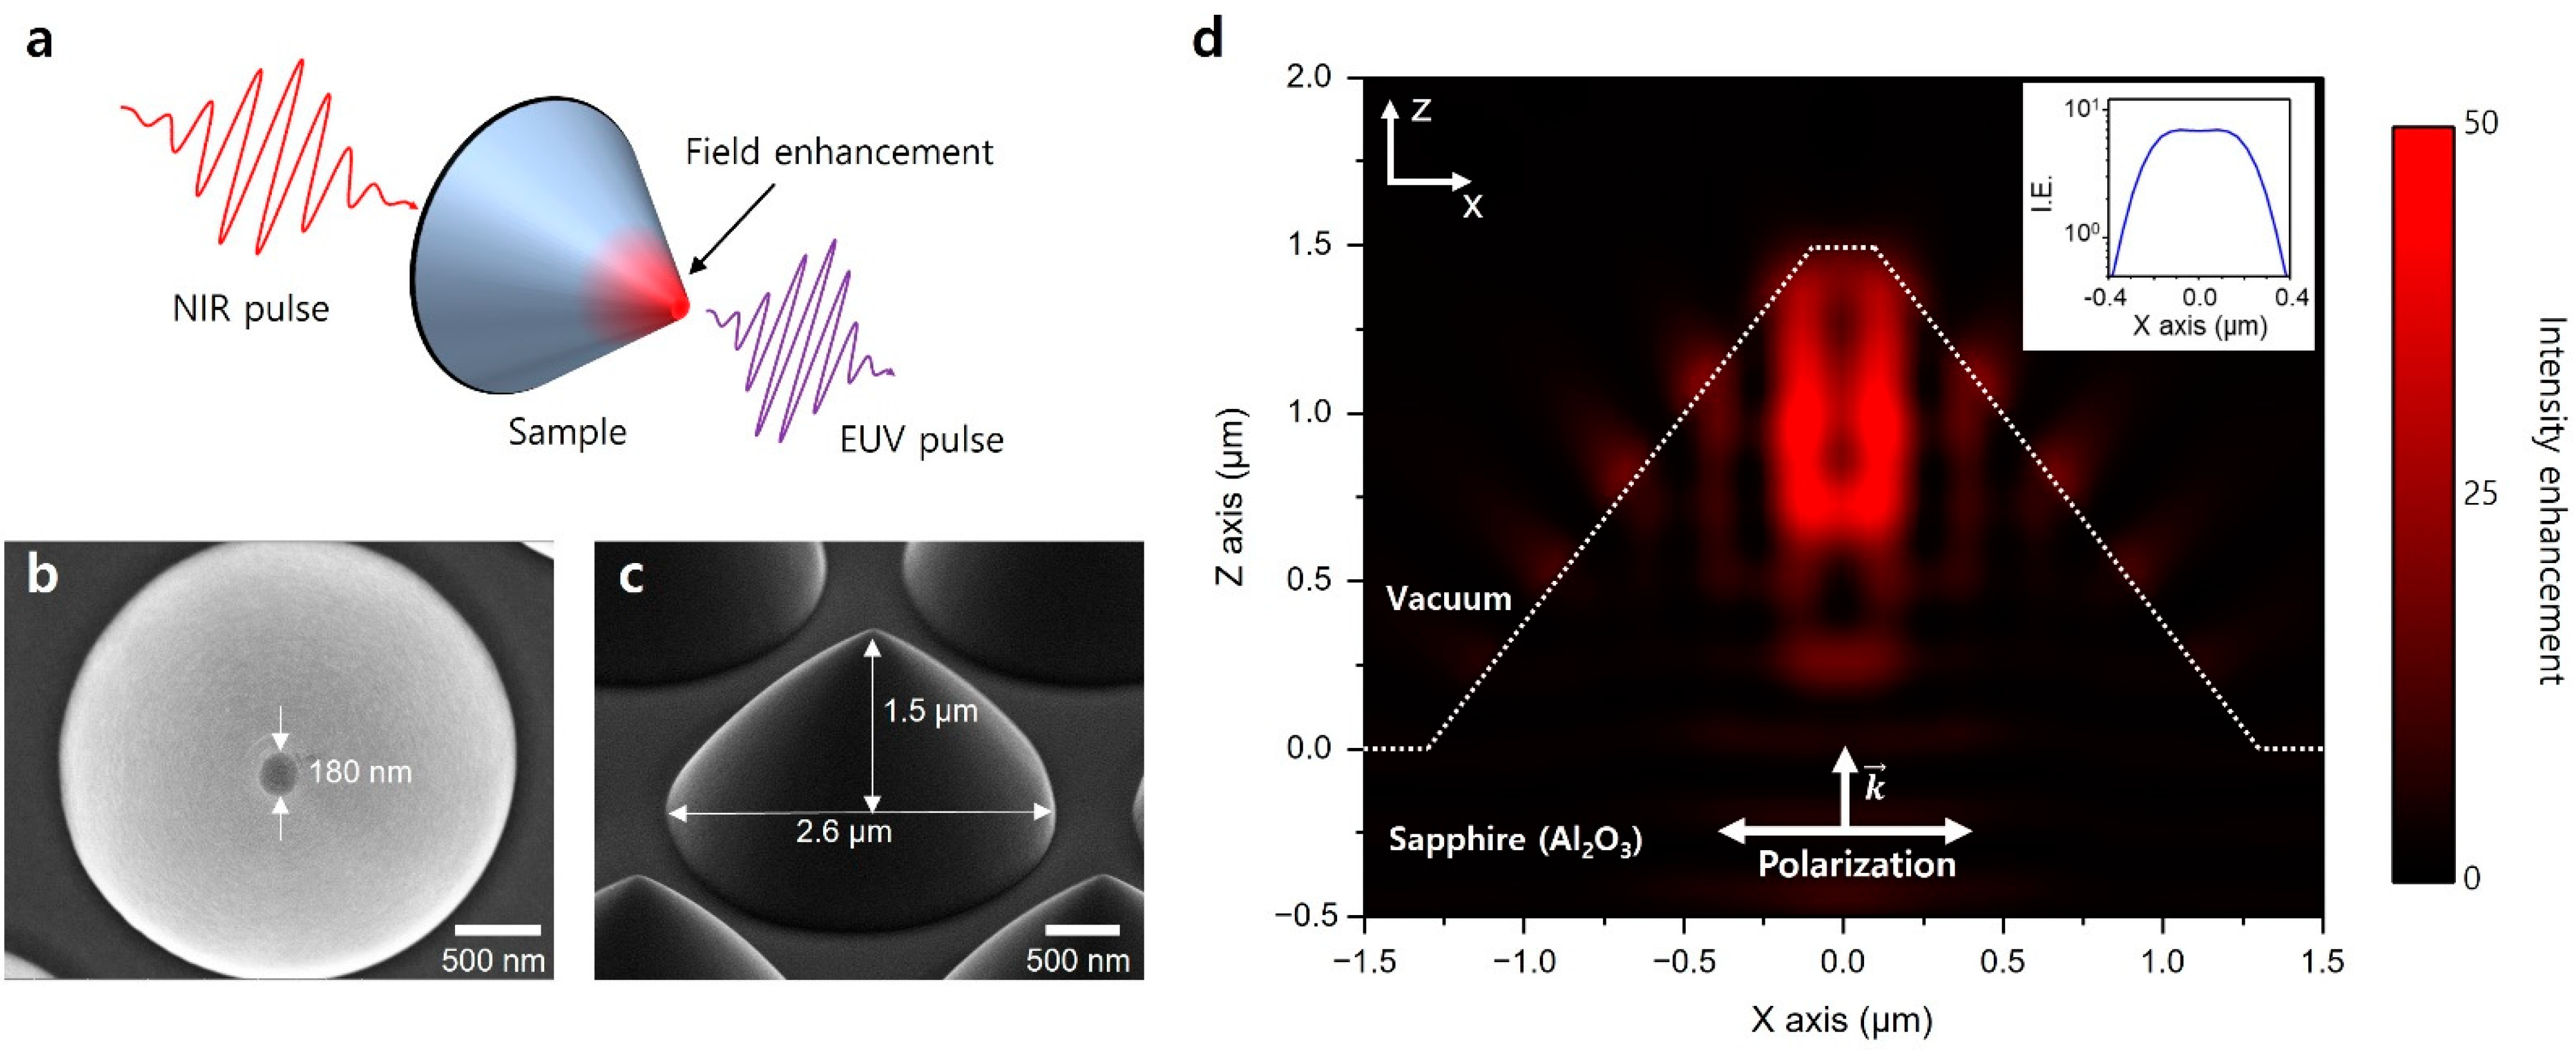
Figure 1a shows a single dielectric nanostructure prepared to generate EUV harmonics by field enhancement. Figure 1b,c show the scanning electron microscopy (SEM) images of the conical sapphire structure. The 1.5 μm long structure, with a 2.6 μm diameter base and 0.2 μm top, was formed using plasma dry etching on a 430 μm-thick flat single-crystalline sapphire wafer with a C-plane. Figure 1d illustrates the field enhancement of the conical sapphire structure. The field enhancement of the structure was calculated using a commercial software program (Lumerical FDTD Solutions). In the finite-difference time-domain (FDTD) calculation, the structure was modeled with cubic elements (5.0 × 5.0 × 5.0 nm). A perfectly matched layer boundary condition was selected to minimize the reflections of the finite boundary. The conical structure was designed as a truncated cone with a top diameter of 180 nm, a height of 1.5 μm, and a base diameter of 2.6 μm. The material properties of sapphire, such as permittivity and refractive index, were obtained from a handbook [32]. The incident laser pulse was assumed to be transform-limited, having an 800 nm center wavelength, with a 12 fs pulse duration. The pulse was incident on the bottom of the sapphire structure with the polarization parallel to the X-axis of the cross-section. The intensity enhancement was defined as . E denotes the amplitude of the enhanced electric field, and E0 is the amplitude of the driving femtosecond laser field. The maximum intensity enhancement occurred inside the center of the conical structure and reached approximately 50. Along the surface of the conical structure, substantial intensity enhancements occurred periodically, reaching approximately 6.8 at the top surface (Figure 1d inset). The enhanced field was symmetric. Since there was no metal-dielectric interface, there was no plasmonic field enhancement as in previous research [30]. The enhancement comes from a combination of the electrostatic lightning-rod effect [33] due to the geometric distinctiveness of sharply pointed structures and an overlapped driving pulse that depends on the internal reflection inside the structure. The enhancements inside the structure and at the inclined surface have periodicity along the X- and Y-axis (Figure 1d). This shows that the overlap between the internally reflected head cycle and the incident tail cycle of the driving femtosecond pulse contributes to enhancement.
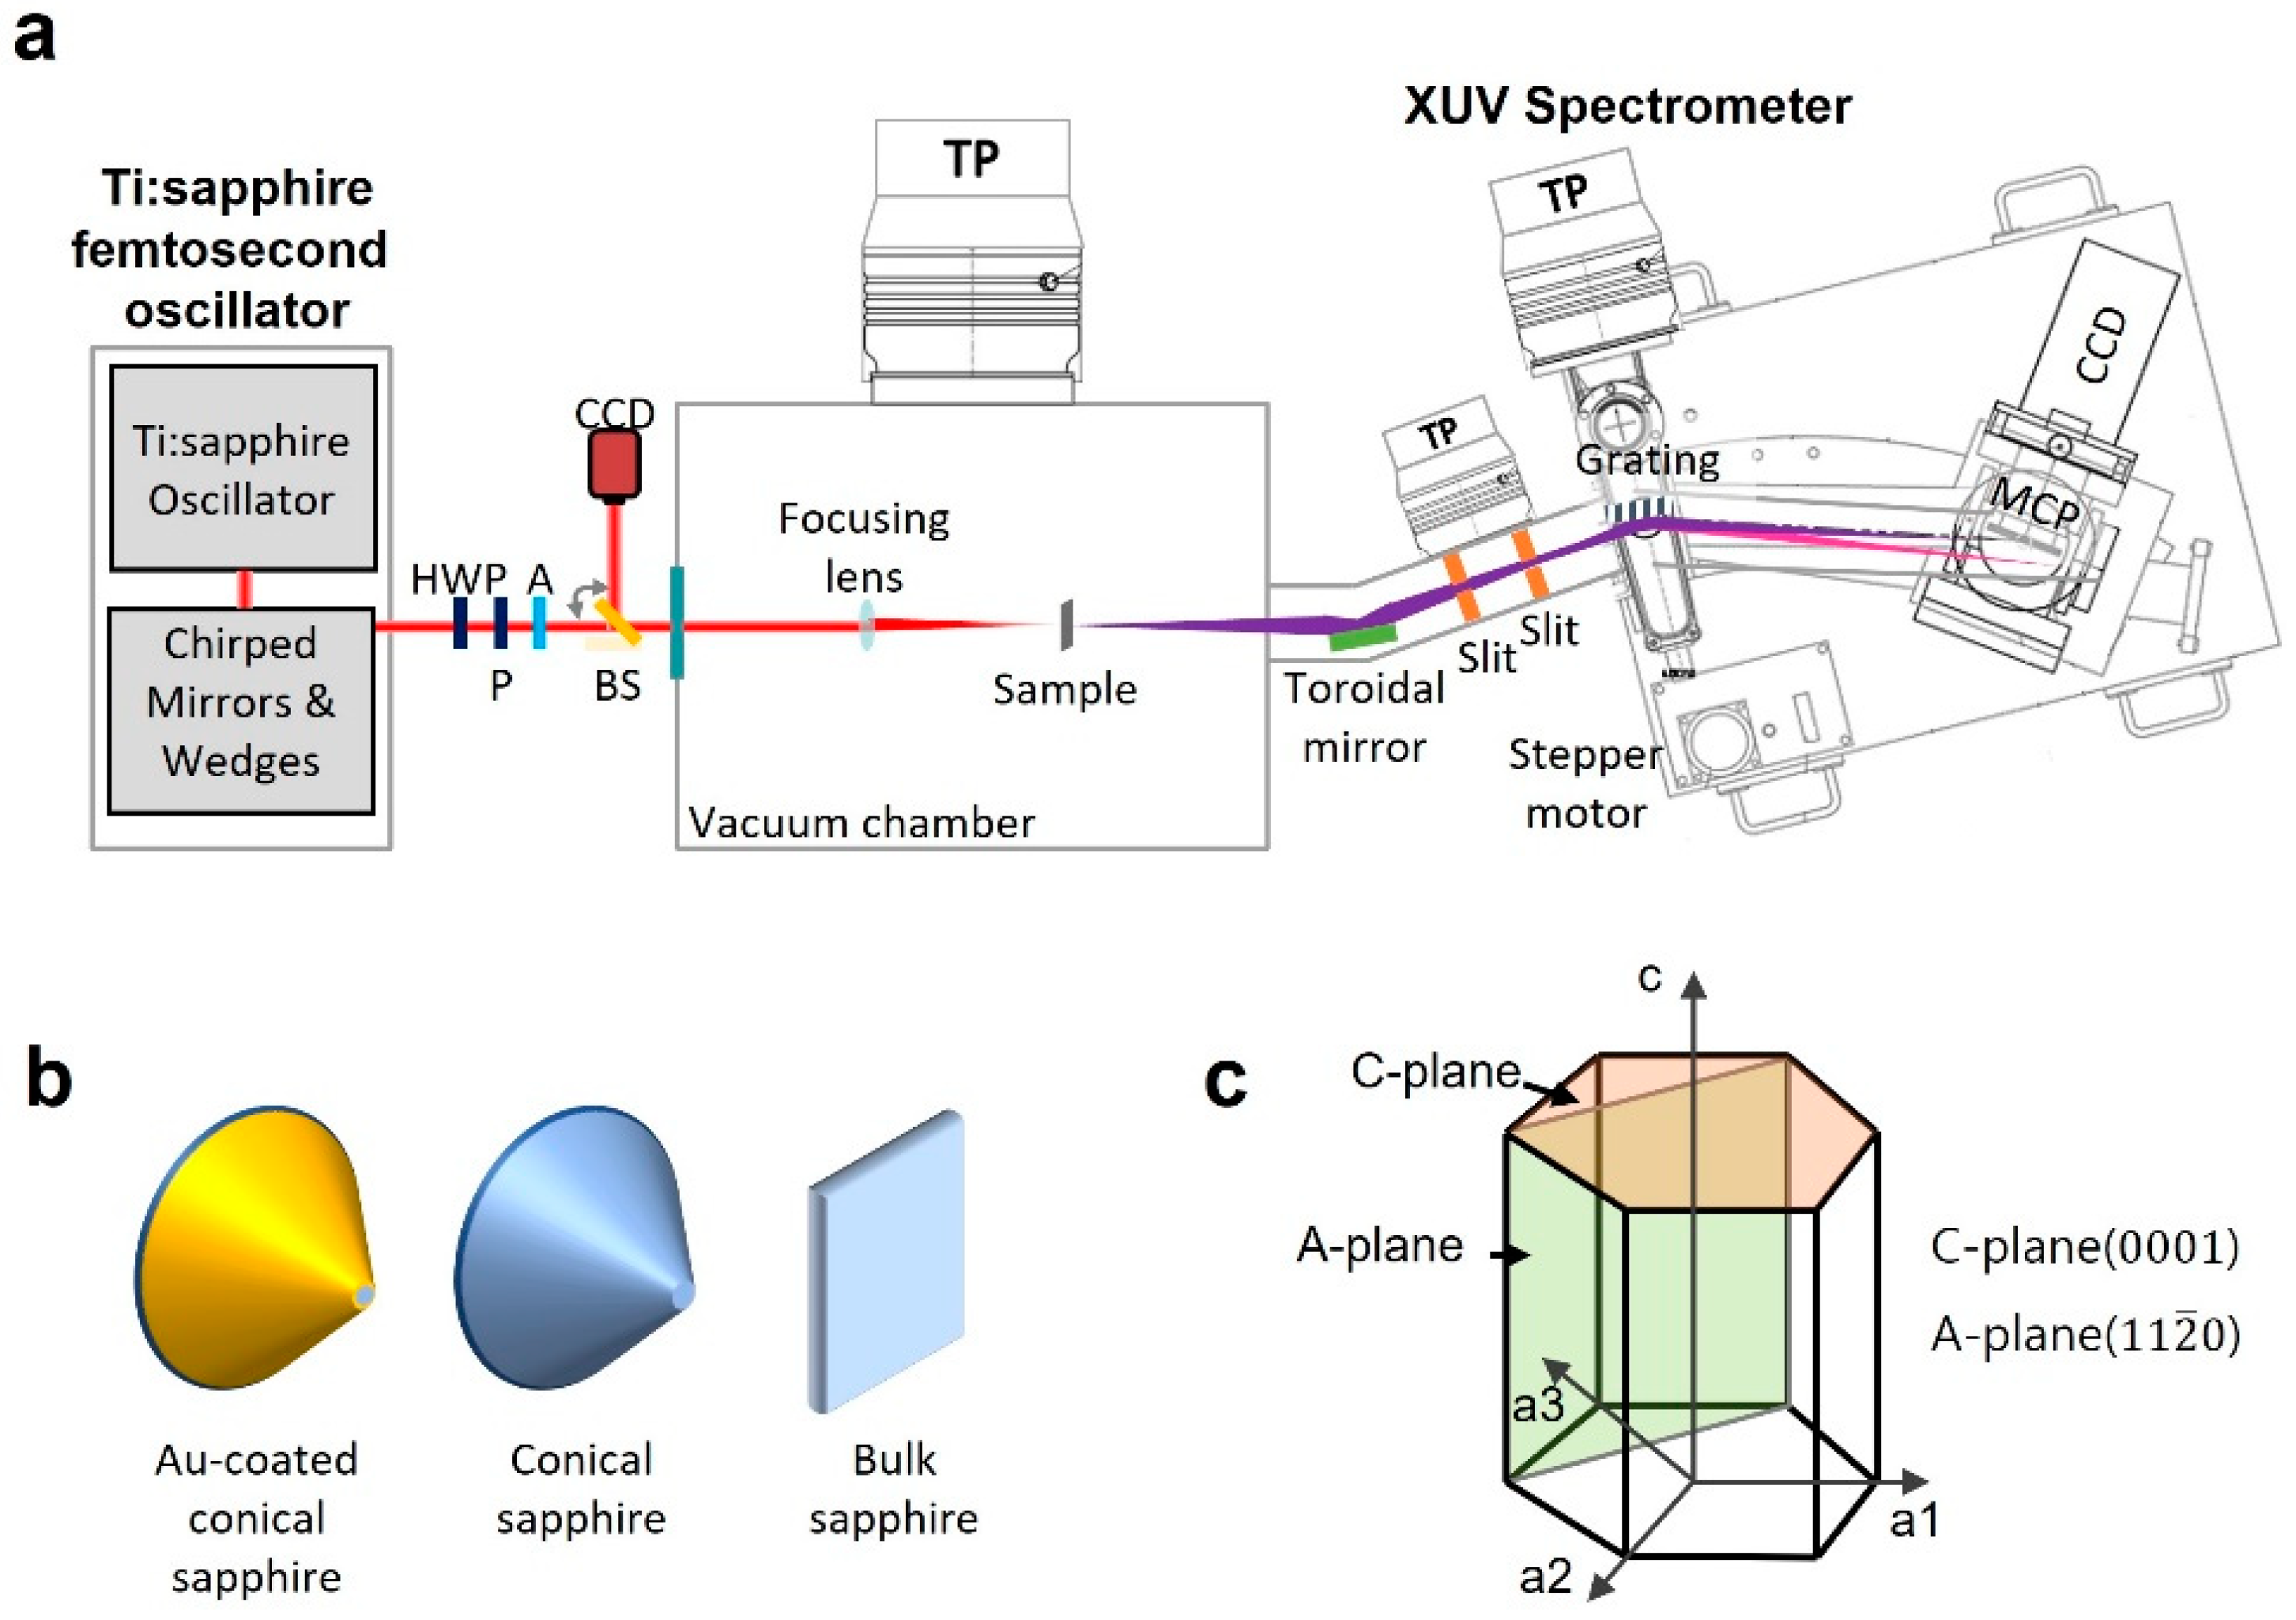
Figure 2a illustrates the schematic of the HHG and spectrum measurement in the EUV band. The Ti:sapphire oscillator emitted 12 fs pulses with an 800 nm center wavelength at a 75 MHz repetition rate. To maintain the short pulse duration of 12 fs on the sample, the chirp induced by the optics was compensated by the chirped mirrors (GSM007, FemtoOptics) and wedges. The half-wave plate and the polarizer control the input pulse energy over a fixed polarization direction. A pellicle beam splitter and a CCD monitor the focal spot position on the sample. The laser was focused by an achromatic triplet lens (f = 6 mm, OA046, FemtoOptics) into the bottom of the conical structure with a spot size of 5 µm. The monitoring system measures the spot size on the sample under low power conditions. The polarization direction of the incident laser field was aligned parallel to the sapphire C-plane and perpendicular to the sapphire A-plane. A toroidal mirror collected the generated EUV radiation emitted from the sample with an acceptance angle of 5° (horizontal) and 8° (vertical). The toroidal mirror’s angle of incidence (AOI) was 80° for high reflectivity in the EUV band. The toroidal mirror refocused the generated EUV light onto the entrance slit of the spectrometer with a grazing incidence diffraction grating (133.6 g/mm, 2° blaze, 84° AOI, Newport, Irvine, CA, USA). The EUV light was measured using a spectrometer with a microchannel plate coupled with a phosphor screen and optical charge-coupled device (DH420A-FO, Andor Technology, Belfast, UK). The pressure of the entire vacuum chamber was maintained at approximately 10−6 mbar during the experiments.
Figure 2b shows three different samples to compare their efficiency of HHG and damage according to the field enhancements. The conical sapphire structure sample was fabricated by plasma dry etching on a 430 µm-thick monocrystalline C-plane sapphire substrate, which was the bulk sapphire sample in this work. The resulting conical sapphire structure had a height of 1.5 µm from the bottom to the apex and a 2.6 µm base diameter at the bottom. The gold-layered conical sapphire structure was fabricated using chemical vacuum deposition of a Au thin film over the entire surface of the conical sapphire structure and focused ion beam milling for flattening of the gold-covered apex. The input laser beam was focused on the bottom of the conical structures and the rear surface of the bulk sapphire sample.
3. Experimental Results
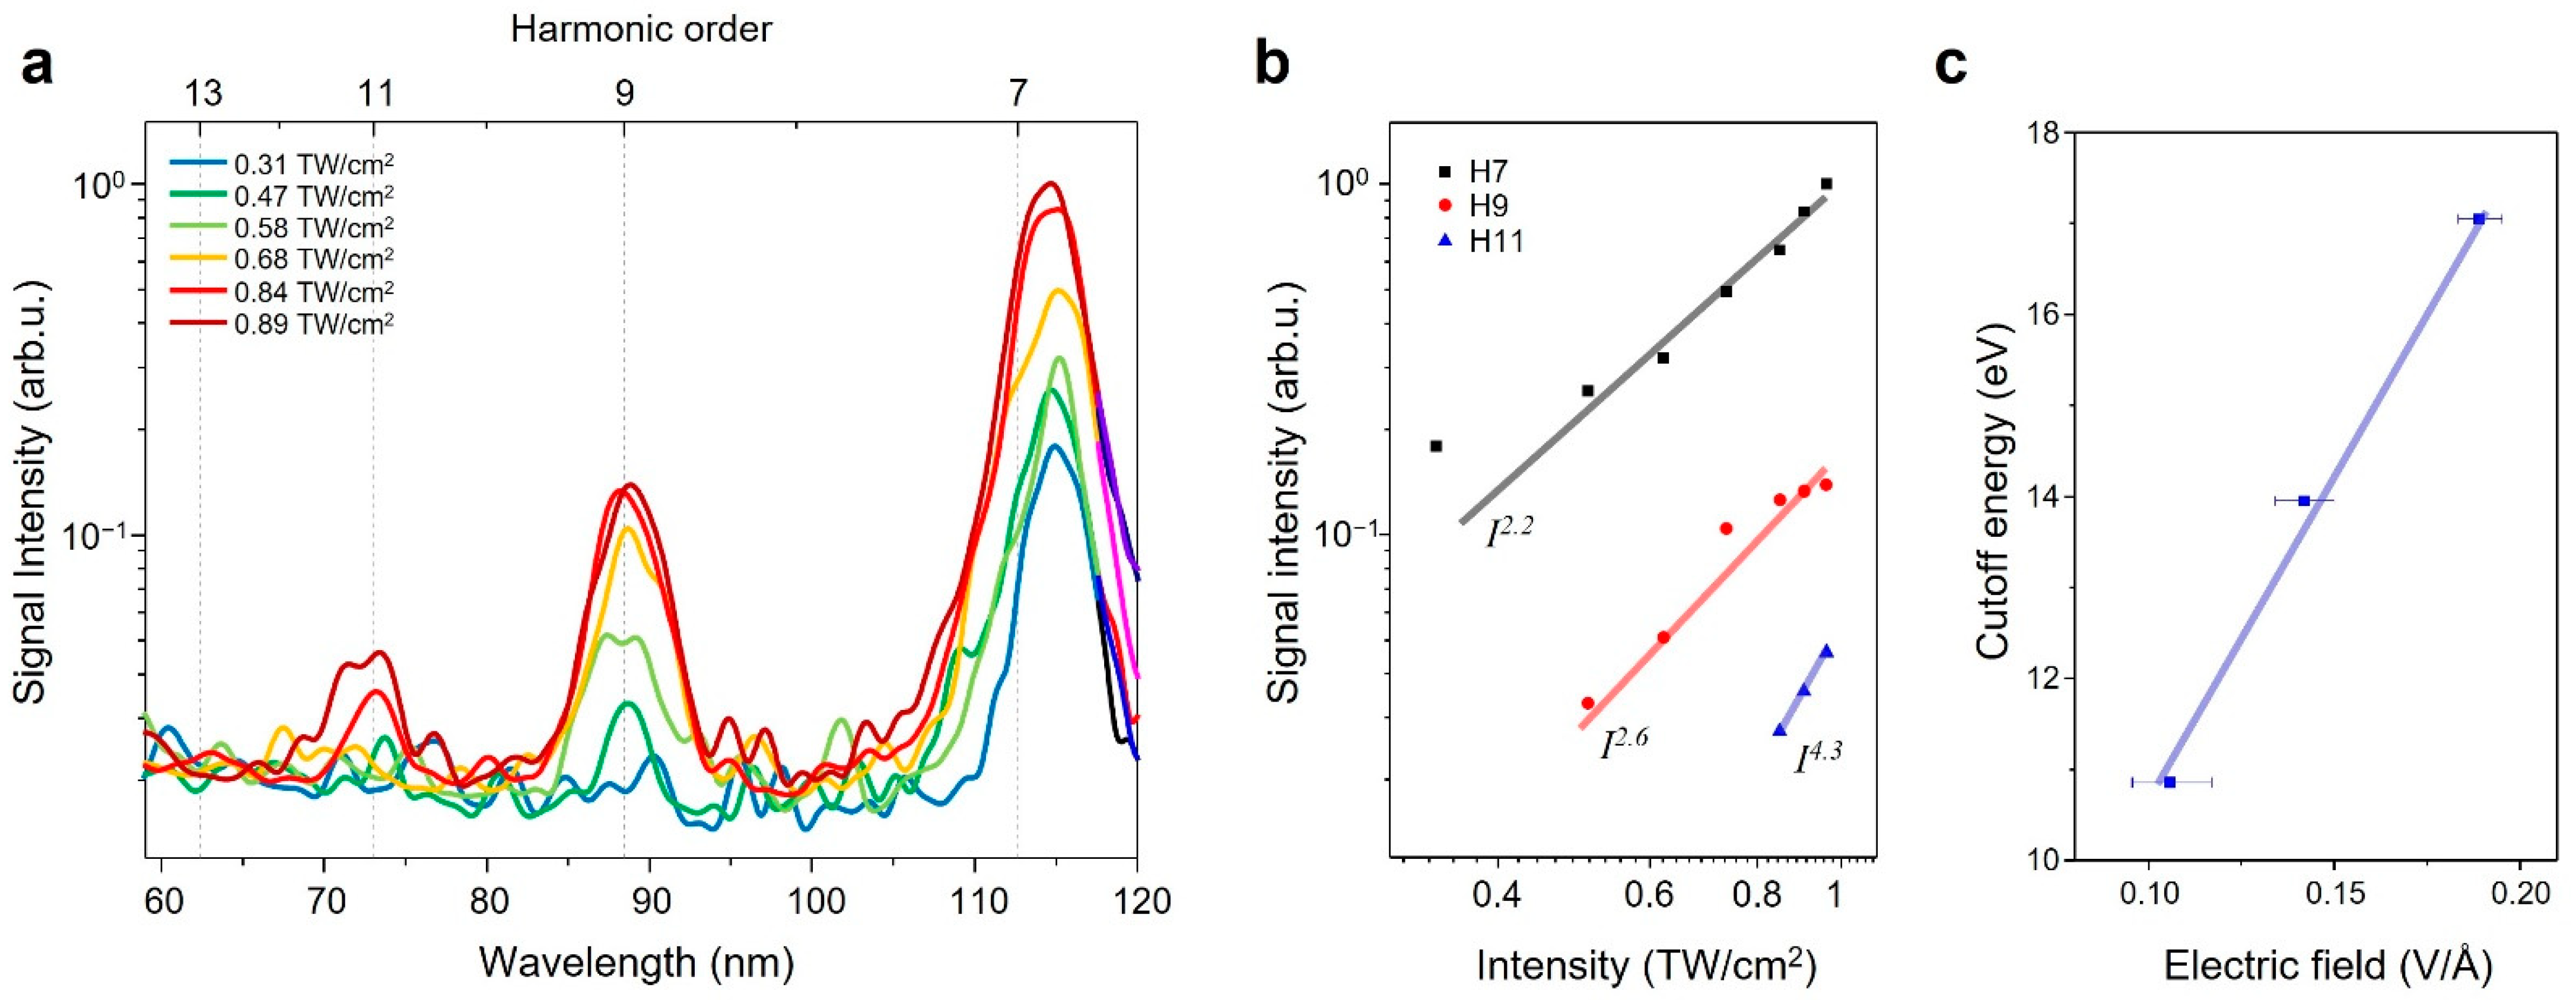
The intensity of the high-order harmonic from the conical sapphire structure depends on the driving laser intensity (Figure 3a). The average laser power was increased from 10 to 170 mW, corresponding to 0.05 to 0.89 TW/cm2 in terms of the peak pulse intensity inside the material. The pulse energy was a few nanojoules. High harmonics up to the 11th order were observed when the focused intensity reached 0.89 TW/cm2. HHG from bulk sapphire in a multi-photon regime follows perturbative scaling, given by , where denotes the intensity of the measured harmonic peaks, I is the peak intensity of the driving pulse, and N denotes the order of the harmonics [25]. Figure 3b shows the dependence of the intensity power for H7, H9, and H11, and each harmonic followed the power law with powers of 2.2, 2.6, and 4.3, respectively. The intensity of the harmonics from the conical sapphire structure behaved non-perturbatively with the laser intensity, similar to the results obtained from the ZnO nanocone [31]. Figure 3c indicates the cutoff energy level of the measured HHG signals, which were linearly scaled with the input electric field in the structure. The cutoff energy was determined as the maximum order of the harmonic peak perceivable in each measured spectrum from the conical sapphire structure.
4. Discussion
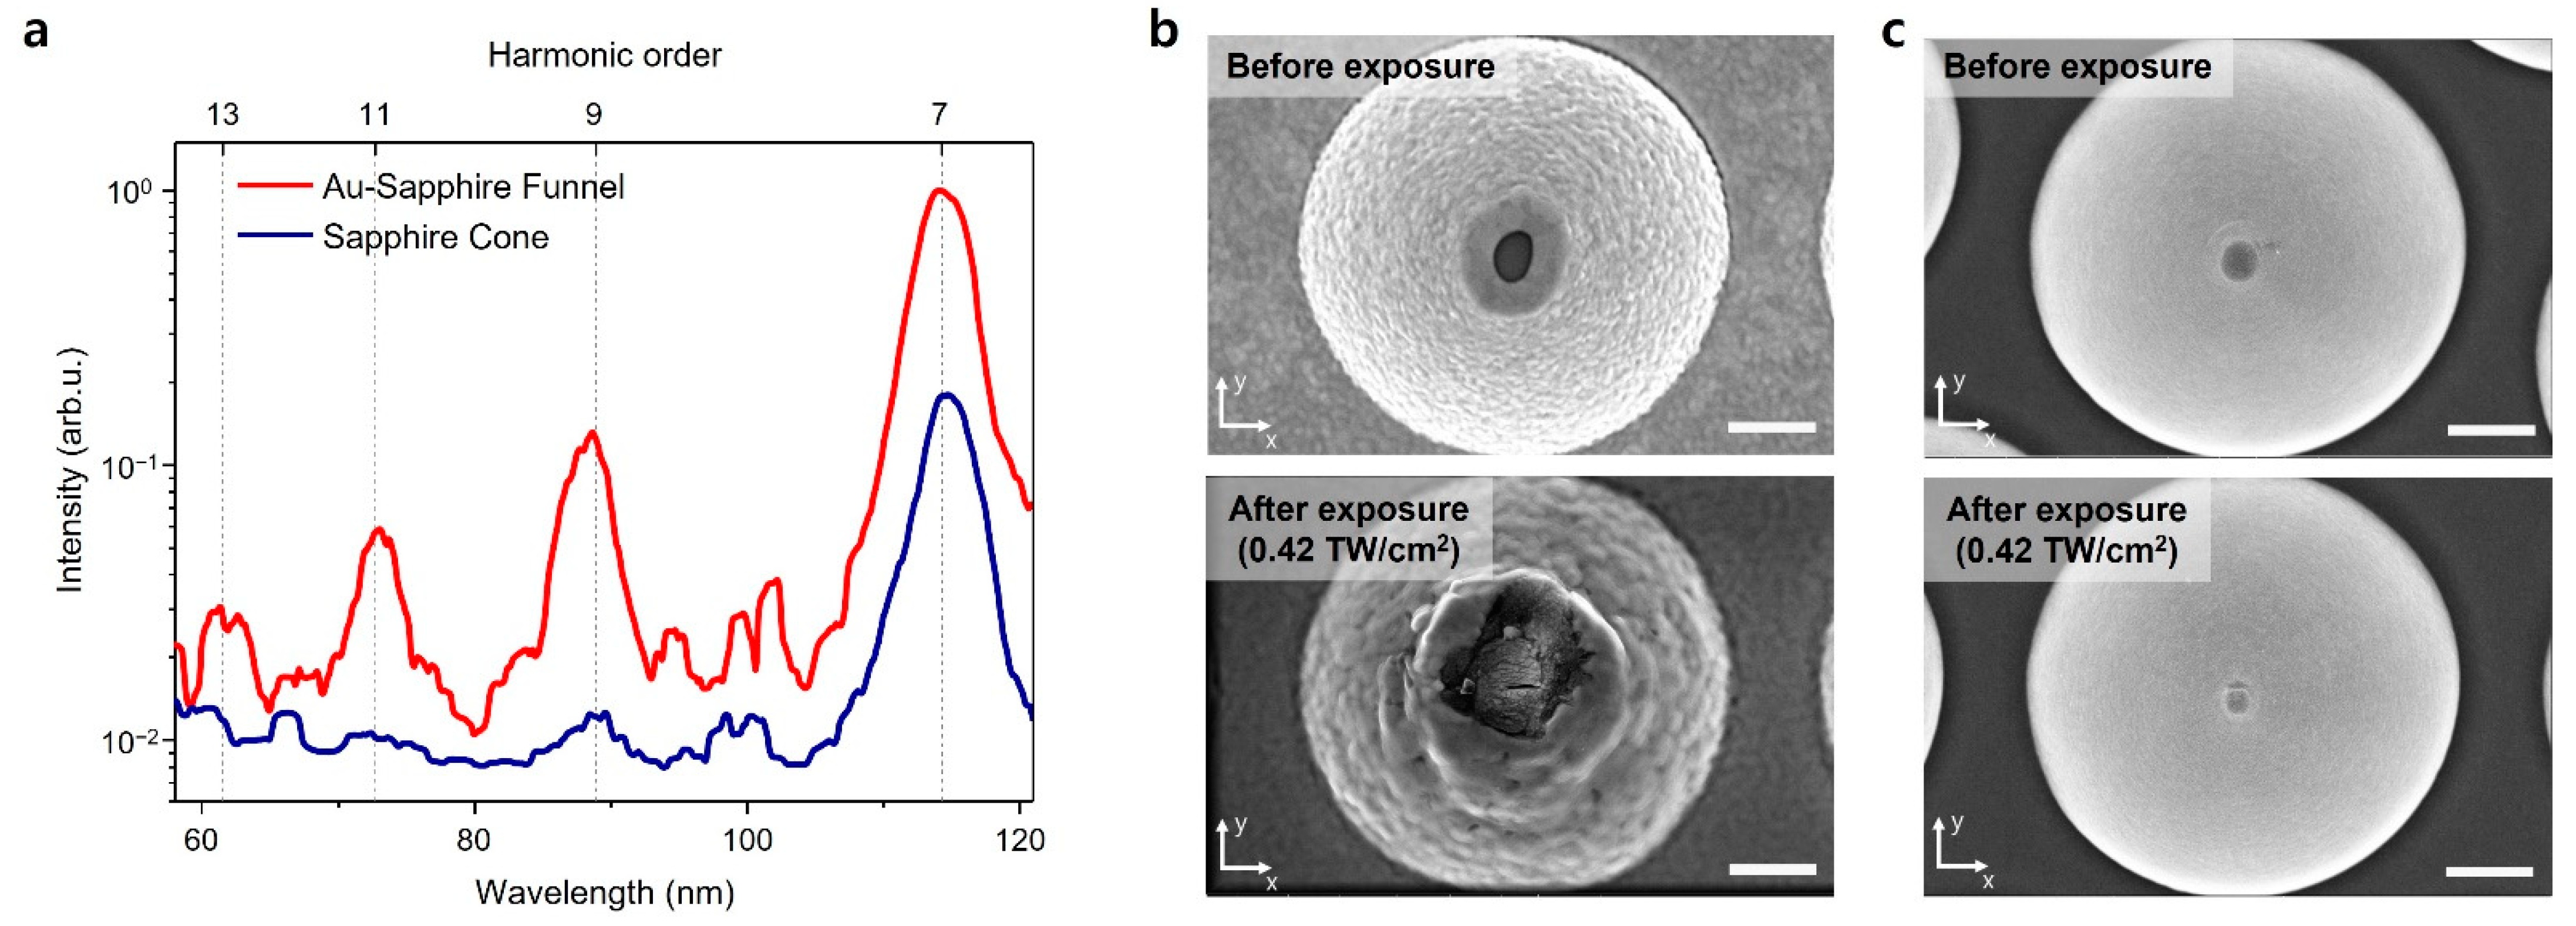
The measured spectra from the gold-layered conical sapphire structure and the conical sapphire structure are shown in Figure 4a. The incident laser intensity was estimated to be 0.42 TW/cm2 in the materials. Both nanostructures amplify the driving laser fields and generate high-order harmonics in the EUV band. The gold-layered sapphire funnel structure emanates harmonics up to the 13th order, and the conical sapphire structure radiates up to the 9th order. The intensity of H7 from the gold-layered conical sapphire structure is six times higher than that from the conical sapphire structure. The profile of the intensity enhancement from the tip of the conical sapphire structure (Figure 1d inset) is different from that of the gold–sapphire funnel structure [30]. The average intensity enhancement of the tip of the conical sapphire structure was approximately 6.8, and the enhancement factor was uniform along the tip surface. The gold-layered conical sapphire structure has an irregular profile with a higher intensity enhancement factor [30]. The maximum enhancement factor was approximately 20 dB at the edge of the tip, which was the metal and dielectric interface. The intensity enhancement factor of the center area reached approximately 10 dB. The higher intensity enhancement of the gold-layered conical sapphire structure led to a higher intensity and cutoff extension of the harmonic generation under identical conditions.
Both nanostructures have spectral peaks between H7 and H9. They are reckoned as even-order harmonics generated by the steep variation in the enhanced electric field on the outlet surface of the structure [34]. The inhomogeneity of the local fields plays an important role in the HHG process and leads to the generation of even-order harmonics. The spectral splitting of the even-order harmonics can be explained by the quantum path difference between the long and short trajectories of the electron excursion [27].
Figure 4b,c compare the gold-layered sapphire funnel structure and the conical sapphire structure. The SEM images were captured after a laser exposure of 0.42 TW/cm2. The SEM image of the conical sapphire structure shows no evident damage compared with that of the structure before laser exposure (Figure 4c). Conversely, the gold-layered sapphire funnel structure showed structural damage. The gold layer was deformed by melting and vaporizing. The surface cracks were formed perpendicular to the direction of the incident laser polarization, which is shown along the Y-axis on the SEM image (Figure 4b bottom; [35]). According to [30], a substantial field enhancement of the gold-layered sapphire funnel structure causes thermal damage even for weak input laser intensities of ~0.1 TW/cm2. Initial signs of thermal damage are the deformation of the gold layer and surface cracking. The deformed structure has reduced field enhancement, and the EUV yield from the structure varies with the exposure time. The conical sapphire structure had a structural change at the apex (Figure 4c bottom), but the EUV harmonics were generated repeatedly under the experimental conditions.
To compare the HHG with the ZnO nanocone [31], the conical sapphire structure generated high-order harmonics in the EUV band, not the UV–Vis bands. EUV signals generated only from the surface of the structures were measured because the solid medium re-absorbed the EUV signals from the inside material. Accordingly, the surface shape should be considered in the design of a nanoscale EUV emitter to control EUV propagation [28].
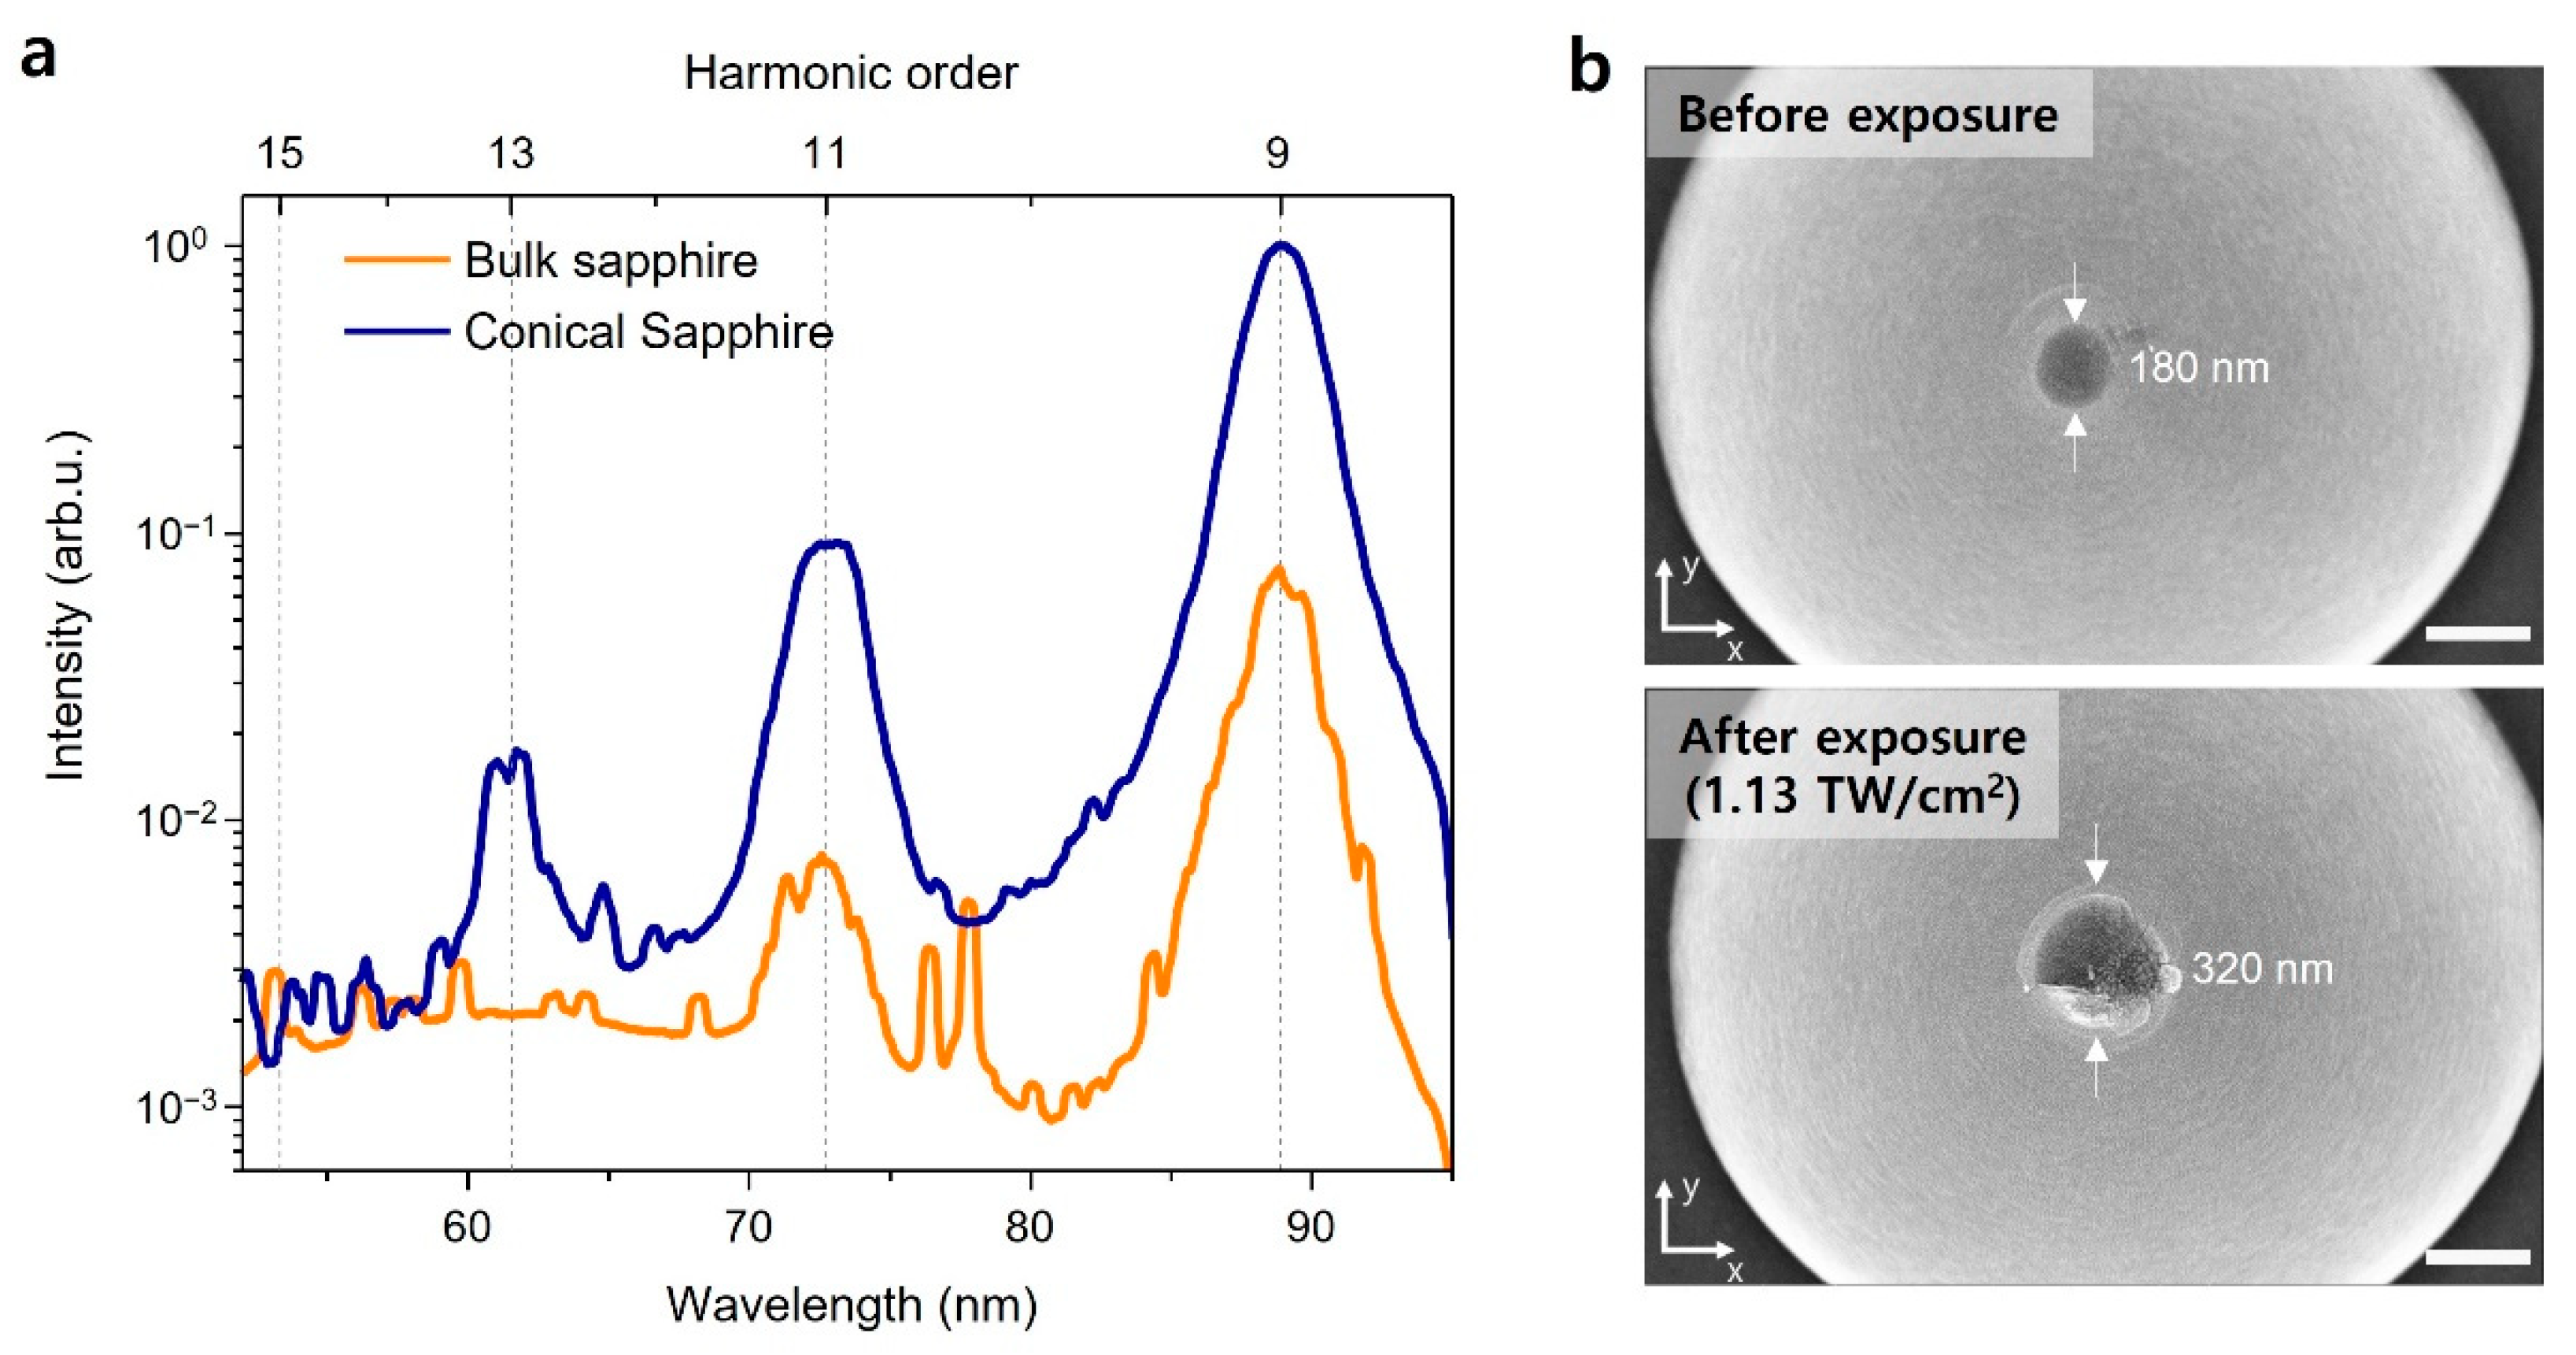
Figure 5a shows the measured spectra in the EUV band from the bulk sapphire surface and the conical sapphire structure. The incident laser power was 200 mW, and the incident intensity was estimated to be 1.13 TW/cm2 in the sapphire. The bulk sapphire surface emanated odd-order harmonics of the fundamental driving laser pulse below the positions of H9 and H11 in the detection range. However, the conical sapphire structure generated harmonics up to the 13th order with higher signal intensity. The extension of the cutoff implies that the conical dielectric structure enhanced the laser field and boosted the high-order nonlinear reaction of the electrons in the sapphire crystal. The intensities of H9 and H11 from the conical structure were approximately 14 and 13 times higher than those of the bulk sapphire, respectively. To obtain a high-order harmonic signal that is 10 times stronger than that of the flat sapphire, the laser pulses should be irradiated with approximately 1.5 times higher intensity, according to one study conducted on HHG using flat sapphire [25]. According to the measured spectrum, the conical structure provided an average intensity enhancement factor of approximately 1.7, which was smaller than the intensity enhancement calculated using FDTD (Figure 3b). The large divergence of the generated EUV signal and the short propagation length of the harmonics in the EUV band to the structure played an important role in the HHG process and led to lower efficiency. The harmonics generated from the inclined surface propagated along the driving laser path after the solid structure [28], so the substantial enhancement on the incline did not contribute to the measured HHG spectra. The conical structure can act as an axicon lens, providing the generated harmonics with a large divergence angle, and the spectrometer’s acceptance angle limits the detection efficiency of the harmonics. The strong absorption of the structure limits the propagation of the generated EUV signal inside the structure. A 20 nm-thick sapphire transmission is 0.097 for H7, 0.23 for H9, and 0.37 for H11 [36]. It is supposed that the strong field enhancement inside the conical structure offers limited contributions to the measured spectrum because the generated harmonics in the EUV band would be absorbed by the sapphire structure [30].
The EUV spectrum from the conical sapphire nanostructure also had spectral peaks between H9 and H11. However, there was no peak-like signal from the bulk sapphire. This means that the spectral peaks between odd-order harmonics originated from the inhomogeneity of the locally enhanced field at the nanostructure. There is no atomic emission line matched to the spectral position of the spectral peaks between the odd-order harmonics.
Figure 5b shows the SEM images of the conical sapphire structures before and after laser exposure. A strong field enhancement induced damage to the sapphire tip at a laser intensity of 1.13 TW/cm2. The all-dielectric structure without the metal layer of a relatively low melting point had no evident structural deformations; this observation contrasts the prior research conducted on the metal–sapphire cone structure [30]. The damage occurred on the tip end of the sapphire cone with no structural changes in other areas. The damage on the tip was a crack in the surface center accompanied by a structural change in the periphery. The material in the hot spot could be melted and collected on the surface, resulting in the dot shape. The temperature of the conical tip reached higher than the melting point of the sapphire (2313 K).
5. Conclusions
This study demonstrated durable and efficient HHG in the EUV band through the field enhancement of a single conical sapphire nanostructure. The experiments performed in this investigation demonstrated the conical sapphire structure as an effective emitter that produces coherent EUV harmonics at wavelengths up to ~60 nm for laser intensities of 1.13 TW/cm2 with nJ-energy pulses emitted from a Ti:sapphire femtosecond oscillator. The observed harmonics in the EUV band had non-perturbative behavior to the incident laser intensity. By comparing the conical sapphire structure with the gold-layered conical sapphire structure, we demonstrated the different EUV harmonic yields according to the field enhancements, and it was observed that the conical sapphire structure had a higher damage threshold and was reusable under the experimental conditions. The conical sapphire structure enhanced harmonics by at least one order of magnitude compared to bulk sapphire. The all-dielectric nanostructure with good durability and field enhancement can boost nonlinear processes on a table-top scale without an external laser amplification system. A nanoscale coherent EUV emitter can facilitate the realization of compact and robust EUV-based applications for lithography, spectroscopy, microscopy, and atto-sciences.
6. Methods
Laser intensity calculation. The peak intensity Ip of the incident laser field in vacuum was calculated as . Pa denotes the average laser power, Fr is the pulse repetition rate, Tp is the pulse duration, and Af is the focal area. The peak intensity was reduced inside the sapphire samples due to the reflection loss from the specimen surface by a factor of , with n being the refractive index of sapphire (1.76), assuming the laser was incident normal to the samples.
Scanning electron microscope. The SEM images were captured using Helios Nanolab 450 F1. The used electron source was the Schottky thermal field emitter. The SEM resolution was 0.9 nm at 1 kV and 0.8 nm at 5 kV.
Funding
This research was funded by the National Research Foundation of Korea (NRF), grant number 2021R1C1C100982512.
Institutional Review Board Statement
Not applicable.
Informed Consent Statement
Not applicable.
Data Availability Statement
Not applicable.
Acknowledgments
S. Han thanks the KAIST Analysis Center for Research Advancement for providing assistance in fabricating the samples for this study.
Conflicts of Interest
The authors declare no conflict of interest.
References
- Corkum, P.B. Plasma perspective on strong field multiphoton ionization. Phys. Rev. Lett. 1993, 71, 1994–1997. [Google Scholar] [CrossRef] [PubMed] [Green Version]
- Lewenstein, M.; Balcou, P.; Ivanov, M.Y.; L’Huillier, A.; Corkum, P.B. Theory of high-harmonic generation by low-frequency laser fields. Phys. Rev. A 1994, 49, 2117–2132. [Google Scholar] [CrossRef] [PubMed]
- Corkum, P.B.; Krausz, F. Attosecond science. Nat. Phys. 2007, 3, 381–387. [Google Scholar] [CrossRef]
- Hentschel, M.; Kienberger, R.; Spielmann, C.; Reider, G.A.; Milosevic, N.; Brabec, T.; Corkum, P.; Heinzmann, U.; Drescher, M.; Krausz, F. Attosecond metrology. Nature 2001, 414, 509–513. [Google Scholar] [CrossRef] [PubMed]
- Chang, Z.; Rundquist, A.; Wang, H.; Murnane, M.; Kapteyn, H. Generation of Coherent Soft X Rays at 2.7 nm Using High Harmonics. Phys. Rev. Lett. 1997, 79, 2967–2970. [Google Scholar] [CrossRef] [Green Version]
- Remetter, T.; Johnsson, P.; Mauritsson, J.; Varjú, K.; Ni, Y.; Lépine, F.; Gustafsson, E.; Kling, M.; Khan, J.; López-Martens, R.; et al. Attosecond electron wave packet interferometry. Nat. Phys. 2006, 2, 323–326. [Google Scholar] [CrossRef]
- Breidbach, J.; Cederbaum, L.S. Universal attosecond response to the removal of an electron. Phys. Rev. Lett. 2005, 94, 033901. [Google Scholar] [CrossRef]
- Kraus, P.M.; Mignolet, B.; Baykusheva, D.; Rupenyan, A.; Horný, L.; Penka, E.F.; Grassi, G.; Tolstikhin, O.I.; Schneider, J.; Jensen, F.; et al. Measurement and laser control of attosecond charge migration in ionized iodoacetylene. Science 2015, 350, 790–795. [Google Scholar] [CrossRef] [Green Version]
- Wu, M.; Chen, S.; Camp, S.; Schafer, K.J.; Gaarde, M.B. Theory of strong-field attosecond transient absorption. J. Phys. B At. Mol. Opt. Phys. 2016, 49, 062003. [Google Scholar] [CrossRef]
- Chew, A.; Douguet, N.; Cariker, C.; Li, J.; Lindroth, E.; Ren, X.; Yin, Y.; Argenti, L.; Hill, W.T.; Chang, Z. Attosecond transient absorption spectrum of argon at the L2,3 edge. Phys. Rev. A 2018, 97, 031407. [Google Scholar] [CrossRef] [Green Version]
- Drescher, M.; Hentschel, M.; Kienberger, R.; Uiberacker, M.; Yakovlev, V.; Scrinzi, A.; Westerwalbesloh, T.; Kleineberg, U.; Heinzmann, U.; Krausz, F. Time-resolved atomic inner-shell spectroscopy. Nature 2002, 419, 803–807. [Google Scholar] [CrossRef] [PubMed]
- Solak, H.H. Nanolithography with coherent extreme ultraviolet light. J. Phys. D Appl. Phys. 2006, 39, R171–R188. [Google Scholar] [CrossRef]
- Ferray, M.; L’Huillier, A.; Li, X.F.; Lompre, L.A.; Mainfray, G.; Manus, C. Multiple-harmonic conversion of 1064 nm radiation in rare gases. J. Phys. B At. Mol. Opt. Phys. 1988, 21, L31–L35. [Google Scholar] [CrossRef]
- Schafer, K.J.; Yang, B.; Dimauro, L.F.; Kulander, K.C. Above threshold ionization beyond the high harmonic cutoff. Phys. Rev. Lett. 1993, 70, 1599–1602. [Google Scholar] [CrossRef] [PubMed]
- Constant, E.; Garzella, D.; Breger, P.; Mével, E.; Dorrer, C.; Le Blanc, C.; Salin, F.; Agostini, P. Optimizing High Harmonic Generation in Absorbing Gases: Model and Experiment. Phys. Rev. Lett. 1999, 82, 1668. [Google Scholar] [CrossRef]
- Ganeev, R.A. High-order harmonic generation in a laser plasma: A review of recent achievements. J. Phys. B At. Mol. Opt. Phys. 2007, 40, R213–R253. [Google Scholar] [CrossRef]
- Ghimire, S.; DiChiara, A.D.; Sistrunk, E.; Agostini, P.; DiMauro, L.F.; Reis, D.A. Observation of high-order harmonic generation in a bulk crystal. Nat. Phys. 2011, 7, 138–141. [Google Scholar] [CrossRef]
- Ghimire, S.; DiChiara, A.D.; Sistrunk, E.; Ndabashimiye, G.; Szafruga, U.B.; Mohammad, A.; Agostini, P.; DiMauro, L.F.; Reis, D.A. Generation and propagation of high-order harmonics in crystals. Phys. Rev. A 2012, 85, 043836. [Google Scholar] [CrossRef] [Green Version]
- Ghimire, S.; Reis, D.A. High-harmonic generation from solids. Nat. Phys. 2018, 15, 10–16. [Google Scholar] [CrossRef]
- Garg, M.; Zhan, M.; Luu, T.T.; Lakhotia, H.; Klostermann, T.; Guggenmos, A.; Goulielmakis, E. Multi-petahertz electronic metrology. Nature 2016, 538, 359–363. [Google Scholar] [CrossRef]
- Vampa, G.; Hammond, T.J.; Thire, N.; Schmidt, B.E.; Legare, F.; McDonald, C.R.; Brabec, T.; Corkum, P.B. Linking high harmonics from gases and solids. Nature 2015, 522, 462–464. [Google Scholar] [CrossRef] [PubMed]
- Ndabashimiye, G.; Ghimire, S.; Wu, M.; Browne, D.A.; Schafer, K.J.; Gaarde, M.B.; Reis, D.A. Solid-state harmonics beyond the atomic limit. Nature 2016, 534, 520–523. [Google Scholar] [CrossRef] [PubMed]
- Osika, E.N.; Chacón, A.; Ortmann, L.; Suárez, N.; Pérez-Hernández, J.A.; Szafran, B.; Ciappina, M.F.; Sols, F.; Landsman, A.S.; Lewenstein, M. Wannier-bloch approach to localization in high-harmonics generation in solids. Phys. Rev. X 2017, 7, 021017. [Google Scholar] [CrossRef] [Green Version]
- Vampa, G.; McDonald, C.R.; Orlando, G.; Corkum, P.B.; Brabec, T. Semiclassical analysis of high harmonic generation in bulk crystals. Phys. Rev. B 2015, 91, 064302. [Google Scholar] [CrossRef] [Green Version]
- Han, S.; Ortmann, L.; Kim, H.; Kim, Y.W.; Oka, T.; Chacon, A.; Doran, B.; Ciappina, M.; Lewenstein, M.; Kim, S.-W.; et al. Extraction of higher-order nonlinear electronic response in solids using high harmonic generation. Nat. Commun. 2019, 10, 3272. [Google Scholar] [CrossRef]
- You, Y.S.; Reis, D.A.; Ghimire, S. Anisotropic high-harmonic generation in bulk crystals. Nat. Phys. 2016, 13, 345–349. [Google Scholar] [CrossRef]
- Kim, Y.W.; Shao, T.; Kim, H.; Han, S.; Kim, S.; Ciappina, M.; Bian, X.-B.; Kim, S.-W. Spectral Interference in High Harmonic Generation from Solids. ACS Photonics 2019, 6, 851–857. [Google Scholar] [CrossRef] [Green Version]
- Kim, H.; Han, S.; Kim, Y.W.; Kim, S.; Kim, S. Generation of Coherent Extreme-Ultraviolet Radiation from Bulk Sapphire Crystal. ACS Photonics 2017, 4, 1627–1632. [Google Scholar] [CrossRef] [Green Version]
- Sivis, M.; Taucer, M.; Vampa, G.; Johnston, K.; Staudte, A.; Naumov, A.Y.; Villeneuve, D.M.; Ropers, C.; Corkum, P.B. Tailored semiconductors for high-harmonic optoelectronics. Science 2017, 357, 303–306. [Google Scholar] [CrossRef] [Green Version]
- Han, S.; Kim, H.; Kim, Y.W.; Kim, Y.-J.; Kim, S.; Park, I.; Kim, S. High-harmonic generation by field enhanced femtosecond pulses in metal-sapphire nanostructure. Nat. Commun. 2016, 7, 13105. [Google Scholar] [CrossRef] [Green Version]
- Franz, D.; Kaassamani, S.; Gauthier, D.; Nicolas, R.; Kholodtsova, M.; Douillard, L.; Gomes, J.T.; Lavoute, L.; Gaponov, D.; Ducros, N.; et al. All semiconductor enhanced high-harmonic generation from a single nanostructured cone. Sci. Rep. 2019, 9, 6–12. [Google Scholar] [CrossRef] [PubMed]
- Palik, E.D. Handbook of Optical Constants of Solids; Academic Press: Cambridge, MA, USA, 1998. [Google Scholar]
- Bouhelier, A.; Beversluis, M.; Hartschuh, A.; Novotny, L. Near-Field Second-Harmonic Generation Induced by Local Field Enhancement. Phys. Rev. Lett. 2003, 90, 4. [Google Scholar] [CrossRef] [PubMed] [Green Version]
- Ciappina, M.F.; Biegert, J.; Quidant, R.; Lewenstein, M. High-order-harmonic generation from inhomogeneous fields. Phys. Rev. A 2012, 85, 033828. [Google Scholar] [CrossRef] [Green Version]
- Tan, B.; Venkatakrishnan, K. A femtosecond laser-induced periodical surface structure on crystalline silicon. J. Micromech. Microeng. 2006, 16, 1080–1085. [Google Scholar] [CrossRef]
- Henke, B.L.; Gullikson, E.M.; Davis, J.C. X-Ray Interactions: Photoabsorption, Scattering, Transmission, and Reflection at E = 50–30,000 eV, Z = 1–92. At. Data Nucl. Data Tables 1993, 54, 181–342. [Google Scholar] [CrossRef] [Green Version]
Figure 1.
(a) Concept of field EUV pulse generation employing field enhancement along with the conical sapphire structure. SEM images of the conical sapphire structure in top view (b) and tilted view (c). The scale bars represent 500 nm. (d) FDTD calculation of the intensity enhancement of the single conical sapphire structure. Enhanced intensity distribution across the conical sapphire nanostructure on the XZ plane. Inset: the calculated intensity enhancement profile on the end tip surface of the conical sapphire structure on the XZ plane.

Figure 2.
Experimental setup. (a) A Ti:sapphire femtosecond oscillator with 800 nm operating wavelength, 12 fs pulse duration, and 75 MHz repetition rate was used in the experiments. HWP: half-wave plate, P: polarizer, A: aperture for alignment, BS: pellicle beam splitter, TP: turbopump, MCP: microchannel plate, CCD: charge-coupled device. (b) Three different samples (Au-coated conical sapphire structure, conical sapphire structure, bulk fat sapphire structure) generated high-order harmonics in the EUV band. (c) Sapphire crystal structure.

Figure 3.
High-harmonic generation from a conical sapphire structure. (a) Measured EUV spectra with increasing driving intensity. (b) Intensity dependence and power law of the harmonic intensity for the seventh (H7)-, ninth (H9)-, and eleventh (H11)-order harmonic from the conical sapphire structure. The lines represent the fitting of harmonic intensity with the type of IN. (c) Cutoff energy vs. electric field of the driving laser in the sample. The blue dots indicate the cutoff energy for each electric field. The blue line represents the linear least-square fitting of measured data.

Figure 4.
Comparison between the conical sapphire structure and the gold–sapphire funnel structure. (a) Measured EUV spectra from the conical sapphire structure (blue) and the gold-coated conical sapphire structure (red). The input intensity of the driving laser is 0.42 TW/cm2. (b) SEM images of the gold-coated conical sapphire structure before laser exposure (top) and after laser exposure (bottom). (c) SEM images of the conical sapphire structure before the laser exposure (top) and after (bottom). The scale bars are 500 nm.

Figure 5.
Comparison between the conical sapphire structure and the bulk sapphire surface. (a) Measured EUV spectra from the conical sapphire structure (blue) and the flat sapphire surface (orange). The input intensity of the driving laser is 1.13 TW/cm2. (b) SEM images of the sample before (top) and after (bottom) laser exposure. The scale bars are 300 nm.

Publisher’s Note: MDPI stays neutral with regard to jurisdictional claims in published maps and institutional affiliations. |
© 2022 by the author. Licensee MDPI, Basel, Switzerland. This article is an open access article distributed under the terms and conditions of the Creative Commons Attribution (CC BY) license (https://creativecommons.org/licenses/by/4.0/).
Share and Cite
MDPI and ACS Style
Han, S. High-Harmonic Generation Using a Single Dielectric Nanostructure. Photonics 2022, 9, 427. https://doi.org/10.3390/photonics9060427
AMA Style
Han S. High-Harmonic Generation Using a Single Dielectric Nanostructure. Photonics. 2022; 9(6):427. https://doi.org/10.3390/photonics9060427
Chicago/Turabian StyleHan, Seunghwoi. 2022. "High-Harmonic Generation Using a Single Dielectric Nanostructure" Photonics 9, no. 6: 427. https://doi.org/10.3390/photonics9060427
Note that from the first issue of 2016, this journal uses article numbers instead of page numbers. See further details here.