Review

Characteristics of Critical-Wavelength-Existed Fiber-Optic Mach–Zehnder Interferometers and Their Sensing Applications

1
Southern Marine Science and Engineering Guangdong Laboratory (Guangzhou), Guangzhou 511458, China
2
Department of Electronic Engineering, School of Electronic Science and Engineering, Xiamen University, Xiamen 361005, China
*
Author to whom correspondence should be addressed.
Photonics 2022, 9(6), 378; https://doi.org/10.3390/photonics9060378
Submission received: 7 April 2022 / Revised: 9 May 2022 / Accepted: 12 May 2022 / Published: 26 May 2022
(This article belongs to the Special Issue Novel Specialty Optical Fibers and Applications)

Abstract

:
In this paper, we review the characteristics of critical wavelength (CWL)-existed fiber-optic Mach–Zehnder interferometers (MZIs), including special few-mode fibers and microfibers, and their sensing applications in physical, chemical, and marine fields. Owing to the existence of CWL in the transmission spectra, the in-line MZIs show some specific characteristics. The closer the peak/dip wavelength to the CWL, the larger the wavelength shift or the related sensitivity when the interferometer is under testing. Meanwhile, CWL shifts monotonically with the variations in measurands, such as temperature (in the air or seawater), axial strain, water pressure, surrounding refractive index, etc., when they are applied to the sensing fibers. These characteristics of the CWL-existed in-line MZIs make them appealing solutions for fabricating various interferometric sensors, with the advantages of large measurement range, high sensitivity, multiparameter sensing, etc. Theoretical and experimental studies on the properties of the CWL-existed in-line MZIs are reviewed and discussed in this paper.

1. Introduction

Fiber-optic in-line Mach–Zehnder interferometers (MZIs) have the advantages of high sensitivity, compact size, flexible structure, immunity to electromagnetic interference, and durability in harsh and corrosive environments and, therefore, have been intensively studied and applied in physical, chemical, and marine sensing fields, to monitor a considerable variety of essential parameters [1,2,3,4,5]. An in-line MZI can be constructed by splicing a piece of few-mode fiber (FMF) between two pieces of single-mode fibers (SMF)—termed SFS structure [6,7,8,9,10,11,12,13,14,15]—or replacing the FMF with the multimode fiber (MMF) [16,17,18,19,20,21], two-core fiber [22], thin-core fiber [23], no-core fiber [24], photonic crystal fiber [25] and few-mode microfiber [26,27,28,29,30,31,32,33,34,35,36], where offset fusion splicing [37], fiber taper [38], and collapsed splicing [39] are often used in the fabrication.
A typical in-line MZI shows periodic interference fringes. The interference peaks/dips in the periodically changed transmission spectrum exhibit the same behavior, i.e., shifting in the same direction, with the same sensitivity, when monitoring sensing parameters. In this case, when such a sensor system is being applied to detect any particular parameter through monitoring the wavelength variations of a specific interference peak/dip or intensity variations at a particular wavelength, some critical issues will limit the veracity of the sensor performance: (1) multivalue outputs and limited measurement range induced by overlapping of adjacent peaks/dips; (2) limitations in multiparameter applications caused by the uniformity of the interference fringes and their wavelength sensitivity.
However, in the transmission spectra of some in-line MZIs, a critical wavelength (CWL) may appear in the operating wavelength range. At the CWL, the wavelength response period seen is infinite in the transmission spectrum. This interference fringe, which shows the least dependence on wavelength, is defined as the achromatic fringe [26]. In fact, the CWL is the wavelength at which the two interference modes’ group velocities equal each other. Therefore, the propagation constant difference in the two interference modes changes nonlinearly with wavelength and turns around at CWL. In this way, the CWL is also called the dispersion turning point (DTP).
The CWL-existed in-line MZIs exhibit intriguing characteristics that researchers have thoroughly studied and applied in a wide range of sensing fields: (1) The peak lying closest to CWL at each side has its maximum spacing from the adjacent peak. Thus, compared with periodically changed interference fringes, the CWL is easy to identify in the transmission spectrum. Moreover, the CWL is exclusive at the operating wavelength range, which becomes an excellent candidate for measuring various parameters, especially in large-range measurement. (2) The interference peak/dip closest to the CWL has the maximum wavelength sensitivity among all the interference peaks/dips. (3) The interference peaks/dips on each side of the CWL shift to opposite directions under sensing parameter variations. The characteristics of the CWL and the interference peaks/dips have been proved with competitive advantages in large-range measurement [7,8,30], high wavelength sensitivities of interference peaks/dips [10,28,29,30,31,32,33,35,36], and co-located multiparameter sensing [9,11]. With these advantages, the CWL-existed in-line MZIs have been reported in sensing parameters of axial strain, curvature, displacement, surrounding refractive index, temperature, relative humidity, static pressure, chemical solution concentration, etc., according to the particular circumstances. Difference fibers such as liquid-core fiber, MMF, FMF, and few-mode microfibers are employed in these CWL-existed in-line MZIs.
In this paper, we provide a simple but overall review of the developments and recent progress on CWL-existed in-line MZIs and their sensing applications. In Section 2, the generation of the CWL is explained. In Section 3, we review the wavelength sensitivity characteristics of the interference peaks/dips lying near the CWL and their applications in sensors. The large-range measurement sensors employing CWL detection are reviewed in Section 4. Lastly, in Section 5, some conclusions and prospects are given.

2. Theoretical Analysis of the Transmission Characteristics of the CWL-Existed in-Line MZIs

CWL has been experimentally observed in different kinds of in-line MZIs employing MMFs [17,18,19,20], FMFs [6,7,8,9,10,11,12,13,14,15], liquid-core fibers [40], tapered few-mode microfibers [25,26,27,28,29,30,31,32,33,34,35], highly birefringent (HB) fibers [41] or birefringent side-hole fibers [42]. The mode interferences in these CWL-existed in-line MZIs are mainly between the fundamental mode and the first circularly symmetric high-order mode or the first antisymmetric high-order mode and between two orthogonal (x and y) polarization modes. The schematic diagram of the sensor system is shown in Figure 1. Compared with mode interference, where the polarization-dependent light is included, the in-line MZI with two circularly symmetric modes interference provides merits of stability and polarization independence [43]. As an example, in this section, we use an SFS structure reported by our group in references [6,7,8,9,10,11,12,13,14], in which the LP01 and LP02 mode interferences were employed, to explain the transmission characteristics of the CWL-existed MZIs theoretically.
Figure 2 shows the cross-section structure of the FMF and the schematic diagram of the SFS structure. The relative refractive index difference is defined as Δ n c o / c l i = ( n c o / c l i n 0 ) / n 0 , where the n c o / c l i and n 0 are the refractive indices of the core/ith inner cladding and pure silica of the FMF, respectively. FMF is specially designed with five layers and a W-shaped refractive index difference profile. Therefore, at the operational wavelength planned, the FMF supports only the LP01 and LP02 modes propagating in the fiber under well-centered splicing [44].
The LP01 and LP02 modes propagating in the FMF are excited by the fundamental mode LP01 in input SMF. The interference between the LP01 and LP02 modes is transmitted by output SMF. The ratios of optical power transferred to the LP01 and LP02 modes in the FMF from input SMF are t 01 = P 01 / P i n and t 02 = P 02 / P i n , and calculated as 81% and 11.5%, respectively. The transmission, T, through the SFS structure with L FMF -length FMF is given by [15] as follows:
T = P o u t P i n = t 01 2 + t 02 2 + 2 t 01 t 02 c o s ( φ ( λ ) )
where φ ( λ ) = Δ β · L FMF is the phase difference between LP01 and LP02 modes. Δ β is the propagation constant difference between LP01 and LP02 modes.
With the parameters of FMF given in Figure 1, a finite element model is established to simulate the relationship between the Δ β and wavelength, which is depicted as a dashed line in Figure 3. The calculated transmission spectrum combining Equation (1) and the simulated value of Δ β is shown as a solid line in Figure 3, where the physical length of the employed FMF is 50 cm. Because the dispersion of Δ β exhibits nonlinear behavior and has a maximum, corresponding to the value of CWL in the transmission spectrum at the operational wavelength, the wavelength response period at CWL is infinite. Moreover, the periods of interference fringes closest to CWL from both sides reach a maximum. As shown in Figure 3, numbering from the peak that lies closest to CWL from each side, the peaks that are located on the higher wavelength side of CWL (i.e., within the region from CWL to 1580 nm) are denoted as PH, 1, PH, 2,..., respectively. Peaks located on the lower wavelength side of CWL (i.e., within the region from 1530 nm to CWL) are denoted as PL, 1, PL, 2,..., respectively. The interference dips are also numbered in the same way.
With the achromatic fringes in the transmission spectrum, multiple sensing indicators are provided in the sensors employing CWL-existed in-line MZIs, including monitoring wavelength shifts in CWL [6,7,8,18,40], PH, 1/DH, 1, PL, 1/DL, 1 [9,10,11,15,17,28,29,30,31,32,33,34,35,36], and intensity variations [12] at a specific wavelength or wavelength ranges. Studies in CWL-existed in-line MZIs show that utilizing CWL shifts or other monitoring parameters listed above, the CWL-existed in-line MZIs can provide competitive advantages over conventional periodically changed interferometers in the applications of large-range measurement, co-located multiparameter sensing, and high-sensitivity sensing. Moreover, the theoretical study of wavelength sensitivities of interference fringes offers a direction for mode interferometers to maximize their peak wavelength sensitivities.

3. Characteristics of Interference Peaks/Dips in the CWL-Existed in-Line MZIs and Their Applications

In a CWL-existed transmission spectrum, the interference peaks/dips, especially those lying closest to CWL on both sides, exhibit essential characteristics different from the typical periodically changing fringes. These differences were experimentally observed by Salik et al. [15] and Zhou et al. [17]. However, theoretical analysis was not presented. The wavelength sensitivities of the interference fringes under temperature, axial strain, static pressure, and surrounding refractive index (SRI) variations were further theoretically and experimentally studied in Refs. [10,11,28,29,30,32,36], which are reviewed in this section.

3.1. Characteristics of Interference Peaks/Dips in the CWL-Existed SFS Structures

For the CWL-existed SFS structure employing the FMF shown in Figure 2, because the geometrical structure and relative refractive index difference profile of the FMF are determined, the temperature, axial strain, and static pressure wavelength sensitivities of the interference peaks/dips are governed by the wavelength separations between the measured wavelengths and the CWL. The temperature (T), axial strain ( ε ), and static pressure (P) wavelength sensitivities can be written as follows [11,13]:
Δ λ Δ T = ( ( Δ β ) T + Δ β · α ) ( ( Δ β ) λ ) 1
Δ λ Δ ε = ( Δ β + k 0 2 2 β 1 β 2 ( γ ( n 0 4 Δ β + ( n c o 4 n 0 4 ) ( β 1 b 1 β 2 b 2 ) ) + V δ ( β 1 b 1 V β 2 b 2 V ) ) ) ( ( Δ β ) λ ) 1
Δ λ Δ P = ( ( 1 2 ν ) E Δ β + k 0 ( 1 2 ν ) 2 E ( 2 ρ 12 + ρ 11 ) ( n 1 3 n 2 3 ) ( 1 2 ν ) V 3 2 r c o 2 E ( 1 β 1 b 1 V 1 β 2 b 2 V ) ) ( ( Δ β ) λ ) 1
where β 01 and β 02 are the propagation constants of the LP01 and LP02 modes, respectively. α = ( 1 / L F M F ) ( L F M F / T ) = 5.1 × 10 7 / ° C is the thermal expansion coefficient for pure silica [20]. γ = ρ 12 ν ( ρ 11 + ρ 12 ) and δ = ν ( n c o 2 n 0 2 ) + ( γ / 2 ) ( n c o 4 n 0 4 ) . ρ 11 = 0.12 , ρ 12 = 0.27 are strain-optic coefficients for fused silica, respectively [45]. ν = 0.17 and Ε = 78   GPa is the Poisson ratio and Young’s modulus for pure silica, respectively [46]. k 0 = 2 π / λ is the free space wave vector. r c o is the core radius of the FMF. n 1 and n 2 is the effective refractive index of the LP01 and LP02 modes propagating in the FMF, respectively. V = k 0 r c o n c o 2 n 0 2 is the normalized frequency of the FMF. β i and b i (i = 1, 2) is the propagation constant and normalized propagation constant of LP0i mode, respectively, and can be represented as
β i 2 = k 0 2 ( n 0 2 + b i ( n c o 2 n 0 2 ) )
The wavelength sensitivity curves under temperature, axial strain, and static pressure are calculated and depicted in solid curves in Figure 4a–c, together with the experimental results. From Equations (2)–(5) and Figure 4, the wavelength sensitivities of interference fringes in the spectrum of the SFS structure with CWL can be summarized as follows:
(1)
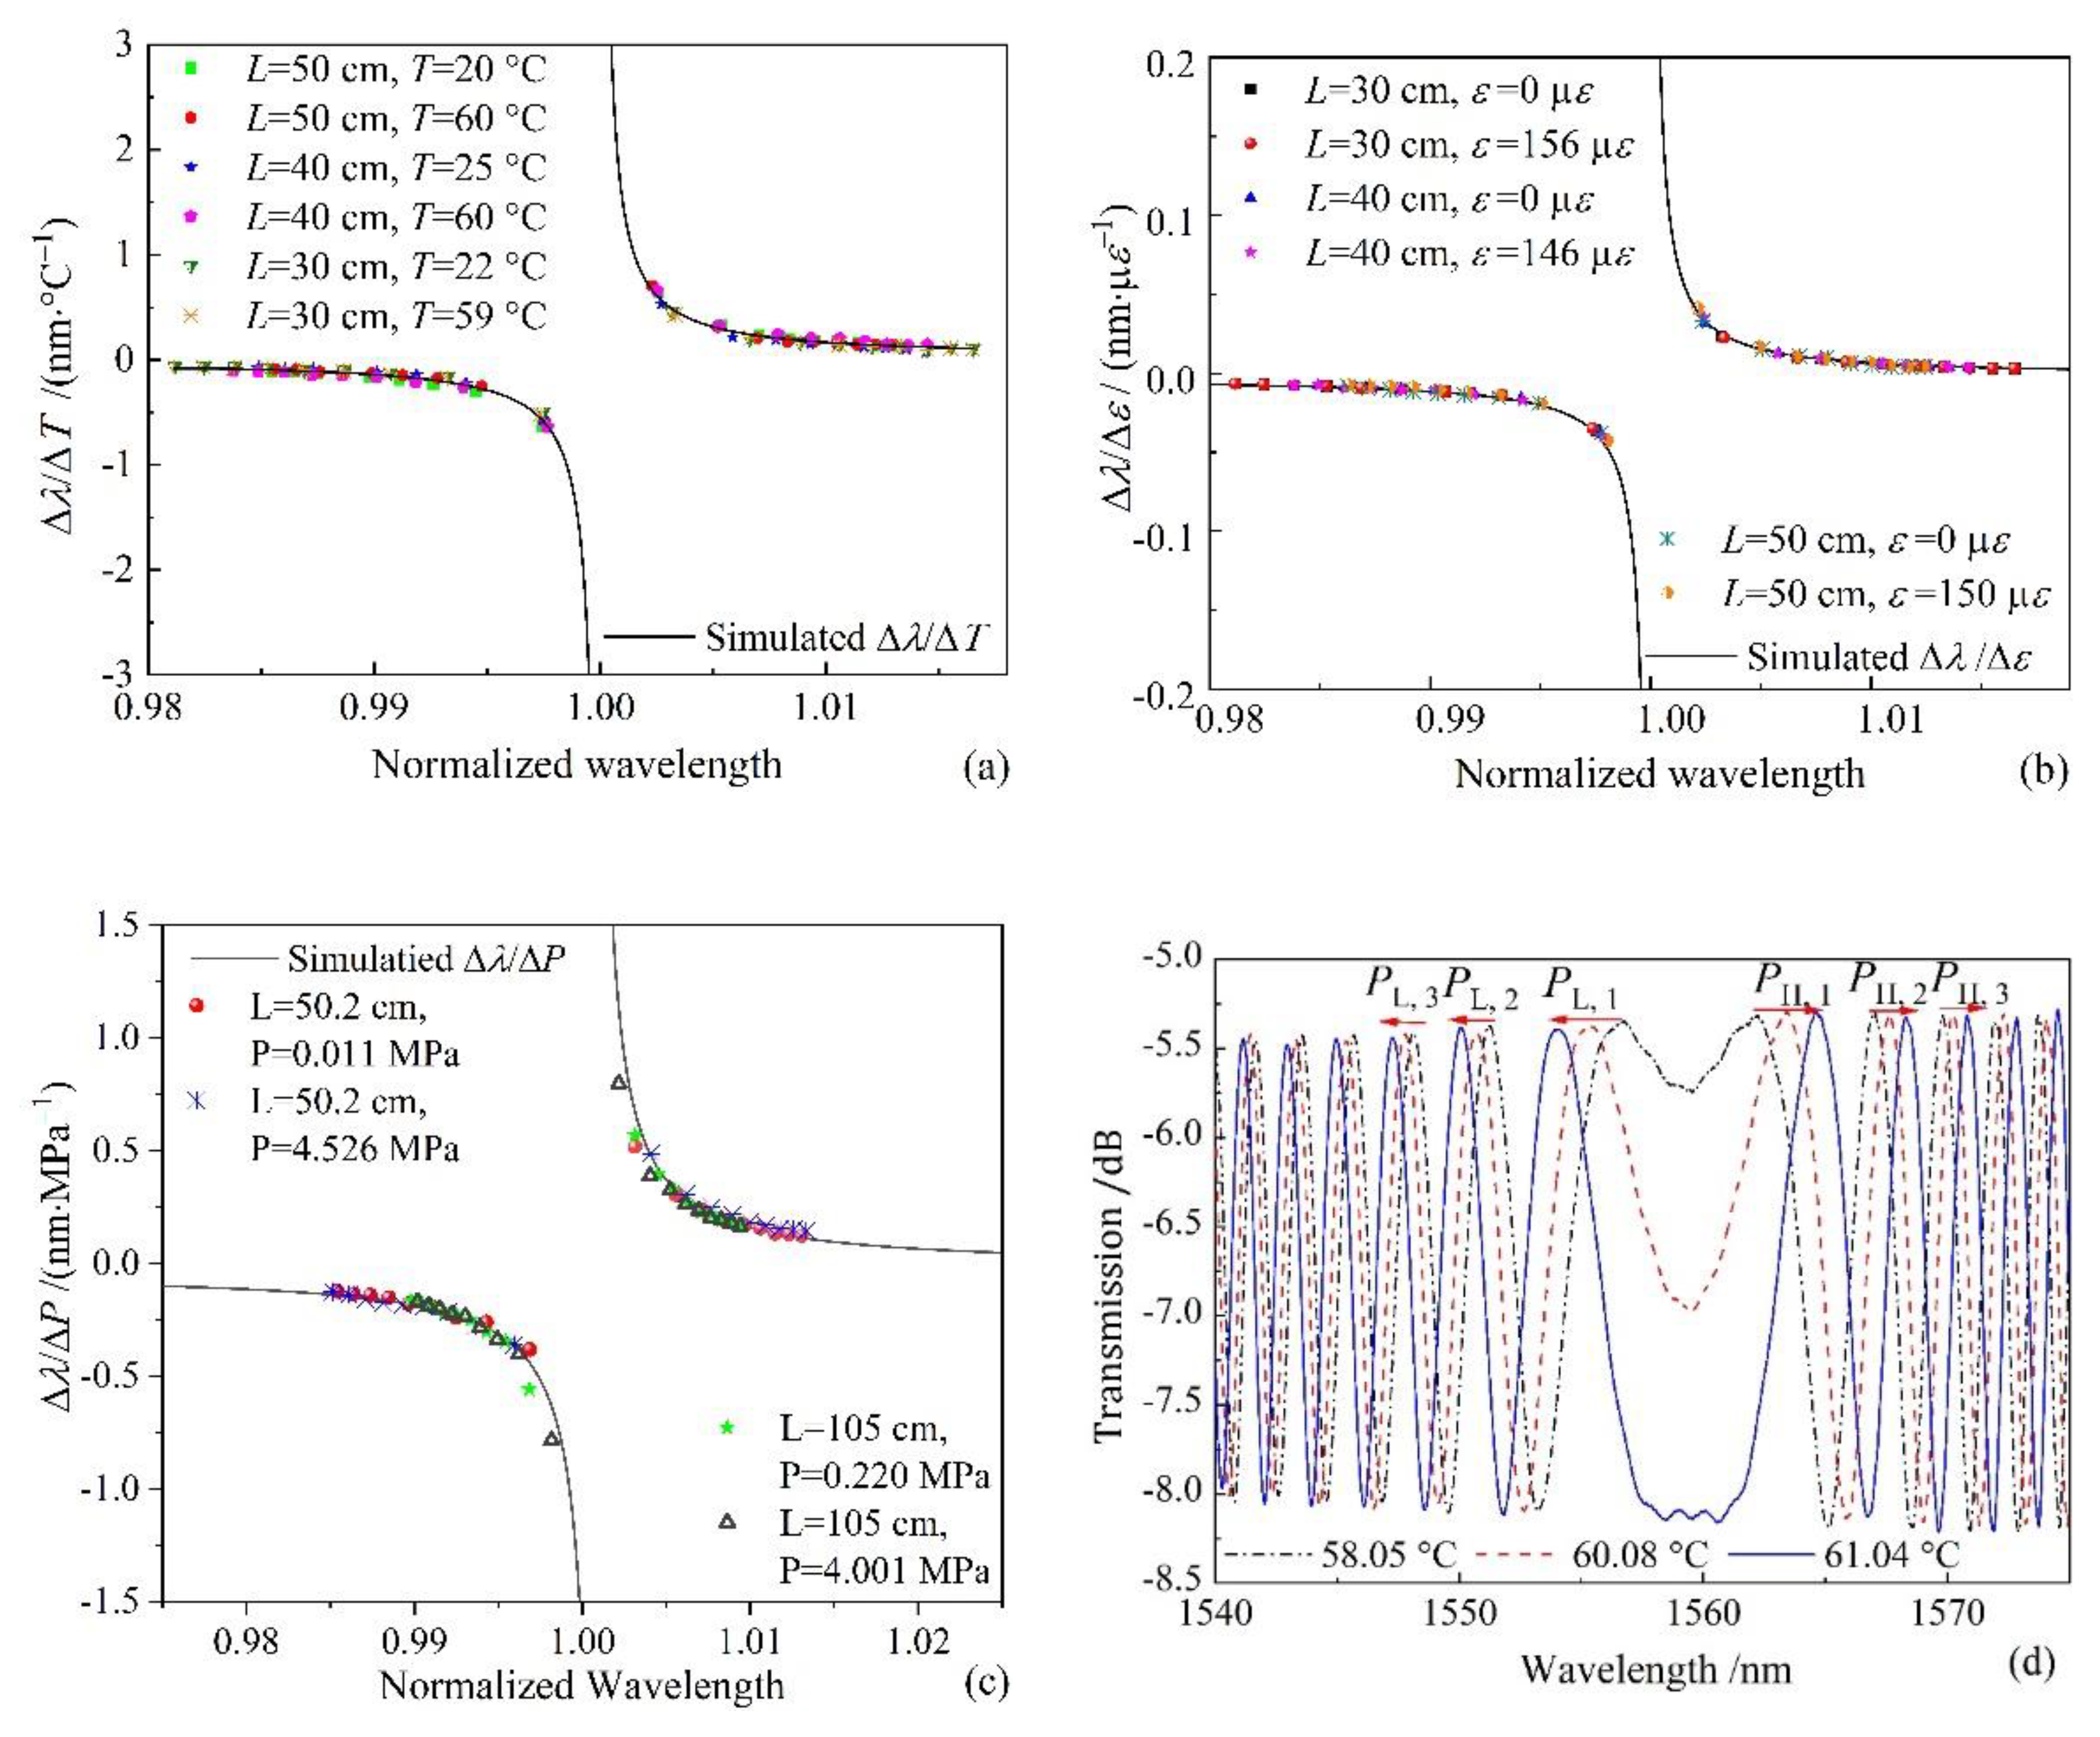
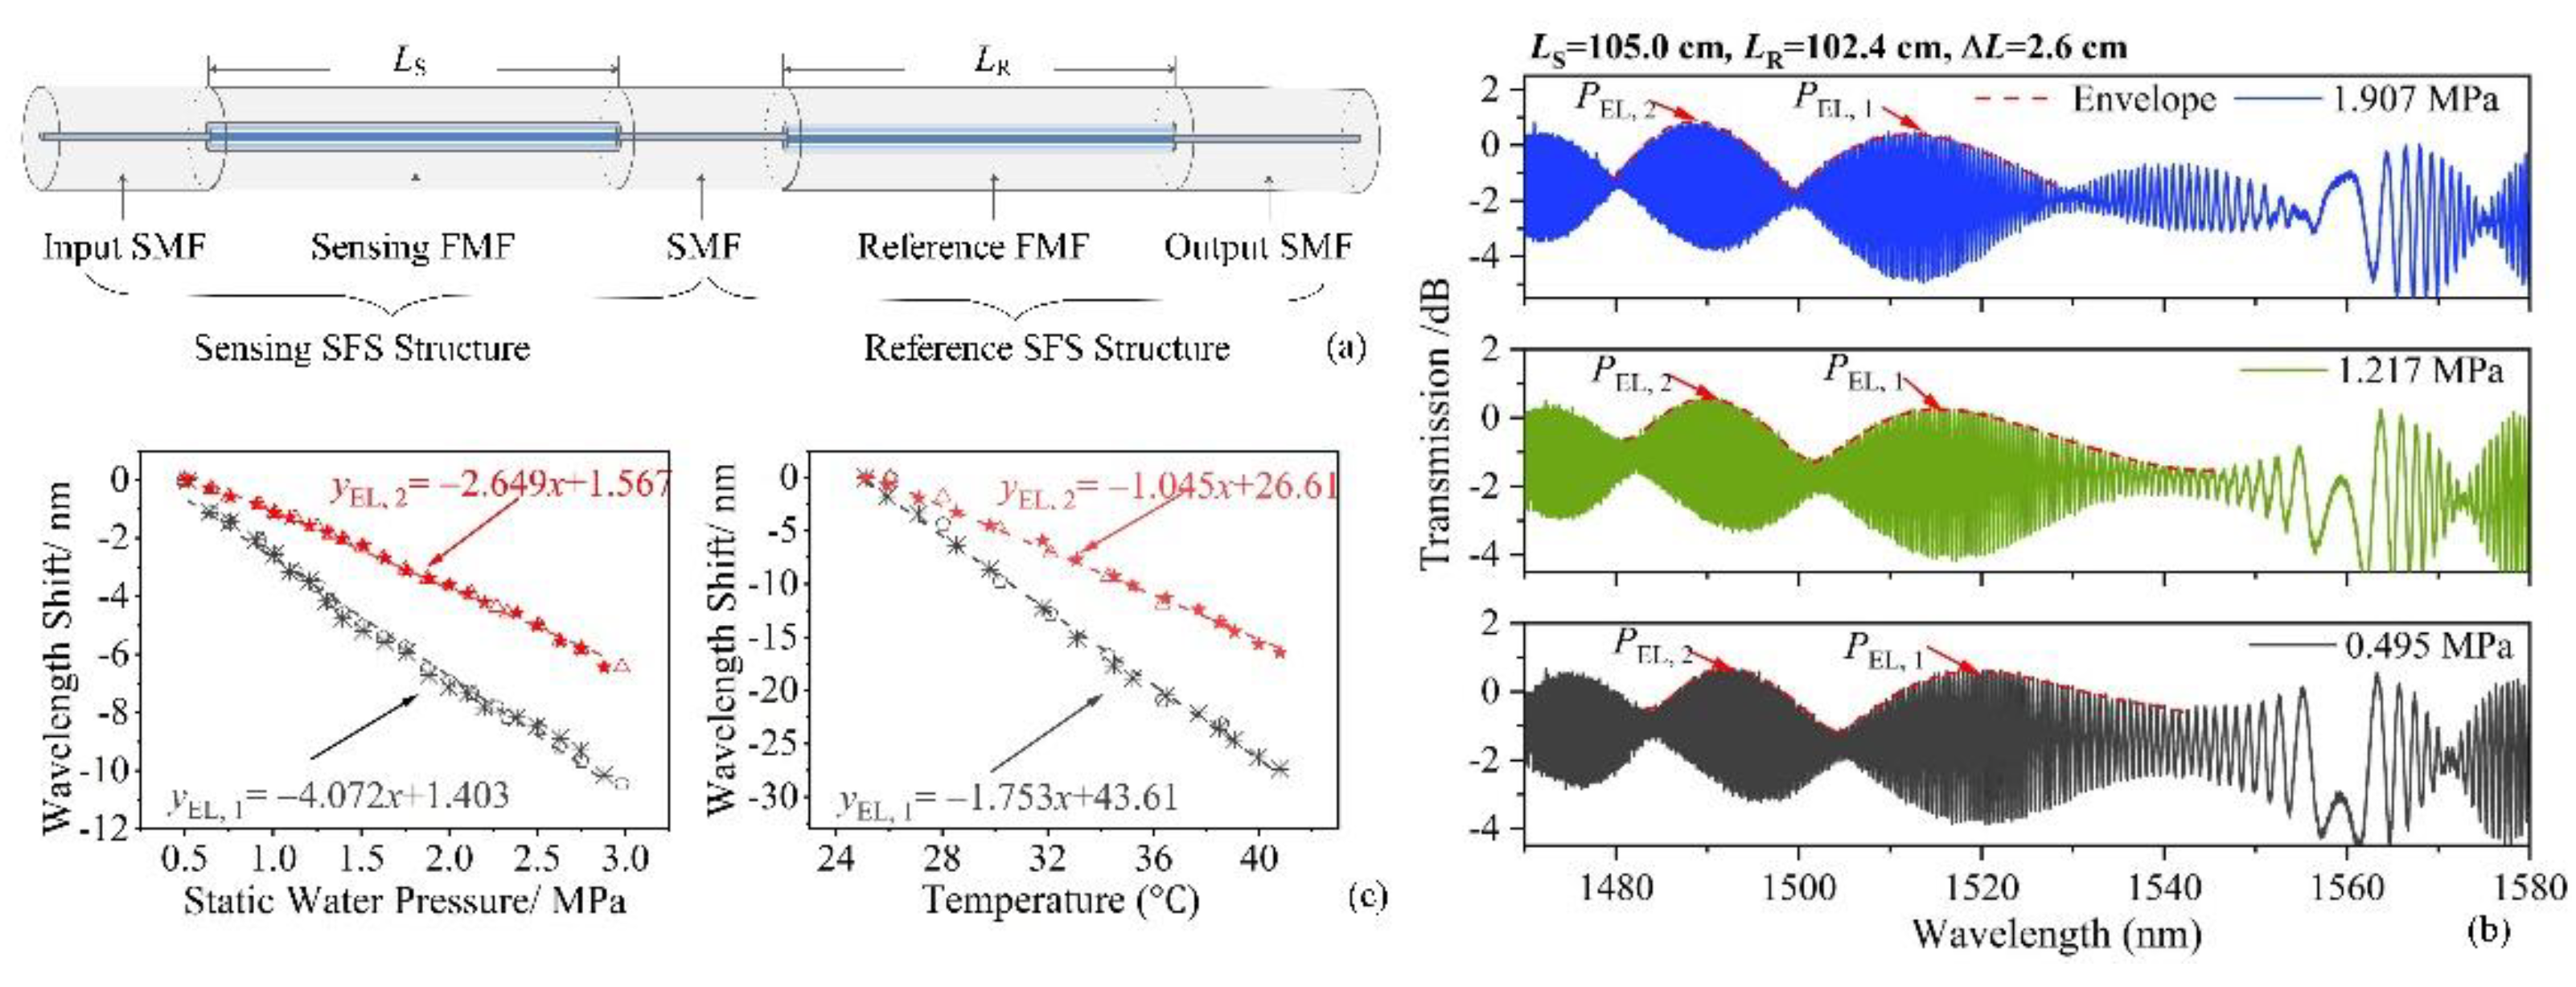
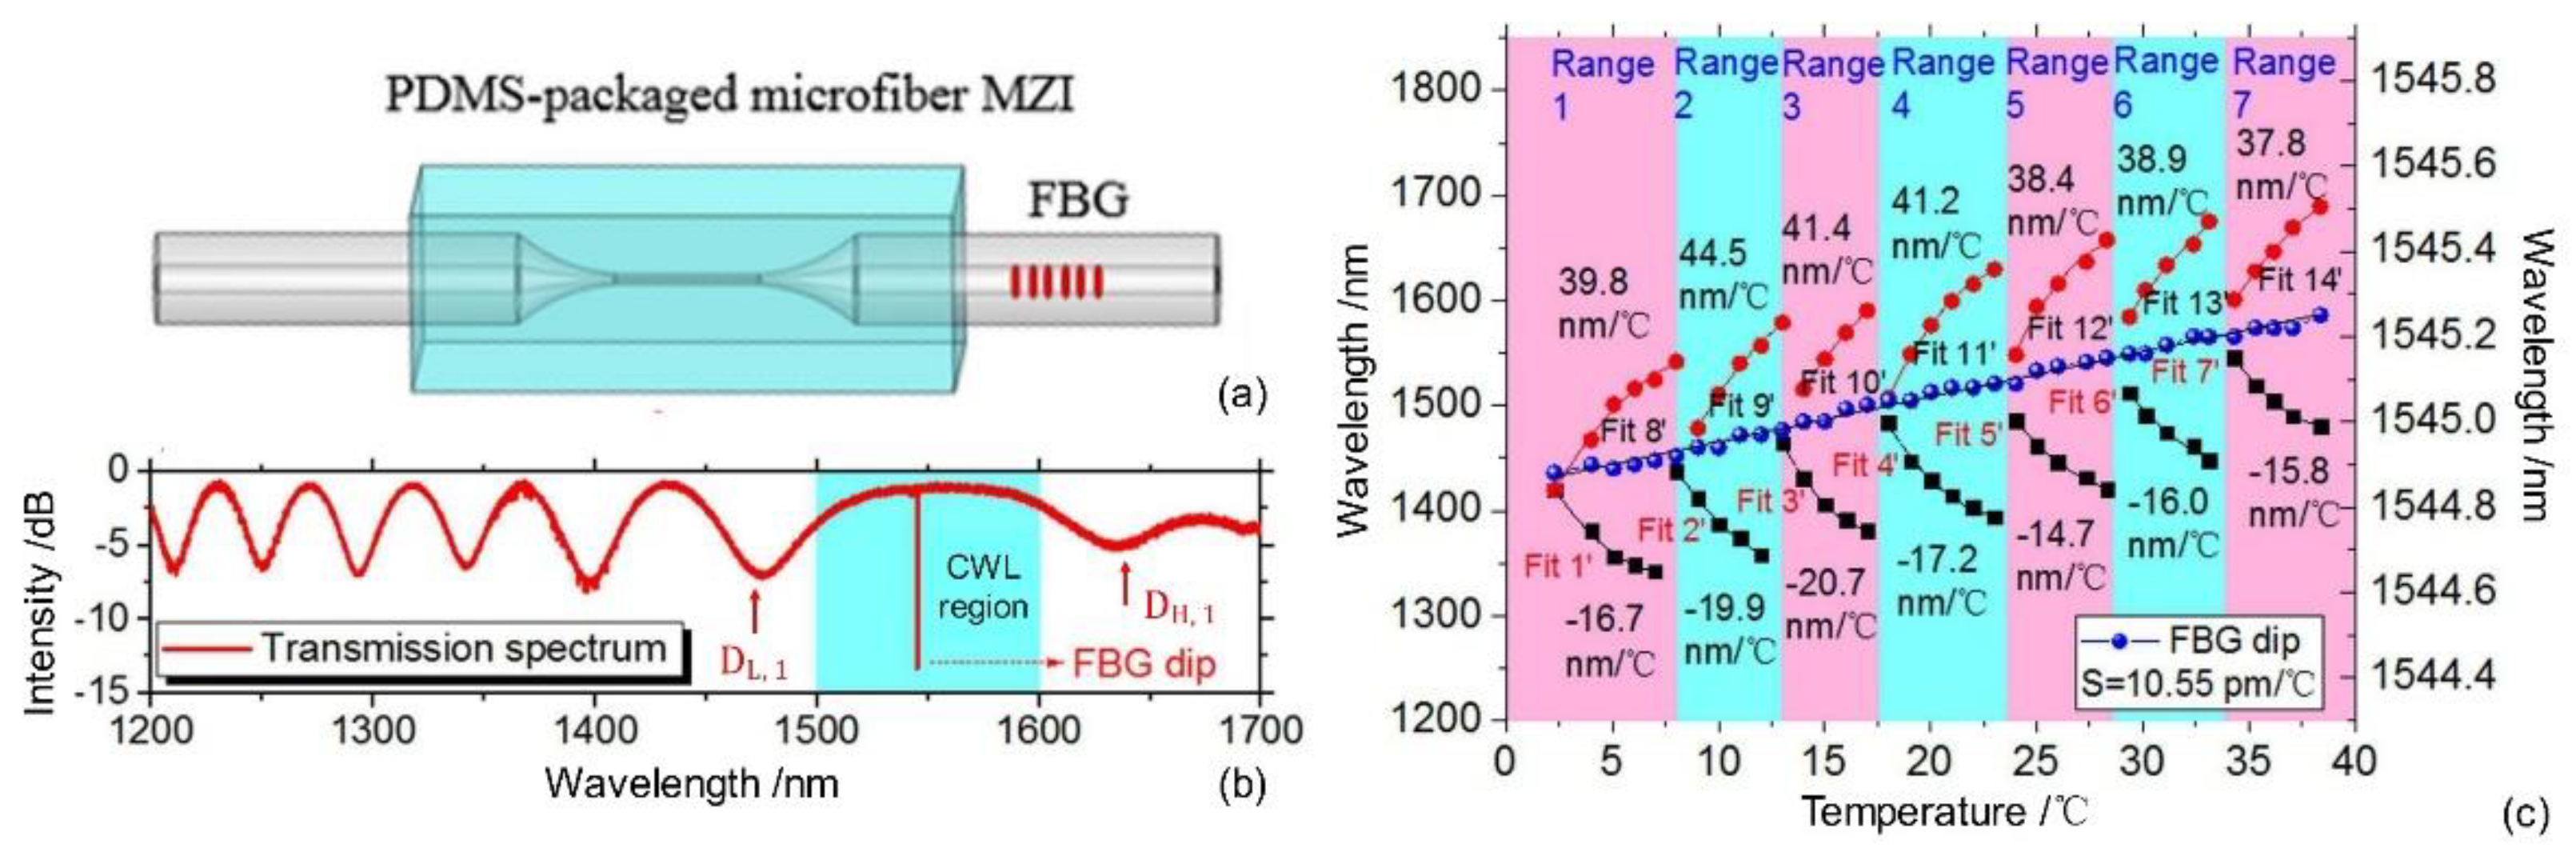
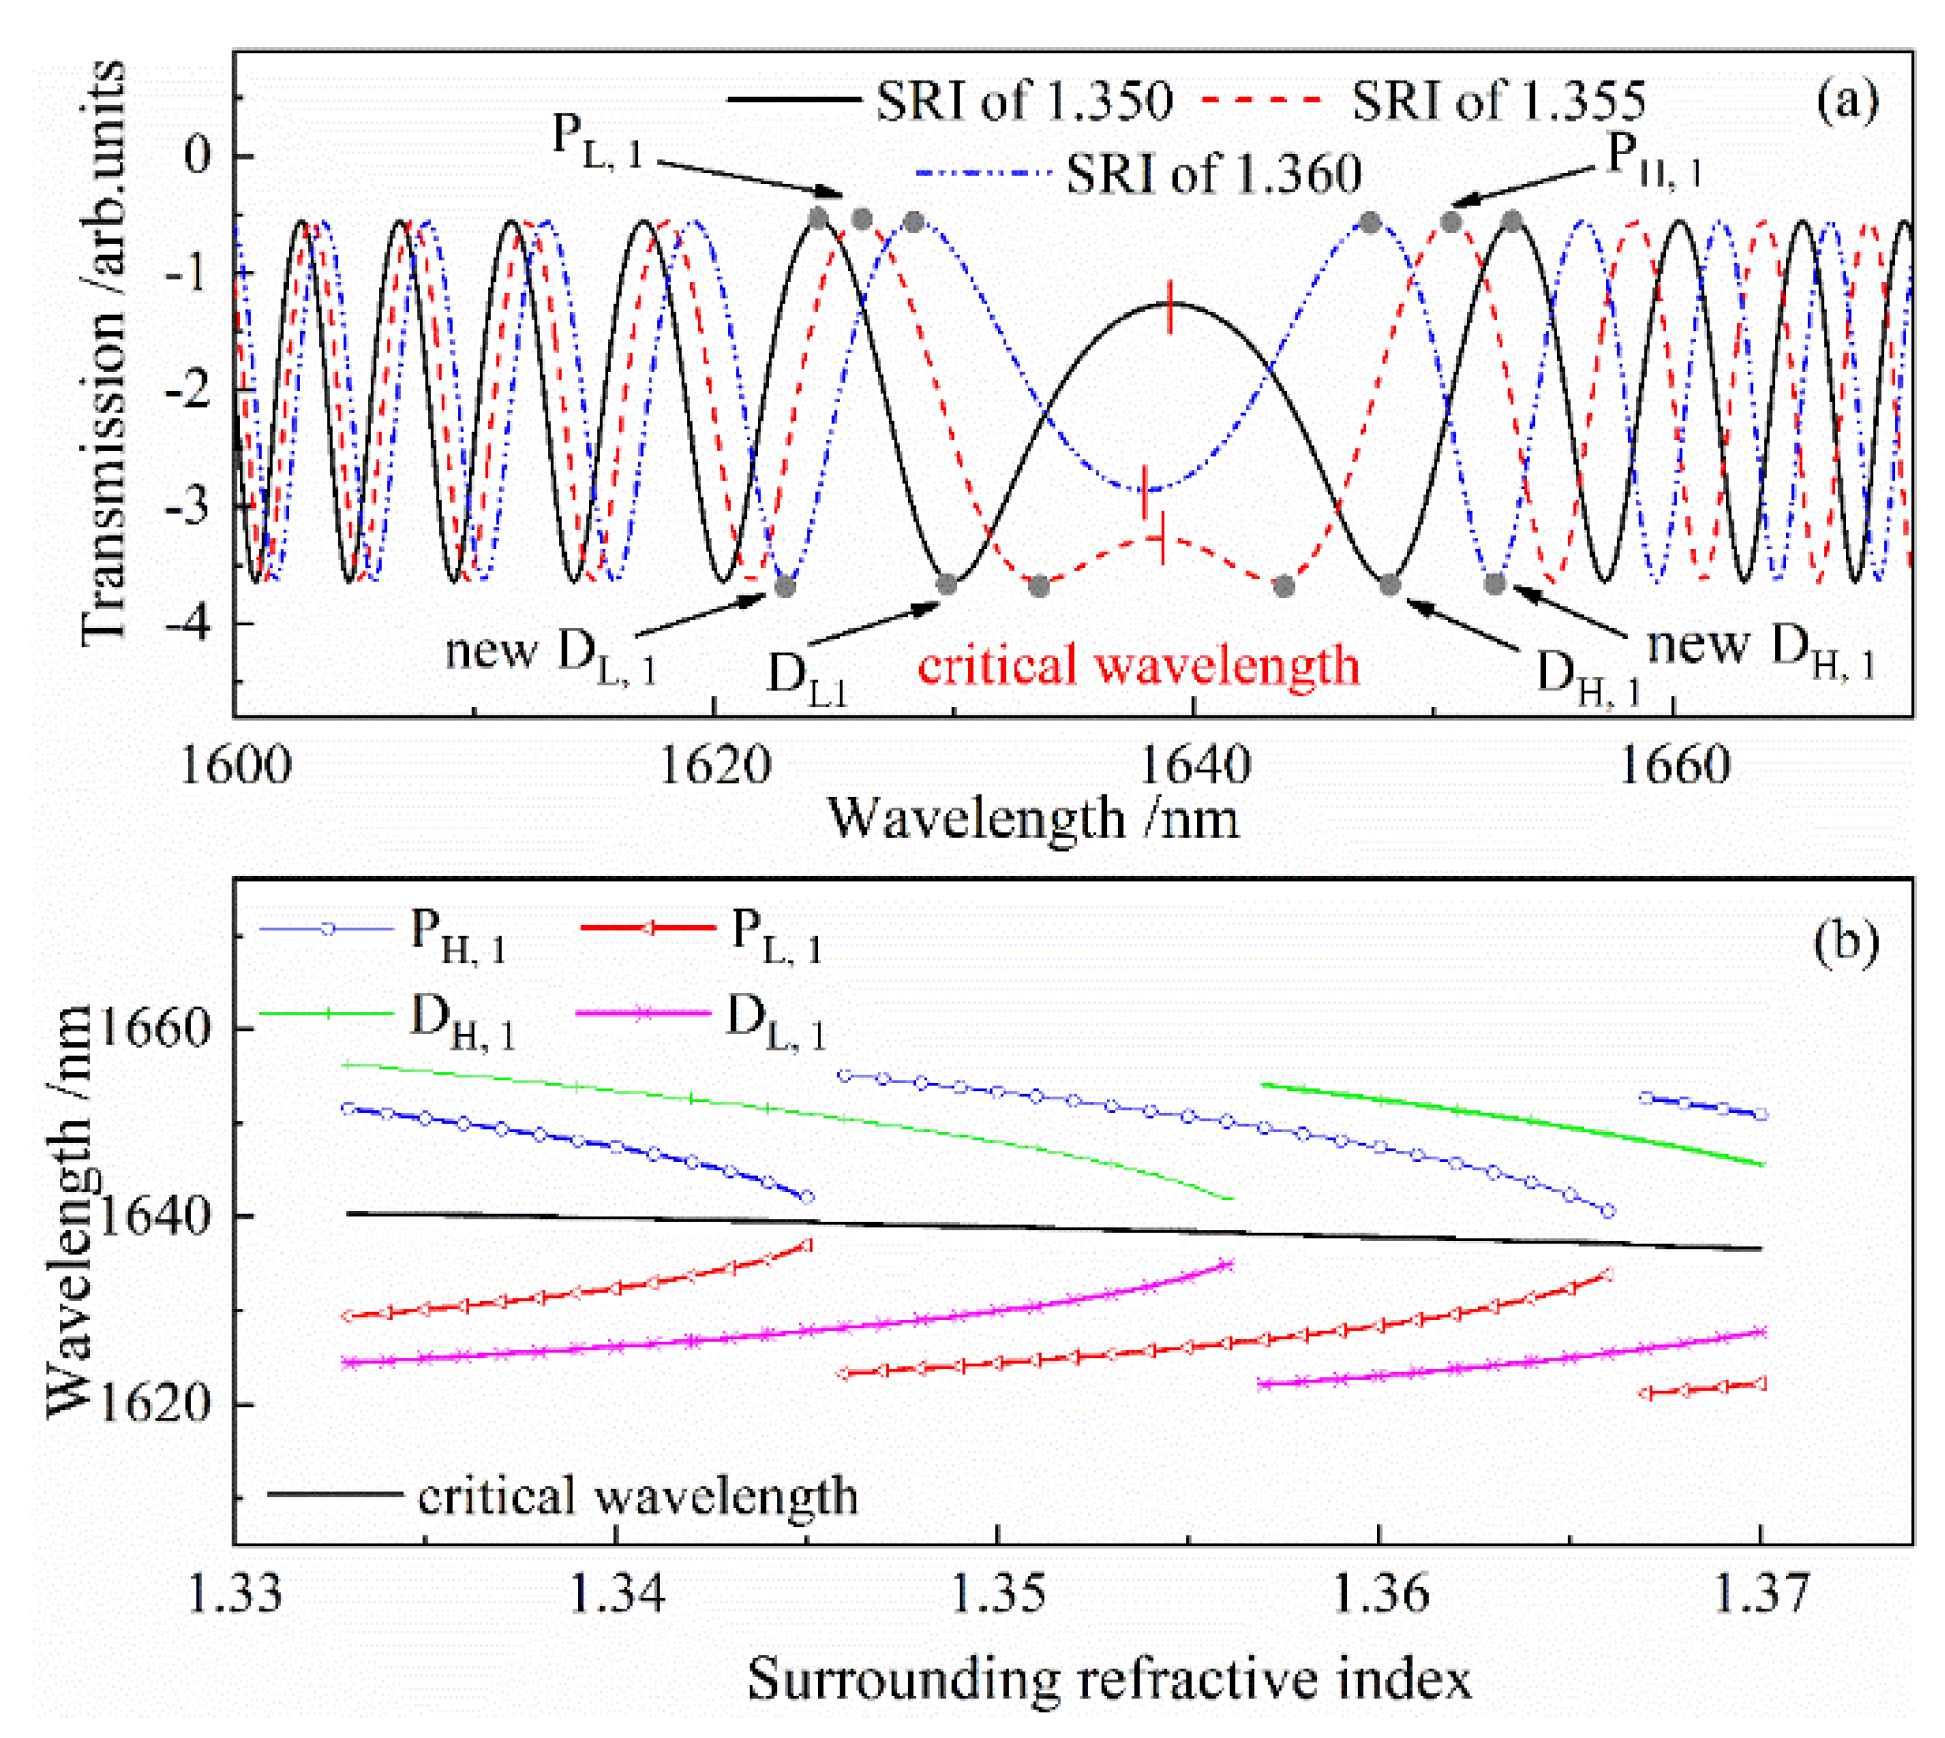
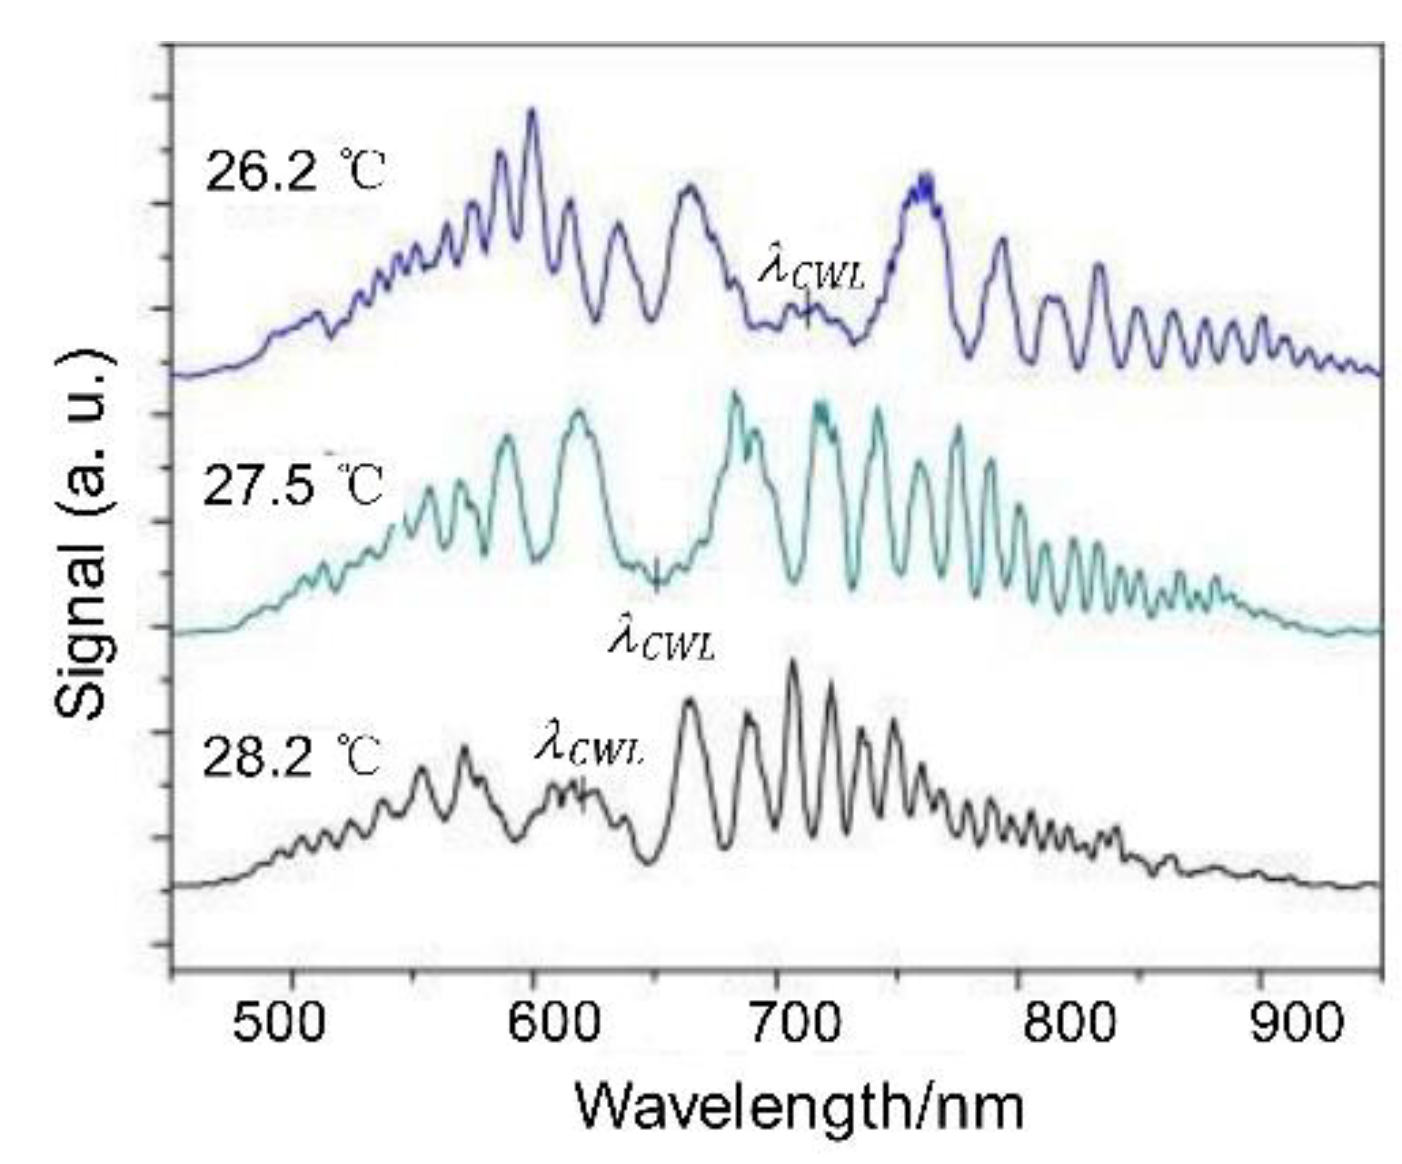
The interference peaks/dips lying on the different sides of the CWL shift to opposite directions under temperature, axial strain, and static pressure variations. For example, when temperature increases, there is a blueshift for peaks on the lower wavelength side of the CWL (i.e., within the region from 1500 nm to the CWL), while for peaks on the longer wavelength side of the CWL (i.e., within the region from the CWL to 1580 nm), there is a redshift. The experimental transmission spectra of the SFS structure under temperature variations are shown in Figure 4d, which agrees well with the calculation results.
(2)
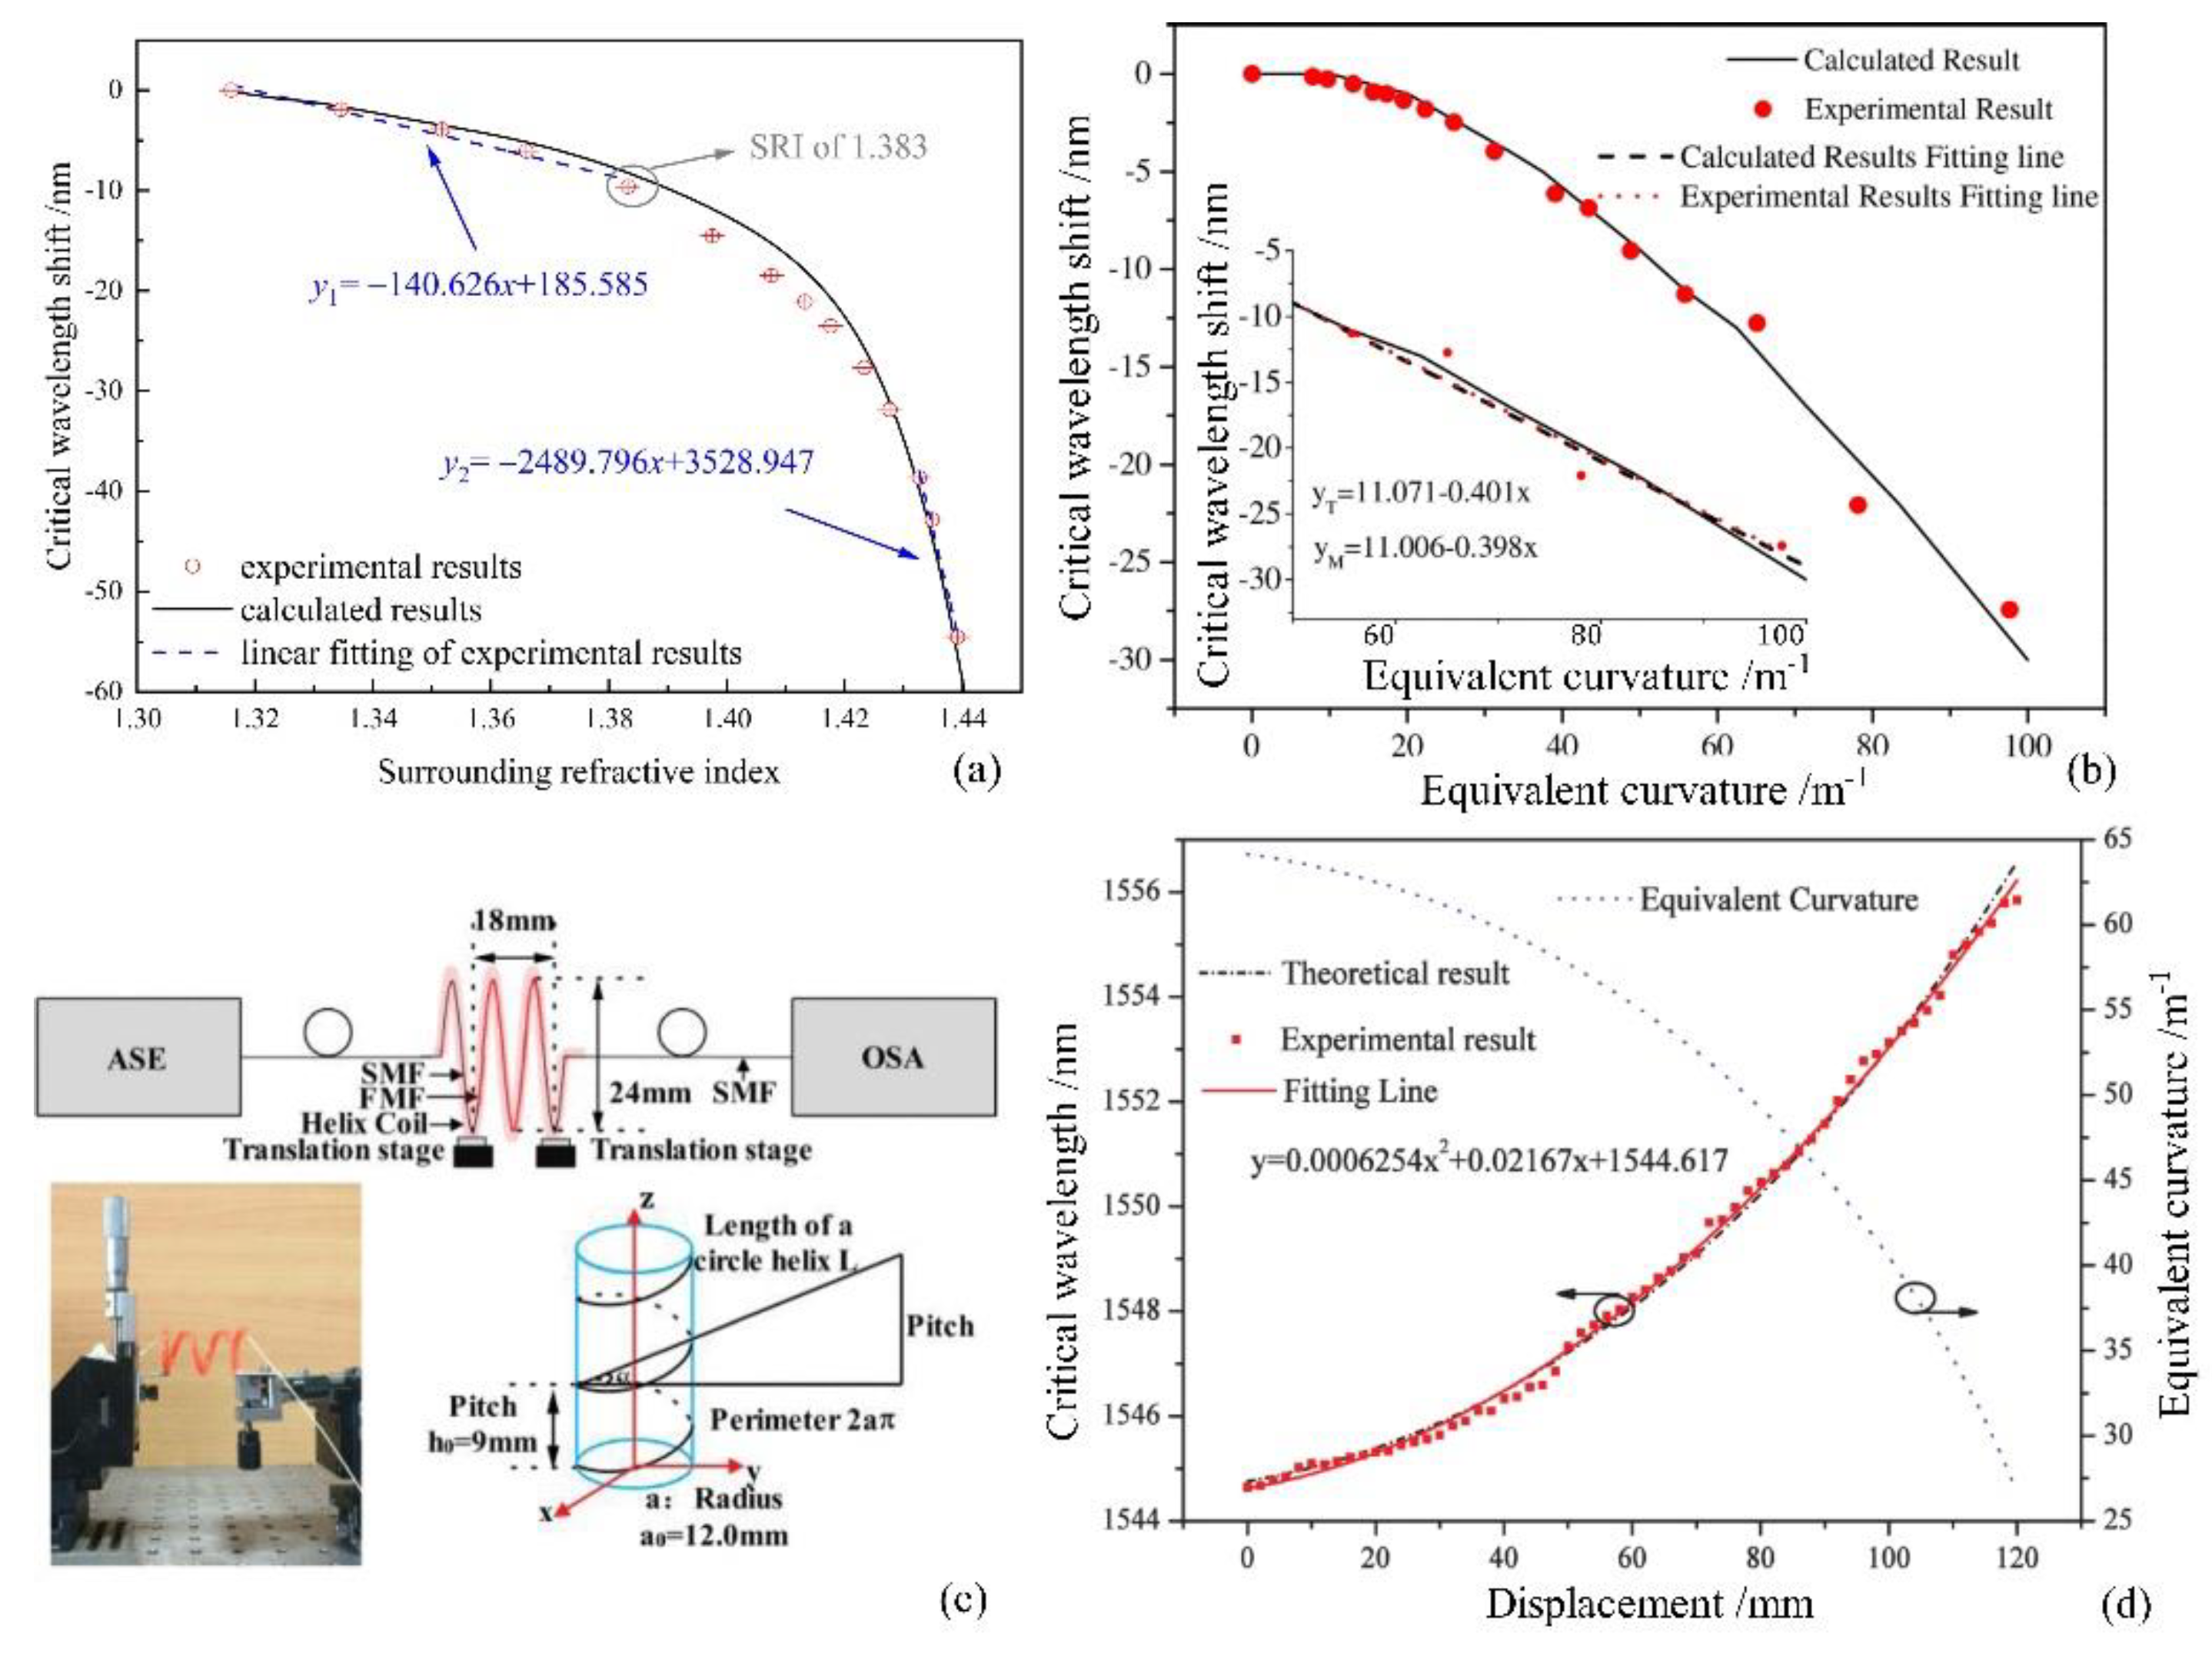
The wavelength sensitivity of the interference peak is only related to the wavelength spacing between the measured wavelength and the CWL. The LFMF used in the SFS sensor and the sensing parameters pre-applied to the FMF section may change the wavelength separation between the peak wavelength and the CWL. Thus, the variation in wavelength separation will affect the corresponding wavelength sensitivity of the measured peaks, as shown in Figure 4a–c. The experimental results show close agreement with the simulated curves.
(3)
As the peak wavelength value approaches the CWL value, i.e., λ / λ C W L 1 , the wavelength sensitivity increases significantly, as shown in Figure 4a–c, from both the theoretical and experimental points of view. However, the mathematically derived infinitely high sensitivity at the CWL has no practical meaning because ( Δ β ) / λ = 0 at CWL from the theoretical analysis, and an infinite length of FMF is needed in experiments to minimize the wavelength spacing between the wavelength of PL, 1/PH, 1, and the CWL, which is unpractical in applications.
Because the wavelength sensitivities of interference peaks and CWL are different under sensing parameter variations, the SFS structure can be applied in multiparameter sensing by simultaneously measuring the shift in CWL and interference peaks. Simultaneous measurements of temperature and axial strain [9] have been studied by detecting wavelength shifts in PH, 1 and PL, 1, taking advantage of their highest wavelength sensitivities among all of the peaks on the right and left sides of the CWL, respectively.
To further improve the sensitivity performance, a cascaded CWL-existed SFS structure was proposed by our group, which has been applied in static water pressure and temperature sensing [11]. Figure 5 shows the schematic diagram and transmission spectra under different static water pressures of the cascaded SFS structure. Vernier effect was adopted to magnify the wavelength sensitivities of interference peaks. The free spectrum range of the envelope in the superimposed transmission spectra varies with wavelength and reaches the maximum when approaching the envelope critical wavelength (CWLE). Therefore, the envelop peaks, PEL, 1 and PEL, 2, are easy to identify. A maximum static water pressure sensitivity of 4.072 nm/MPa and temperature sensitivity of 1.753 nm/°C is achieved using this sensing approach, which is more than 7 times larger in terms of the wavelength sensitivity than those reported in sensors using a single CWL-existed SFS structure [14]. This cascaded CWL-existed SFS static-pressure sensor can be applied in marine pressure sensing with temperature compensation by simultaneously measuring the envelope peaks PEL, 1 and PEL, 2.

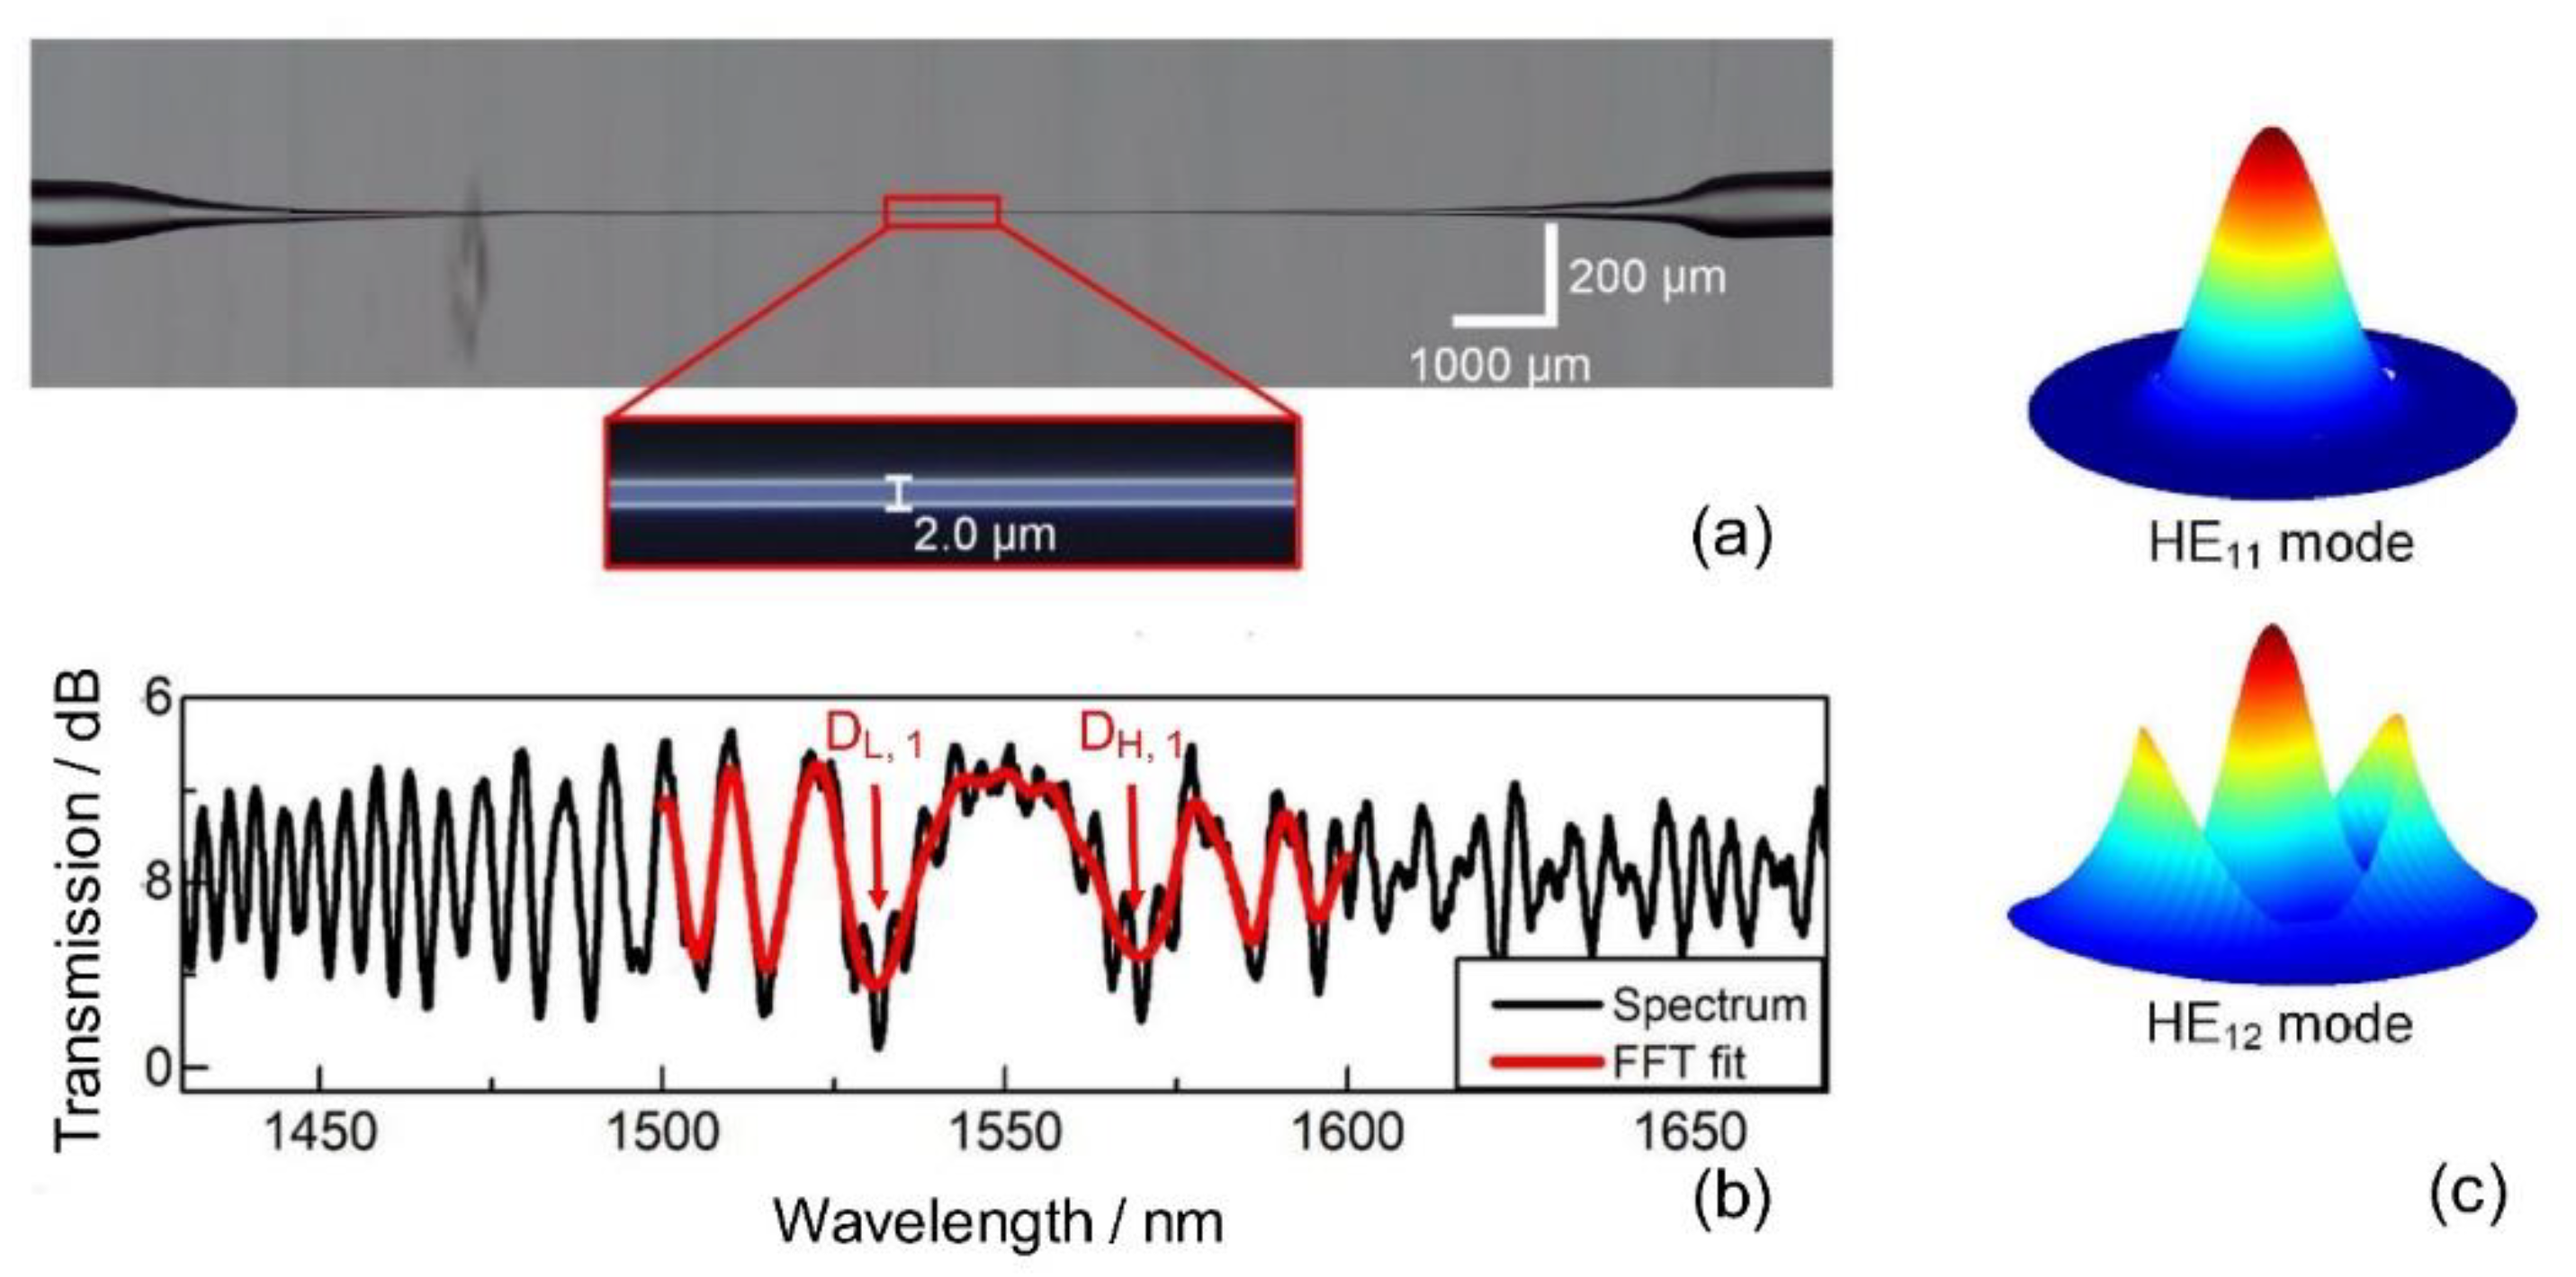
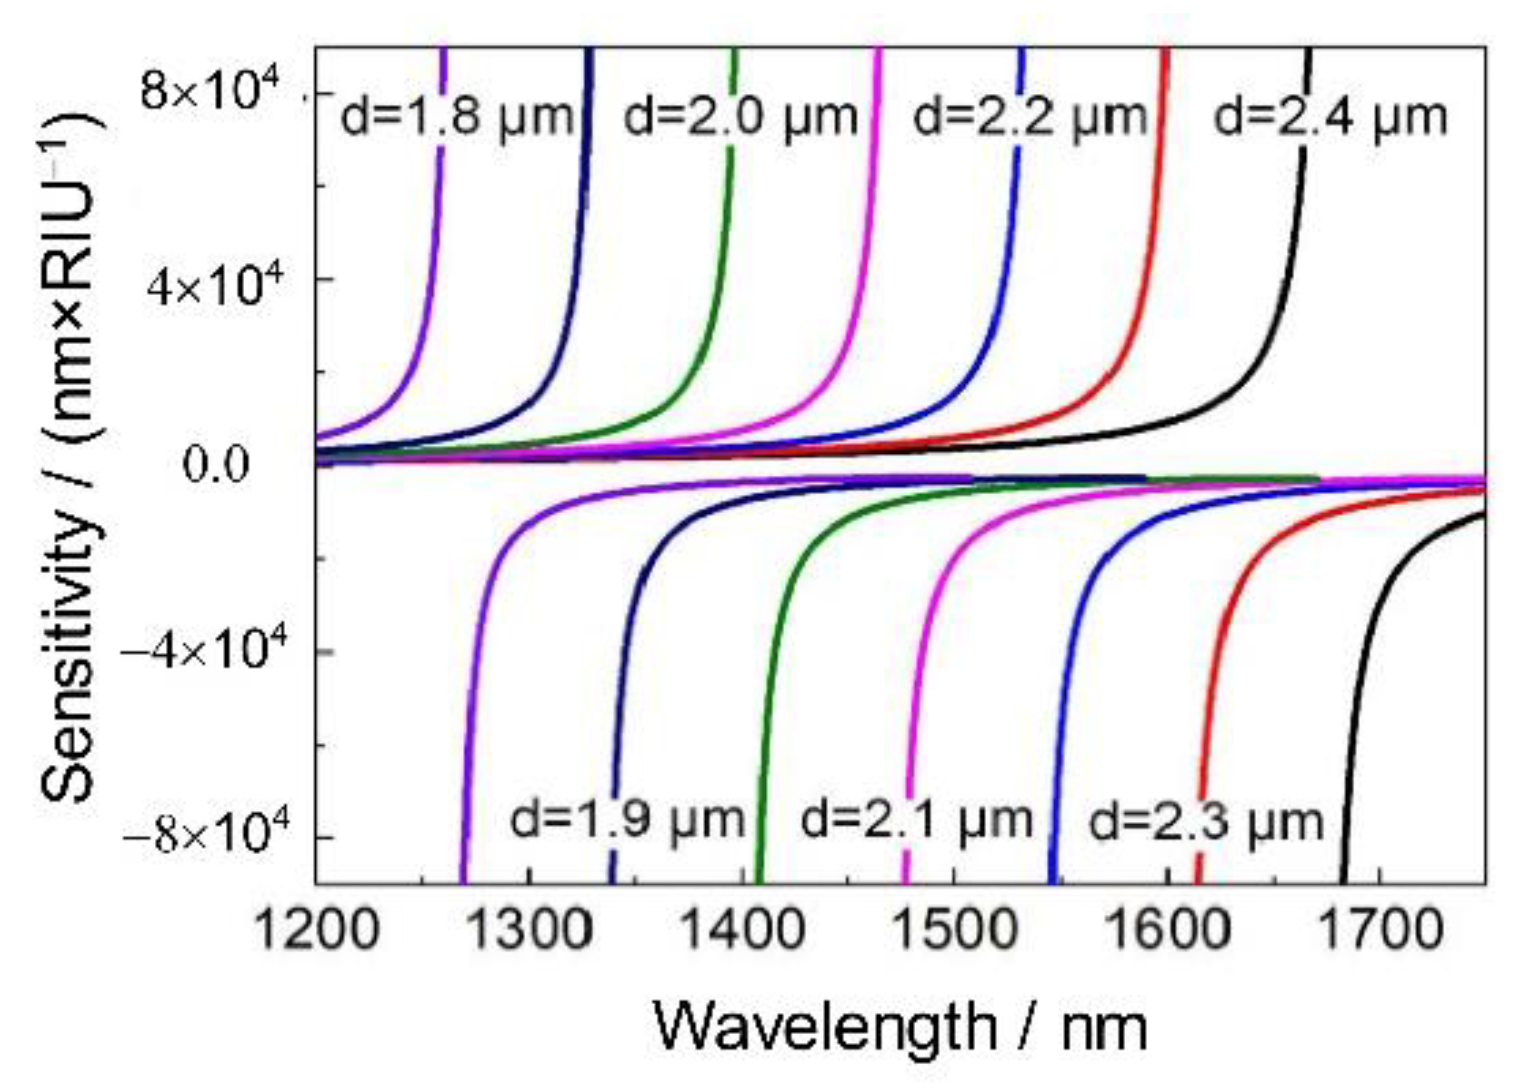
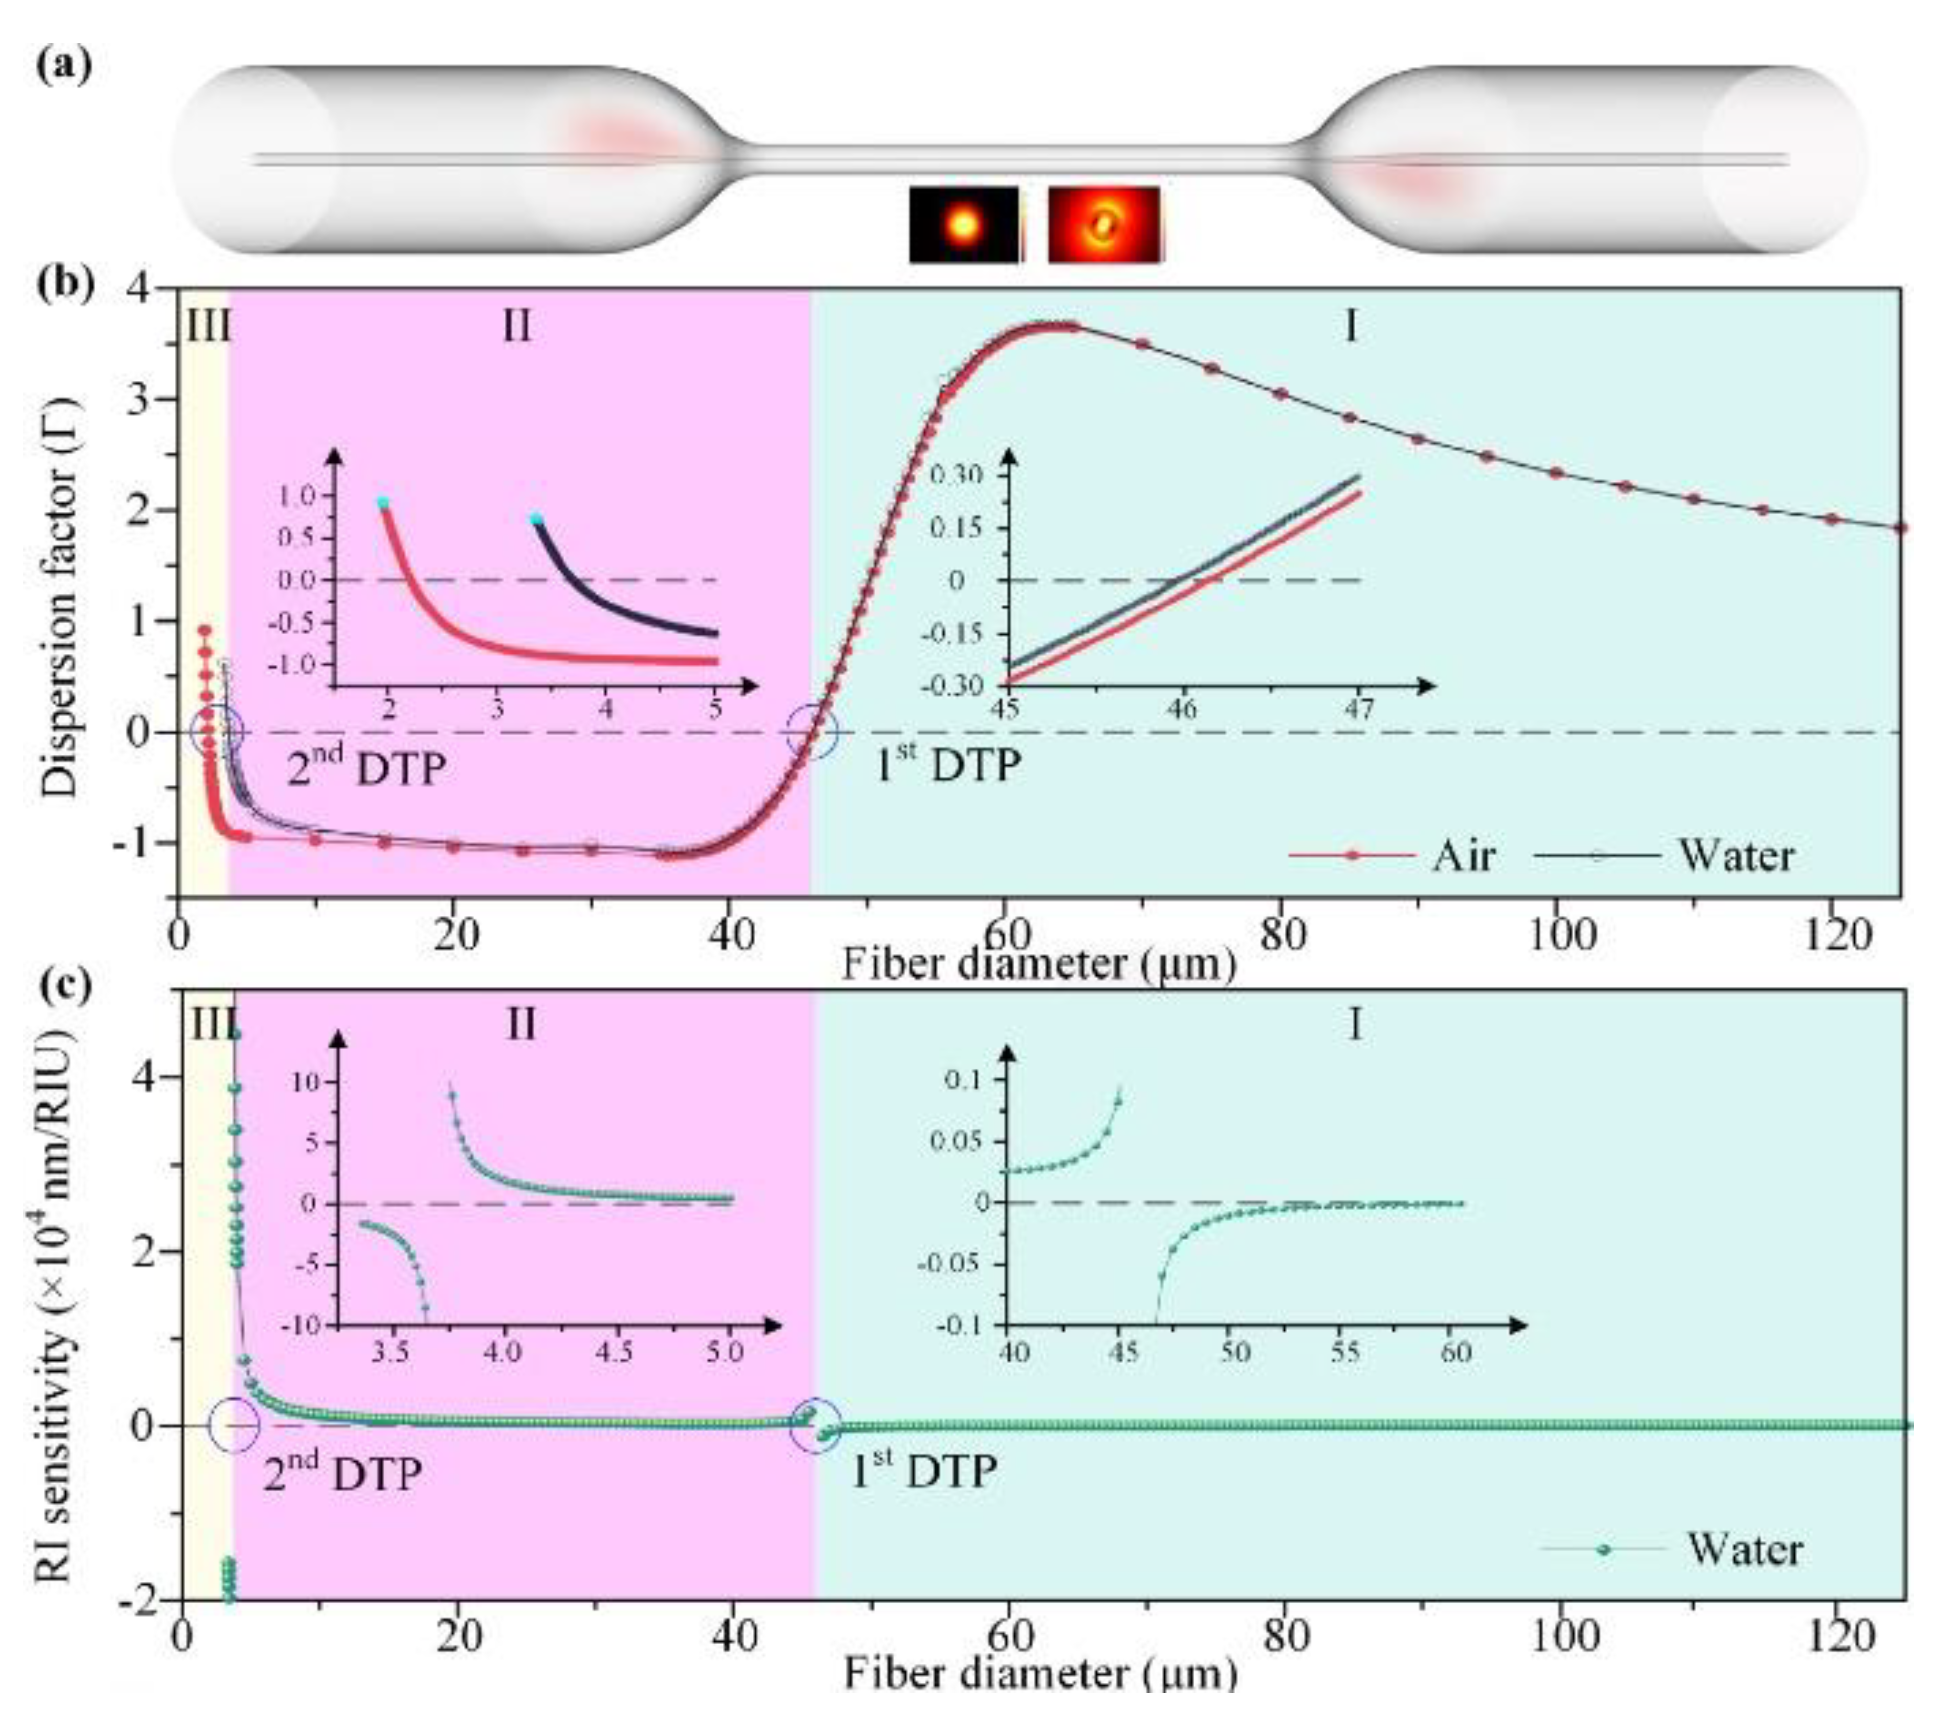
3.2. Characteristics of Interference Peaks/Dips in the CWL-Existed Few-Mode Microfiber in-Line MZIs

The few-mode microfiber interferometer fabricated by tapering a normal-sized optical fiber to the diameter of several micrometers is widely applied in SRI sensing using the evanescent waves propagating in the microfiber section. Wei et al. [28] proposed a few-mode microfiber interferometer designed at the CWL. They explored the SRI sensing properties of tapered microfiber interferometers in a gaseous medium, where the SRI changes around 1. The nonadiabatic few-mode microfiber is tapered from a standard SMF. The fundamental HE11 mode and the high-order HE12 mode are excited and propagate in the uniform waist region, as shown in Figure 6.
For a particular interference peak/dip with the peak/dip wavelength of λ N , the SRI wavelength sensitivity is written as follows [28,47]:
Δ λ N Δ S R I = λ N G ( Δ n e f f ) n
where G = n g H E 11 n g H E 12 is the difference between the group effective index of HE11 and HE12 modes. The group effective index can be calculated by n g = n e f f λ N ( n e f f ) / λ N . Therefore, with known material and diameter parameters of the uniform microfiber section, the term Δ λ N / Δ S R I increases dramatically as the value of G approaches zero, which corresponds to the CWL point. Moreover, the interference peaks/dips lying on each side of the CWL shift to opposite wavelength directions under SRI variations. These conclusions agree well with the wavelength sensitivity study of CWL-existed SFS structure. The calculated wavelength sensitivity curves of SRI under different microfiber diameters are shown in Figure 7. By measuring the peak wavelength separation of DL, 1 and DH, 1, a maximum sensitivity of −69,984.3 nm/RIU (“−“ denotes blue wavelength shifts) around the air refractive index is obtained in experiments. The temperature influence on the gas RI sensor is also reported, and the measured temperature sensitivities of DL, 1 and DH, 1 are −2.134 nm/°C and 1.899 nm/°C, respectively. Thus, the cross-sensitivity of the gas refractive index sensor is 5.763 × 10 5 RIU/ ° C .
With the merits of excellent sensitivity performances and simple fabrication processes, few-mode microfibers have been further studied and applied in various SRI-related sensing parameters. Guan et al. [29] thoroughly investigated the sensitivity of a two-mode microfiber MZI as a function of SRI. Since Equation (7) can be rewritten as
Δ λ N Δ n S R I = λ N 1 Γ ( 1 Δ n e f f ( Δ n e f f ) n S R I )
where Γ = 1 λ N / Δ n e f f · Δ n e f f / λ is a dispersion factor that characterizes the effect of index difference variations with wavelength, Δ n e f f / λ . Since the whole term in the bracket was negative [48], the sign of Γ is crucial in determining the SRI sensitivity sign. CWL exists at the point where the sign of the SRI sensitivity changes. The simulated dispersion factors Γ and Δ λ N / Δ n S R I as functions of the fiber diameter is shown in Figure 8. The numerical simulation revealed that two CWLs exist as the microfiber diameter decreases. Experiments were conducted to study the wavelength sensitivities of interference fringes around both CWLs. At the second CWL, an ultrahigh SRI sensitivity of approximately 95,836 nm/RIU with the microfiber diameter of 1.87 µm was achieved around the SRI of air. Wang et al. [33] applied the few-mode microfiber MZI in marine fields by measuring sodium nitrate in seawater. They achieved the wavelength sensitivity of 5.98 pm/ppm using DL, 1, corresponding to the SRI sensitivity of 50,396.09 nm/RIU. CWL was also observed in Z-shaped few-mode microfibers between the interference of HE11 and HE21 modes [34]. The SRI sensitivity of 1.46 × 10⁵ nm/RIU was experimentally achieved around the refractive index of water.
Zhao et al. [32] demonstrated an ultrasensitive sensor for SRI and temperature measurement by employing a CWL-existed two-mode microfiber. An ultrahigh SRI sensitivity of 24,209 nm/RIU around 1.3320 and a high-temperature sensitivity of −2.47 nm/ ° C were experimentally achieved by a microfiber with a waist diameter of ~4.8 μm. Meanwhile, the CWL-existed microfiber was coated with a polydimethylsiloxane (PDMS) layer to increase the temperature sensitivity to about 8.33 nm/°C. To further increase the measurement range of the interference dips, they [30] proposed a fiber Bragg grating (FBG) cascaded microfiber in-line MZI operating at the CWL and applied it in seawater temperature measurement, as shown in Figure 9a. The FBG resonant dip, located in the achromatic fringe region, works as a rough measurement tool to identify the temperature measurement ranges. Meanwhile, the interference dip closest to the CWL with the highest sensitivity among all the interference dips was employed to measure the water temperature once the rough range was determined. The two-mode microfiber MZI was packaged in PDMS to increase temperature sensitivity. The transmission spectrum of the FBG-cascaded two-mode microfiber MZI in PDMS package is shown in Figure 9b. With the aid of FBG, the temperature measurement range could be enlarged from ~2 ° C to ~36 ° C , with a temperature sensitivity of ~38 nm/ ° C , as shown in Figure 9c.
Apart from using nonadiabatic tapers to fabricate the few-mode microfibers by tapering a standard SMF, other special fibers were employed to increase the sensor performance and redshift the cutoff wavelength of the high-order mode in the microfiber. In 2020, Wang et al. [31] proposed a CWL-existed in-line MZI by tapering a ring-core two-mode fiber. Quasi-adiabatic transition tapers were fabricated to provide HE11 and HE21 modes with continuous mode evolutions to the microfiber section. The two modes launched into the fiber were collected at the fiber output. A CWL was observed when the tapered two-mode microfiber was immersed in a liquid environment. The SRI sensitivities of 79,283.7 nm/RIU and −48,772 nm/RIU were reported, respectively, by detecting the right and left interference dip closest to CWL, i.e., DL, 1 and DH, 1. Thus, a maximum sensitivity of 128,055.7 nm/RIU was achieved by measuring the wavelength separation variations between these two interference dips. This CWL-based two-mode microfiber was further applied in an immunoglobulin G (IgG) level measurement. The limits of detection of 10 fg/mL of IgG in phosphate-buffered saline solution were achieved in the experiments. Luo et al. [36] reported a refractive index sensor fabricated by tapering a single stress-applying fiber (SSAF), where a stress-applying part was introduced into the fiber cladding to engineer the cladding material index. The SSAF-based two-mode microfiber could significantly reduce the sensitivity of the group effective refractive index difference between the two interference modes—HE11 and TE01. Therefore, the operation bandwidth of the two-mode microfiber can be broadened to 500 nm, compared with that of conventional SMF-based two-mode microfiber with the same diameter operating at CWL. By detecting the wavelength separation changes between DL, 1 and DH, 1., a maximum sensitivity of 30,563 nm/RIU was reported in the refractive index measurement range of 1.3212~1.3216.
The interference fringes in the transmission spectrum of a CWL-existed few-mode microfiber structure can also be applied in vibration measurement. Luo et al. [35] demonstrated a highly sensitive vibration sensor using a CWL-existed two-mode microfiber MZI and packaging it in a rectangular through-hole cantilever beam. By detecting the interference dip near the CWL, the maximum axial-strain sensitivity reached −45.55 pm/µε. This structure was also applied in acceleration sensing experiments, where the acceleration sensitivity of the sensor was 0.764 V/g at 45 Hz.
The sensors employing the CWL-based in-line MZI structures and measuring the wavelength shifts in the interference peaks/dips closest to the CWL on both sides are listed in Table 1. Compared with SFS structures, the few-mode microfibers exhibit higher sensitivity in temperature, axial strain, acceleration, and surrounding refractive index measurements. However, the taper structures and ultrasmall waists of the microfibers may cause structural fragility. Therefore, the microfibers and the taper regions should be packaged carefully to guarantee robustness in applications. During experiments, the noise induced by temperature fluctuations and axial strain in the packaging process should also be considered. The CWL-based in-line MZIs have advantages in that the CWL and interference fringes near the CWL exhibit different wavelength sensitivities under the same measurement and variation. Thus, the temperature- and strain-induced noises can be compensated by simultaneously detecting two or three peaks/dips.

4. Characteristics of the Achromatic Fringe in CWL-Existed in-Line MZIs and Their Applications

In the transmission spectrum of a CWL-existed in-line MZI, achromatic fringes are different from the periodically changing interference fringes and, therefore, are easy to identify. Because the achromatic fringe shifts monotonously with sensing parameters, CWL detection sensors can be applied in large-range measurements. This section reviews a demodulation method of the CWL and sensing applications employing CWL detection.

4.1. Detection Scheme of CWL in the SFS Sensing Structure

The demodulation method of the CWL in the transmission spectrum and its advantages, compared with the traditional interference peak detection, is explained in Ref. [8], using an etched SFS structure in SRI detection. Figure 10 shows the simulated transmission spectra, the shift in CWL, and the wavelength shift in peak/dip located closest to the CWL on each side under different SRIs. The peaks/dips in both sides of CWL will move toward the CWL with increasing SRI. If SRI is measured by monitoring the wavelength shift in peaks/dips lying around the CWL, the peaks/dips will end at CWL with only a small measurement range of SRI, as shown in Figure 10. Therefore, traditional interference peak/dip wavelength detection methods limit the measurement range significantly.
Since the peaks and dips in the transmission spectrum are nearly symmetrically distributed on both sides of CWL, to avoid difficulties in identifying CWL from achromatic fringes, we can obtain CWL from Equation (8) by averaging the wavelength of PH, 1, DH, 1, PL, 1, and DL, 1, written as
λ C W L = λ P H ,   1 + λ D H ,   1 + λ P L ,   1 + λ D L ,   1 4
The shift in CWL with SRI is calculated from Equation (8) above, and the results are given in Figure 10b. Compared with the change in first peak or dip wavelengths simultaneously plotted in Figure 10b, the CWL changes monotonically with SRI in a large measurement range, with unambiguous demodulation of SRIs. Thus, the CWL detection sensors can effectively solve the overlapping spectrum problem and provide large sensing ranges in applications.

4.2. Sensing Applications of in-Line MZIs Based on CWL Detection

The advantages of the CWL detection method in large-range measurement are first experimentally observed in temperature detection. Tripathi et al. [18] spliced a section of MMF between two sections of SMF (SMS) and observed a CWL in the transmission spectrum at 1318 nm. The experiments showed that the CWL shifted monotonously with temperature from 25 °C to 1100 °C. Martincek et al. [40] employed a liquid-core optical fiber, which consisted of a fused silica cladding and a core with medicinal oil, to increase the temperature sensitivity of the CWL. The maximum temperature sensitivity of the measured CWL was −56 nm/°C, around 24 °C. The transmission spectra of the liquid-core fiber with temperature variations are shown in Figure 11.
Our group theoretically studied the characteristics of the CWL in the transmission spectrum of an SFS structure and applied the SFS structure in the large-range measurement of SRI [8], curvature [6], and displacement measurements [7]; the sensing ranges achieved 1.316~1.44 at 1550 nm, 0~125 m−1, and 0~350 mm, respectively, as shown in Figure 12.

5. Conclusions

In this paper, we reviewed the transmission characteristics of CWL-existed in-line MZIs. The detection of the CWL in the transmission spectrum provides a solution to the overlapping problem in conventional MZIs with periodically changing interference fringes. Moreover, the interference peaks/dips on each side of the CWL shift in opposite directions. Their wavelength sensitivities increase significantly when peak wavelengths approach the CWL, which provides a solution for fiber-optic MZIs to enhance their sensitives by designing the operational wavelength near the CWL. Therefore, taking full advantage of the CWL-existed transmission spectrum, these in-line MZIs can be developed into several different sensors, including large-range measurement sensors, multiparameter sensors, and high-sensitivity sensors, to satisfy the requirements in practical applications.

Author Contributions

Principal writing—C.L.; modification and editing—X.D., C.W. and C.L.; project administration, X.D. and C.W.; funding acquisition, X.D. and C.W. All authors have read and agreed to the published version of the manuscript.

Funding

This research was funded, in part, by the PI Project of Southern Marine Science and Engineering Guangdong Laboratory (Guangzhou) under grant number GML2021GD0808; in part, by the National Natural Science Foundation of China, grant number 61775186; and in part by the Marine and Fisheries Bureau of Xiamen, grant number 16CZB025SF03.

Institutional Review Board Statement

Not applicable.

Informed Consent Statement

Not applicable.

Conflicts of Interest

The authors declare no conflict of interest.

References

  1. Li, X.; Chen, N.; Zhou, X.; Gong, P.; Wang, S.; Zhang, Y.; Zhao, Y. A review of specialty fiber biosensors based on interferometer configuration. J. Biophotonics 2021, 14, e202100068. [Google Scholar] [CrossRef] [PubMed]
  2. Bhardwaj, V.; Kishor, K.; Sharma, A.C. Tapered optical fiber geometries and sensing applications based on Mach-Zehnder interferometer: A review. Opt. Fiber Technol. 2020, 58, 102302. [Google Scholar] [CrossRef]
  3. Zhao, Y.; Zhao, H.; Lv, R.-Q.; Zhao, J. Review of optical fiber Mach–Zehnder interferometers with micro-cavity fabricated by femtosecond laser and sensing applications. Opt. Lasers Eng. 2019, 117, 7–20. [Google Scholar] [CrossRef]
  4. Min, R.; Liu, Z.; Pereira, L.; Yang, C.; Sui, Q.; Marques, C. Optical fiber sensing for marine environment and marine structural health monitoring: A review. Opt. Laser Technol. 2021, 140, 107082. [Google Scholar] [CrossRef]
  5. Wang, L.; Yj, W.; Song, S.; Li, F. Overview of fibre optic sensing technology in the field of physical ocean observation. Front. Phys. 2021, 9, 745487. [Google Scholar] [CrossRef]
  6. Su, J.; Dong, X.; Lu, C. Characteristics of few mode fiber under bending. IEEE J. Sel. Top. Quantum Electron. 2016, 22, 139–145. [Google Scholar] [CrossRef]
  7. Su, J.; Dong, X.; Lu, C. Property of bent few-mode fiber and its application in displacement sensor. IEEE Photonics Technol. Lett. 2016, 28, 1387–1390. [Google Scholar] [CrossRef]
  8. Lu, C.; Dong, X.; Su, J. Detection of refractive index change from the critical wavelength of an etched few mode fiber. J. Lightwave Technol. 2017, 35, 2593–2597. [Google Scholar] [CrossRef]
  9. Lu, C.; Su, J.; Dong, X.; Sun, T.; Grattan, K.T.V. Simultaneous measurement of strain and temperature with a few-mode fiber-based sensor. J. Lightwave Technol. 2018, 36, 2796–2802. [Google Scholar] [CrossRef]
  10. Lu, C.; Su, J.; Dong, X.; Lu, L.; Sun, T.; Grattan, K.T.V. Studies on temperature and strain sensitivities of a few-mode critical wavelength fiber optic sensor. IEEE Sens. J. 2019, 19, 1794–1801. [Google Scholar] [CrossRef]
  11. Lu, C.; Dong, X.; Lu, L.; Guan, Y.; Ding, S. Label free all-fiber static pressure sensor based on Vernier effect with temperature compensation. IEEE Sens. J. 2020, 20, 4726–4731. [Google Scholar] [CrossRef]
  12. Su, J.; Dong, X.; Lu, C. Intensity detection scheme of sensors based on the modal interference effect of few mode fiber. Measurement 2016, 79, 182–187. [Google Scholar] [CrossRef]
  13. Lei, X.; Dong, X.; Lu, C. Sensitive humidity sensor based on a special dual-mode fiber. IEEE Sens. J. 2019, 19, 2587–2591. [Google Scholar] [CrossRef]
  14. Lei, X.; Dong, X.; Lu, C.; Sun, T.; Grattan, K.T.V. Underwater pressure and temperature sensor based on a special dual-mode optical fiber. IEEE Access 2020, 8, 146463–146471. [Google Scholar] [CrossRef]
  15. Salik, E.; Medrano, M.; Cohoon, G.; Miller, J.; Boyter, C.; Koh, J. SMS fiber sensor utilizing a few-mode fibere exhibits critical wavelengthbehavior. IEEE Photonics Technol. Lett. 2012, 24, 593–595. [Google Scholar] [CrossRef]
  16. Wu, Q.; Semenova, Y.; Wang, P.; Farrell, G. High sensitivity SMS fiber structure based refractometer—Analysis and experiment. Opt. Express 2011, 19, 7937–7944. [Google Scholar] [CrossRef]
  17. Zhou, J.; He, B.; Gu, X. Transmission spectrum characteristics for a single-mode-multimode-single-mode fiber filter. IEEE Photonics Technol. Lett. 2014, 26, 2185–2188. [Google Scholar] [CrossRef]
  18. Tripathi, S.M.; Kumar, A.; Marin, E.; Meunier, J. Critical Wavelength in the Transmission Spectrum of SMS Fiber Structure Employing GeO2-Doped Multimode Fiber. IEEE Photonics Technol. Lett. 2010, 22, 799–801. [Google Scholar] [CrossRef]
  19. Kumar, M.; Kumar, A.; Tripathi, S.M. A comparison of temperature sensing characteristics of SMS structures using step and graded index multimode fibers. Opt. Commun. 2014, 312, 222–226. [Google Scholar] [CrossRef]
  20. Tripathi, S.M.; Kumar, A.; Varshney, R.K.; Kumar, Y.B.P.; Marin, E.; Meunier, J.P. Strain and temperature sensing characteristics of single-mode–multimode–single-mode structures. J. Lightwave Technol. 2009, 27, 2348–2356. [Google Scholar] [CrossRef]
  21. Gonthier, F.; Lacroix, S.; Ladouceur, F.; Black, R.J.; Bures, J. Circularly symmetric modal interferometers: Equalization wavelength and equivalent step determination for matched-cladding fibers. Fiber Integr. Opt. 1989, 8, 217–225. [Google Scholar] [CrossRef]
  22. Zhou, A.; Li, G.; Zhang, Y.; Wang, Y.; Guan, C.; Yang, J.; Yuan, L. Asymmetrical twin-core fiber based michelson interferometer for refractive index sensing. J. Lightwave Technol. 2011, 29, 2985–2991. [Google Scholar] [CrossRef]
  23. Gu, B.; Yin, M.-J.; Zhang, A.P.; Qian, J.-W.; He, S. Low-cost high-performance fiber-optic pH sensor based on thin-core fiber modal interferometer. Opt. Express 2009, 17, 22296–22302. [Google Scholar] [CrossRef] [PubMed]
  24. Yi, D.; Huo, Z.; Geng, Y.; Li, X.; Hong, X. PDMS-coated no-core fiber interferometer with enhanced sensitivity for temperature monitoring applications. Opt. Fiber Technol. 2020, 57, 102185. [Google Scholar] [CrossRef]
  25. Wong, W.C.; Chan, C.C.; Chen, L.H.; Li, T.; Lee, K.X.; Leong, K.C. Polyvinyl alcohol coated photonic crystal optical fiber sensor for humidity measurement. Sens. Actuators B Chem. 2012, 174, 563–569. [Google Scholar] [CrossRef]
  26. Lacroix, S.; Gonthier, F.; Black, R.J.; Bures, J. Tapered-fiber interferometric wavelength response: The achromatic fringe. Opt. Lett. 1988, 13, 395–397. [Google Scholar] [CrossRef]
  27. Luo, H.; Sun, Q.; Li, X.; Yan, Z.; Li, Y.; Liu, D.; Zhang, L. Refractive index sensitivity characteristics near the dispersion turning point of the multimode microfiber-based Mach–Zehnder interferometer. Opt. Lett. 2015, 40, 5042–5045. [Google Scholar] [CrossRef] [Green Version]
  28. Zhang, N.M.Y.; Li, K.; Zhang, N.; Zheng, Y.; Zhang, T.; Qi, M.; Shum, P.; Wei, L. Highly sensitive gas refractometers based on optical microfiber modal interferometers operating at dispersion turning point. Opt. Express 2018, 26, 29148–29158. [Google Scholar] [CrossRef]
  29. Sun, L.P.; Huang, T.; Yuan, Z.; Lin, W.; Xiao, P.; Yang, M.; Ma, J.; Ran, Y.; Jin, L.; Li, J.; et al. Ultra-high sensitivity of dual dispersion turning point taper-based Mach-Zehnder interferometer. Opt. Express 2019, 27, 23103–23111. [Google Scholar] [CrossRef]
  30. Xia, F.; Zhao, Y.; Zheng, H.K.; Li, L.K.; Tong, R.J. Ultra-sensitive seawater temperature sensor using an FBG-cascaded microfiber MZI operating at dispersion turning point. Opt. Laser Technol. 2020, 132, 106458. [Google Scholar] [CrossRef]
  31. Sun, B.; Wang, Y. High-sensitivity detection of IgG operating near the dispersion turning point in tapered two-mode fibers. Micromachines 2020, 11, 270. [Google Scholar] [CrossRef] [PubMed] [Green Version]
  32. Xia, F.; Zhao, Y.; Peng, Y. In-line microfiber MZI operating at two sides of the dispersion turning point for ultrasensitive RI and temperature measurement. Sens. Actuators A Phys. 2020, 301, 111754. [Google Scholar] [CrossRef]
  33. Yang, L.; Wang, J.; Wang, S.; Liao, Y.; Li, Y. A new method to improve the sensitivity of nitrate concentration measurement in seawater based on dispersion turning point. Optik 2020, 205, 164202. [Google Scholar] [CrossRef]
  34. Zhou, W.; Wei, Y.; Wang, Y.; Li, K.; Yu, H.; Wu, Y. Ultrasensitive interferometers based on zigzag-shaped tapered optical microfibers operating at the dispersion turning point. Opt. Express 2021, 29, 36926–36935. [Google Scholar] [CrossRef] [PubMed]
  35. Liu, K.; Fan, J.; Luo, B.; Zou, X.; Wu, D.; Zou, X.; Shi, S.; Guo, Y.; Zhao, M. Highly sensitive vibration sensor based on the dispersion turning point microfiber Mach-Zehnder interferometer. Opt. Express 2021, 29, 32983–32995. [Google Scholar] [CrossRef] [PubMed]
  36. Xu, S.; Chang, W.; Luo, Y.; Ni, W.; Zheng, Y.; Wei, L.; Xu, Z.; Lian, Z.; Zhang, Y.a.; Huang, Y.; et al. Ultrasensitive broadband refractometer based on single stress-applying fiber at dispersion turning point. J. Lightwave Technol. 2021, 39, 2528–2535. [Google Scholar] [CrossRef]
  37. Mascotte, E.H.; Hernandez, J.M.S.; Chavez, R.I.M.; Vazquez, D.J.; Guzman, A.C.; Ayala, J.M.E.; Chavez, A.D.G.; Laguna, R.R. A core-offset Mach Zehnder interferometer based on a non-zero dispersion-shifted fiber and its torsion sensing application. Sensors 2016, 16, 856. [Google Scholar] [CrossRef] [Green Version]
  38. Ahsani, V.; Ahmed, F.; Jun, M.B.G.; Bradley, C. Tapered fiber-optic Mach-Zehnder interferometer for ultra-high sensitivity measurement of refractive index. Sensors 2019, 19, 1652. [Google Scholar] [CrossRef] [Green Version]
  39. Gong, H.; Chan, C.C.; Zhang, Y.; Wong, W.; Dong, X. Temperature sensor based on modal interference in hollow-core photonic bandgap fiber with collapse splicing. IEEE Sens. J. 2012, 12, 1421–1424. [Google Scholar] [CrossRef]
  40. Martincek, I.; Pudis, D.; Kacik, D.; Schuster, K. Investigation of intermodal interference of LP01 and LP11 modes in the liquid-core optical fiber for temperature measurements. Optik 2011, 122, 707–710. [Google Scholar] [CrossRef]
  41. Hlubina, P.; Kadulova, M.; Ciprian, D.; Mergo, P. Temperature sensing using the spectral interference of polarization modes in a highly birefringent fiber. Opt. Lasers Eng. 2015, 70, 51–56. [Google Scholar] [CrossRef]
  42. Hlubina, P.; Olszewski, J.; Martynkien, T.; Mergo, P.; Makara, M.; Poturaj, K.; Urbanczyk, W. Spectral-domain measurement of strain sensitivity of a two-mode birefringent side-hole fiber. Sensors 2012, 12, 12070–12081. [Google Scholar] [CrossRef]
  43. Wei, C.; Lin, G.; Dong, X.; Tao, S. A tunable polarization-independent comb filter based on high-order mode fiber. J. Opt. 2013, 15, 055403. [Google Scholar] [CrossRef]
  44. Vengsarkar, A.M.; Walker, K.L. Article Comprising a Dispersion-Compensating Optical Waveguide. U.S. Patent 5,448,674, 5 September 1995. [Google Scholar]
  45. Kumar, A.; Goel, N.K.; Varshney, R.K. Studies on a few-mode fiber-optic strain sensor based on LP01-LP02 mode interference. J. Lightwave Technol. 2001, 19, 358. [Google Scholar] [CrossRef]
  46. Hocker, G. Fiber-optic sensing of pressure and temperature. Appl. Opt. 1979, 18, 1445–1448. [Google Scholar] [CrossRef]
  47. Shu, X.; Zhang, L.; Bennion, I. Sensitivity characteristics near the dispersion turning points of long-period fiber gratings in B/Ge codoped fiber. Opt. Lett. 2001, 26, 1755–1757. [Google Scholar] [CrossRef]
  48. Tan, Y.; Sun, L.P.; Jin, L.; Li, J.; Guan, B.O. Microfiber Mach-Zehnder interferometer based on long period grating for sensing applications. Opt. Express 2013, 21, 154–164. [Google Scholar] [CrossRef]
Figure 1. Schematic of the critical-wavelength-existed in-line Mach–Zehnder interferometer measurement system.
Photonics 09 00378 g001
Figure 2. (a) Geometrical structure and relative refractive index difference profile of the few-mode fiber; (b) the SMF–FMF–SMF (SFS) structure. The insets are simulated mode field distributions of the LP01 mode propagating in SMF and the LP01 and LP02 modes propagating in FMF at 1550 nm wavelength using the finite element model. SMF: single-mode fiber; FMF: few-mode fiber.
Photonics 09 00378 g002
Figure 3. The simulated curve of the propagation constant difference Δ β of LP01 and LP02 modes propagating in the few-mode fiber, and the transmission spectrum of the SFS structure ( L FMF = 50 cm) under the temperature of 25 ° C versus wavelength.
Photonics 09 00378 g003
Figure 4. Characteristics of interference fringes in the transmission spectra of the CWL-existed SFS structure: (a) temperature wavelength sensitivities of interference fringes; (b) axial strain wavelength sensitivities of interference fringes; (c) static pressure wavelength sensitivities of interference fringes; (d) transmission spectra of the SFS structure (LFMF = 50 cm) under temperature variations.
Photonics 09 00378 g004
Figure 5. (a) Diagram of the cascaded SMF–FMF-SMF(SFS) structure; (b) experimental transmission spectra of the cascaded SFS structure under static water pressure variations; (c) wavelength shifts in PEL. 1 and PEL. 2 under static water pressure and temperature variations. Reprinted with permission from ref. [11]. Copyright 2020 IEEE.
Photonics 09 00378 g005
Figure 6. (a) The microscopic view of the tapered optical microfiber; (b) the origin (black) and the fast Fourier transform (FFT)-filtered (red) transmission spectra of the tapered few-mode microfiber surrounded by air; (c) the simulated mode profiles of HE11 and HE12 modes. Adapted with permission from Ref. [28].
Photonics 09 00378 g006
Figure 7. The surrounding refractive index sensitivities of interference fringes around CWLs at different waist diameters of microfibers. Adapted with permission from Ref. [28].
Photonics 09 00378 g007
Figure 8. (a) Schematic diagram of the taper-based in-line MZI; the inset presents calculated intensity profiles of the interference two modes, HE11 and HE12, respectively; (b) simulated dispersion factor Γ and (c) RI sensitivity as functions of the fiber diameter. Adapted with permission from Ref. [29].
Photonics 09 00378 g008
Figure 9. (a) Schematic of the polydimethylsiloxane (PDMS)-packaged two-mode microfiber for temperature measurement; (b) the transmission spectrum of the PDMS-packaged two-mode microfiber MZI cascaded with FBG; (c) cooperation of the FBG resonant dip and the interference dips (DL, 1 and DH, 1) lying on each side of the CWL in temperature measurement. Reprinted with permission from Ref. [30]. Copyright 2020 Elsevier.
Photonics 09 00378 g009
Figure 10. The simulated results of the etched SFS structure ( d F M F = 21.3 μm, L F M F = 20 cm): (a) the transmission spectra under the SRIs of 1.350, 1.355, and 1.360; (b) wavelength shifts in the critical wavelength and interference peaks/dips on each side of the critical wavelength.
Photonics 09 00378 g010
Figure 11. Shift in the CWL in MZI employing the liquid-core fiber shown on measured spectra for temperatures of 28.2, 27.5, and 26.2 ° C . Reprinted with permission from Ref. [40]. Copyright 2011 Elsevier.
Photonics 09 00378 g011
Figure 12. The wavelength shifts in CWL and sensor structures employing the few-mode fiber in the SFS structure; (a) experimental (marks with error bars) and calculated results of CWL shift with SRI variations. Reprinted with permission from ref. [8]. Copyright 2017 IEEE. (b) calculated and experimental results of CWL shift with equivalent curvature. Reprinted with permission from ref. [6]. Copyright 2016 IEEE. (c) schematic diagram of the experiment setup of the displacement sensor employing SFS structure; (d) the experimental and the theoretical results of the CWL changes in the sensor and the theoretical equivalent curvature of FMF in the helix coil (dashed line) versus displacement. Reprinted with permission from ref. [7]. Copyright 2016 IEEE.
Photonics 09 00378 g012
Table 1. Performance comparisons of different CWL-existed in-line MZI sensors.
StructureSensor ApplicationMaximum SensitivityRefs.
Few-mode fiberCurvature−0.745 nm/m−1[6]
Few-mode fiberAxial Strain 43   pm / μ ε [10]
Few-mode fiberTemperature 704   pm / [10]
Cascaded few-mode fibertemperature 1.753   nm / [11]
Cascaded few-mode fiberStatic pressure4.072 nm/MPa[11]
Few - mode   microfiber   with   a   diameter   of   2   μ m Refractive index around 1−69,984.3 nm/RIU[28]
Few - mode   microfiber   with   a   diameter   of   1.87   μ m Refractive index around 195,836 nm/RIU[29]
Few - mode   microfiber   with   a   diameter   of   3.57   μ m Sodium nitrate in seawater5.98 pm/ppm[33]
Z-shaped few-mode microfiberRefractive index around 1.3331.46 × 105 nm/RIU[34]
Few-mode microfiber coated with PDMSTemperature38   nm / [30]
Few-mode microfiber tapered by a ring-core two-mode fiberRefractive index around 1.333128,055.7 nm/RIU[31]
Few-mode microfiber tapered by a single stress-applying fiberRefractive index around 1.321230,563 nm/RIU[36]
Few - mode   microfiber   with   a   diameter   of   2.2   μ m Axial strain 45.55   pm / μ ε [35]
Few - mode   microfiber   with   a   diameter   of   2.2   μ m Acceleration764 mV/g[35]
Publisher’s Note: MDPI stays neutral with regard to jurisdictional claims in published maps and institutional affiliations.

