Communication

Bound States in the Continuum Empower Subwavelength Gratings for Refractometers in Visible

Nanophotonics and Plasmonics Laboratory, School of Basic Sciences, IIT Bhubaneswar, Khordha 752050, Odisha, India
*
Author to whom correspondence should be addressed.
These authors contributed equally to this work.
Photonics 2022, 9(5), 292; https://doi.org/10.3390/photonics9050292
Submission received: 22 March 2022 / Revised: 17 April 2022 / Accepted: 20 April 2022 / Published: 25 April 2022
(This article belongs to the Special Issue Integrated Optics and Devices)

Abstract

:
This paper describes a compact refractometer in visible with optical bounds states in the continuum (BICs) using silicon nitride (Si3N4) based sub-wavelength medium contrast gratings (MCGs). The proposed device is highly sensitive to different polarization states of light and allows a wide dynamic range from 1.330 (aqueous environment) to 1.420 (biomolecules) monitoring, apart from its being thermally stable. The proposed sensor has a sensitivity of 363 nm/RIU for X polarized light and 137 nm/RIU for Y polarized light. The spectral characteristics have been obtained with a high angular resolution for the smaller angle of incidence, which confirms the BIC hybrid modes with good quality factors and enhanced field confinement. The device is based on a normal-to-the-surface optical launching strategy to achieve exceptional interrogation stability and alignment-free performance. This system can also be used in the CMOS photodetectors for on-chip label-free biosensing.

1. Introduction

Bound states in the continuums (BICs) is fundamentally a quantum mechanical process that produces a unique state of light and is considered as a resonant mode of infinite quality factor (Q) and lifetime [1,2]. The possibility of BICs was first time mentioned in 1929 by von Neumann Wigner [3]. This exceptional eigenmode of a system with a discrete eigenvalue in the continuum region remains localized within the system without radiating any energy to the surroundings and has been observed in water, elastic, and acoustic waves [4,5,6]. Theoretically, BIC in photonics systems was realized for the first time in 2008, and later in 2011, its experimental observation was also reported [7,8]. Only systems with at least one dimension that extends to infinity can reach real BICs. However, in practice, due to the finite extent of the structure, material absorption, and other external perturbations, the BIC transforms to a finite-Q Fano resonance with a finite lifetime–a regime known as quasi–BIC. These states have also been studied in a wide range of materials such as optical waveguides [9], fibers [10], topological insulators [11], and dielectric photonic crystals [12]. Further, BIC has been demonstrated in different geometrical structures, such as resonant planar structures [13], periodic arrays [14], and metasurfaces [15], along with its applications in transmission filters [16], lasers [17], second harmonic generation [18].
Recently, BIC has been explored with plasmonic systems for different applications, including sensing, but this system exhibits significant absorption due to the presence of metal which leads to a lower Q value [19,20]. For a certain degree of wavelength shift, smaller linewidth has the advantage of causing a higher intensity change. A small linewidth means a reduced dynamic range, which is the degree of refractive index change detected by the detector prior to a change in intensity owing to wavelength shift and hence improves the detection limit by enabling measurement of very small variations in refractive index [21,22].
In comparison to plasmonic sensors [23], dielectric [24], fiber [25], resonant nanostructures [26], photonic crystal structure [27,28], and gratings [23] have a higher Q-factor but lower sensitivity. In the past years, BIC is paving the way for high throughput optical sensing devices with enhanced light-matter interaction at the nanoscale [29,30]. They can attain a higher Q-factor as well as a superior performance by optimizing the different structural parameters [31,32]. One such structure is periodic grating using high index materials such as silicon (Si), titanium oxide (TiO2), germanium (Ge) on low index substrate [30,33,34,35], but they have a finite absorption in the visible region because of their low bandgaps which smear out the BIC. However, silicon nitride (Si3N4), a low-density material with high-temperature strength and good oxidation-resistant is an alternative grating material with low loss, high optical power tolerance, and has a broad spectral operation band spanning from visible to infrared wavelength [36]. Depending on the structures of periodic systems, two different types of BIC can be realized: symmetry-protected BICs and accidental BICs. A symmetry-protected BIC can only be generated in the zeroth-order of a reflection/transmission or the Γ point of the periodic system [16,37], and accidental BICs are formed by destructive interference of two different scattering channels [38].
In this manuscript, we propose a compact refractometer that can excite symmetry-protected transverse electric (TE) and transverse magnetic (TM) polarized optical BICs, that employs a refractive index subwavelength grating over a most widely and commonly used silica substrate. We studied the impact of geometry parameters on the resonance of reflection/transmission spectra. The proposed device is highly sensitive to different polarization states of light and allows a wide dynamic range from 1.330 (aqueous environment) to 1.420 (biomolecules) monitoring, apart from its being thermally stable. Further, the angular dependence of incident light sources on the performance of the system has been studied.

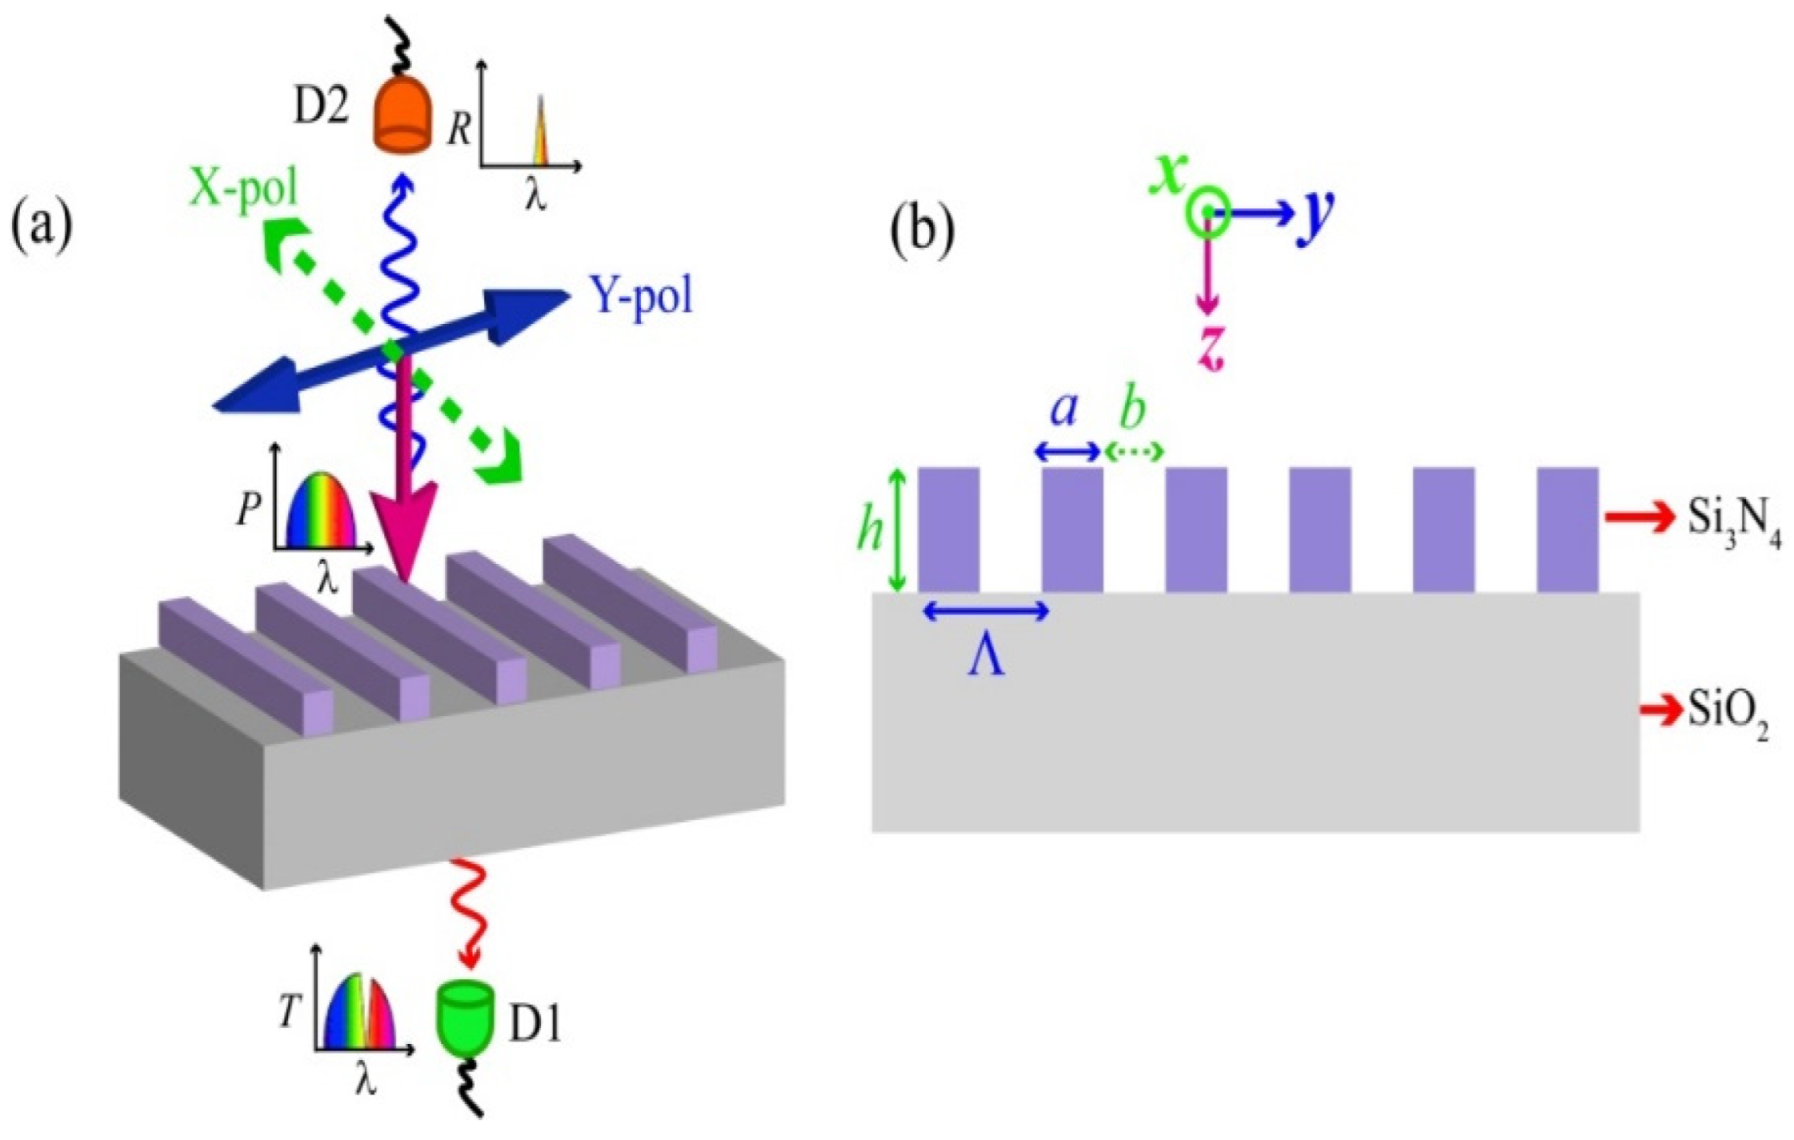
2. Proposed Structure of Si3N4Based BIC System

The proposed 3D schematic structure of Si3N4 based BIC system is shown in Figure 1a. It consists of a silicon dioxide (SiO2) glass substrate on which one-dimensional (1D) periodic rectangular Si3N4 grating bars are considered. The rectangular bars are placed on the glass substrate at regular intervals. A 2D schematic structure of the proposed BIC is depicted in Figure 1b with the different parameters h, Λ, a, b which represent the height, pitch, fill region, and blank region of the grating, respectively. Here, the ratio of the width of the fill zone to the pitch of the grating (F = a/Λ) is termed as fill factor (F). This type of structure can be experimentally fabricated by using the plasma-enhanced chemical vapor deposition (PECVD) technique followed by e-beam lithography [39]. The optical response of the proposed system has been recorded for various values of surrounding index ns.
Where the refractive index (RI) of the glass substrate (ngl) and the Si3N4 grating (nsn) are considered as 1.500 and 2.020, respectively [22,34], incident light source polarized in two orthogonal planes: X-polarization (X-pol) and Y-polarization (Y-pol), is considered for the analysis as shown in Figure 1a. The X-pol axis is considered to be parallel to the plane containing grating bars, and the mode travelling in this direction is TE mode. Similarly, the Y-pol axis is perpendicular to the plane containing the grating bar, and the mode of travelling is defined as TM mode. Suitable detectors can be used to record reflected and transmitted light.

3. Results and Discussion

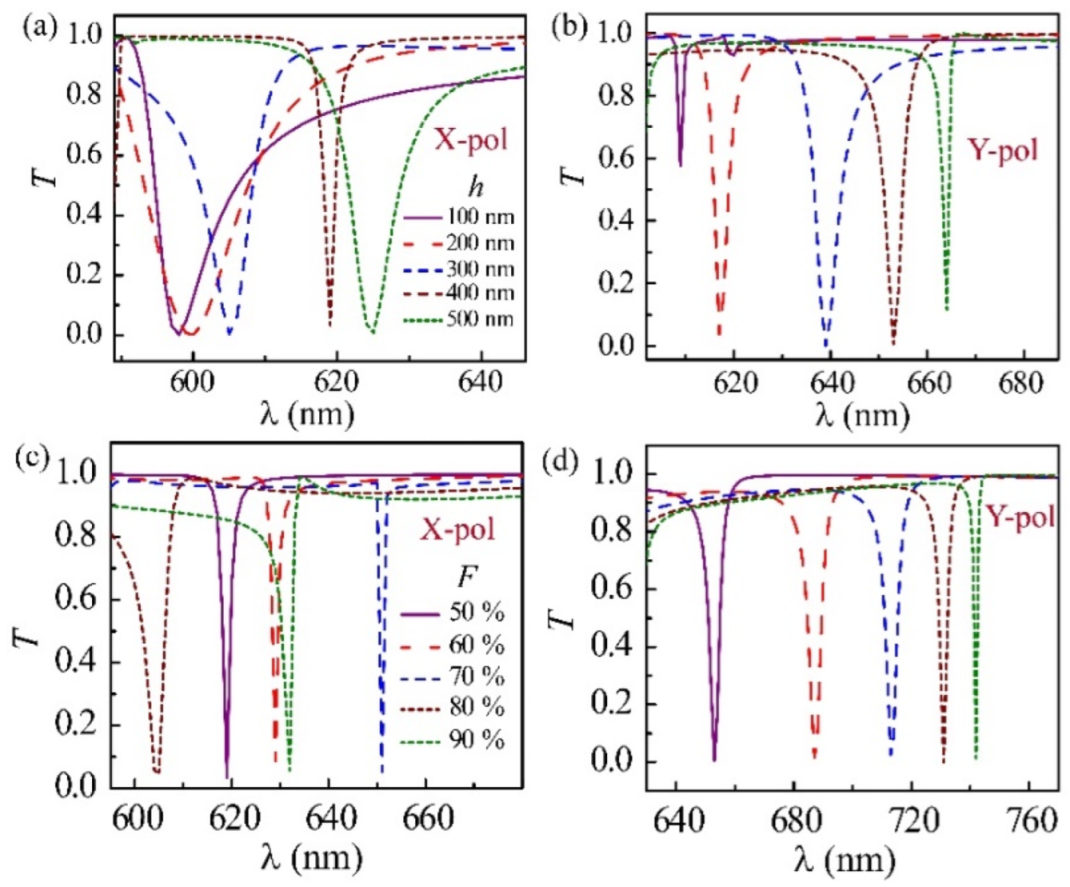
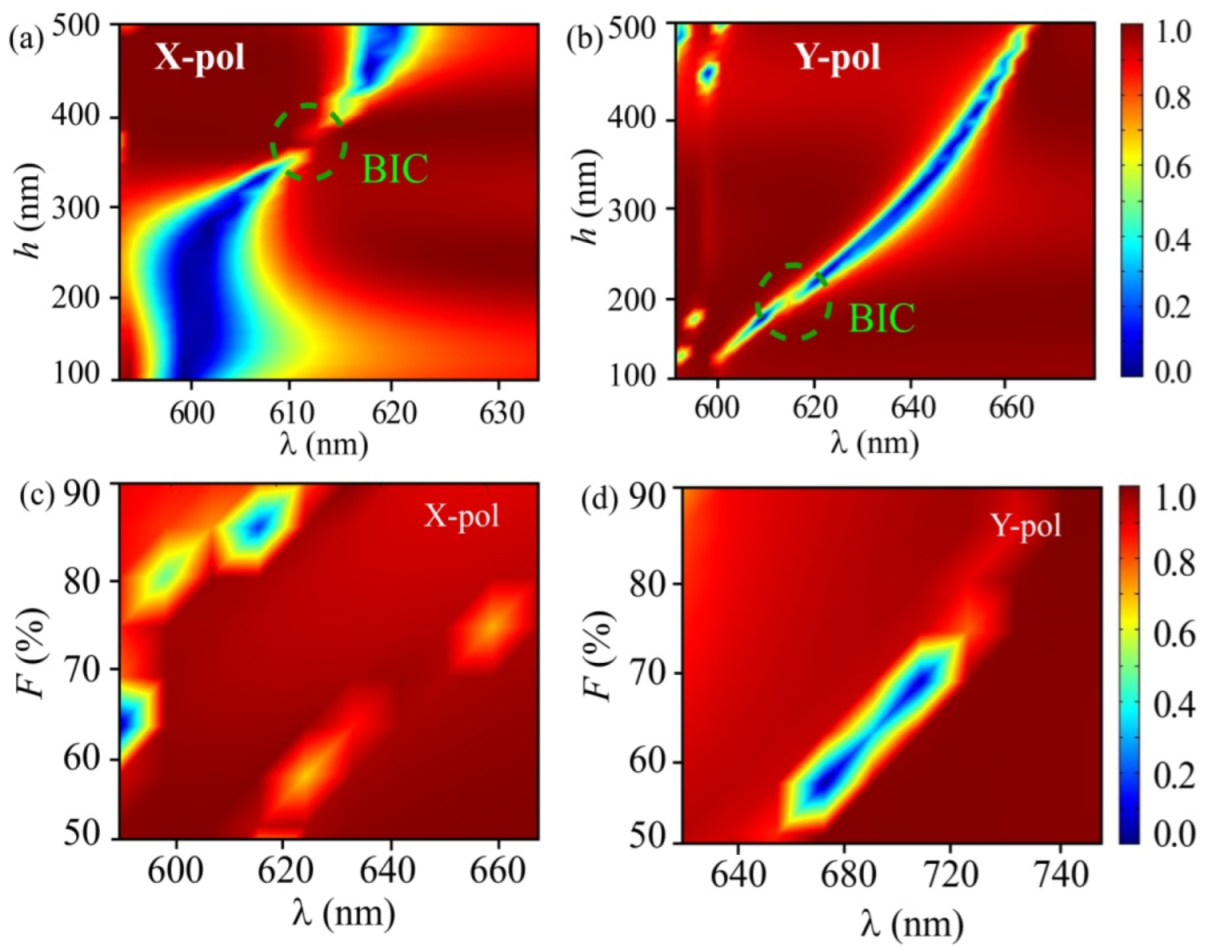
3.1. Optimization of Grating Height and Fill Factor

The proposed structure is optimized using the finite element method (FEM) based on COMSOL Multiphysics simulations to work as a refractometer in the visible range (600–700) nm, where economic sources and detectors are easily available. Due to invariance in the z-direction of our device, for convenience, the 2D geometry of the structure is chosen, and for the study, the electromagnetic wave, frequency domain (ewfd) is taken, which is under the wave optics module. We simulate the device using a fine mesh with 36,267 elements. Here, the periodic boundary condition is applied along the y-direction, and two ports are defined along the z-direction to a grating unit cell to create 1D periodic subwavelength grating structures. Here, the zeroth-order diffraction is observed due to the normal incidence of plane wave light.
To observe enhanced reflectivity, Si3N4 has been considered as a 1D periodic grating structure over SiO2 with optimized parameters h and F. Further, the value of h is varied from 100 nm to 500 nm by taking F = 50%, i.e., a = 200 nm, and the variation in transmittance with the incident wavelength λ is shown in Figure 2a,b for X-pol and Y-pol lights, respectively. The X-pol light exhibits a sharp resonance at h = 400 nm, as shown in Figure 2a. This could be because h and Λ are both equal to 400 nm, which facilitates the resonance. It can be seen from the figures that Fano-like resonance is observed here for different h for both the polarization. This is because when the grating is illuminated from the far zone, the destructive interference between incident light and guided mode in the structure occurs at a specific wavelength or polarization to give rise to Fano-like resonances in reflectance and transmittance spectrum [31,34,40,41,42]. Here, resonance wavelength (λr) increases with h for both polarized lights, resulting in a redshift of 27 nm and 54 nm for X-pol and Y-pol light, respectively. A large shift in Y-pol light occurs due to its highly dispersive nature as compared to X-pol light [43,44]. This difference contributes largely to the different properties of both polarized lights. Further, the computed transmittance with the parametric sweep of h is shown through the contour plots in Figure 3a,b. Note that the regime of the dotted circle shown in Figure 3a,b give evidence of BIC. Here, it can be clearly seen that at this particular point, there is complete suppression of energy leading to a high Q-factor [45]. The regime near to dotted circle is quasi-BIC [46].
The variation in transmittance with respect to λ for different values of F is shown in Figure 2c,d for both polarizations. Optical response of the incident light is observed for F ranging from 50% to 90%. For the X-pol light in Figure 2c, the λr initially shifts forward with increasing F and then shifts backward with the further increase in F. However, in the case of Y-pol light, it follows an increasing trend in λr with an increase in F and shows a redshift, as depicted in Figure 2d. This is due to the fluctuation in the Fano parameter q (q = cot (δ)), where q represents the relative excitation intensity associated with the discrete and continuous states and δ is the phase difference between the incident mode and guided-mode [47]. The corresponding transmittance contour plots are given in Figure 3c,d.
By considering all of the combinations, the optimized value of h = 400 nm and F = 50% is considered as F = 50% grating pitch is commonly employed in the fabrication of both amplitude and phase grating due to its best-visibility and high sensitivity [48].The value of all the optimized geometrical parameters shown in Figure 1 are listed in Table 1. As a result, for the optimized structure and ns = 1.330 [34], the λr is found to be 619 nm and 653 nm for X-pol and Y-pol lights, respectively. As the λr of the system is directly proportional to the effective index (neff) of the mode, the λr of Y-pol is more than X-pol [32]. Additionally, the full width at half maximum (FWHM) of the resonant peak (δλ) for X-pol and Y-pol lights are calculated to be 1.4 nm and 3.9 nm, respectively. Further, the Q = λr/δλ is calculated and found to be 368.45 for X-pol and 165.52 for Y-pol, respectively. The X-pol light has a higher Q-factor because it experiences larger index modulation by the 1D periodic grating [49,50]. For X-pol light, the same optimized structure with unity surrounding refractive index, (i.e., free space or gaseous medium) gives λr, δλ, and Q-factor values of around 511 nm, 4 nm, and 127.75, respectively.

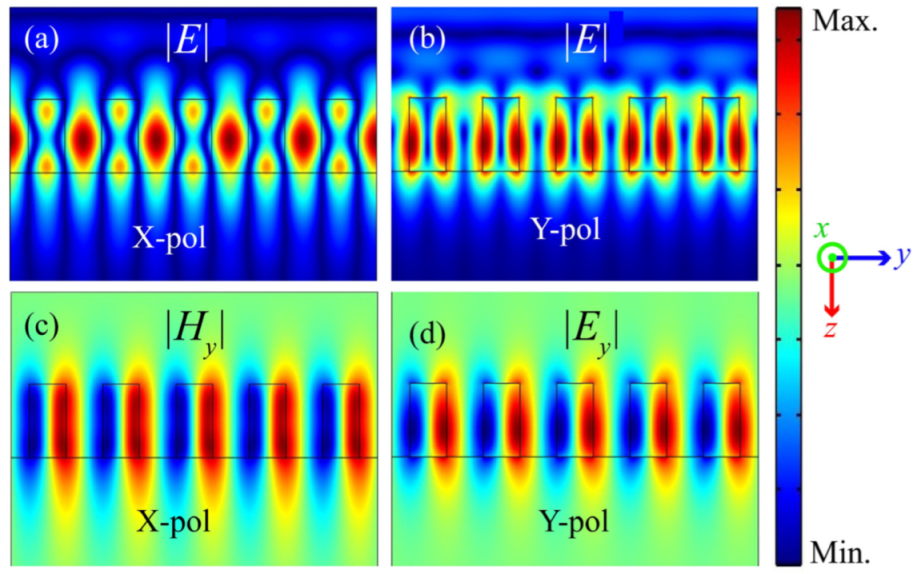
3.2. Electric Field Profile of the Proposed BIC Structure

The electric and magnetic field enhancement of the optimized structure at the λr is shown in Figure 4. The normalized electric field confinement in the proposed BIC structure for X-pol and Y-pol light is depicted in Figure 4a and Figure 4b, respectively. It is observed that the maximum electric field is confined in the region between two bars for X-pol light, whereas it is confined at both edges of the bar for Y-pol light, and there is an almost insignificant field between the bars.
Since the proposed structure is a 1D periodic array of parallel gratings with periodicity Λ and symmetric about the z-axis, if a light is incident with X–polarization, its propagation is controlled by the Helmholtz equation for x–component of an electric field [34],
( 2 y 2 + 2 z 2 ) E x + k 2 ε E x = 0
where k is a vacuum wavenumber, and ε is a grating dielectric function. Due to the grating periodicity along the y-axis, the solution of Equation (1) can be written in the form of a Bloch wave and given by,
E x ( y , z ) = ψ ( y , z ) e i β y
where ψ is the Bloch wave function and β is the propagation constant (β = 2π/λ) in the positive y-direction. In an ideal case, the value of β is equal to zero. Figure 4c,d illustrate the eigenmode profiles of the Si3N4 grating system, i.e., |Hy| in X-pol and |Ey| in Y-pol light, at eigenfrequency of 484.3 THz and 459.1 THz, respectively. |Hy| and |Ey| are antisymmetric (y-odd) with respect to the axis of an array and clearly fall into the symmetry protected type as it is symmetrically mismatched to the zeroth-order diffraction channel [51]. Here we can see that there are also some leaky modes due to the presence of substrate, which leads to a finite Q-factor in our proposed structure [52]. Note that Figure 4c,d show a field profile of quasi BICs. However, Figure 4a,b have a symmetric standing wave (y–even) pattern, and it is a propagating Bloch BIC with β = 0.010/nm, and 0.009/nm for X-pol and Y-pol lights, respectively, as they are not protected symmetry [14].

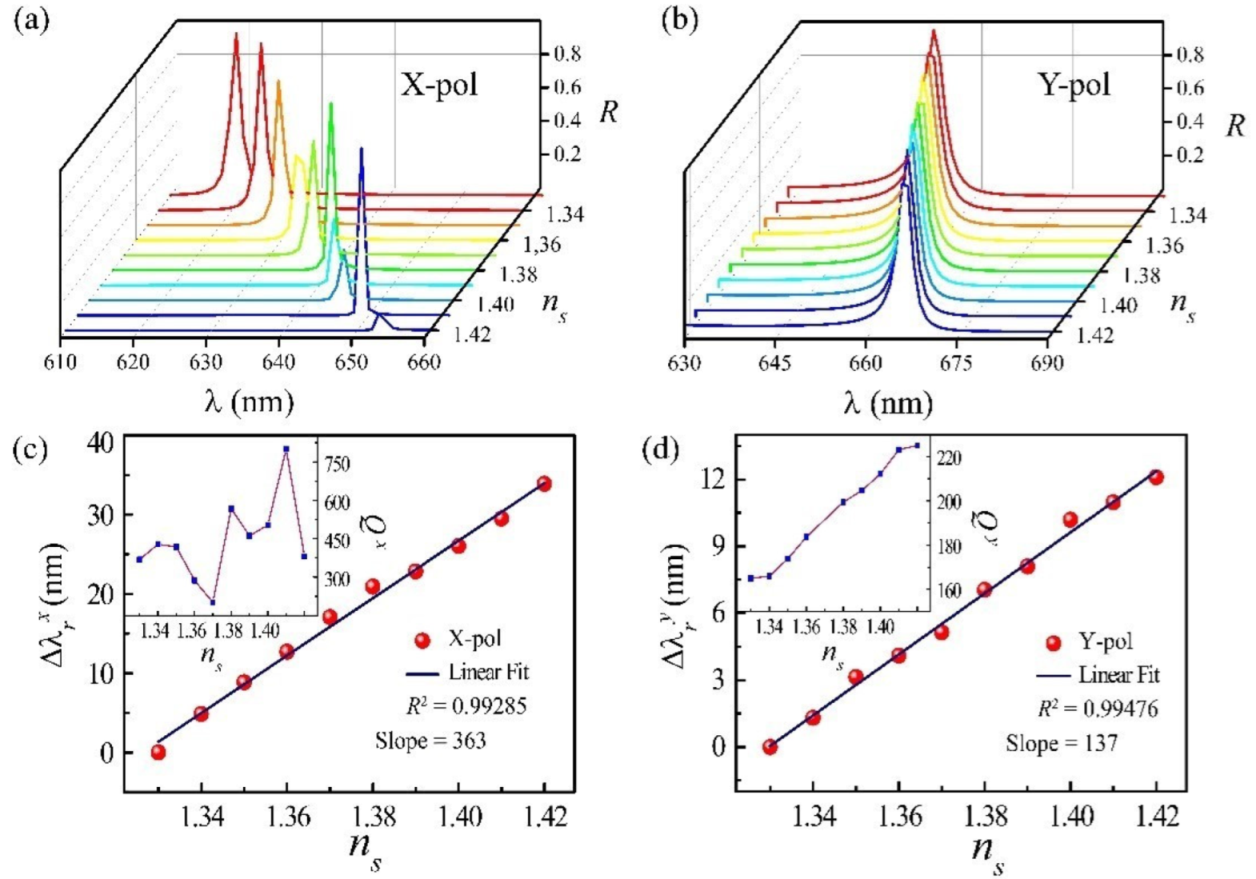
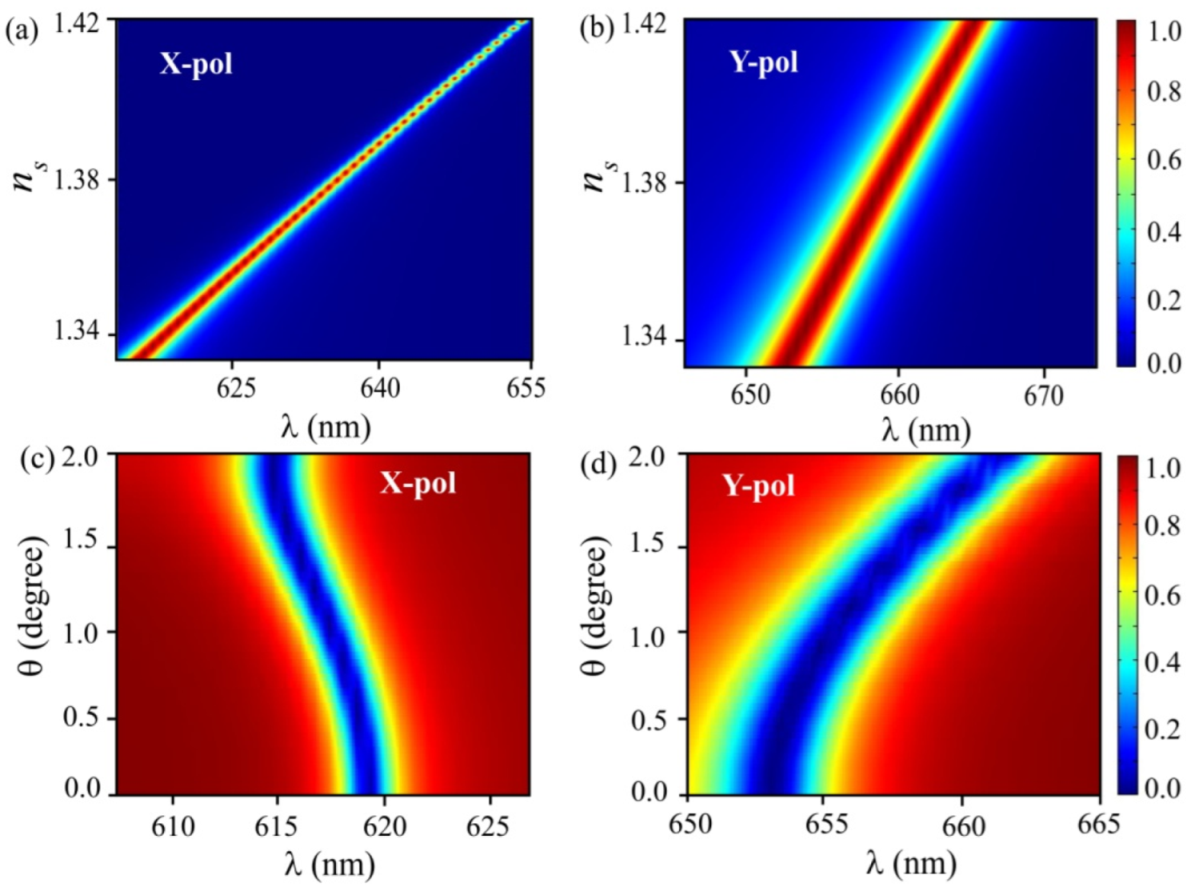
3.3. Refractive Index Sensing

For refractometric applications, Figure 5a,b show the variation in R with λ for various ns ranging from 1.330 to1.420 for normal incidence (along the z-axis). These figures clearly illustrate that there is an increase in λ with the increase in ns, indicating a redshift in wavelength in both polarized lights. For X-pol light in Figure 5a, the visibility of the reflectance spectrum lowers as ns increases. However, in the case of Y-pol light, there is no discernible difference in the visibility of the spectrum. The change in ns also results in a Fano-like resonance in the reflection spectrum for both X-pol and Y-pol lights, as shown in Figure 5a,b, respectively. The calculated reflectance contour plots by varying ns are shown in Figure 6a,b. The RI sensitivity (Sn) of a system is defined as the ratio of change in resonance wavelength (Δλr) to the change in the surrounding RI (Δns), given by [34],
S n = Δ λ r Δ n s
In the calculation of sensitivity, the surrounding refractive index n s 0 = 1.330 is taken as the reference RI and the corresponding resonance wavelengths λ r 0 619 nm and 653 nm are reference wavelengths for X-pol and Y-pol lights, respectively. In Equation (3), resonance wavelength change is Δ λ r = λ r λ r 0 and surrounding refractive index change Δ n s = n s n s 0 . The shift in resonance wavelength as calculated with different ns for X-pol and Y-pol lights and have been shown using the linear fit function in Figure 5c,d, respectively. A significantly higher shift of 35 nm and 12 nm is found in the resonant wavelength for X-pol and Y-pol lights, respectively. The R2-value and slope for X-pol (Y-pol) light are obtained as 0.99285 (0.99476) and 363 (137), respectively. As a result, we obtained a sensitivity of 363 nm/RIU for X-pol and 137 nm/RIU for Y-pol light. As the X-pol light experiences larger index modulation by the 1D periodic grating and, also the electric field distribution of X-pol mode is more concentrated in the analyte region (see Figure 4), the X-pol light has a higher sensitivity than Y-pol light. The FoM is given by a ratio of sensitivity to the full width at half maximum (FoM = S n FWHM ). Here a sensitivity is calculated as 363 nm/RIU (137 nm/RIU) for X-pol (Y-pol) light, and FWHM is 1.4 nm (3.9 nm) for X-pol (Y-pol) light. Hence FoM of the proposed structure is equal to 259.28/RIU (35/RIU) for X-pol (Y-pol) light. Further, change in Q-factor with ns is shown in the inset of Figure 5c,d, with the respective values of the highest Q-factor was found to be 820 and 233.08 for X-pol and Y-pol lights.

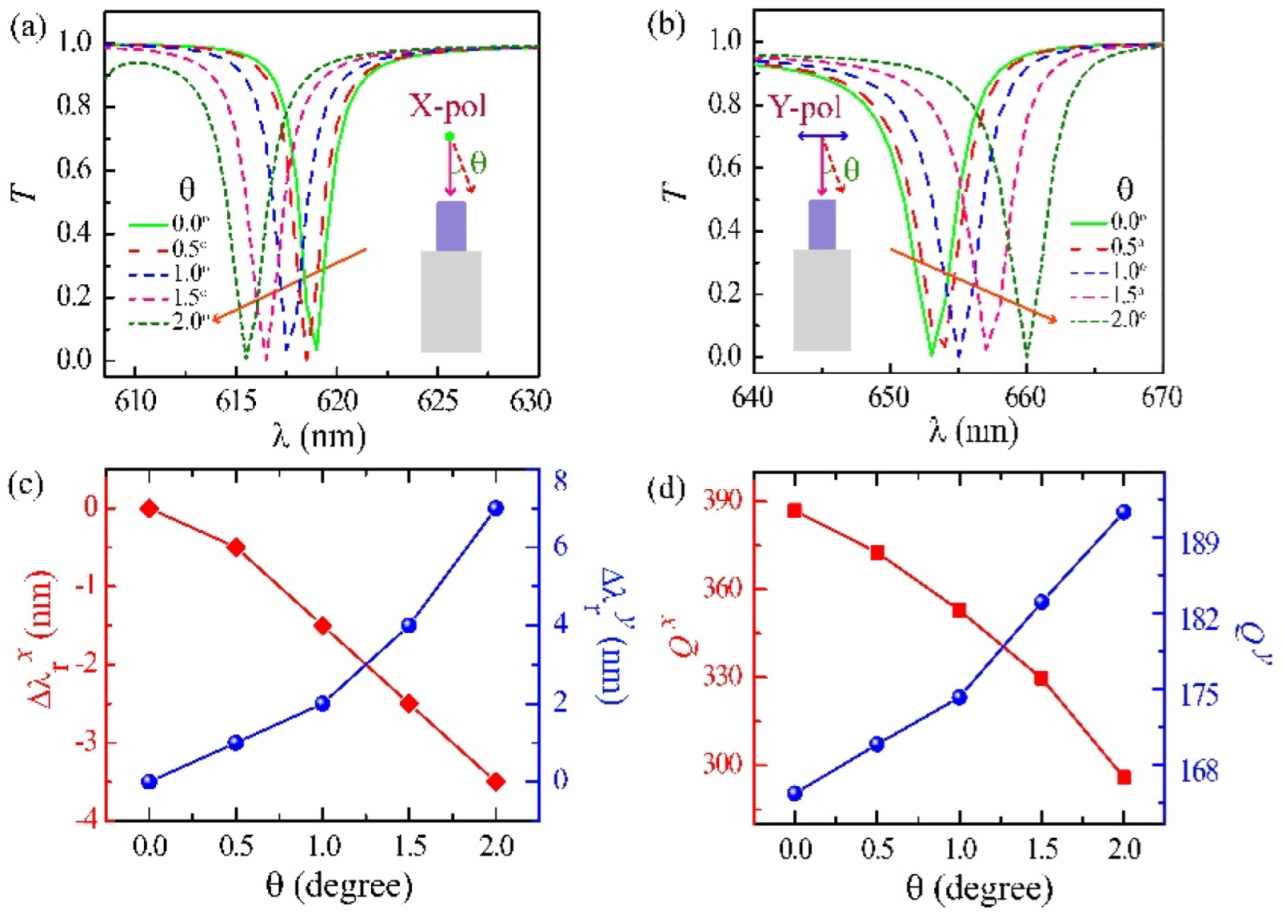
3.4. Vector Bending Measurement

To see the influence of the angle of incidence on optical responses, the angle of the source (θ) is adjusted from 0° to 2°for both polarized lights. Figure 7a,b demonstrate the variation in T with λ for both polarized lights. It is apparent that there is a blueshift (redshift) in λr that occurs with the change in θ for X-pol (Y-pol) light, respectively. The change in the resonant wavelength Δ λ r with θ for X-pol (red curve) and Y-pol (blue curve) lights are shown in Figure 5c. A shift of 3.8 nm (7 nm) occurs in Δ λr, which gives the angular sensitivity ( S θ = Δ λ r / Δ θ ) of 1.9 nm/degree (3.5 nm/degree) for X-pol (Y-pol) light of the system. Additionally, we have also calculated the change in Q-factor for different θ. Figure 7d shows a variation of Q-factor with θ for both the polarized lights. As can be clearly seen in the transmittance graphs, the Fano resonance spectra diverge (converge) with the increase in the small angle of incidence in X-pol (Y-pol) light, respectively; as a result, it is found that Q-factor decreases with an increase in θ for X-pol light, whereas it increases with θ for Y-pol light. Further, the transmittance contour plots for various θ are shown in Figure 6c,d.

4. Conclusions

In conclusion, we report a refractometer with optical BICs using Si3N4 based sub-wavelength grating structure. This proposed device is sensitive to different polarization of light in the visible region and a broad range of refractive indices. The proposed sensor has a 363 nm/RIU sensitivity for X-pol light and 137 nm/RIU for Y-pol light. The obtained spectral characteristics in the small angular resolved scan between 0° to 2° verify the BIC hybrid modes with good quality factors and enhanced field confinement. This system can also be used in the CMOS photodetectors for on-chip label-free biosensing and selective polarization interrogation of light emission from nanoscale emitters.

Author Contributions

R.J. conceptualized the idea. S.S. and G.Y. did the simulation work. S.S., G.Y. and R.J. did the investigation, data curation, and formal analysis. S.S., G.Y., R.K. and R.J. have prepared the manuscript and compiled the entire work. All authors have read and agreed to the published version of the manuscript.

Funding

This research received no external funding.

Data Availability Statement

The datasets generated and/or analyzed during the current study are available from the corresponding authors on reasonable request.

Acknowledgments

R.J. acknowledges the support of the SERB-STAR fellowship (Physical Science).

Conflicts of Interest

The authors declare no conflict of interest.

References

  1. Koshelev, K.; Bogdanov, A.; Kivshar, Y. Engineering with Bound States in the Continuum. Opt. Photonics News 2020, 31, 38–45. [Google Scholar] [CrossRef]
  2. Hsu, C.W.; Zhen, B.; Lee, J.; Chua, S.L.; Johnson, S.G.; Joannopoulos, J.D.; Soljačić, M. Observation of Trapped Light within the Radiation Continuum. Nature 2013, 499, 188–191. [Google Scholar] [CrossRef] [PubMed] [Green Version]
  3. von Neumann, J.; Wigner, E.P. Über Merkwürdige Diskrete Eigenwerte. In The Collected Works of Eugene Paul Wigner; Springer: Berlin/Heidelberg, Germany, 1993; pp. 291–293. [Google Scholar] [CrossRef]
  4. Hsu, C.W.; Zhen, B.; Stone, A.D.; Joannopoulos, J.D.; Soljacic, M. Bound states in the continuum. Nat. Rev. Mater. 2016, 1, 16048. [Google Scholar] [CrossRef] [Green Version]
  5. Gazdy, B. On the Bound States in the Continuum. Phys. Lett. A 1977, 61, 89–90. [Google Scholar] [CrossRef]
  6. Stillinger, F.H.; Herrick, D.R. Bound states in the continuum. Phys. Rev. A 1975, 11, 446. [Google Scholar] [CrossRef]
  7. Plotnik, Y.; Peleg, O.; Dreisow, F.; Heinrich, M.; Nolte, S.; Szameit, A.; Segev, M. Experimental observation of optical bound states in the continuum. Phys. Rev. Lett. 2011, 107, 28–31. [Google Scholar] [CrossRef] [Green Version]
  8. Marinica, D.C.; Borisov, A.G.; Shabanov, S.V. Bound states in the continuum in photonics. Phys. Rev. Lett. 2008, 100, 183902. [Google Scholar] [CrossRef]
  9. Kuzmiak, V.; Petráček, J. BIC in waveguide arrays. EPJ Web Conf. 2021, 255, 07001. [Google Scholar] [CrossRef]
  10. Gao, X.; Zhen, B.; Soljačić, M.; Chen, H.; Hsu, C.W. Bound States in the Continuum in Fiber Bragg Gratings. ACS Photonics 2019, 6, 2996–3002. [Google Scholar] [CrossRef] [Green Version]
  11. Benalcazar, W.A.; Cerjan, A. Bound states in the continuum of higher-order topological insulators. Phys. Rev. B 2020, 101, 161116. [Google Scholar] [CrossRef]
  12. Sadrieva, Z.F.; Bogdanov, A.A. Bound state in the continuum in the one-dimensional photonic crystal slab. J. Phys. Conf. Ser. 2016, 741, 012122. [Google Scholar] [CrossRef]
  13. Joseph, S.; Pandey, S.; Sarkar, S.; Joseph, J. Bound states in the continuum in resonant nanostructures: An overview of engineered materials for tailored applications. Nanophotonics 2021, 10. [Google Scholar] [CrossRef]
  14. Yuan, L.; Lu, Y.Y. Strong resonances on periodic arrays of cylinders and optical bistability with weak incident waves. Phys. Rev. A 2017, 95, 023834. [Google Scholar] [CrossRef]
  15. Liang, Y.; Koshelev, K.; Zhang, F.; Lin, H.; Lin, S.; Wu, J.; Jia, B.; Kivshar, Y. Bound States in the Continuum in Anisotropic Plasmonic Metasurfaces. Nano Lett. 2020, 20, 6351–6356. [Google Scholar] [CrossRef] [PubMed]
  16. Foley, J.M.; Young, S.M.; Phillips, J.D. Symmetry-protected mode coupling near normal incidence for narrow-band transmission filtering in a dielectric grating. Phys. Rev. B 2014, 89, 165111. [Google Scholar] [CrossRef]
  17. Kodigala, A.; Lepetit, T.; Gu, Q.; Bahari, B.; Fainman, Y.; Kanté, B. Lasing action from photonic bound states in continuum. Nature 2017, 541, 196–199. [Google Scholar] [CrossRef]
  18. Wang, T.; Zhang, S. Large enhancement of second harmonic generation from transition-metal dichalcogenide monolayer on grating near bound states in the continuum. Opt. Express 2018, 26, 322–337. [Google Scholar] [CrossRef]
  19. Azzam, S.I.; Shalaev, V.M.; Boltasseva, A.; Kildishev, A.V. Formation of Bound States in the Continuum in Hybrid Plasmonic-Photonic Systems. Phys. Rev. Lett. 2018, 121, 253901. [Google Scholar] [CrossRef] [Green Version]
  20. Liang, Y.; Lin, H.; Lin, S.; Wu, J.; Li, W.; Meng, F.; Yang, Y.; Huang, X.; Jia, B.; Kivshar, Y. Hybrid anisotropic plasmonic metasurfaces with multiple resonances of focused light beams. Nano Lett. 2021, 21, 8917–8923. [Google Scholar] [CrossRef]
  21. Shakoor, A.; Grande, M.; Grant, J.; Cumming, D.R.S. One-Dimensional Silicon Nitride Grating Refractive Index Sensor Suitable for Integration with CMOS Detectors. IEEE Photonics J. 2017, 9, 6800711. [Google Scholar] [CrossRef]
  22. Kaur, P.; Shenoy, M. Highly Sensitive Refractive Index Sensor based on Silicon Nitride Strip Waveguide Directional Coupler. IEEE Sens. Lett. 2018, 2. [Google Scholar] [CrossRef]
  23. Xu, Y.; Bai, P.; Zhou, X.; Akimov, Y.; Png, C.E.; Ang, L.K.; Knoll, W.; Wu, L. Optical Refractive Index Sensors with Plasmonic and Photonic Structures: Promising and Inconvenient Truth. Adv. Opt. Mater. 2019, 7, 31–33. [Google Scholar] [CrossRef]
  24. Zhou, H.; Hu, D.; Yang, C.; Chen, C.; Ji, J.; Chen, M.; Chen, Y.; Yang, Y.; Mu, X. Multi-Band Sensing for Dielectric Property of Chemicals Using Metamaterial Integrated Microfluidic Sensor. Sci. Rep. 2018, 8, 14801. [Google Scholar] [CrossRef] [PubMed] [Green Version]
  25. Gorai, P.; Jha, R. Artificial Receptor-Based Optical Sensors (AROS): Ultra-Sensitive Detection of Urea. Adv. Photonics Res. 2021, 2, 2100044. [Google Scholar] [CrossRef]
  26. Amoosoltani, N.; Mehrabi, K.; Zarifkar, A.; Farmani, A.; Yasrebi, N. Double-Ring Resonator Plasmonic Refractive Index Sensor Utilizing Dual-Band Unidirectional Reflectionless Propagation Effect. Plasmonics 2021, 16, 1277–1285. [Google Scholar] [CrossRef]
  27. Jha, R.; Villatoro, J.; Badenes, G. Ultrastable in reflection photonic crystal fiber modal interferometer for accurate refractive index sensing. Appl. Phys. Lett. 2008, 93, 82–85. [Google Scholar] [CrossRef]
  28. Jha, R.; Villatoro, J.; Badenes, G.; Pruneri, V. Refractometry based on a photonic crystal fiber interferometer. Opt. Lett. 2009, 34, 617–619. [Google Scholar] [CrossRef]
  29. Zito, G.; Romano, S.; Cabrini, S.; Calafiore, G.; De Luca, A.C.; Penzo, E.; Mocella, V. Observation of spin-polarized directive coupling of light at bound states in the continuum. Optica 2019, 6, 1305–1312. [Google Scholar] [CrossRef] [Green Version]
  30. Zhou, Y.; Moewe, M.; Kern, J.; Huang, M.C.; Chang-Hasnain, C.J. Surface-normal emission of a high-Q resonator using a subwavelength high-contrast grating. Opt. Express 2008, 16, 17282–17287. [Google Scholar] [CrossRef] [Green Version]
  31. Xie, S.; Li, Z.; Zhou, R.; Zhan, J.; Liu, Q.; Wu, L.; Zhou, B. Fano resonance of the symmetry-reduced metal bar grating structure. J. Nanomater. 2014, 2014, 341050. [Google Scholar] [CrossRef]
  32. Sang, T.; Dereshgi, S.A.; Hadibrata, W.; Tanriover, I.; Aydin, K. Highly efficient light absorption of monolayer graphene by quasi-bound state in the continuum. Nanomaterials 2021, 11, 484. [Google Scholar] [CrossRef] [PubMed]
  33. Karagodsky, V.; Chang-Hasnain, C.J. Physics of near-wavelength high contrast gratings. Opt. Express 2012, 20, 10888–10895. [Google Scholar] [CrossRef] [Green Version]
  34. Maksimov, D.N.; Gerasimov, V.S.; Romano, S.; Polyutov, S.P. Refractive index sensing with optical bound states in the continuum. Opt. Express 2020, 28, 38907–38916. [Google Scholar] [CrossRef] [PubMed]
  35. Maksimov, D.N.; Gerasimov, V.S.; Bogdanov, A.A.; Polyutov, S.P. Enhanced sensitivity of an all-dielectric refractive index sensor with an optical bound state in the continuum. Phys. Rev. A 2022, 105, 033518. [Google Scholar] [CrossRef]
  36. Menon, S.H.G.; Jyothsna, K.M.; Raghunathan, V. Silicon nitride based medium contrast gratings for generating longitudinally polarized resonant fields. Proc. SPIE 2021, 57. [Google Scholar] [CrossRef]
  37. Li, S.; Zhou, C.; Liu, T.; Xiao, S. Symmetry-protected bound states in the continuum supported by all-dielectric metasurfaces. Phys. Rev. A 2019, 100, 063803. [Google Scholar] [CrossRef]
  38. Sidorenko, M.S.; Sergaeva, O.N.; Sadrieva, Z.F.; Roques-Carmes, C.; Muraev, P.S.; Maksimov, D.N.; Bogdanov, A.A. Accidental bound state in the continuum in a chain of dielectric disks. In Proceedings of the 2021 European Quantum Electronics Conference, Munich, Germany, 21–25 June 2021. [Google Scholar] [CrossRef]
  39. Brown, D.K. Direct patterning of plasma enhanced chemical vapor deposition silicon dioxide by electron beam lithography. J. Vac. Sci. Technol. B Microelectron. Nanom. Struct. 2008, 26, 2451–2454. [Google Scholar] [CrossRef]
  40. Nair, B.; Naesby, A.; Jeppesen, B.R.; Dantan, A. Suspended silicon nitride thin films with enhanced and electrically tunable reflectivity. Phys. Scr. 2019, 94, 6. [Google Scholar] [CrossRef] [Green Version]
  41. Patorski, K.I. The Self-Imaging Phenomenon and Its Applications. Prog. Opt. 1989, 27, 1–108. [Google Scholar] [CrossRef]
  42. Mi, Q.; Sang, T.; Pei, Y.; Yang, C.; Li, S.; Wang, Y.; Ma, B. High-quality-factor dual-band Fano resonances induced by dual bound states in the continuum using a planar nanohole slab. Nanoscale Res. Lett. 2021, 16, 150. [Google Scholar] [CrossRef]
  43. Sun, S.; Ye, Z.; Guo, L.; Sun, N. Wide-incident-angle chromatic polarized transmission on trilayer silver/dielectric nanowire gratings. J. Opt. Soc. Am. B 2014, 31, 1211–1216. [Google Scholar] [CrossRef]
  44. Chang-Hasnain, C.J.; Yang, W. High-contrast gratings for integrated optoelectronics. Adv. Opt. Photonics 2012, 4, 379–440. [Google Scholar] [CrossRef] [Green Version]
  45. Van Hoof, N.J.J.; Abujetas, D.R.; Ter Huurne, S.E.T.; Verdelli, F.; Timmermans, G.C.A.; Sánchez-Gil, J.A.; Rivas, J.G. Unveiling the Symmetry Protection of Bound States in the Continuum with Terahertz Near-Field Imaging. ACS Photonics 2021, 8, 3010–3016. [Google Scholar] [CrossRef] [PubMed]
  46. Joseph, S.; Sarkar, S.; Khan, S.; Joseph, J. Exploring the Optical Bound State in the Continuum in a Dielectric Grating Coupled Plasmonic Hybrid System. Adv. Opt. Mater. 2021, 9, 2001895. [Google Scholar] [CrossRef]
  47. Yang, H.; Chen, Y.; Liu, M.; Xiao, G.; Luo, Y.; Liu, H.; Li, J.; Yuan, L. High q-factor hybrid metamaterial waveguide multi-fano resonance sensor in the visible wavelength range. Nanomaterials 2021, 11, 1583. [Google Scholar] [CrossRef]
  48. Salgado-Remacha, F.J.; Sanchez-Brea, L.M.; Bernabeu, E. Effect of fill-factor on the Talbot effect of diffraction gratings. J. Eur. Opt. Soc. 2011, 6, 11055. [Google Scholar] [CrossRef] [Green Version]
  49. Li, W.; Du, J.; Truong, V.G.; Nic Chormaic, S. Optical nanofiber-based cavity induced by periodic air-nanohole arrays. Appl. Phys. Lett. 2017, 110, 253102. [Google Scholar] [CrossRef] [Green Version]
  50. Takashima, H.; Fujiwara, M.; Schell, A.W.; Takeuchi, S. Detailed numerical analysis of photon emission from a single light emitter coupled with a nanofiber Bragg cavity. Opt. Express 2016, 24, 15050–15058. [Google Scholar] [CrossRef]
  51. Bulgakov, E.N.; Maksimov, D.N. Optical response induced by bound states in the continuum in arrays of dielectric spheres. J. Opt. Soc. Am. B 2018, 35, 2443–2452. [Google Scholar] [CrossRef] [Green Version]
  52. Sadrieva, Z.F.; Sinev, I.S.; Samusev, A.K.; Iorsh, I.V.; Bogdanov, A.A.; Koshelev, K.L.; Takayama, O.; Malureanu, R.; Lavrinenko, A.V. Optical bound state in the continuum in the one-dimensional photonic structures: Transition into a resonant state. In Proceedings of the 2017 Progress in Electromagnetics Research Symposium—Spring (PIERS), St. Petersburg, Russia, 22–25 May 2017. [Google Scholar] [CrossRef]
Figure 1. Si3N4 grating-based BIC system (a) shows the schematic 3D representation of the proposed BIC structure. The incident light source is polarized in two orthogonal planes with X-pol (green) and Y-pol (blue) D1, D2, P, T, R, and λ denote detector-1, detector-2, power of light, transmittance, reflectance, and wavelength of the incident light, respectively. (b) Shows a 2D representation of the structure having different parameters.
Photonics 09 00292 g001
Figure 2. Optical responses of grating optimization. (a,b) show the variation in T with the λ for different h at normal incidence of X-pol and Y-pol lights, respectively, (c,d) show the variation in T with the λ for different F at normal incidence of X-pol and Y-pol lights, respectively.
Photonics 09 00292 g002
Figure 3. Contour plot of grating optimization. (a,b) shows contours plots of change in the λ with grating height (h) from 100–500 nm (c,d) show the change in λ with the fill factor (F) from 50–90% for X-pol and Y-pol light, respectively.
Photonics 09 00292 g003
Figure 4. Normalized electric field intensity (|E|) profiles corresponding to λr of 619 nm and 653 nm for (a) X-pol and (b) Y-pol lights, respectively. BIC eigenmode profiles of Si3N4 grating system, i.e., (c) |Hy| in X-pol and (d) |Ey| in Y-pol light, at eigenfrequency of 484.3 THz and 459.1 THz, respectively.
Photonics 09 00292 g004
Figure 5. Effect of ns in the optical responses. (a,b) Show the variation in R with the λ for different ns in X-pol and Y-pol lights, respectively. (c,d) Show the resonance peak shift (Δλ) with the ns with insets show the Q-factor corresponding to each ns for both X-pol and Y-pol lights, respectively.
Photonics 09 00292 g005
Figure 6. Contour plots for reflectivity and transmittivity: (a,b) show the reflectivity contour plots of different ns with λ for both the polarized lights. (c,d) show the transmittivity contour plots for different θ with λ for X-pol and Y-pol lights, respectively.
Photonics 09 00292 g006
Figure 7. Effect of incident angle of source (θ) in the optical responses. (a,b) Show the variation in T with the λ for different θ in X-pol and Y-pol lights, respectively. (c,d) Show the resonance peak shift (Δλ) and variation of Q-factor with θ for both polarized lights, respectively.
Photonics 09 00292 g007
Table 1. Value of the Geometric Parameter Shown in Figure 1.
h (nm) (nm)a (nm)b (nm)Incident Angle θ (Degree)
4004002002000
Publisher’s Note: MDPI stays neutral with regard to jurisdictional claims in published maps and institutional affiliations.

