1. Introduction
External laser injection-locking is a curious field of study due to the range of dynamical states that are produced: laser synchronisation; chaos; four-wave mixing (FWM); self-pulsation and associated period-doubling routes to chaos [
1,
2,
3,
4,
5,
6,
7,
8,
9,
10]. Recently, it was discovered that lasers acting under injection-locking exhibit a strong increase in the potential direct modulation bandwidth, with subsequent studies to unlock the potential of using such strong modulation capability [
9,
10], with algorithms developed to achieve the optimal injection-locking point [
11]. A recent detailed review, in article [
4], details optical injection applications including laser synchronisation for phase-sensitive applications and frequency distribution. Injection-locking is also important for stabilizing gain-switched optical pulse sources and for phase stabilization of optical frequency combs [
12,
13]. External injection of a semiconductor is highlighted in
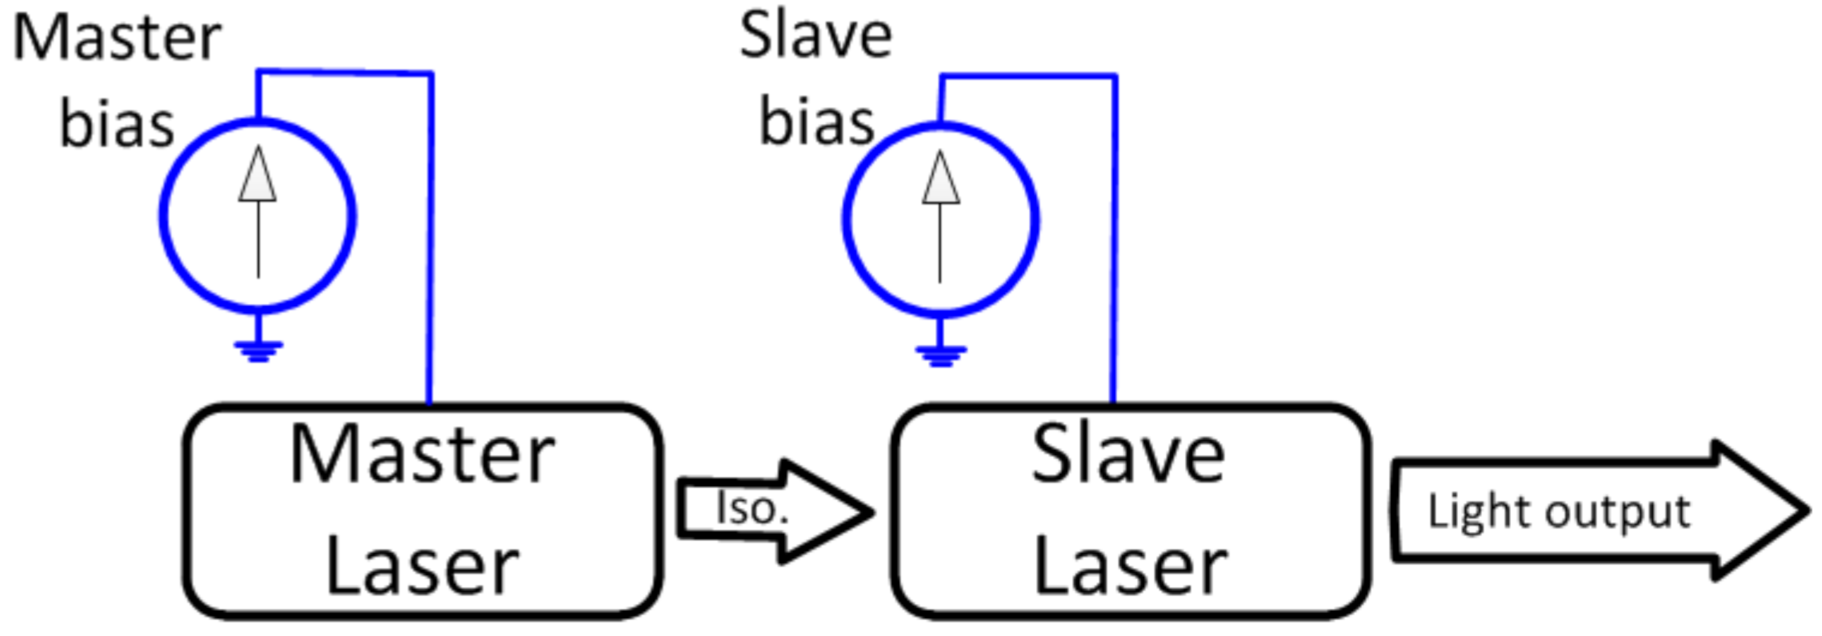
Figure 1, where two lasers are involved and light from the master laser is injected into the slave laser. The optical isolator (Iso.) ensures that no light from the slave laser is injected back into the master laser. In order to observe the phenomena associated with external injection, the central lasing frequency (or wavelength) of both lasers should be similar, within ±25 GHz of each other.
Laser rate equations have been shown to capture the various phenomena of externally injected lasers [
1,
2,
3,
6]. Despite their simplicity, the equations reveal all of the relevant dynamical phenomena of externally injected lasers. An extended treatise in [
6], analysing the dynamical regimes of externally injected lasers, is given in this paper, identifying chaotic, pulsation states including Hopf-bifurcations of the pulsation into general period-N (P-N) pulsation states [
6]. One aspect that we notice when solving laser rate equations when spontaneous emission (SE) is included [
3] is the absence of higher pulsation states beyond the P-2 pulsation states; this would be predicted when SE is omitted in the analysis. Previous studies attributed SE to be the cause of an observed absence of a period-doubling route to chaos [
14]; a more formal analysis [
15] examined the behaviour of noise-induced chaos when the external-injected laser system was in a delicate high order pulsation state and that study found that SE could induce chaotic behaviour.
In this paper, we present a detailed study of the evolution of the optical spectral output from the injected laser system. We concentrate on varying the detuning frequency between the master and slave lasers and building up the output spectra. The plots are characterised by constant master power, and show FWM, injection-locking, self-pulsations, period-doubling and chaos. We find that only period-2 (P-2) pulsations (i.e., pulsations with double the period of the self-pulsation) are present when we solve the complete rate equations with stochastic SE included. For the first time, to the best of our knowledge, we find a chaotic regime solely created from noise-induced chaos, when SE is removed from the simulation that the region is entirely comprised of high-order pulsations of periodicity P-2 and greater. The conditions to observe this noise-induced chaos regime is when the injection level is quite high, close to 50% of the slave laser power. The noise-induced chaos regime is entirely separate from the chaotic regime caused by the usual period-doubling route to chaos that remains even when the SE is set to zero. In order to quantify how much SE is needed for noise-induced chaos to exist, we use a value for the SE coupling coefficient into the lasing mode to be 1 × 10
−4; this value would be at the lower end of the observed values for this parameter [
16]. We run our simulations with hypothetical lower values of SE coupling coefficient and that for values < 1 × 10
−7 that noise-induced chaos still exists.
2. Materials and Methods
To conduct this study, we employ the field version of the rate equations for semiconductor lasers. The fundamental derivation of the model is given in [
3], though we keep with the complex-valued envelope of the optical field to avoid numerical instability issues when the slave power tends briefly to zero, as can happen with external injection. We implemented the field version of the rate equations before in relation to laser gain-switching [
17]; here, we just concentrate on DC biasing of the lasers.
where all of the symbols have their usual meaning and are defined in
Table 1. The carrier density is given by
and
is the envelope of the optical field and is related to the photon density in the laser. The first term on the right-hand side of (1) is given by the electric bias current flowing into the laser, where
= 60 mA throughout for this study. Carrier recombination is given by
for nonradiative, bimolecular and Auger recombination, respectively; the third term represents stimulated emission.
is a complex-valued quantity describing the envelope of the optical field and encompasses all amplitude and phase modulation effects imposed by the injected-laser system;
is normalised such that
represents the photon density of the laser field.
denotes stochastic carrier recombination (which will be defined later). The first term on the right-hand side of (2) describes the complex gain of the laser field. The gain coefficient is given by
, where
is the differential gain and
is the carrier density at transparency. The gain coefficient is modified by the nonlinear gain
.
is the cavity lifetime. Note that lumping the photon lifetime with the gain-phase coupling allows for the slave laser to be centred at the zero frequency within the simulation; this is beneficial so that master–slave detuning can be easily controlled via the
frequency-translation operation term for the external injection.
is the envelope of the optical field of the master laser; in this paper, we take a constant amplitude (noiseless) for each simulation run. The final term,
, is the random addition of SE due to bimolecular recombination into the lasing field, denoting spontaneous emission into the lasing field.
The stochastic terms are appropriately scaled for numerical computations (1) and (2) with
, where
is the step time. We solve the system of equations using Huen’s predictor–corrector method.
Each term is an independent identically distributed random sample taken from a Gaussian random number generator with unity variance. The current is held constant; the only sweeping parameters that we consider is the power of the master laser and the master–slave detuning. We define the detuning . When solving the equations, we are adjusting directly in (2) and the spectrum is always centred for the slave; however, centring the spectrum for the master laser makes it easier to unequivocally show the injection-locking. To centre the spectrum for the master, one needs to take the complex-conjugate of the array (calculated when constructing the injection term in (4)) and multiply by the output from solving the differential equations to frequency translate to be centred at the master laser.
Converting from photon density to optical power
is given by
where
is the speed of light in a vacuum,
is the group index,
is Planck’s constant, and
is the area of the laser mode. One can interpret the spectral scan as essentially tuning the slave laser into the master laser and noting the spectrum. Practically, one would tune the slave laser using temperature control, taking advantage of the available ~0.1 nm/K (12 GHz/K at 1550 nm) thermal tuning of semiconductor lasers. In all of our simulations, we simulate at a 1 ps timestep, using an initial condition of
= 1 × 10
24 and
= 1 × 10
12. In order to lessen the strength and duration of the transient, we are simulating
by taking 110,000 sample points (unless otherwise stated), and the first 10,000 samples are discarded to remove any transient. The remaining 100,000 data points are used to calculate the spectrum using fast Fourier transforms (FFT). The number of data points and the sampling time allows us a resolution bandwidth of 10 MHz, and this is within the range of high-resolution optical spectral analysers. The spectrum we are calculating is the squared magnitude of the (complex valued) FFT array, and here we are circularly shifting by half of the number of samples in the FFT array such that the spectrum is centred at the zero frequency. In order to minimise randomness within the spectra, we perform the following: for each set of parameters the simulation is run twenty times and the spectrum is averaged over those twenty runs. This averages the noise to the average spectral power within each frequency bin in the FFT array.
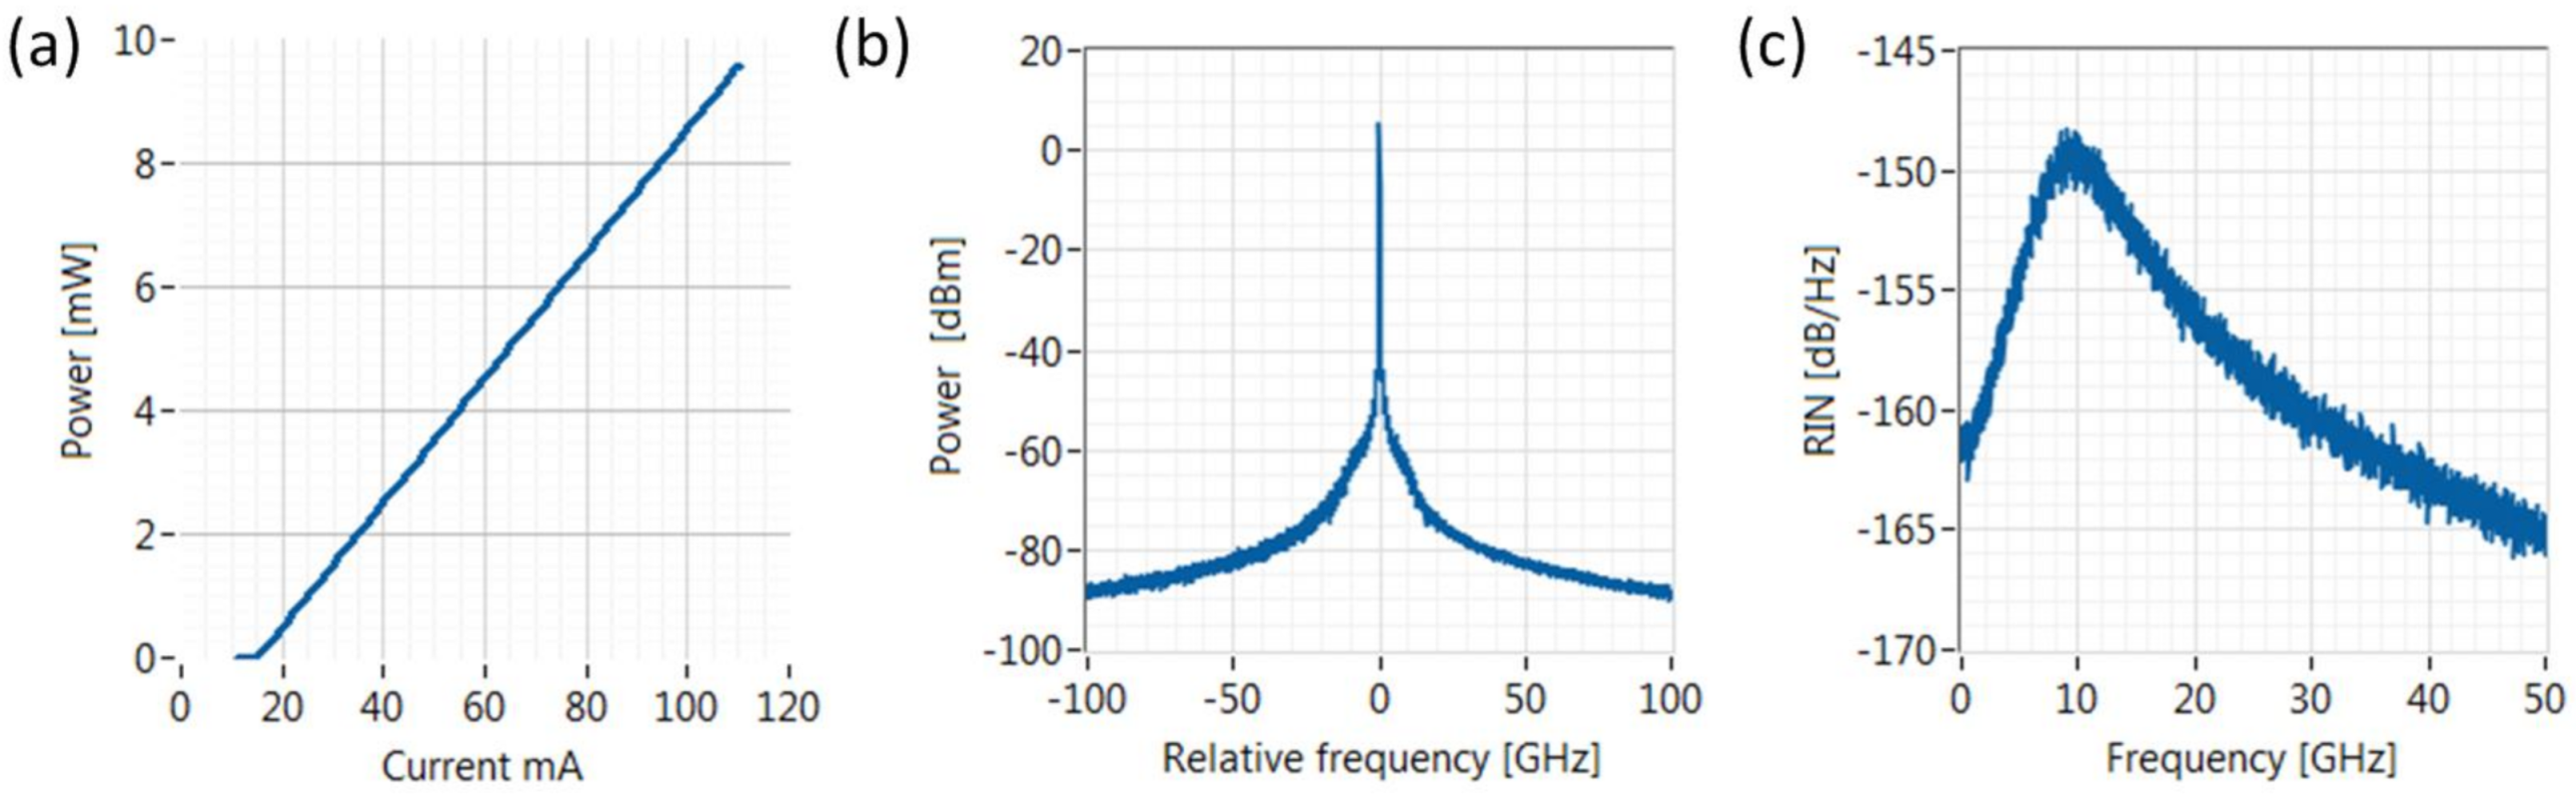
Preliminary simulations showing the standard laser power of the slave, without external injection, versus bias current are shown in
Figure 2a; the threshold current is about 15 mA. The optical spectrum of the slave is shown in
Figure 2b with a linewidth of 2 MHz. The relative intensity noise is show in
Figure 2c; the noise at low frequencies is −165 dB/Hz and the relaxation oscillation frequency (ROF) occurs at 9.4 GHz.
3. High-Resolution Spectral Scans Due to External-Injection
We show the detailed scans of the output spectra as the slave laser is tuned across the master laser, as was performed experimentally in [
18] (Figure 4). To build up the scans, we simulate the averaged spectrum for a given set of laser parameters; then, we adjust one of the parameters (here, we adjust the detuning) and then stack all the calculated spectra and display the spectra as a 3D colour map. Even though our calculated spectra run from −500 GHz to 500 GHz, we only show the spectra running from −100 GHz to 100 GHz for clarity because the most interesting features of the spectra are located within ±100 GHz of the master laser. We plot the spectral scan with the injected power of the master taken to be constant within each scan. The spectral maps are shown in
Figure 3 and
Figure 4. Different regimes are identified in
Figure 3 and
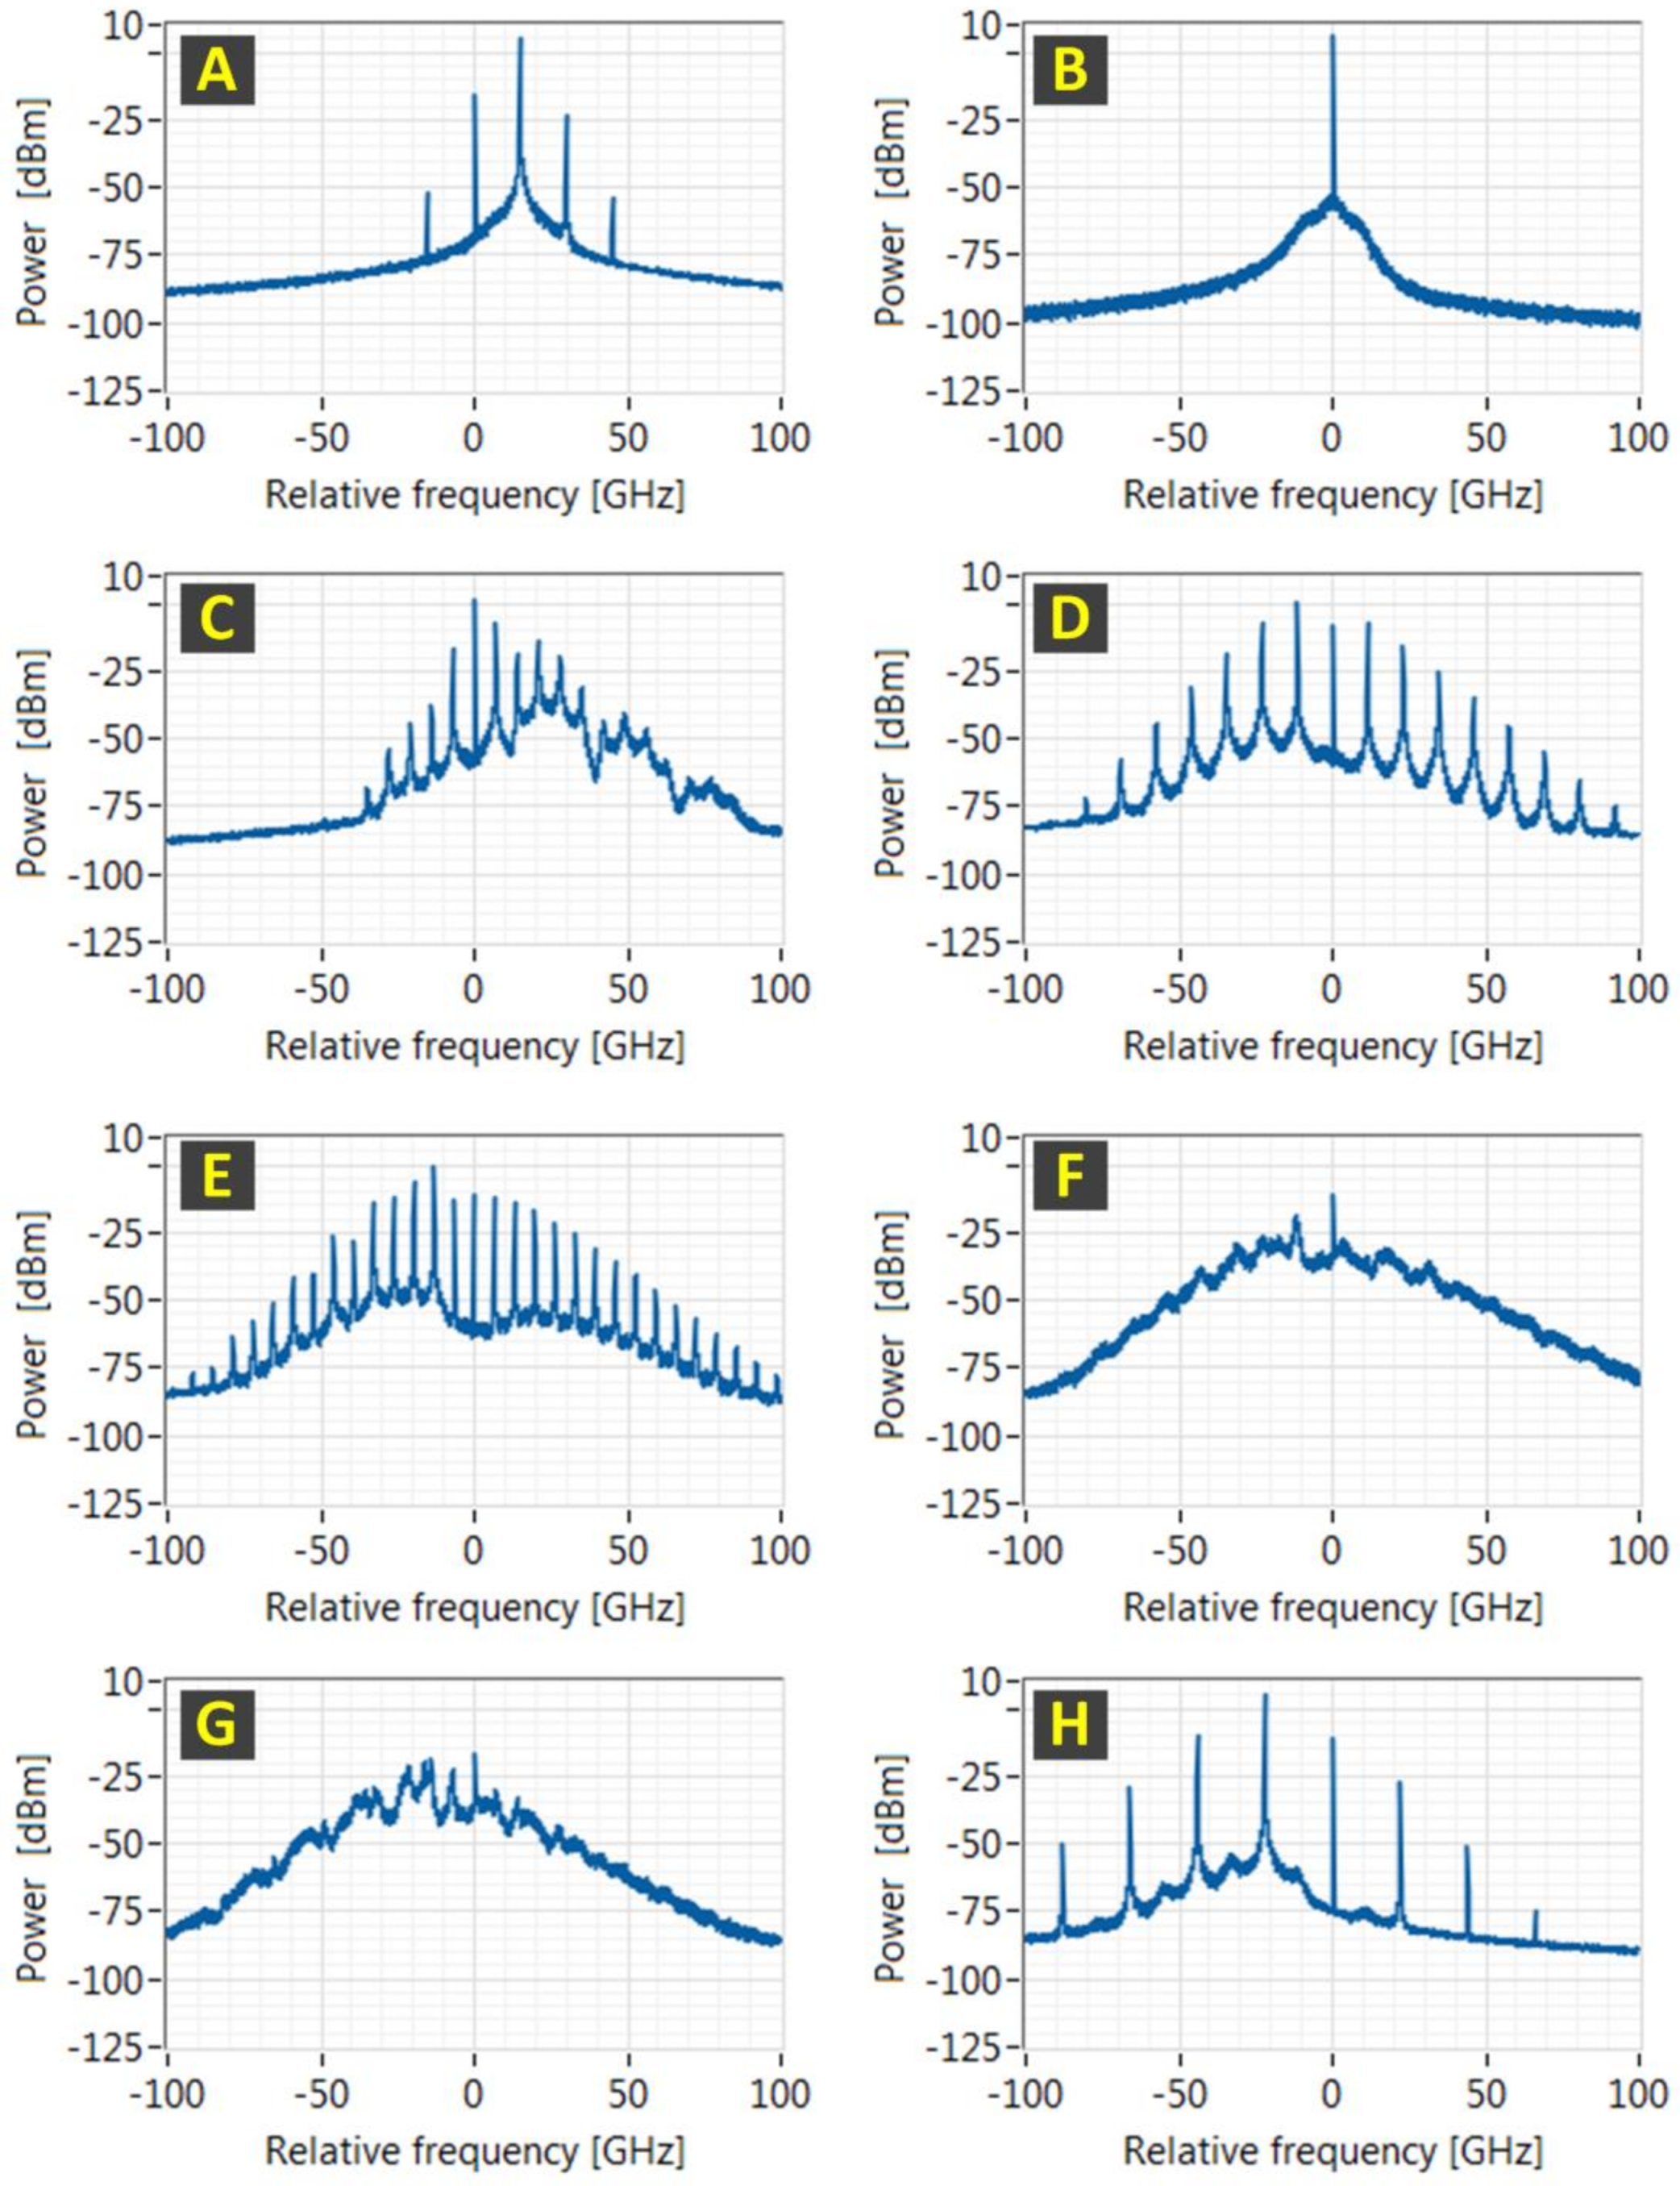
Figure 4 by letters A–H; individual spectra corresponding to the of the different regimes are shown in
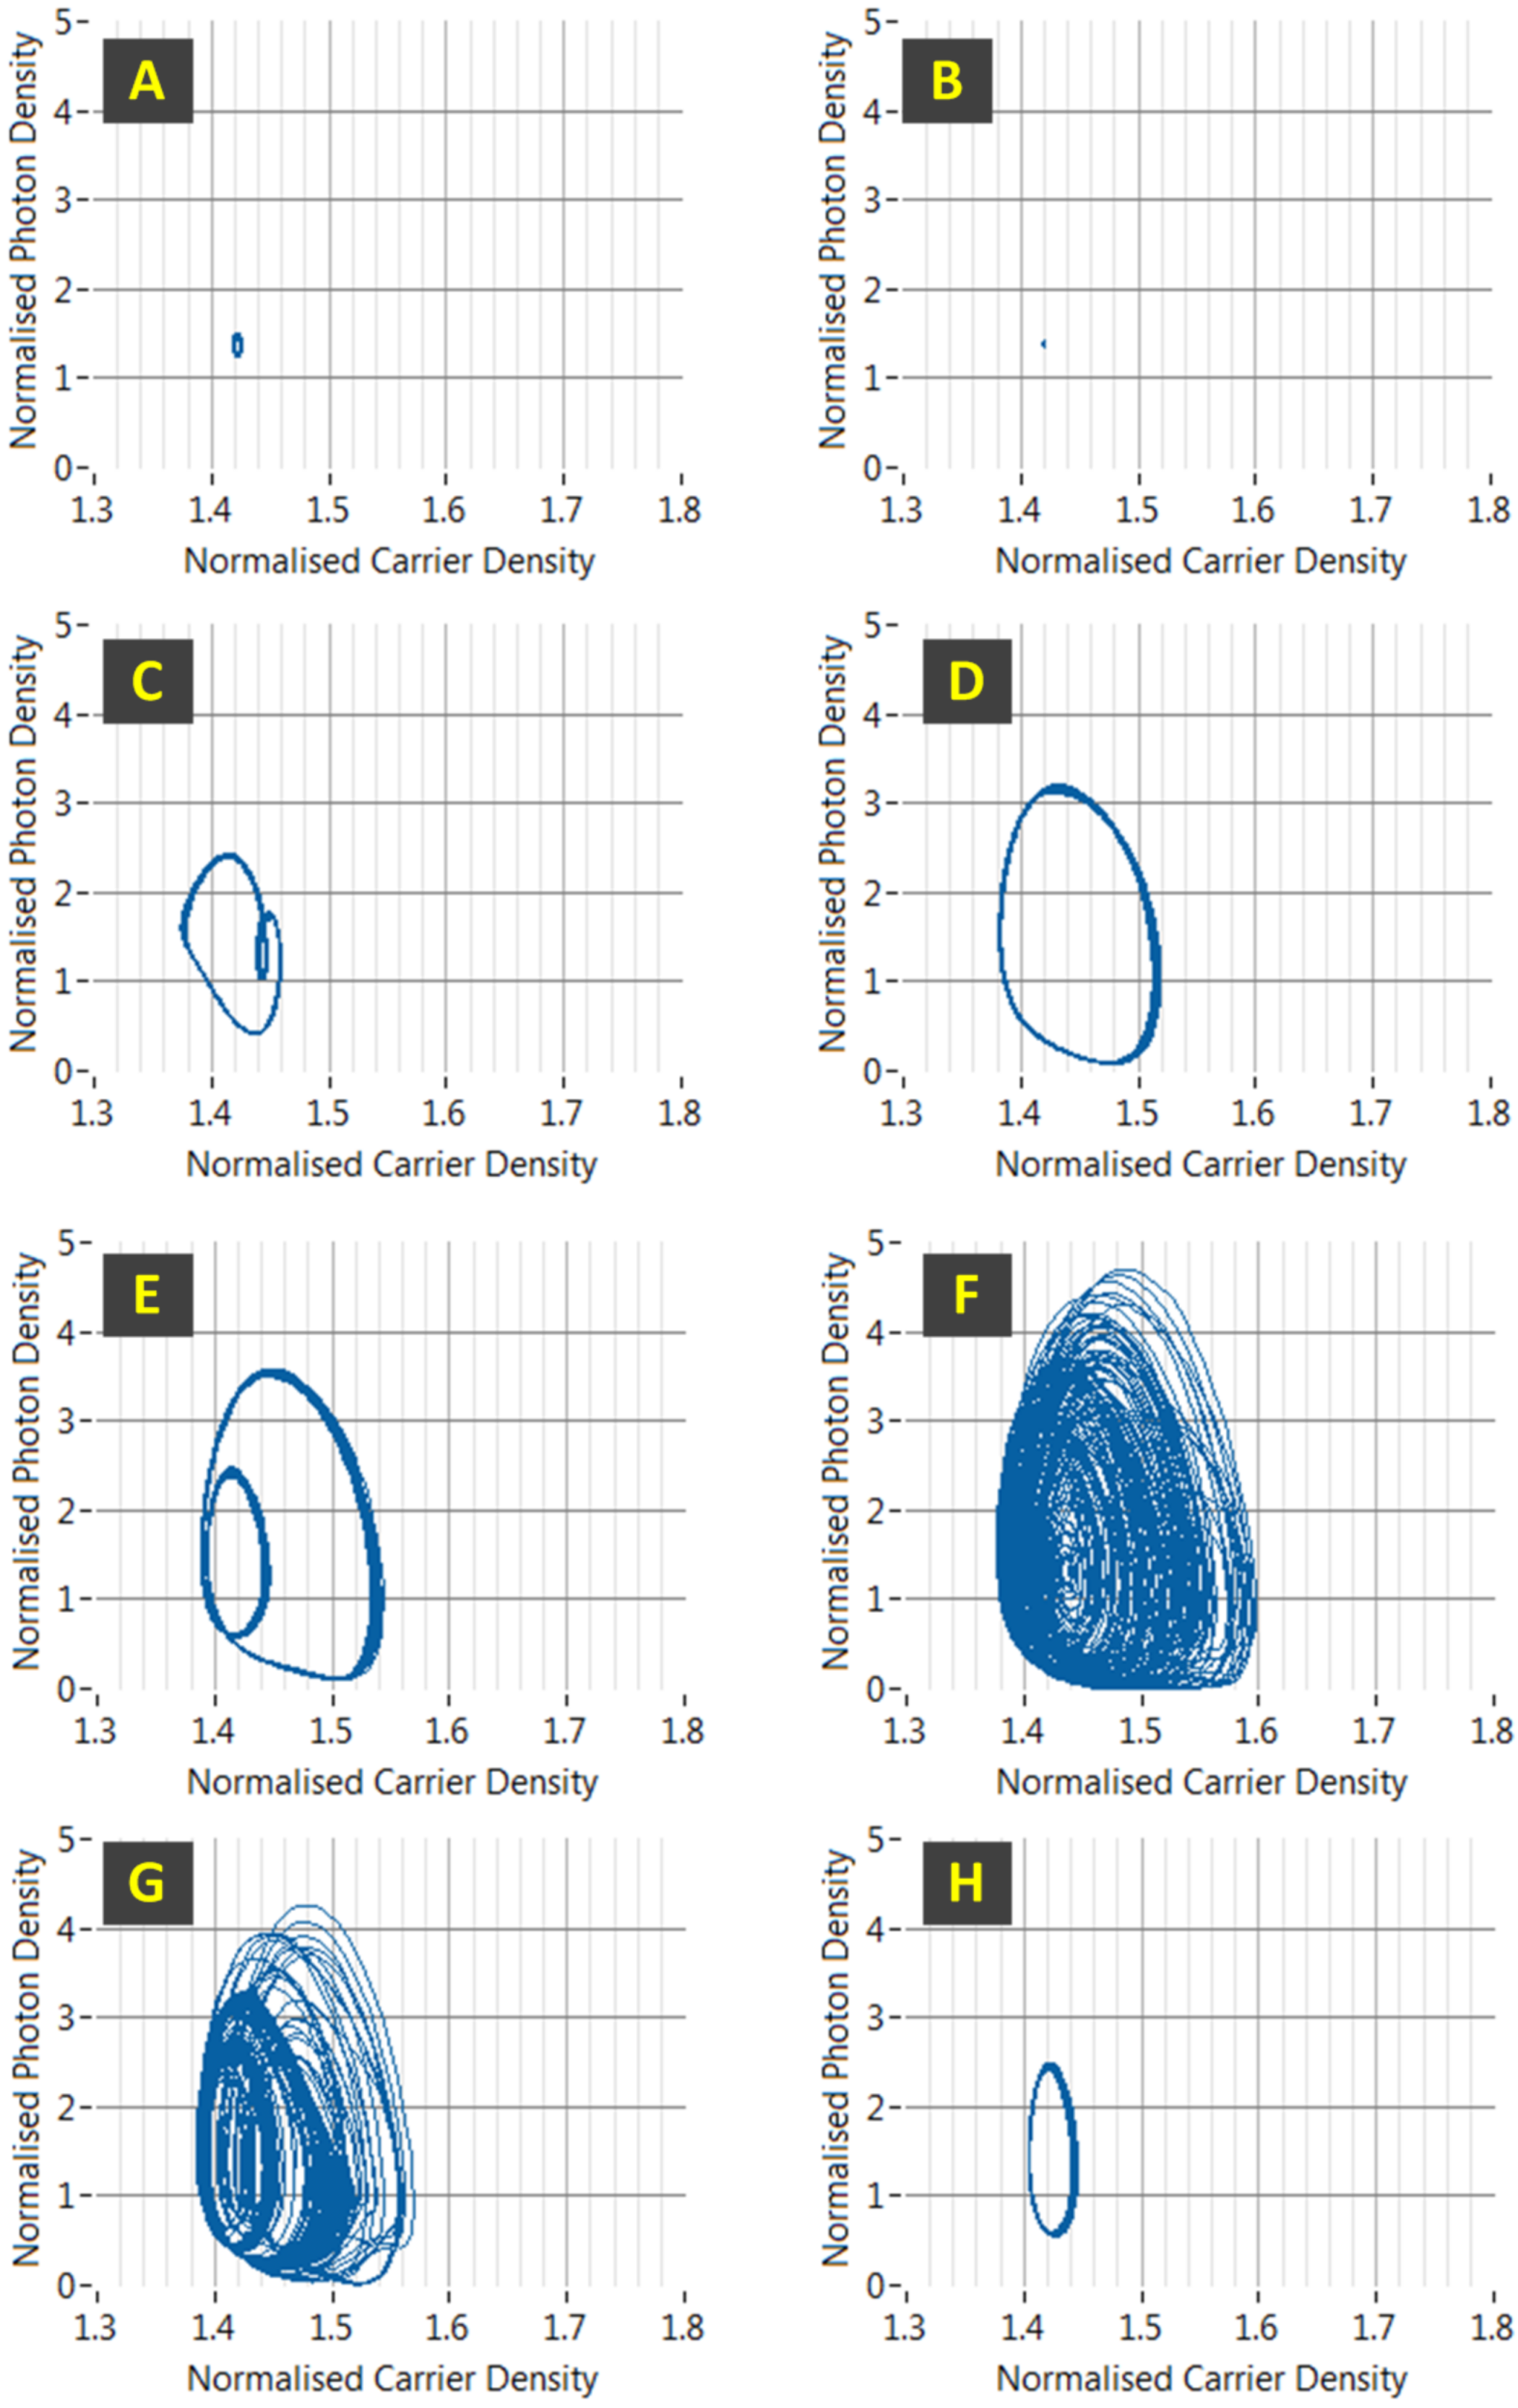
Figure 5. Trajectories of the photon density and normalised carrier density (N–P trajectories) for the same points A–H are shown in
Figure 6.
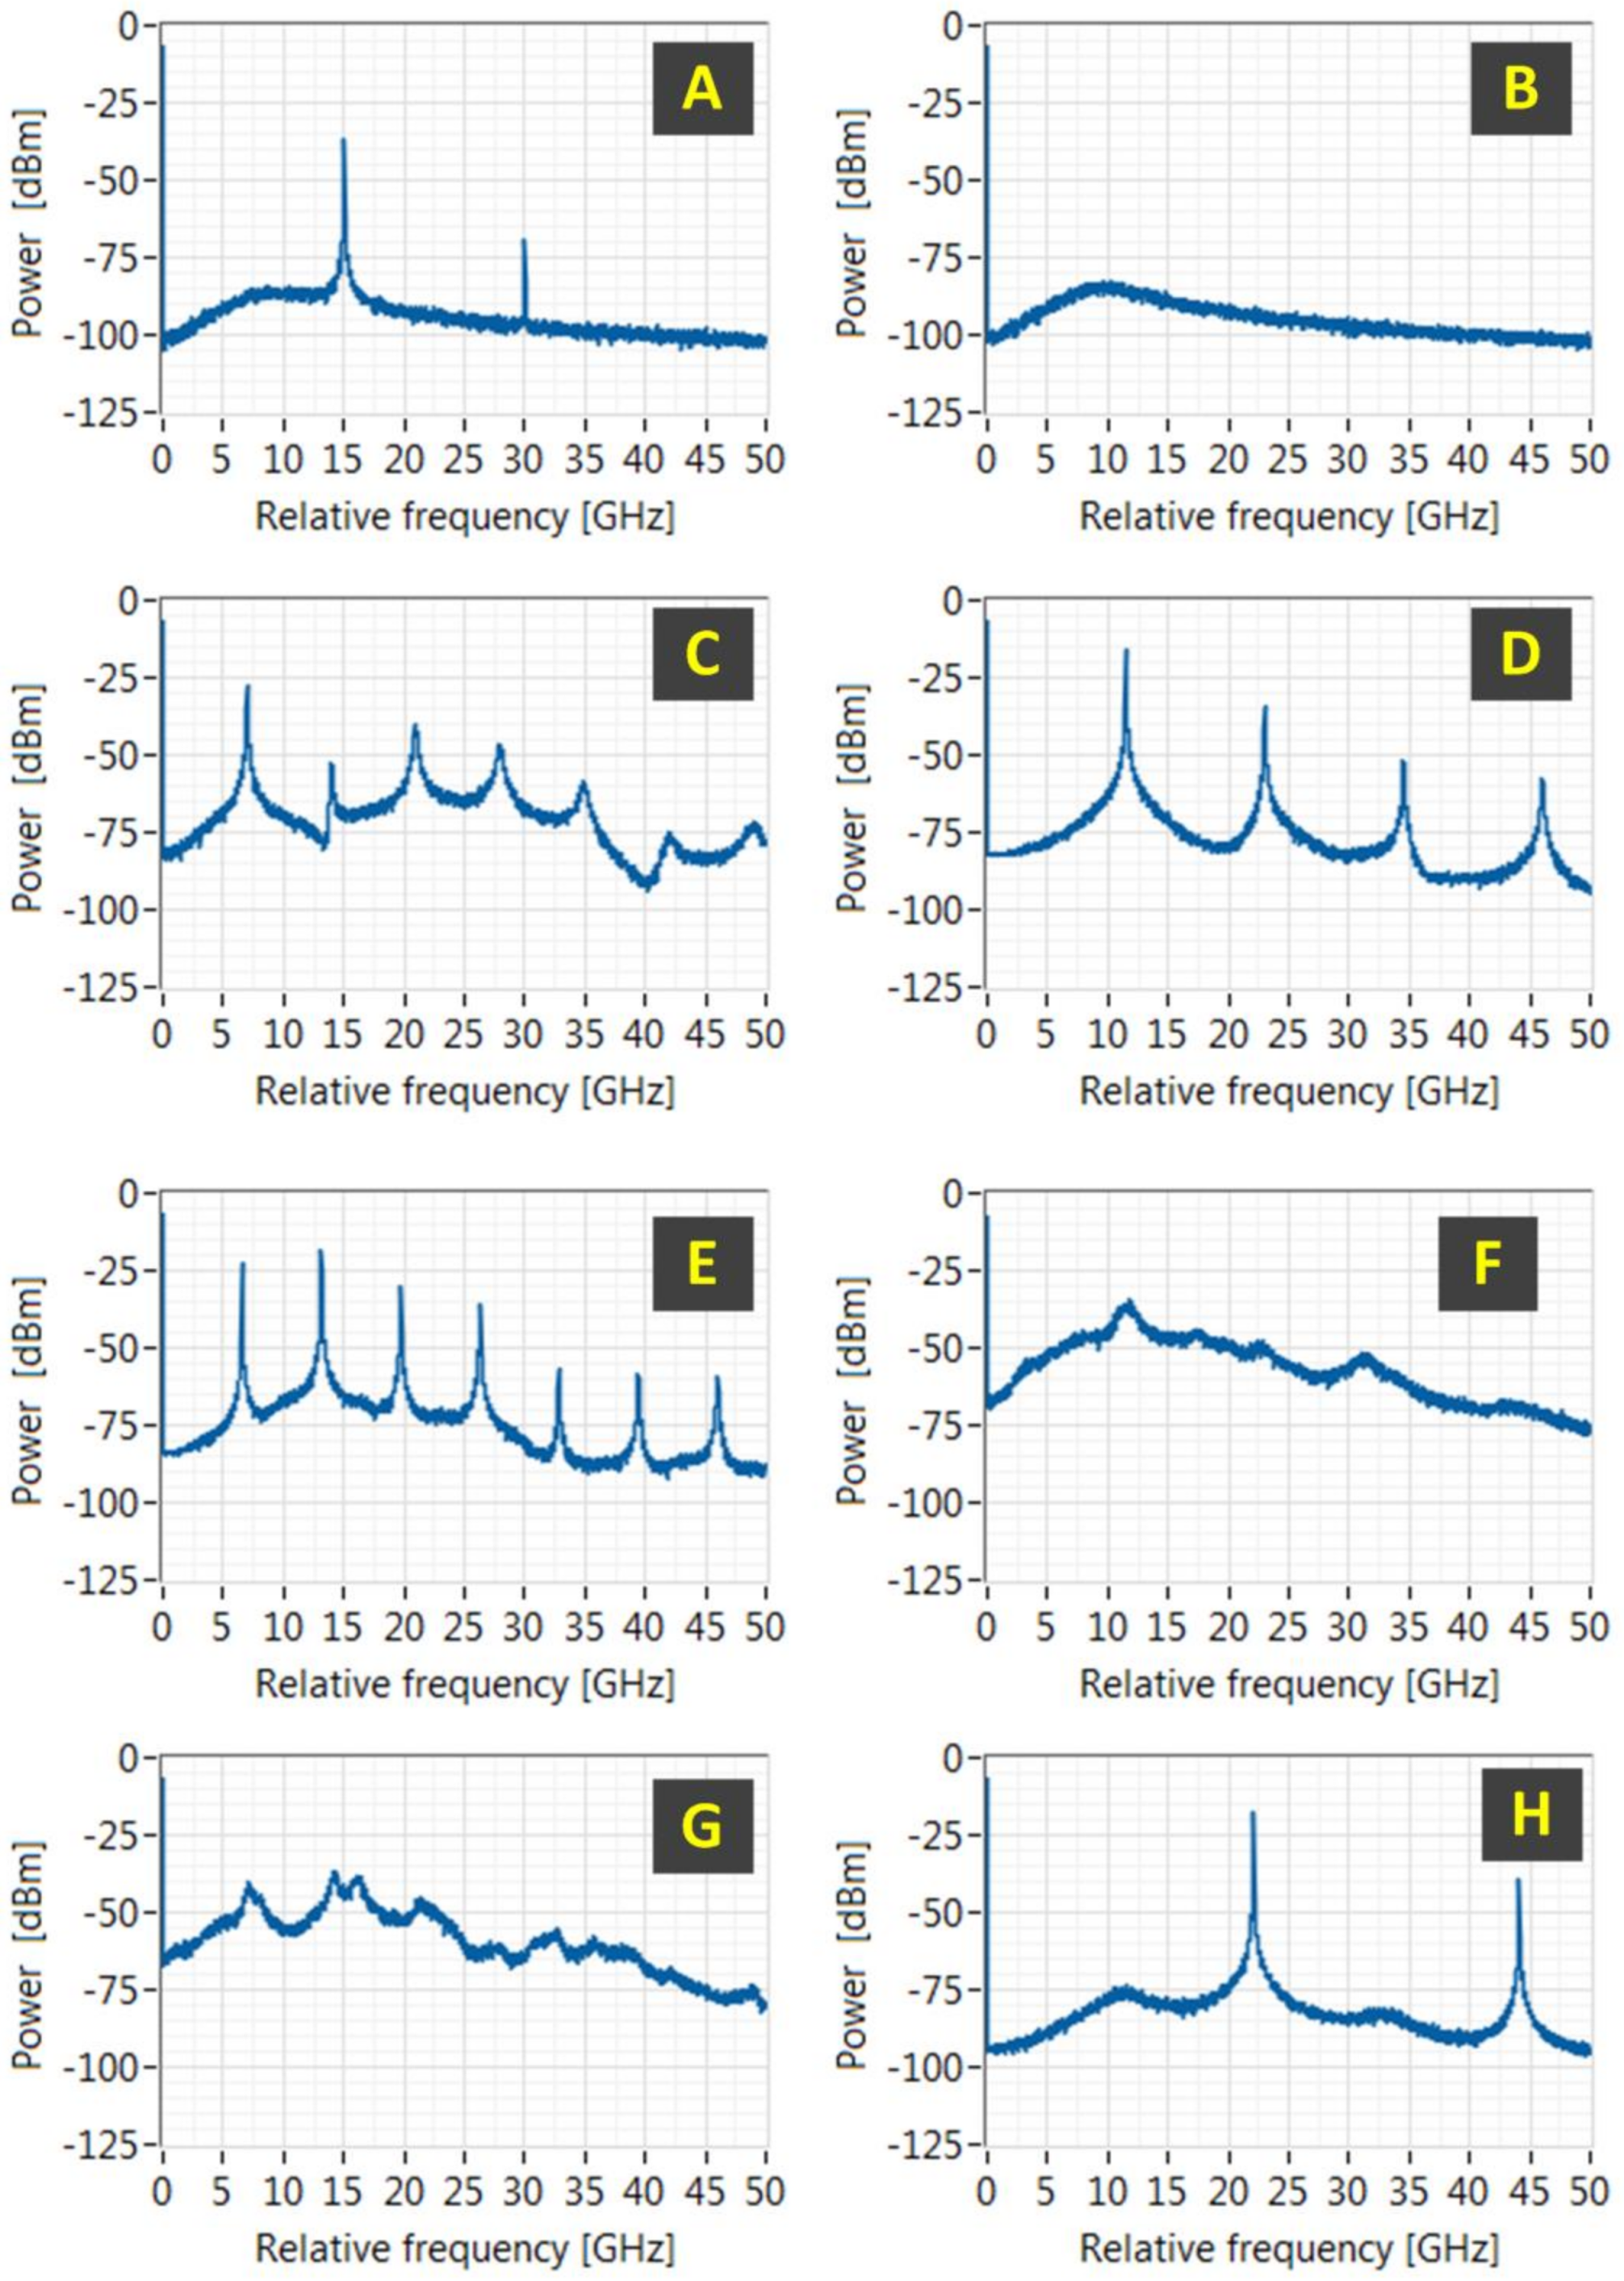
Figure 7 presents the calculated RF spectrum after photodetection of the laser output for the different regimes A–H. We will explain the dynamics in more detail later; first, we qualitatively describe the regions labelled A–H in
Figure 3 and
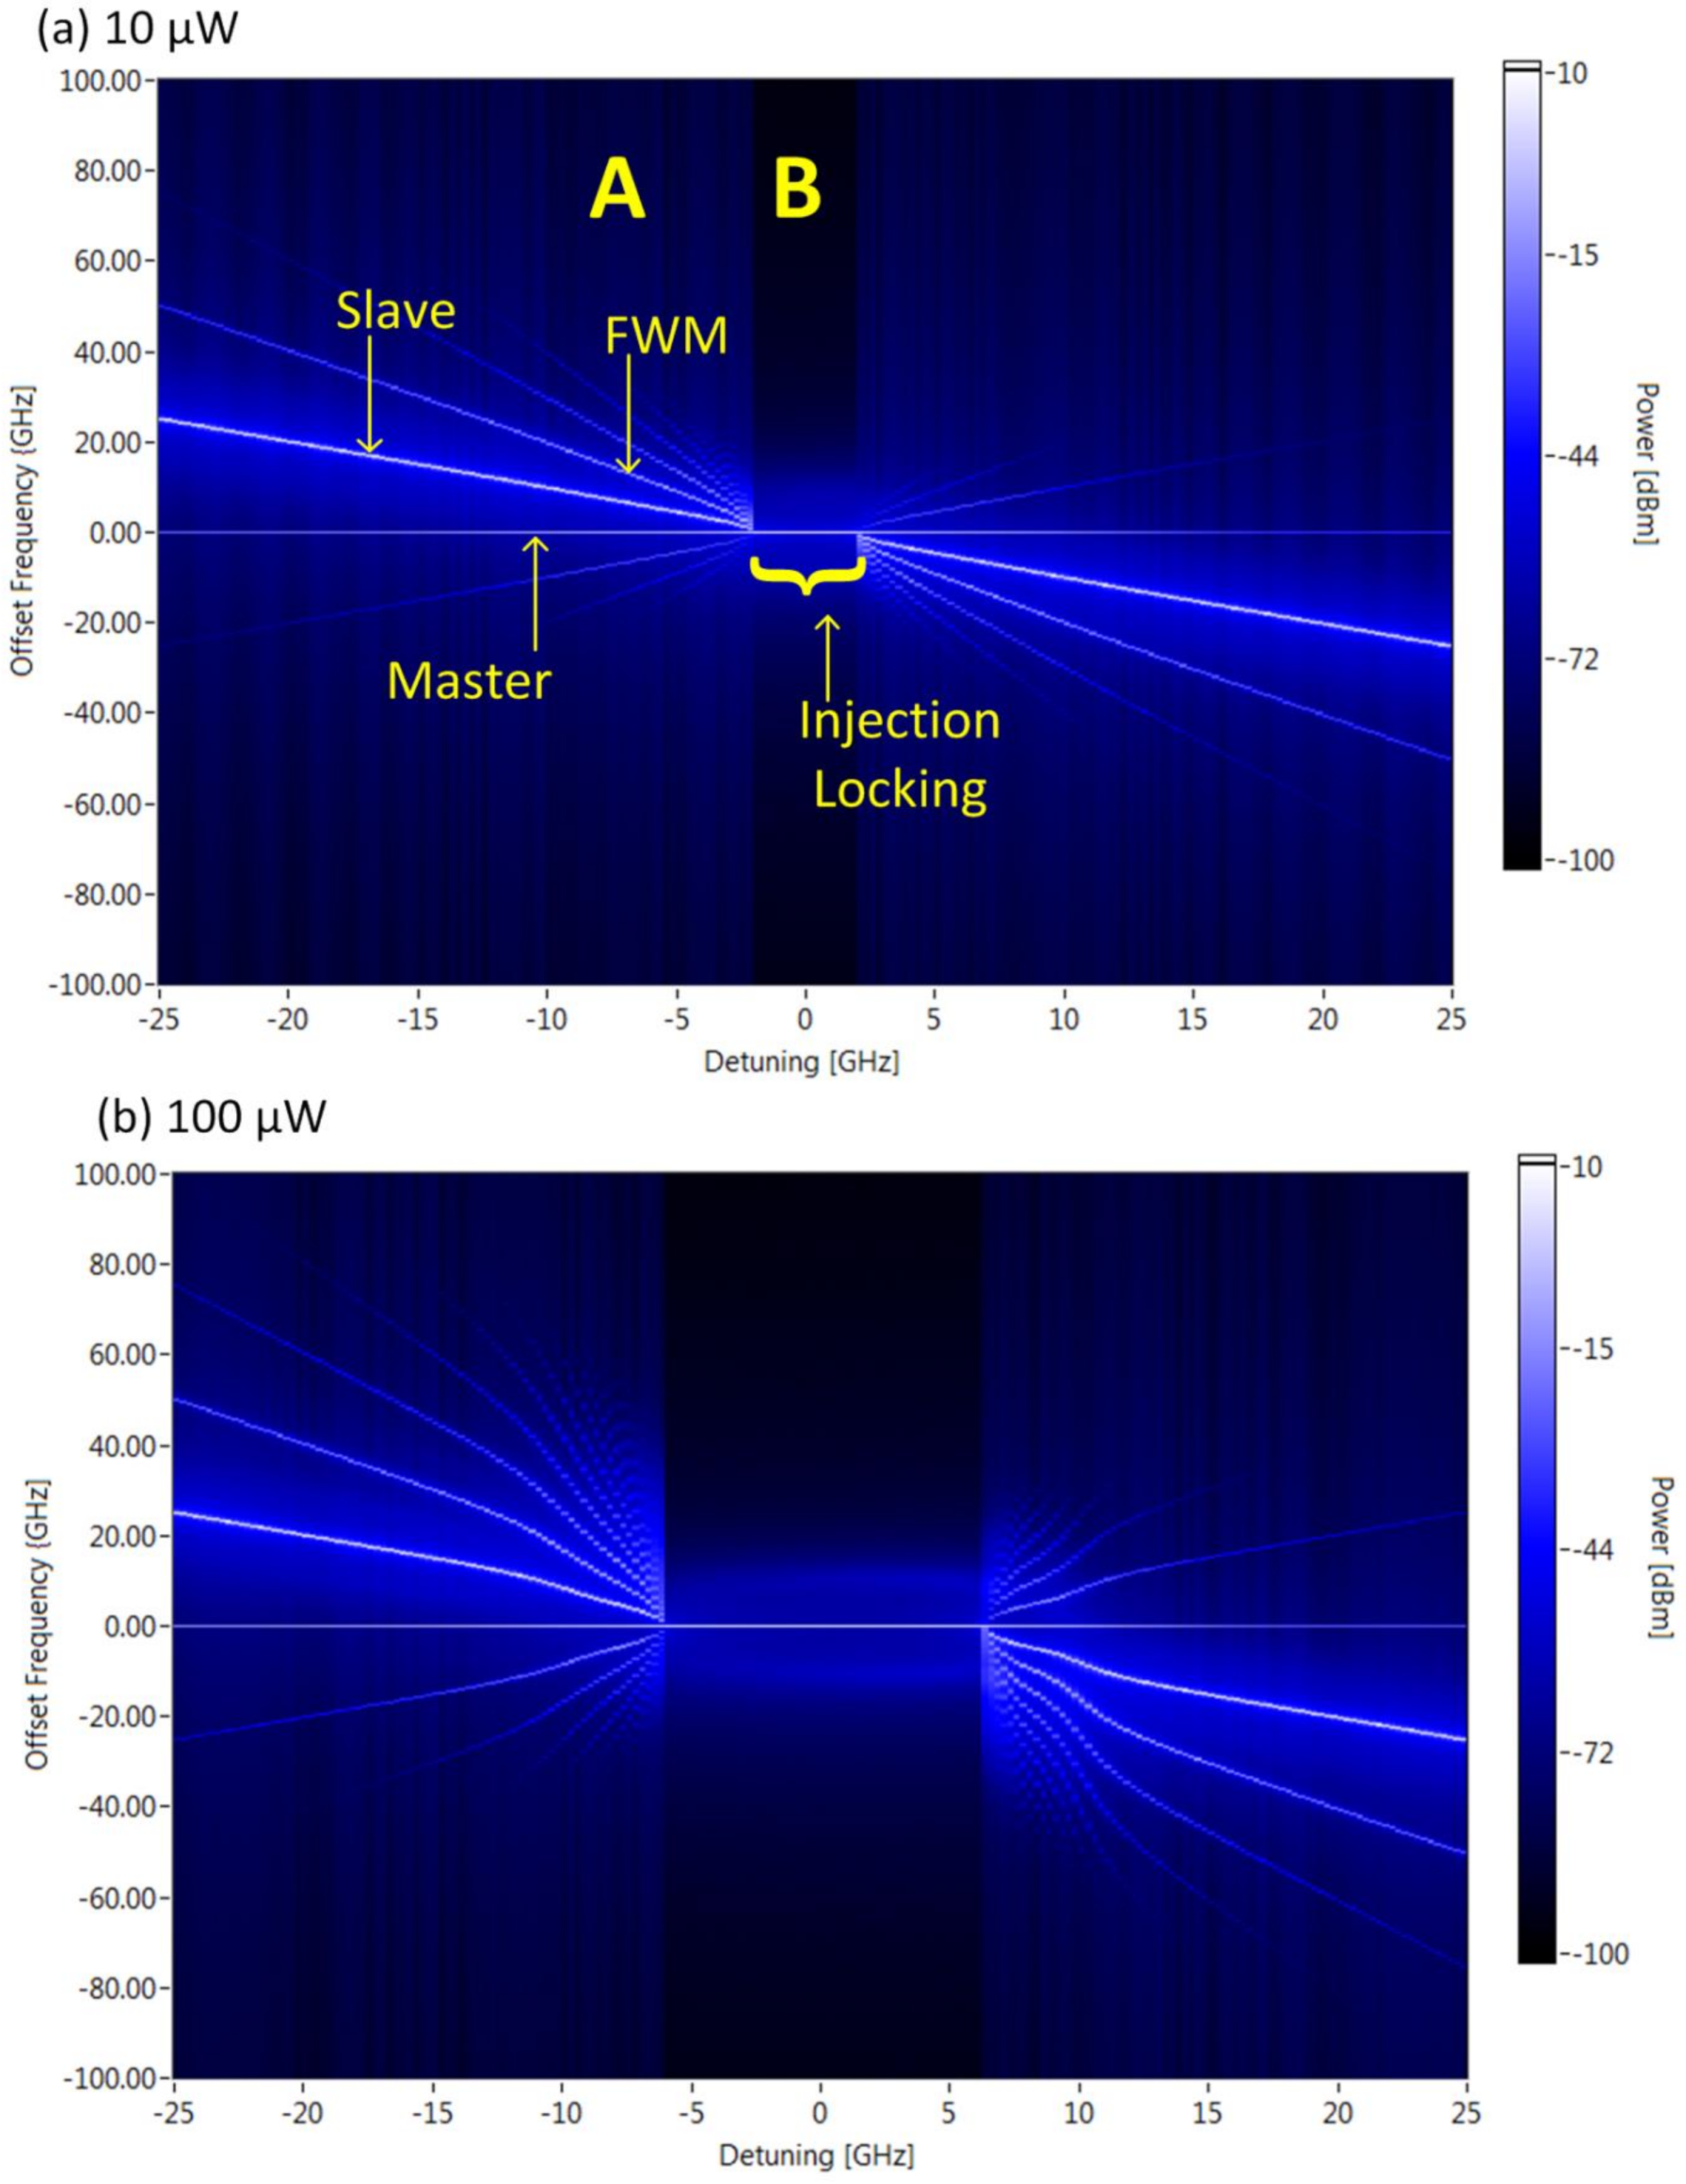
Figure 4. In
Figure 3a, the injection power is 10 µW, and we can clearly see that there is a short locking range from about −3 GHz to 3 GHz, when the output of the slave laser is locked to the master laser; when locking has not been achieved, obvious four wave mixing (FWM) products appear in the spectrum. Note that all of the spectra shown in this section are qualitatively similar to the experimentally taken spectra of external injection dynamics in [
11].
Case A: FWM. Region A corresponds to FWM between the master and slave, and the master and slave are clearly not locked; the beating between both lasers modulates the slave laser to create additional frequency products in the spectrum, each spaced by
fd about the slave laser. This is clearly shown in the optical spectrum in
Figure 3a. The N–P trajectory in
Figure 6A for FWM shows a slight modulation of the carrier density (as expected), and the RF spectrum in
Figure 7A shows a few peaks each spaced by
fd.
Case B: Injection-locking. When the detuning between the two lasers is reduced, the magnitude of the varying carrier density increases and becomes sufficient to synchronise the slave laser to the master laser. The lasing frequency of the slave also reduces because the carrier density for threshold of the injected laser system is smaller than that for the solitary free-running laser system. Injection-locking has been extensively studied previously [
1,
2,
3,
4,
5,
6,
7,
8,
9,
10,
11,
12,
13] and we shall only briefly describe the results. The N–P trajectories (
Figure 6B) indicate a single point for the injection-locked case and negligible modulation of the photon and carrier densities. We can deduce the carrier density at threshold of
1.42 × 10
24 m
−3 (injection power of 10 µW), which is lower than the carrier density at threshold for the solitary slave laser of 1.422 × 10
24 m
−3. When
exceeds (goes below) the threshold, the slave becomes amplifying (attenuating). The optical spectrum shows a single lasing mode, and the absence of strong mixing tones in the RF spectrum (
Figure 7) indicates that the system is locked.
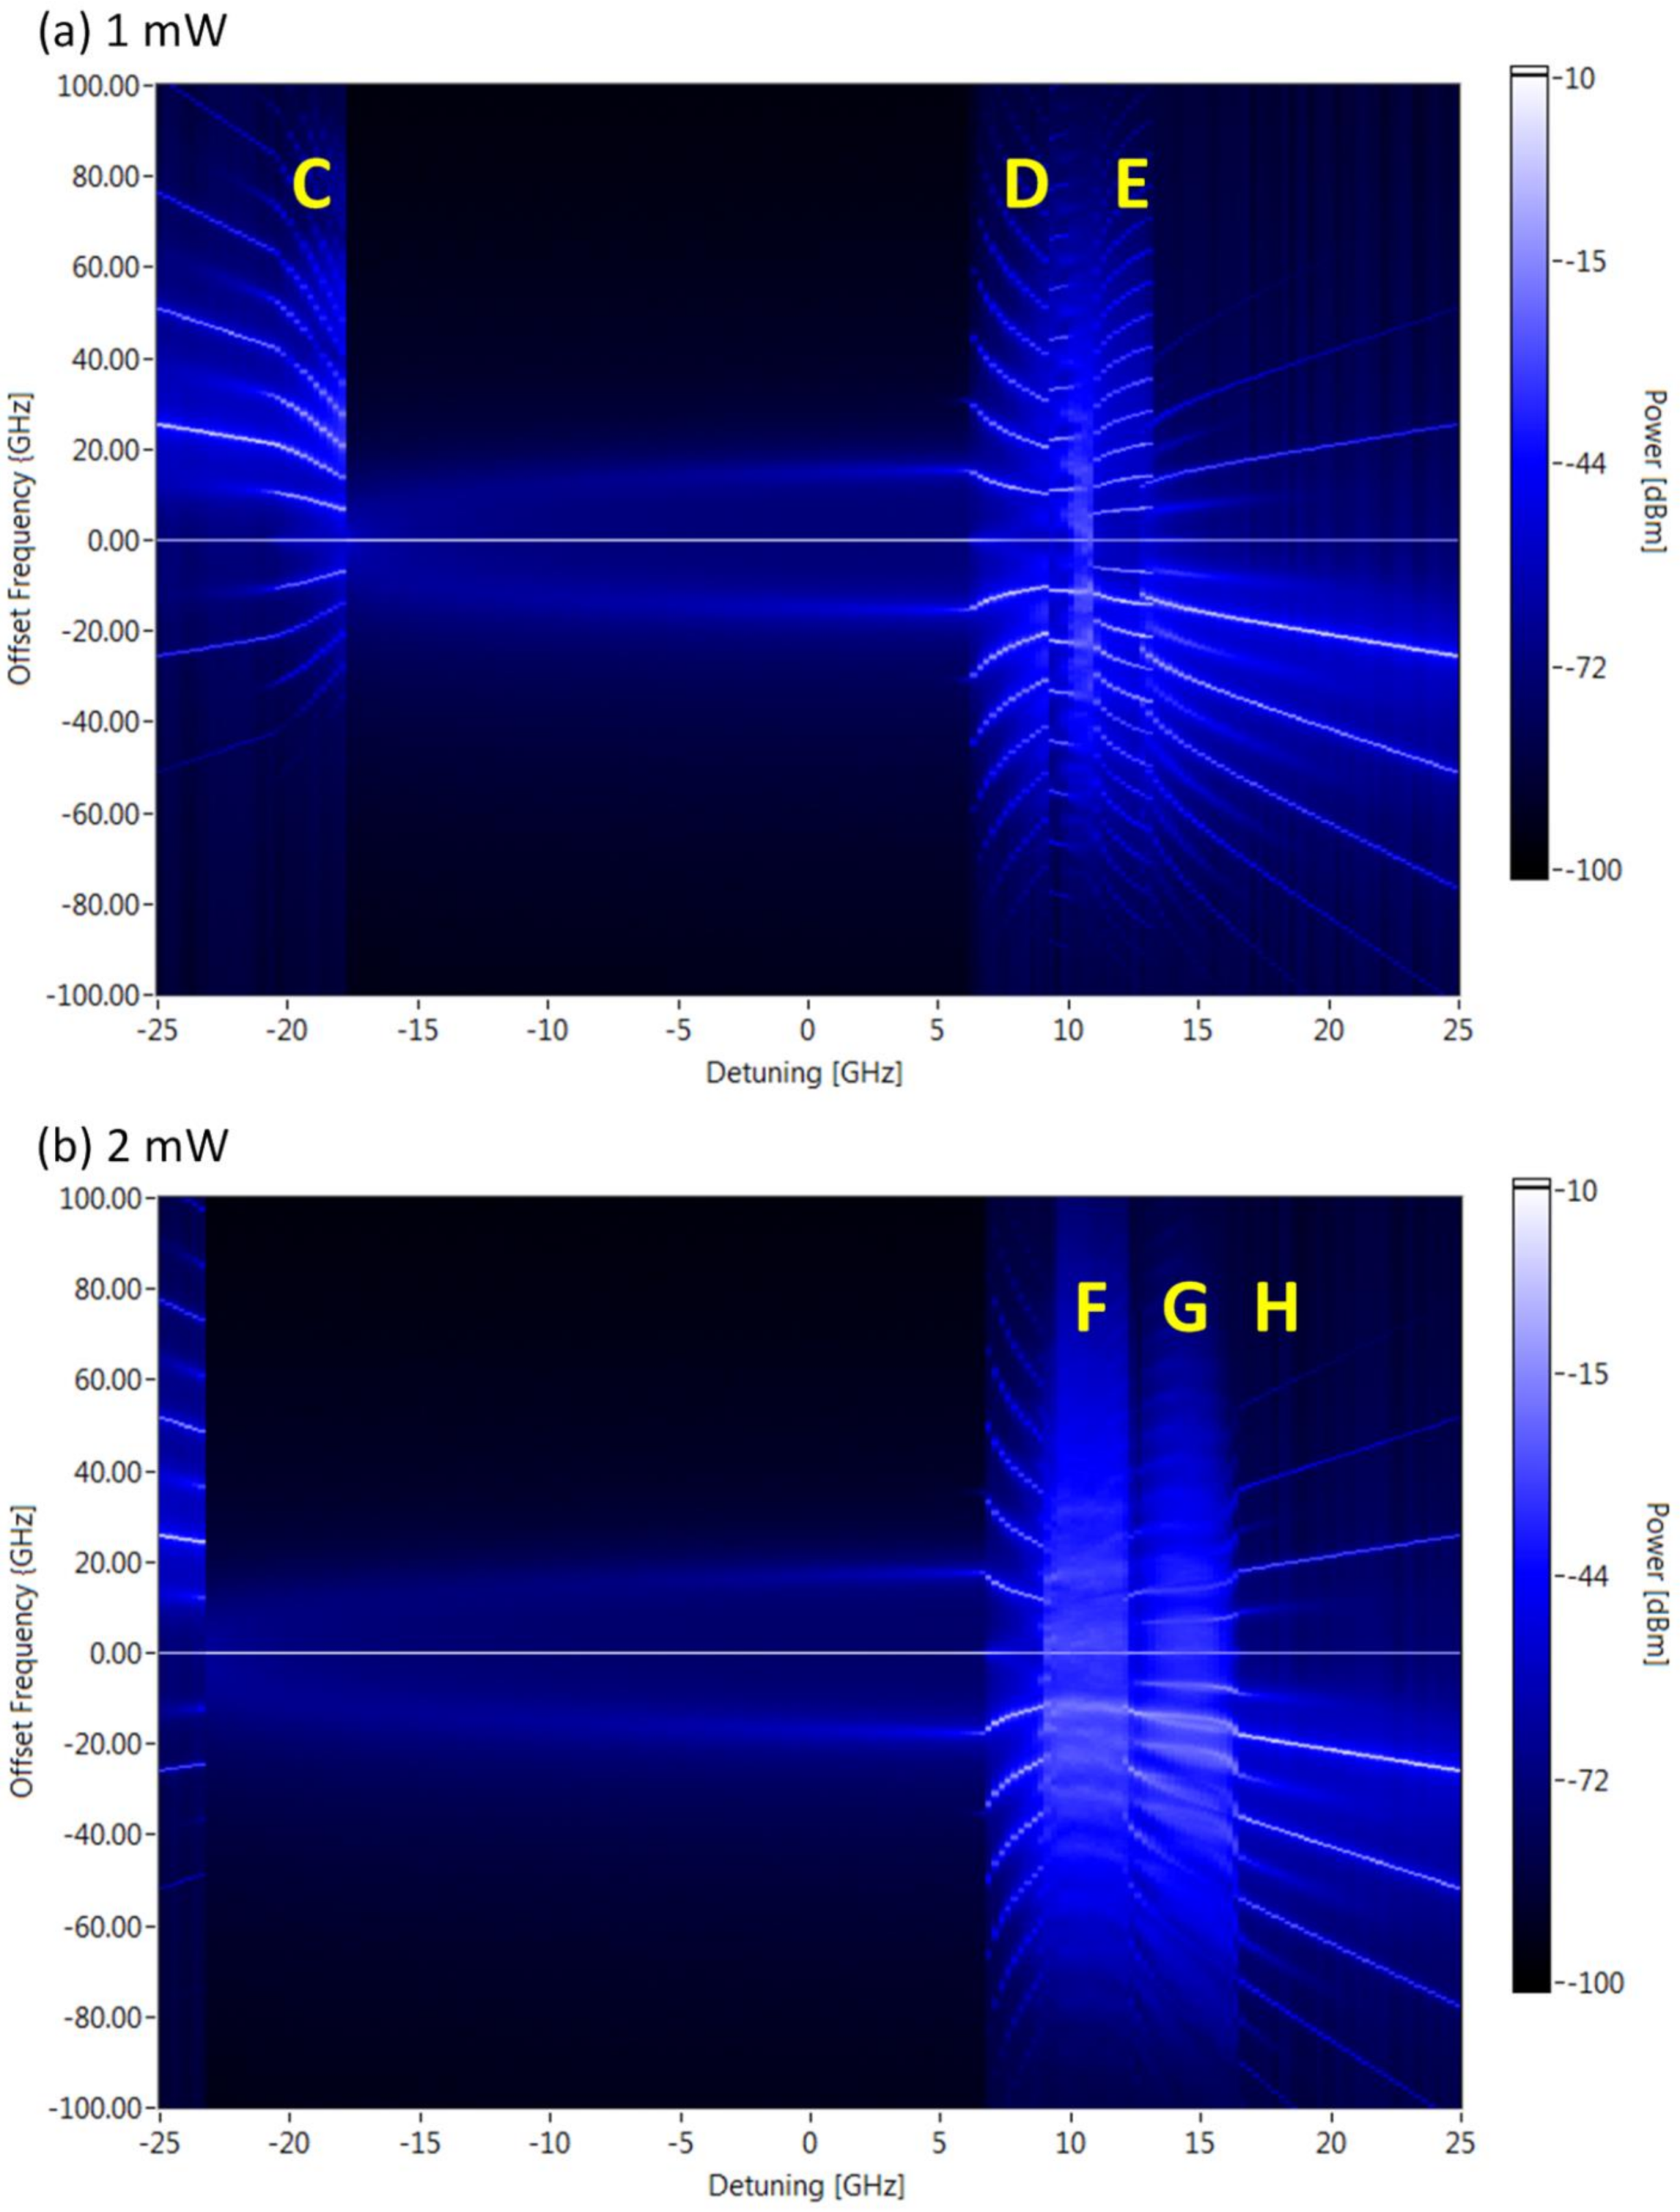
Increasing the injection power exacerbates the modulation of the photon and carrier densities; therefore, we expect more complex and interesting behaviour. As the injection power is increased, the locking range is increased, as is the case in
Figure 3b. We notice, here, that for detuning values close to the locking range, the slave is pulled more strongly towards the master. The next dynamical feature that appears is FWM-induced period-doubling.
Case C: FWM-induced period-doubling. This feature appears when the FWM goes into a period-doubling type oscillation for detuning close to the locking range before injection-locking occurs. In this example, there is detuning of about −18 GHz (
Figure 4a and it is also observed in [
18] (
Figure 4). The cause of this behaviour is that the RO frequency of the slave is midway between the master and slave detuning; hence, the pulsation arising from the FWM exacerbates period-doubling oscillation. As the detuning is increased, the slave laser emerges into a FWM regime without the laser going into self-pulsation.
Case D: Self-pulsation. As the master power is increased further, regions of self-pulsation appear, as shown at point D in
Figure 4a. This happens because the system becomes unstable as the damping can no longer suppress random fluctuations in the photon density; hence, optical pulsations grow. One can clearly see that the spectral lines of the self-pulsation coincide with the ROF. The laser system cannot support continuously growing oscillation and the oscillating pulses deplete the carrier density and the pulses thus decay, thereby keeping the self-pulsation stable. The process keeps repeating because the carrier density builds up in the absence of photons, and once the pulse builds up, this depletes the carrier density. In
Figure 6D, by looking at the N–P trajectory, one can see a large swing in the carrier density in addition to a large swing in the photon density.
Case E: Period-doubling. When the photon and carrier densities require two oscillation periods to revert to the same position, extra spectral lines, which are spaced at half the distance for the case of self-pulsation spectral lines, also appear in the spectrum in region E in
Figure 4a and within the optical and RF spectra in
Figure 5E and
Figure 7E, respectively. In the trajectory in
Figure 6E, a small loop appears, indicating a pattern of consecutive larger and smaller pulses in the pulse train. One interesting aspect to note that is indicated by the simulations is that there is an obvious narrowing of the spectral lines for period-doubling (
Figure 5E compared to the spectral lines self-pulsation case (
Figure 5D). This can be explained by looking at their N–P traces in
Figure 6E,D, respectively. One can clearly see that the photon density tends towards zero in both scenarios; large phase changes occur when the value of the laser field is small compared to the SE [
19]. For the self-pulsation case, the photon density goes to zero once per pulsation cycle; however, for the period-doubling case, the photon density goes to zero once at half the rate for self-pulsation. This explains why the spectral line broadening is smaller for period-doubling compared to self-pulsation
Case F: Chaos. Chaos has been studied in detail before [
6,
7], so we will just briefly describe the effect here. The main characteristic of chaos is the broad continuous spectrum; this is clearly seen in
Figure 4b and
Figure 5F. As the injection power is increased to 2 mW, then it is possible for the pulsations to become completely chaotic, as there is no way to regularise the photon density in the cavity at the instant the carrier density reaches above the threshold. Looking at the detuning range at which chaotic behaviour is observed in
Figure 4b (~10 GHz detuning), and noting the corresponding region in
Figure 4a when less injection power is used: in that detuning region (~10 GHz) in
Figure 4a, notice there is an abrupt change in the spectral line spacing when increasing the detuning in region D in
Figure 4a; it is within this region of abrupt pulsation frequency change that chaos occurs when the injection power is increased. It is interesting to note from the N–P trajectory of chaotic regime in
Figure 6F that there is no regular pulsation, as is the case for the trajectory for self-pulsation; however, in the coherence case, photon density can go towards zero, and the time taken to build up a lasing field again depends on the value of the photon density in the slave laser as the laser goes above the threshold. One curious aspect of chaos is that the optical spectrum is the same irrespective of whether or not SE is included in the simulation. We have described in previous work how regular pulse trains can have continuous optical spectra without any ‘comb’-like structure when there is no memory of the optical phase from pulse to pulse [
20]. We rule out any such phenomenon being the cause of the continuous spectrum for chaos by looking at the RF spectrum in
Figure 7F; there are clearly no distinct lines that would indicate pulsation with jitter [
21].
Case G: Noise-Induced Chaos Regime. This is the regime that we are identifying for the first time in this paper. It is clear in
Figure 5G that the laser system is going into a different pulsation regime to that of chaos in Case F (
Figure 5F). The extra peaks in the spectrum, similar to those of period-doubling, are visible, though the laser is still in a chaotic state. As we show in the following section, without SE, this region is comprised of a higher-order pulsation regime. Clearly, the N–P trajectory is chaotic (
Figure 6G); moreover, the chaotic trajectory looks to have the same form for period-doubling in
Figure 6E, though there is no regular trajectory path and it is clearly taking a chaotic trajectory.
Case H: Four-wave mixing. As the master–slave detuning is increased further, the lasers no longer pulsate because of the limited carrier density dynamics, and only FWM-products are created, which is similar to case A.
Now that we have described all of the operating regimes of the externally injected laser system, we concentrate on case G, the period-doubling regime, in more detail.
4. Influence of Spontaneous Emission
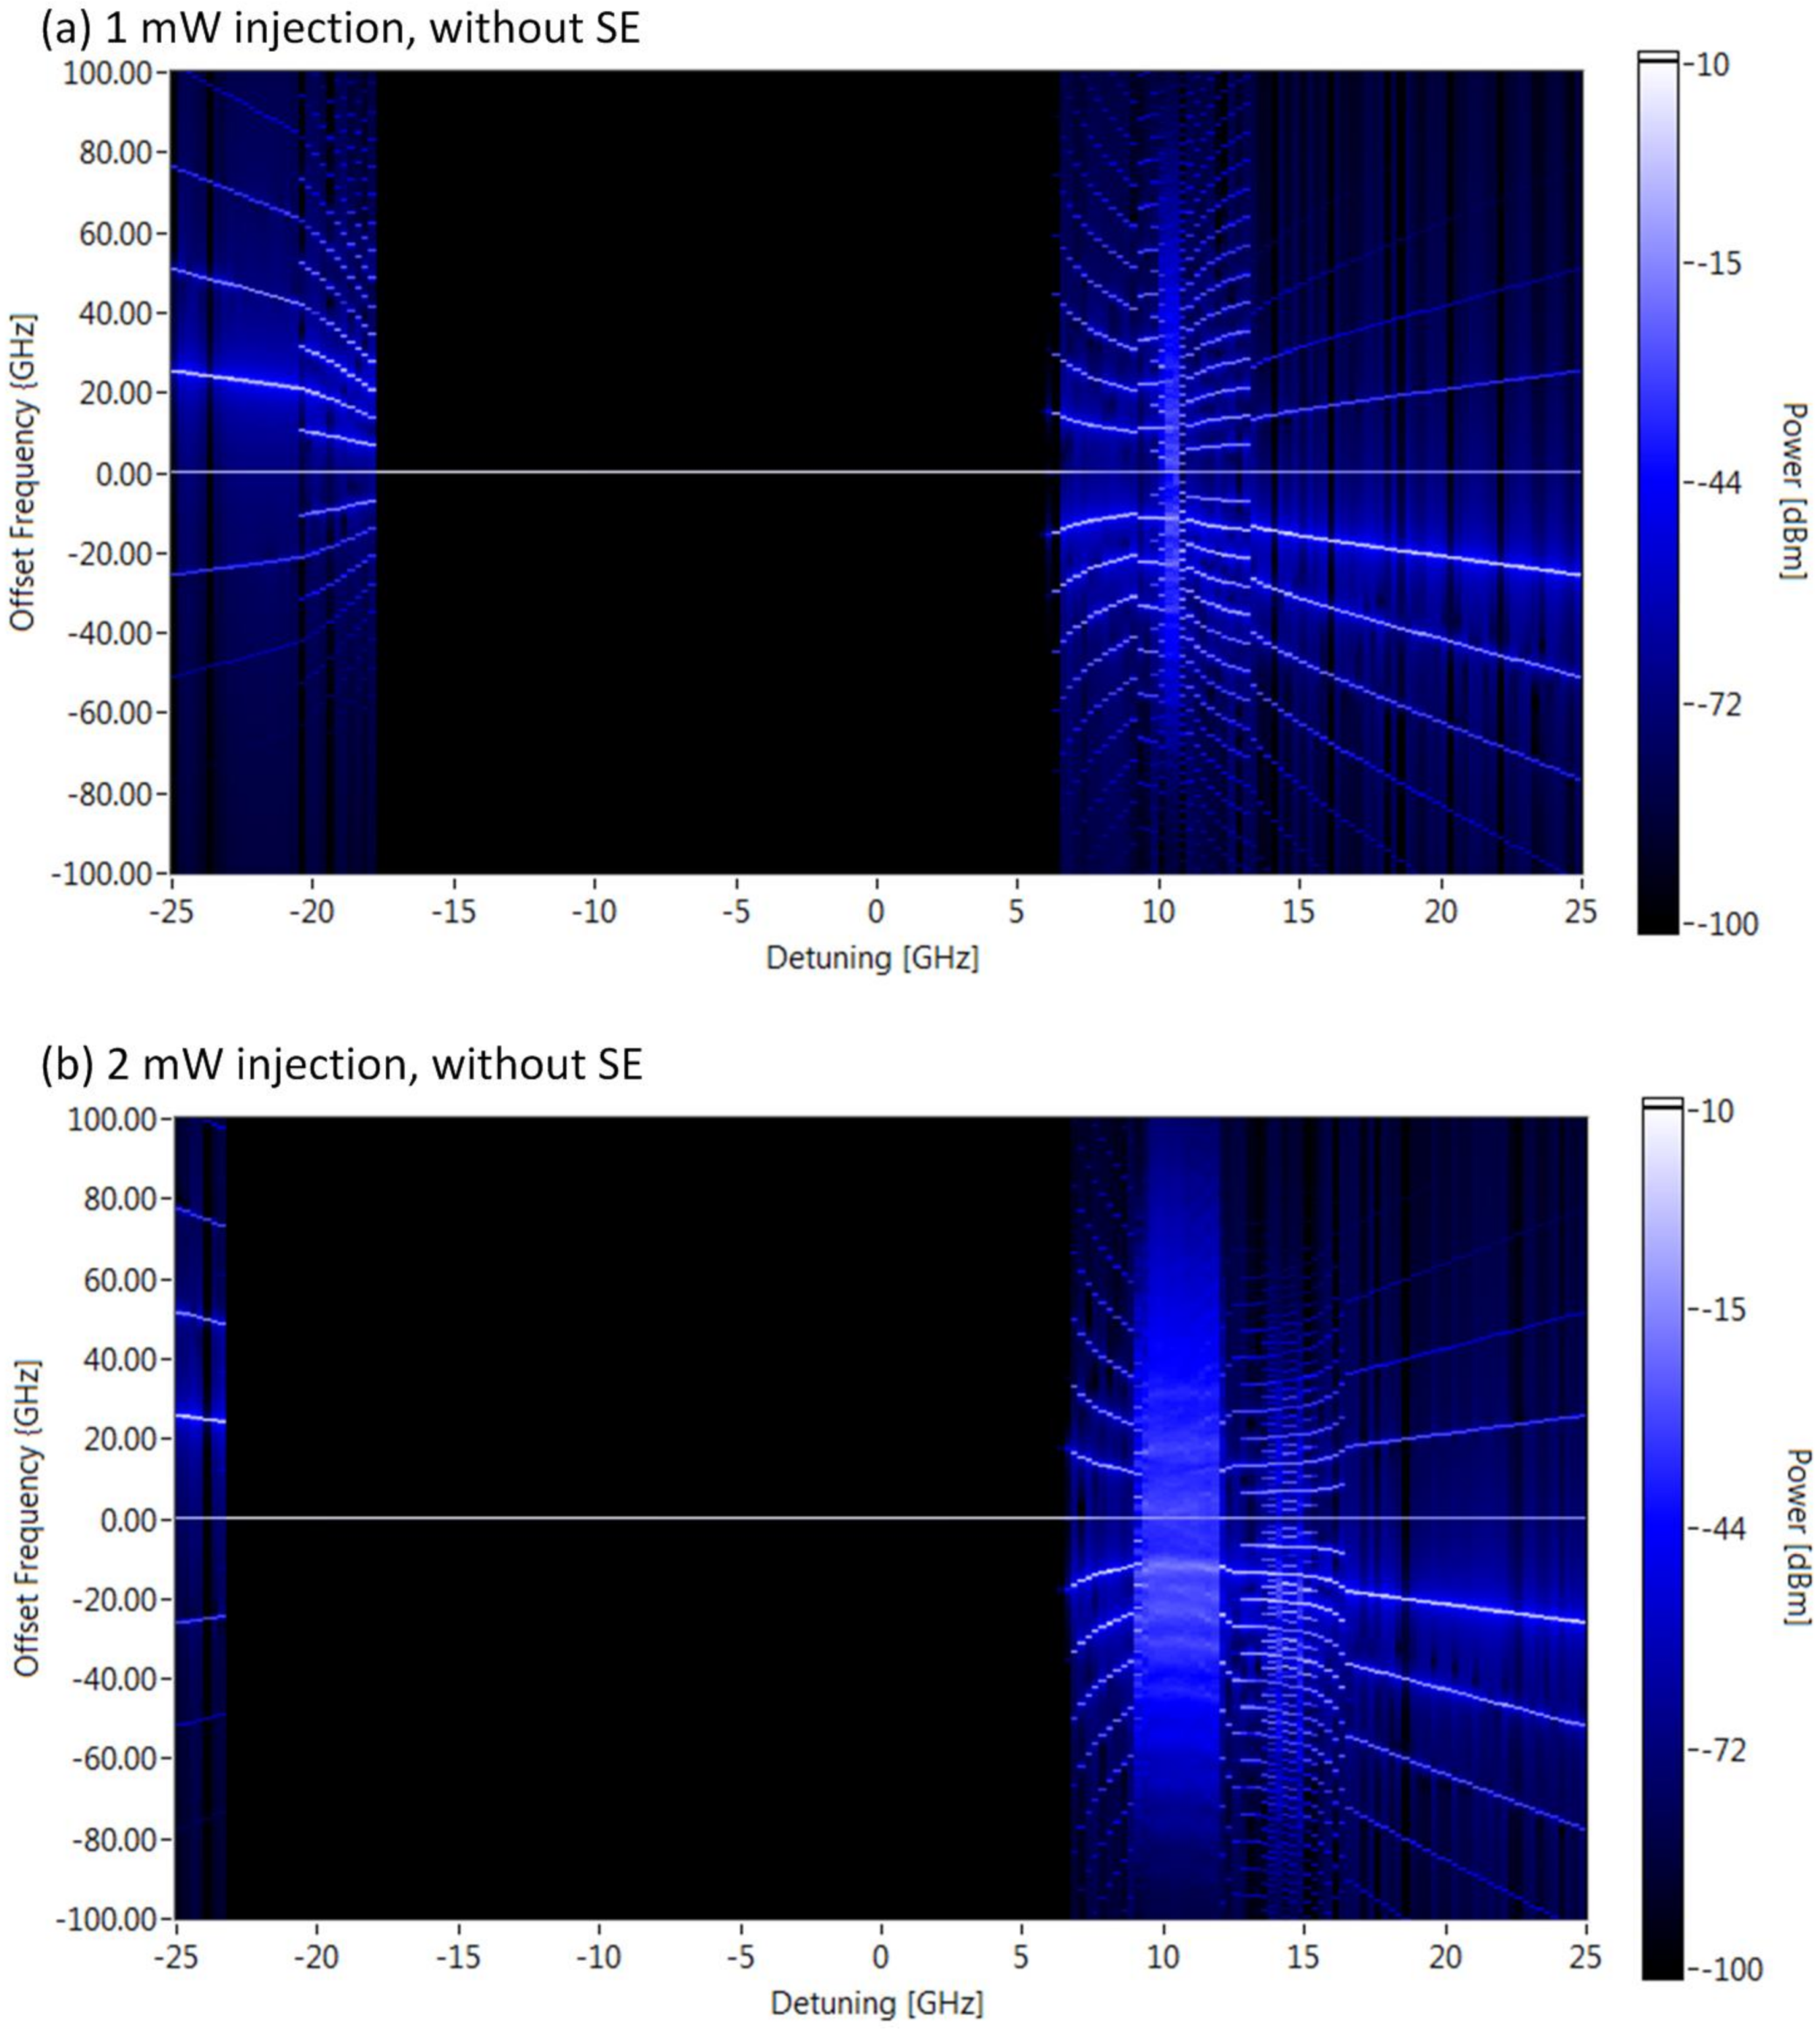
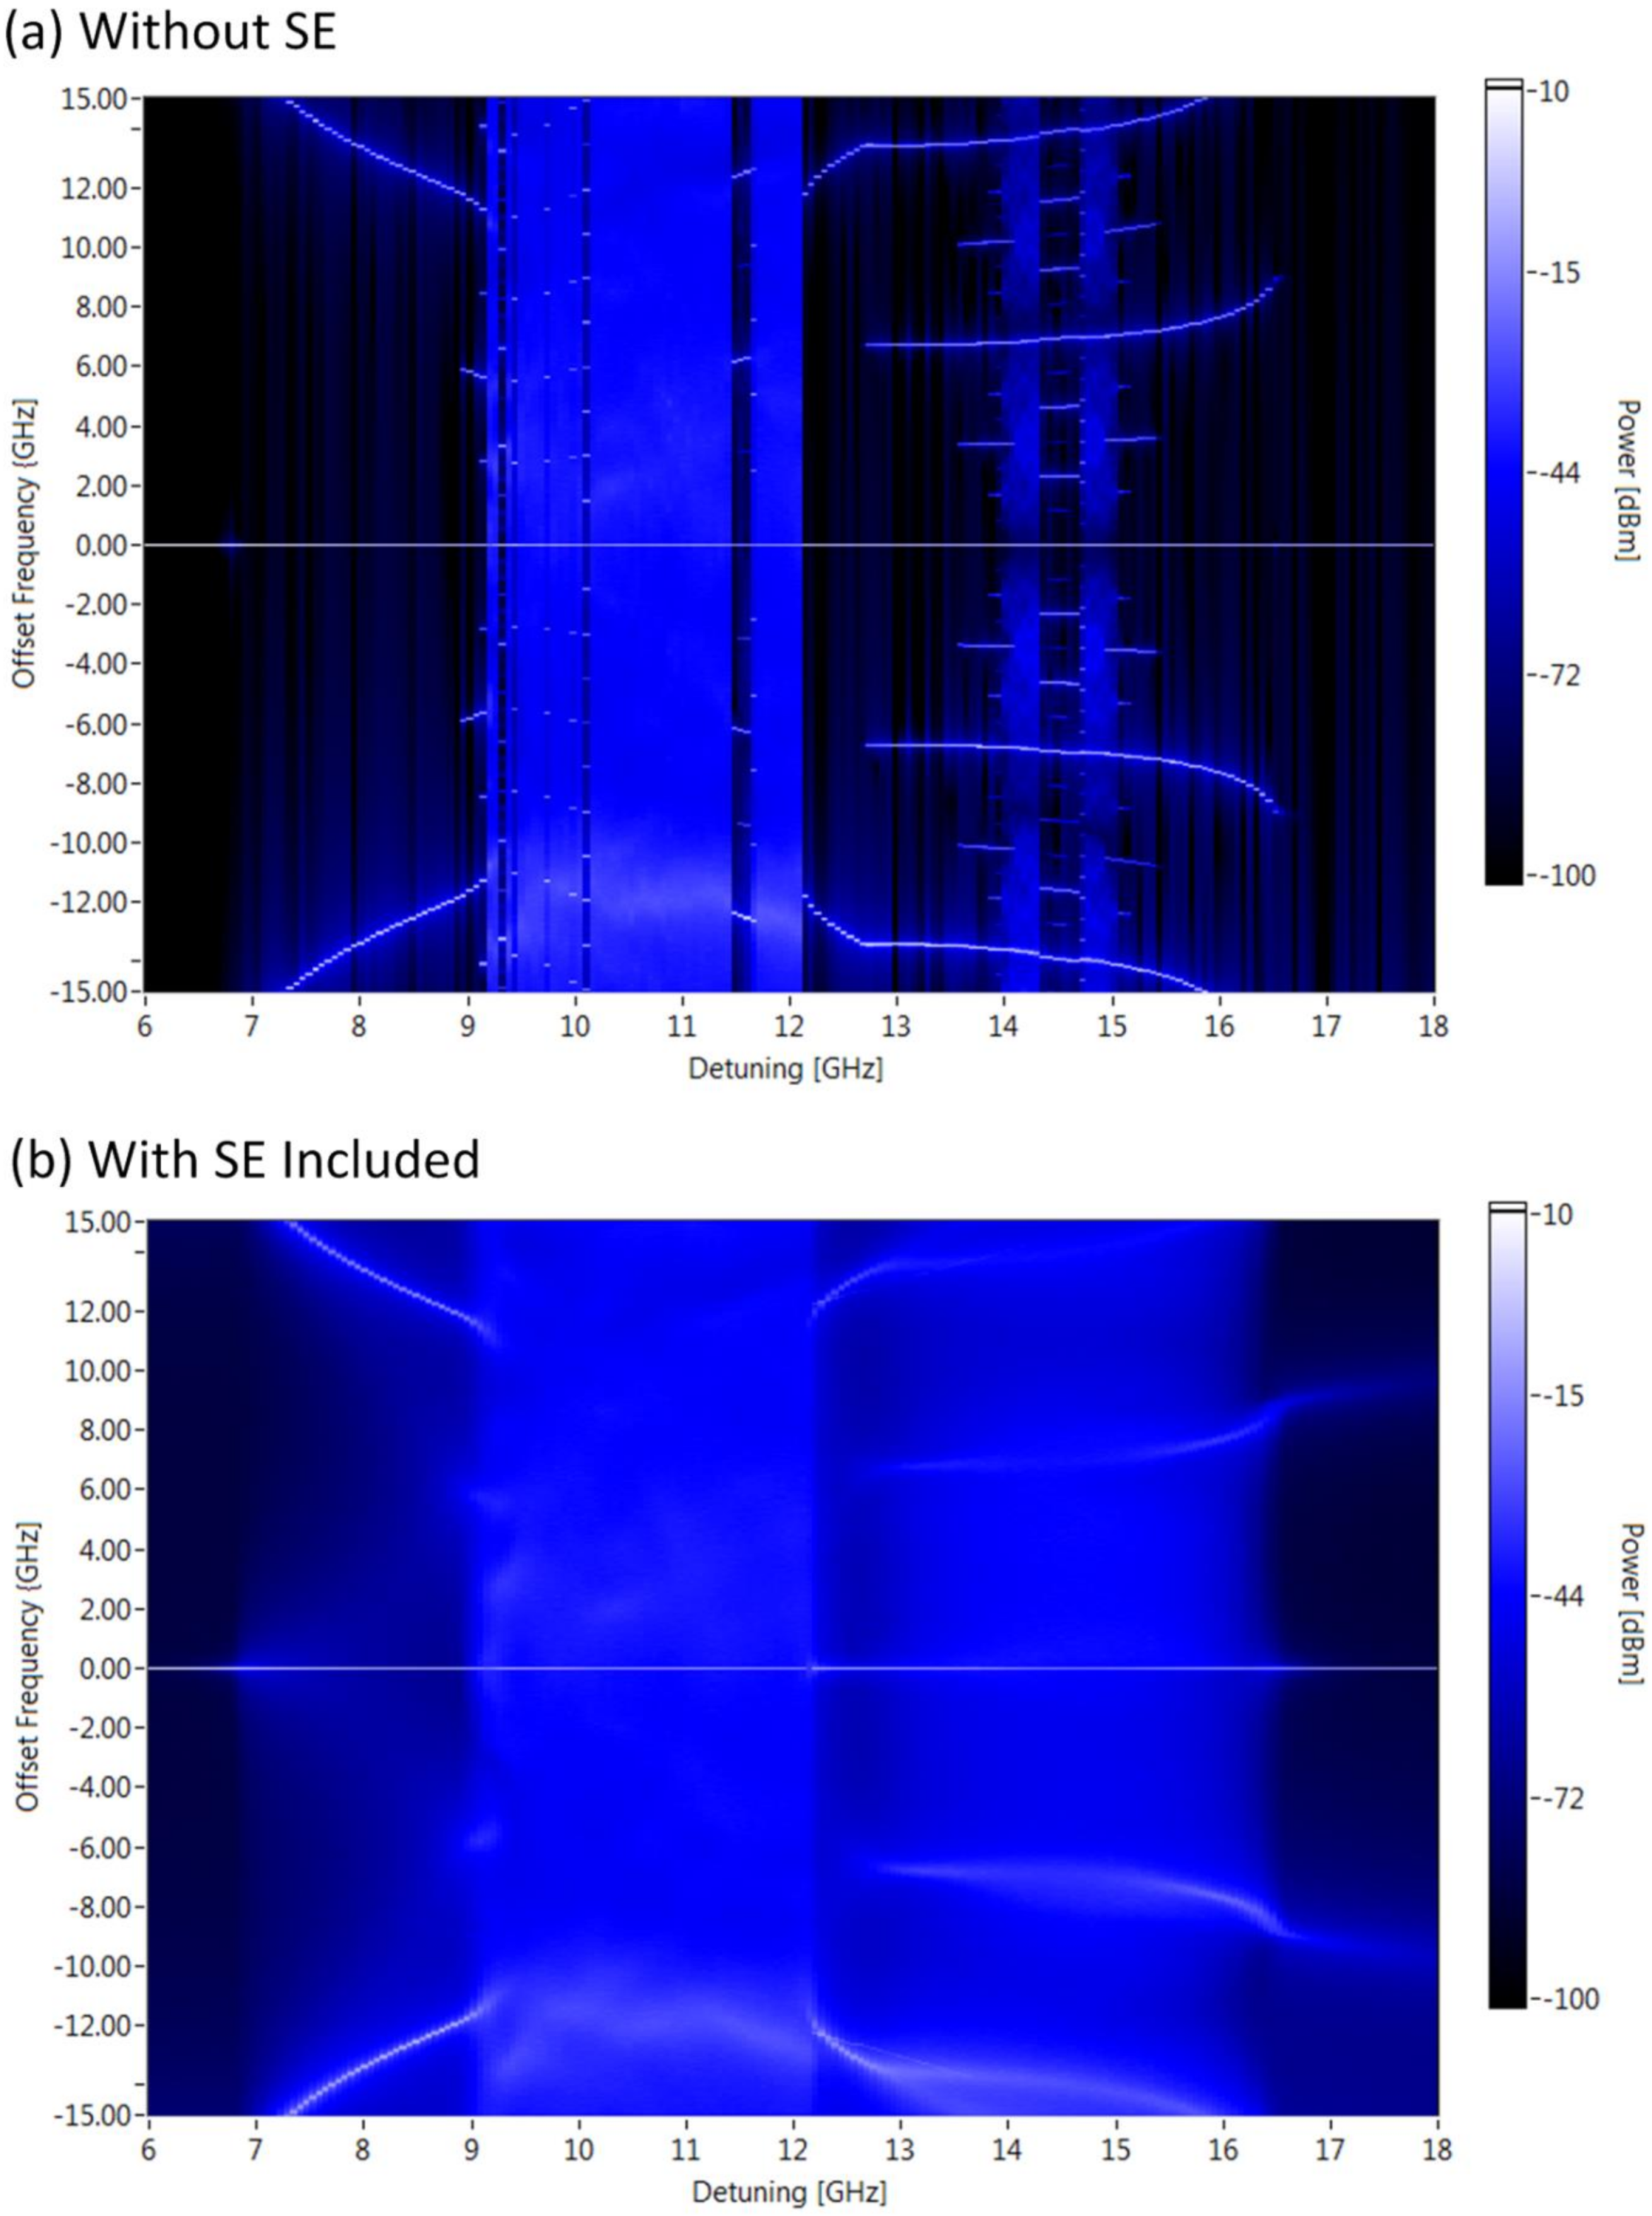
In this section, we justify the claim made in the previous section that the SE is responsible for keeping the injected laser system, for high injection powers, in a chaotic state. To enact this, we repeat the scans of
Figure 4a,b with the value of the spontaneous coefficient
set to zero. The results are plotted in
Figure 8 for injection powers of (a) 1 mW and (b) 2 mW. For the case of 1 mW injection without SE, a very thin region of chaos is clearly identifiable by a spectral continuum at a detuning of about 10.5 GHz. Note this was present in
Figure 4a, though the detuning range over which chaos occurs here is narrow; thus, we concentrated on chaos at the higher power of 2 mW for clarity. In
Figure 8a, clear evidence of P-2, P-3 and P-4 oscillations appears either side of this narrow chaotic state (in the vicinity of detuning of 11 GHz), which were not present when SE was included in
Figure 4a; this finding is consistent with [
14], where a lack of a period-doubling route to chaos was found. Within this detuning window in
Figure 8a, periodic-pulsation states are now observable due to the removal of SE in the model. This noise-induced chaos behaviour was formally studied in [
15]. The impact of SE is starker for the second chaotic region in
Figure 4b. There are now clearly observable P-2, P-3 and P-4 oscillations within the detuning window from 13 GHz to 17 GHz; these are washed away by the SE in
Figure 4a, where a chaotic state with the hallmarks of a P-2 state exists over the detuning range from 13 to 17 GHz (approx.).
The detail in these scans is only as good as the detuning granularity when constructing the spectral scans with detuning. A more in-depth examination at the spectral plots is repeated by exploring the detuning over smaller detuning ranges, as well as zooming into the central portion of the spectrum. Spectral resolution is also enhanced by increasing the number of samples taken when solving the system equations; the number of samples taken was 1,010,000 (the first 10,000 samples are discarded). The spectral resolution is now 1 MHz. These were conducted over the detuning range from 6 to 18 GHz with the injection power equal to 2 mW; the spectral scan results are shown in
Figure 9. This figure clarifies the stark differences when SE is included or omitted in the simulations, and higher-order P5 (and above) oscillations are revealed when SE is omitted.
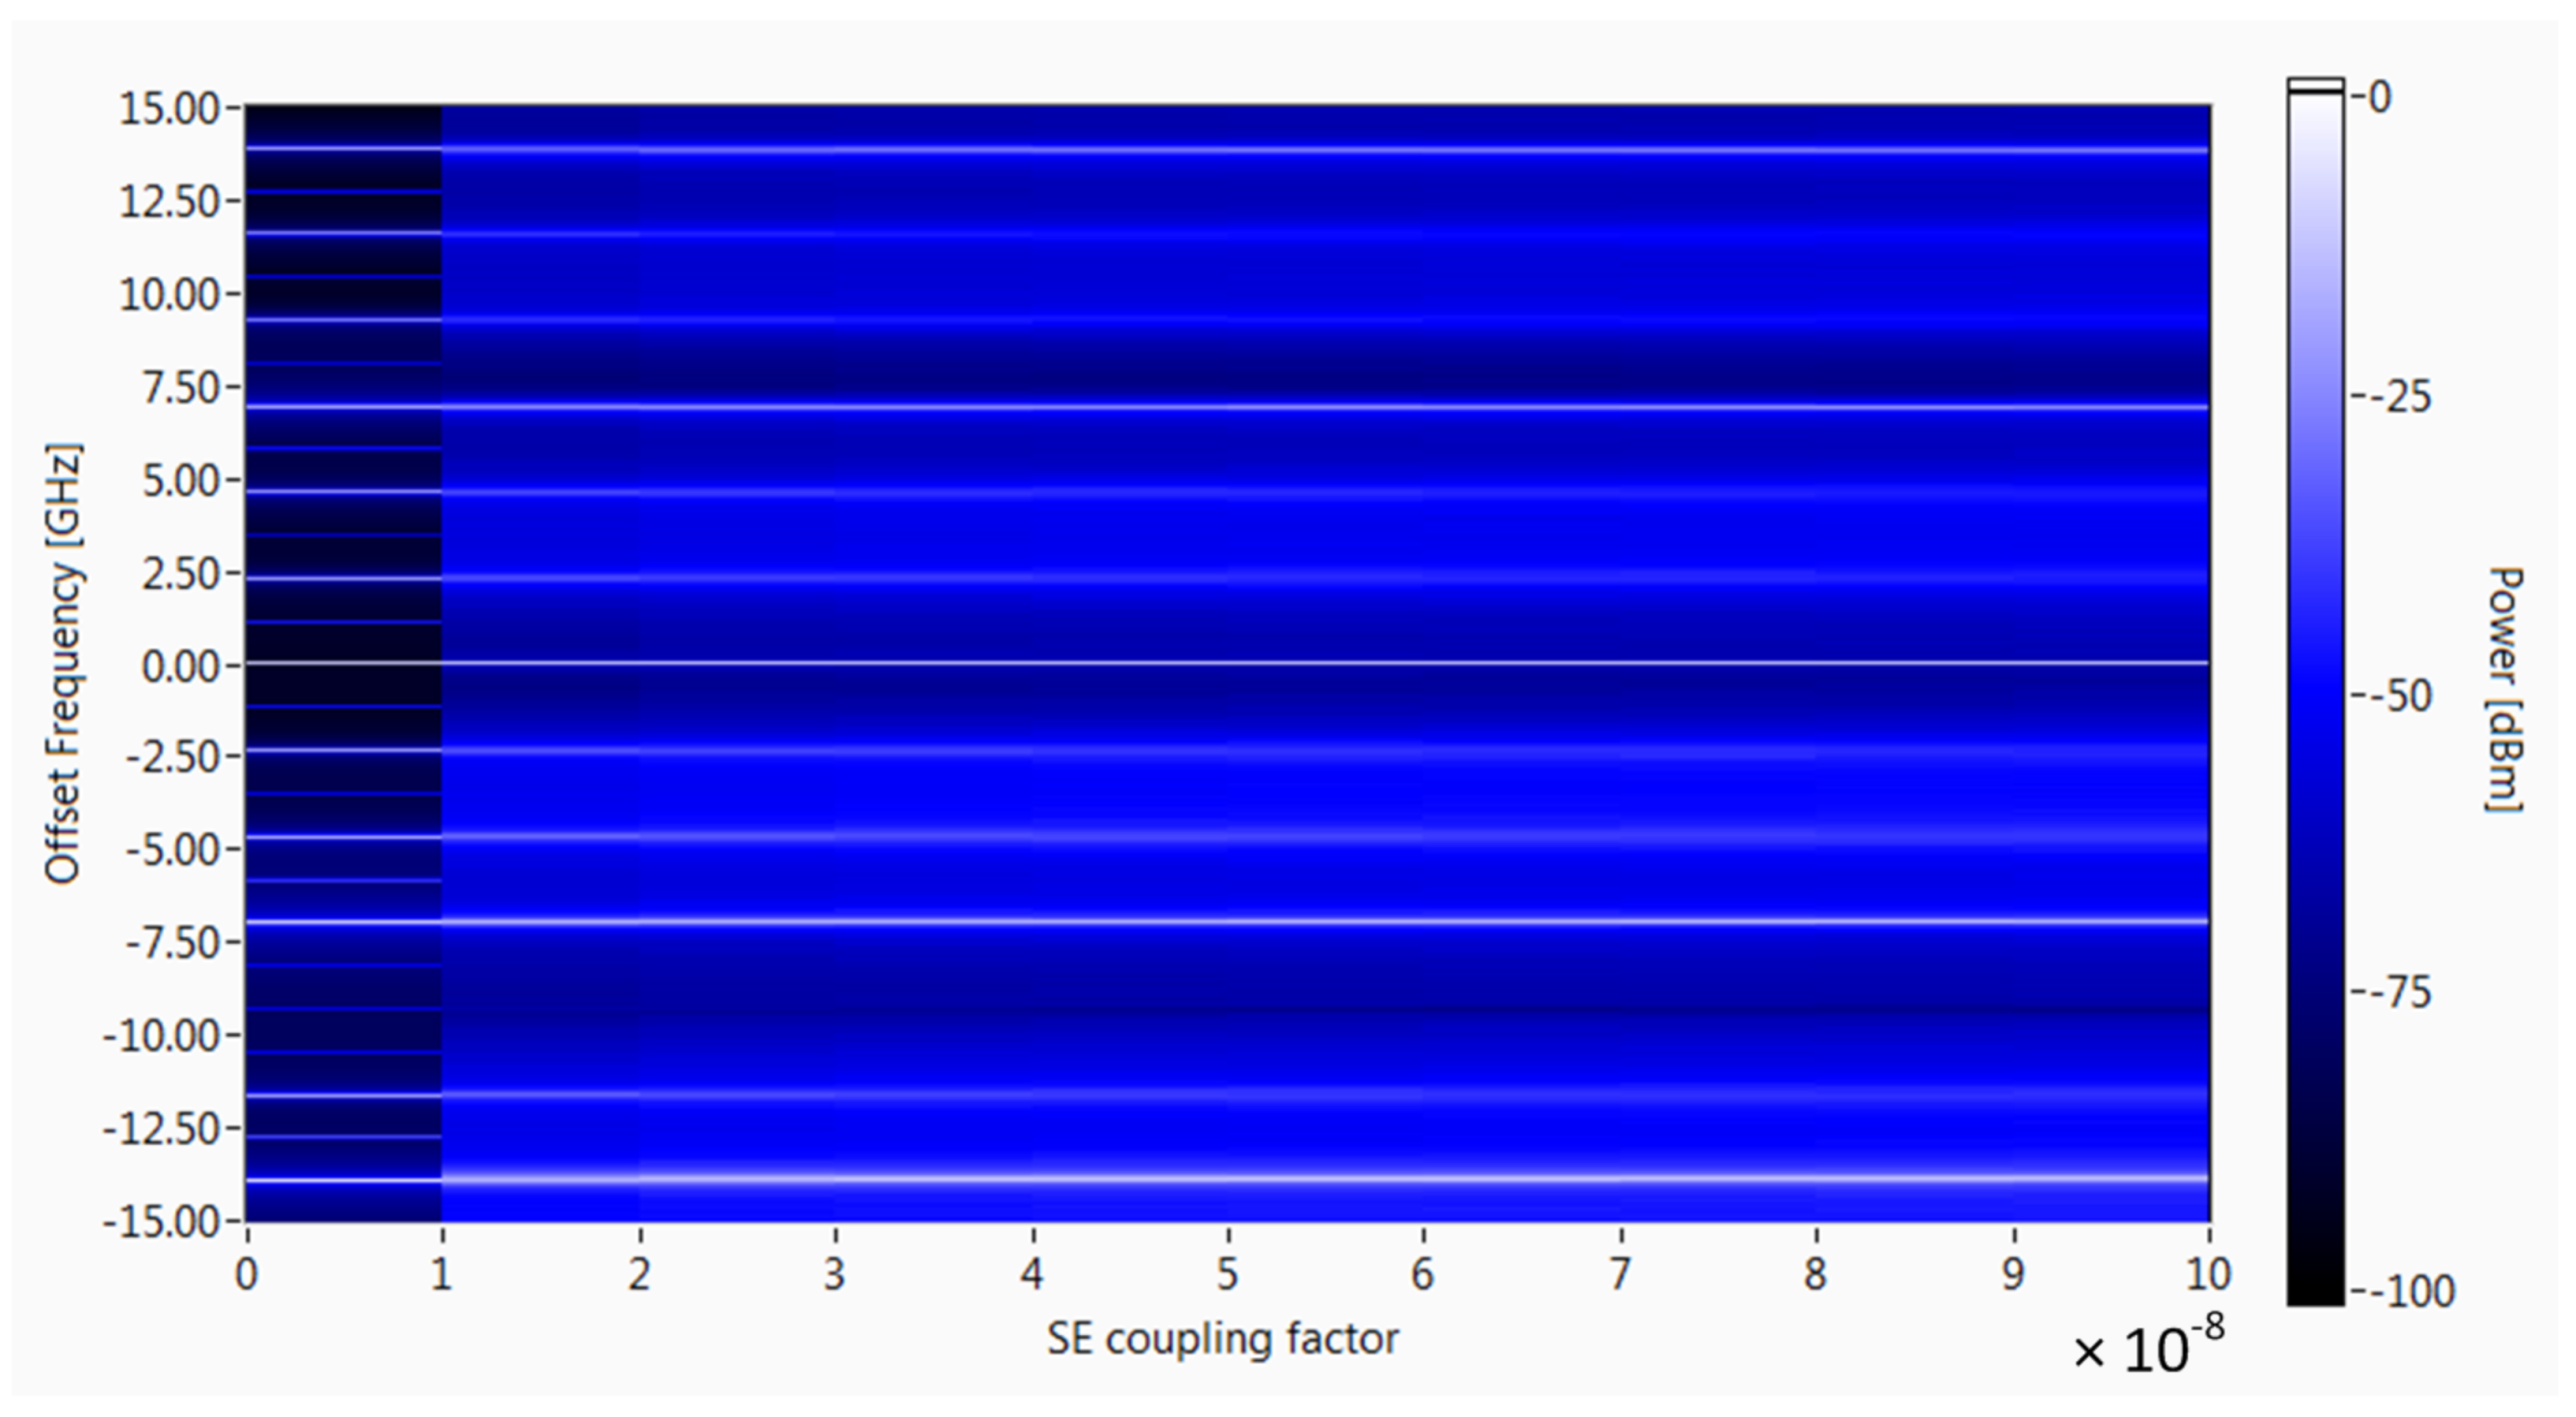
For completeness, we investigate the level of SE coupling required to observe oscillations of a higher order than P-2 oscillations. We take the injection power level to be 2 mW and the master–slave detuning to be 14.55 GHz. In
Figure 9, we find that there is a P-6 oscillation without SE and a noise-induced chaotic state with SE included. We find that the SE coupling needs to be reduced below the value of 1 × 10
−7 to see the P-6 oscillation; the scan of the spectra with the value of SE coupling increased from 0 to 1 × 10
−7, as shown in
Figure 10.


