Communication

Nanoparticle-Based Retinal Prostheses: The Effect of Shape and Size on Neuronal Coupling

by
Greta Chiaravalli
1,2,
Guglielmo Lanzani
1,2 and
Riccardo Sacco
3,*
1
Politecnico di Milano, Department of Physics, 20032 Milan, Italy
2
Center for Nanoscience and Technology, IIT, 20032 Milan, Italy
3
Politecnico di Milano, Department of Mathematics, 20032 Milan, Italy
*
Author to whom correspondence should be addressed.
Photonics 2022, 9(10), 710; https://doi.org/10.3390/photonics9100710
Submission received: 1 August 2022 / Revised: 20 September 2022 / Accepted: 22 September 2022 / Published: 29 September 2022

Abstract

:
The use of organic semiconductor nanoparticles (NPs) as retinal prostheses is attracting attention due to the possibility of injecting them directly into the desired tissue, with a minimally invasive surgical treatment. Polythiophene NPs localize in close proximity to the bipolar cell plasma membrane, which engulfs them, creating an intimate contact between the NP and the neuron. The intimate contact coupled with NP photoactivity are hypothesized to be the main guarantors of the electrostatic functioning of the bio-hybrid device. Since they may both be strongly affected by the geometric features of the NP, in this work, we use mathematical modeling to study the electrostatic polarization induced by light onto the NP and analyze how its spatial distribution is modified by varying the radius of the NP and its shape. Simulation results support the efficacy of the theoretical approach as a complementary virtual laboratory in the optimization of the current device and in the development of similar future NP-based technologies.

1. Introduction

Photoreceptor death is a leading cause of blindness worldwide, secondary to the development of retinal and macular pathologies, such as retinitis pigmentosa or maculopathy. Although it affects several millions of people per year, pharmacological and surgical treatments, such as intravitreal injections, photodynamic laser treatments, and photoluminescence filters [1], do not always provide a resolute cure. Recently, several retinal prostheses based on inorganic semiconductor chips have been proposed and even reached the stage of clinical trials and commercialization [2,3,4,5,6]. Zrenner et al. have proved the efficacy of a subretinal implant in blind patients in recognizing bright objects and shapes [6]. To improve visual acuity, an increase in the number of electrodes has been proposed [7]. However, despite the technological breakthrough, improvement in patients’ sight is still limited. For this reason, different devices, based upon the use of organic semiconductors, have been recently investigated [8]. The implant of a planar fully organic retinal prosthesis based on poly(3-hexylthiophene) (P3HT) has led to the successful restoration of light sensitivity in dystrophic Royal College of Surgeons (RCS) rats, a widely recognized model of retinitis pigmentosa [9]. A further development of P3HT-based technology, led, in [10,11], to the restoration of light sensitivity and visual acuity in RCS rats with the use of sole P3HT nanoparticles (NPs). The use of nanoparticles as retinal prosthesis introduced several advantages with respect to previous planar implants: (i) the possibility of injecting them into the retina, reducing the invasiveness of the surgical treatment; and (ii) their autonomous ability to redistribute across the retinal tissue covering a wider area with respect to the localized planar device. Despite the experimental effectiveness of the approach, the complexity of the interaction between NP and retinal tissue leaves many aspects to be investigated. As reported in the Supporting Information of [10], the size of NPs synthesized and injected into the retina follows a Gaussian distribution of radii, which is centered around ≃150 nm (304 nm of diameters) but can cover a radius which ranges up to ≃500 nm. For this reason, we have chosen to simulate three different values of radius size to quantitatively estimate the effects of NP polarization, and also to account for aggregates of NPs that may reach higher dimensions: r 1 = 150 nm, r 2 = 300 nm and r 3 = 500 nm. The size of a NP may affect the magnitude of the electrical signal experienced by the neuron plasma membrane and may possibly be a parameter that changes the adhesion characteristics of the NPs to the membrane. Whereas NPs of radius 150 nm have proved to be engulfed by the neuron membrane, experimental reliable and detailed information on the cleft size and composition are still not available and can be of fundamental importance to understand how size may eventually also affect the adhesion to the plasma neuronal membrane and, therefore, the coupling. In this work, we focus on studying the electrostatic effects of NPs on the photo-induced electrical polarization as a function of their size with the use of mathematical modeling. In addition, we also focus on the effect of a non-spherical shape in the polarization: indeed, from Scanning Electron Microscopy (SEM) images, the shape of the injected NPs often appears to be not exactly spherical but elliptic [10]. Finally, studying the effect of the polarization of bigger NPs can also help shed light on the effect of clustering of NPs, observed in several images reported in [10], which show the formation of structures of radius ≃1 μm.

2. Materials and Methods

In Section 2.1, we provide a geometric description of the system that will be used in the numerical simulations. In Section 2.2, we illustrate the various blocks that constitute the mathematical model proposed in the present work. In Section 2.3, we describe the computational algorithm that is implemented to simulate the bio-hybrid system object of this work. It is worth noting that all the equations and physical model adopted in the present article have been validated in [12], where the 1D version of the model has been used to reproduce experimental electrochemical measurements.

2.1. Geometric Representation of the Bio-Hybrid System

Figure 1 (left panel) shows a three-dimensional schematic representation of the bio-hybrid system. This latter is composed of an NP (sphere, magenta color) and of a surrounding medium, a proteinic region with a relative permittivity of 6 [13,14]. Indeed, the region of the neuronal membrane that surrounds the NP is commonly considered by the scientific community to be filled by “proteinic islands”, which engulf the NP [10]. This allows us to focus on the role of the NP, neglecting (at least in the present model) the roles of ion electro-diffusion and of ionic screening. The yellow arrow represents the external input source. The rotational invariance of the system with respect to the z axis allows us to reduce the 3D structure (in a Cartesian reference system) to the 2D axial symmetric structure depicted in the right panel of the figure (r-z coordinate system). The 2D axial symmetric region, which is the computational domain of our model, is the union of the NP subdomain Ω 1 and of the subdomain Ω 2 representing the aqueous environment surrounding the NP. The boundary of Ω 1 is Ω 1 = Γ 5 Γ i n t , whereas the boundary of Ω 2 is Ω 2 = Γ 2 , e x t Γ i n t , with Γ 2 , e x t = Γ 1 Γ 2 Γ 3 Γ 4 Γ 6 . The outward unit normal vector on Ω 1 is n 1 , whereas the outward unit normal vector on Ω 2 is n 2 . On Γ i n t we have n 2 = n 1 .

2.2. Model Structure

The mathematical model of the bio-hybrid system considered in this article is based on the formulations proposed and investigated in [11,12]. In [12], a validation of the semiconductor equations and parameters is performed against experimental electrochemical data. Stationary conditions are assumed to hold in accordance with the fact that this investigation is interested in the steady-state regime that is established in the system upon application of the input light source.
In Ω 1 , we solve the following partial differential system:
· D 1 = q p n + N D + N A ,
· J n = q G l i g h t q R ,
· J p = q G l i g h t q R ,
D 1 = ε 1 E ,
E = ψ ,
J n = q μ n n E + q D n n ,
J p = q μ p p E q D p p ,
where (1a) is the Poisson equation for the electric potential ψ and (1b) and (1c) are the continuity equations for electron and hole number densities n and p, while N D + and N A are donor and acceptor electron density atoms, respectively. Charge transport in the NP domain is described by the Drift Diffusion (DD) Equations (1f) and (1g) for the electron and hole current densities J n and J p [15]. Charge balance of electrons and holes inside the NP domain is the result of the concurrent action of generation G l i g h t due to the incident light and two-particle recombination/generation R according to the Shockley–Read–Hall theory [16].
In Ω 2 , we solve the following partial differential system:
· D 2 = F c O 2 ,
· J O 2 = P ,
D 2 = ε 2 E ,
J O 2 = μ O 2 c O 2 E + D O 2 c O 2 ,
where (2a) is the Poisson equation for the electric potential ψ and (2b) is the continuity equation for the superoxide molar density c O 2 . The superoxide molecule O 2 is produced at the interface with the NP, secondary to a reaction of reduction of molecular oxygen by NP electrons: O 2 + e O 2 . Ion transport in the aqueous domain is described by the Nernst–Planck (NeP) Equation (2d) for the molar flux density J O 2 [17]. Ion balance inside the aqueous domain is the result of the net recombination/generation P of oxide according to nonequilibrium kinetics between molecular oxygen and oxide.
Null-flux boundary conditions are enforced on Γ 5 and on Γ 2 , e x t \ Γ 2 . Homogeneous Dirichlet boundary conditions are enforced on Γ 2 for ψ . Nonlinear transmission conditions relating ψ , n, p, and c O 2 are enforced on Γ i n t . These conditions mathematically express the electrostatic coupling between the NP and the surrounding medium as in [11], and the surface oxidoreduction reactions among the photogenerated electrons and holes and oxide, as implemented in [11,12].

2.3. Computational Algorithm

The coupled DD–NeP partial differential system briefly illustrated in Section 2.2 is solved through a fixed-point iteration that generalizes to the present problem the classic Gummel’s Map traditionally used to simulate charge transport in inorganic semiconductor devices (see [18,19,20]).
For a given tolerance ϵ > 0 and given electrochemical potentials φ n ( k ) , φ p ( k ) and φ O 2 ( k ) , k 0 , the fixed-point iteration proposed in this work consists of the successive execution of the following steps:
  • Solve the nonlinear Poisson equation (for given electron, hole, and oxide electrochemical potentials):
    · D ( ψ ( k + 1 ) ) ρ ( ψ ( k + 1 ) ) = 0 in Ω 1 Ω 2 ,
    ρ ( ψ ( k + 1 ) ) = q n r e f exp φ p ( k ) ψ ( k + 1 ) V t h exp ψ ( k + 1 ) φ n ( k ) V t h + N D + N A in Ω 1 , F c r e f exp ψ ( k + 1 ) φ O 2 ( k ) V t h in Ω 2 ,
    where V t h is the thermal voltage;
  • Solve two linearized continuity equations for n and p (for given electric potential and oxide molar density):
    · J n ( n ( k + 1 ) , ψ ( k + 1 ) ) = q G l i g h t q R ( n ( k ) , p ( k ) , n ( k + 1 ) ) in Ω 1 ,
    · J p ( p ( k + 1 ) , ψ ( k + 1 ) ) = q G l i g h t q R ( n ( k ) , p ( k ) , p ( k + 1 ) ) in Ω 1 ;
  • Solve a linearized continuity equation for c O 2 (for given electric potential and electron and hole number densities):
    · J O 2 ( c O 2 ( k + 1 ) , ψ ( k + 1 ) ) = P ( c O 2 ( k + 1 ) ) in Ω 2 ;
  • Update the electrochemical potentials for electrons and holes:
    φ n ( k + 1 ) = ψ ( k + 1 ) + V t h ln n ( k + 1 ) n r e f in Ω 1 ,
    φ p ( k + 1 ) = ψ ( k + 1 ) V t h ln p ( k + 1 ) n r e f in Ω 1 ;
  • Update the electrochemical potential for the oxide:
    φ O 2 ( k + 1 ) = ψ ( k + 1 ) + V t h ln c O 2 ( k + 1 ) c r e f in Ω 2 ;
  • Compute the maximum absolute relative increment:
    δ ( k + 1 ) = max φ n ( k + 1 ) φ n ( k ) φ n ( k + 1 ) , φ p ( k + 1 ) φ p ( k ) φ p ( k + 1 ) , φ O 2 ( k + 1 ) φ O 2 ( k ) φ O 2 ( k + 1 ) , ;
  • Check for convergence:
    If δ ( k + 1 ) < ϵ , then terminate the iteration; otherwise, go back to step 1 and continue.
We see that instead of solving a system of four nonlinearly coupled partial differential equations, each step of the fixed-point iteration requires the solution of four decoupled partial differential equations, one of them nonlinear with respect to the electric potential ψ . Experimental results show that the convergence of the fixed-point iteration is quite fast; typically, fewer than 10 iterations are needed to reduce the maximum relative error below ϵ = 5 · 10 4 .
Besides being computationally efficient, the fixed-point iteration also has the significant advantage of favoring the use of the most appropriate discretization schemes to approximate the dependent variables of the problem. In particular,
  • Piecewise linear finite elements with mass lumping stabilization ([21], Chapter 22) are used to numerically solve (3a). This prevents the occurrence of unphysical oscillations in the spatial distribution of the electric potential, especially in the neighborhood of material interfaces;
  • Piecewise linear finite elements with Scharfetter–Gummel stabilization [22] are used to numerically solve (4a), (4b), and (5). This preserves on the discrete level the strict positivity of the carrier number densities and ion molar density.

3. Results and Discussion

In the next sections, we illustrate the results obtained by running the model to quantify the effect of nanoparticle size and shape on the photo-induced polarization.

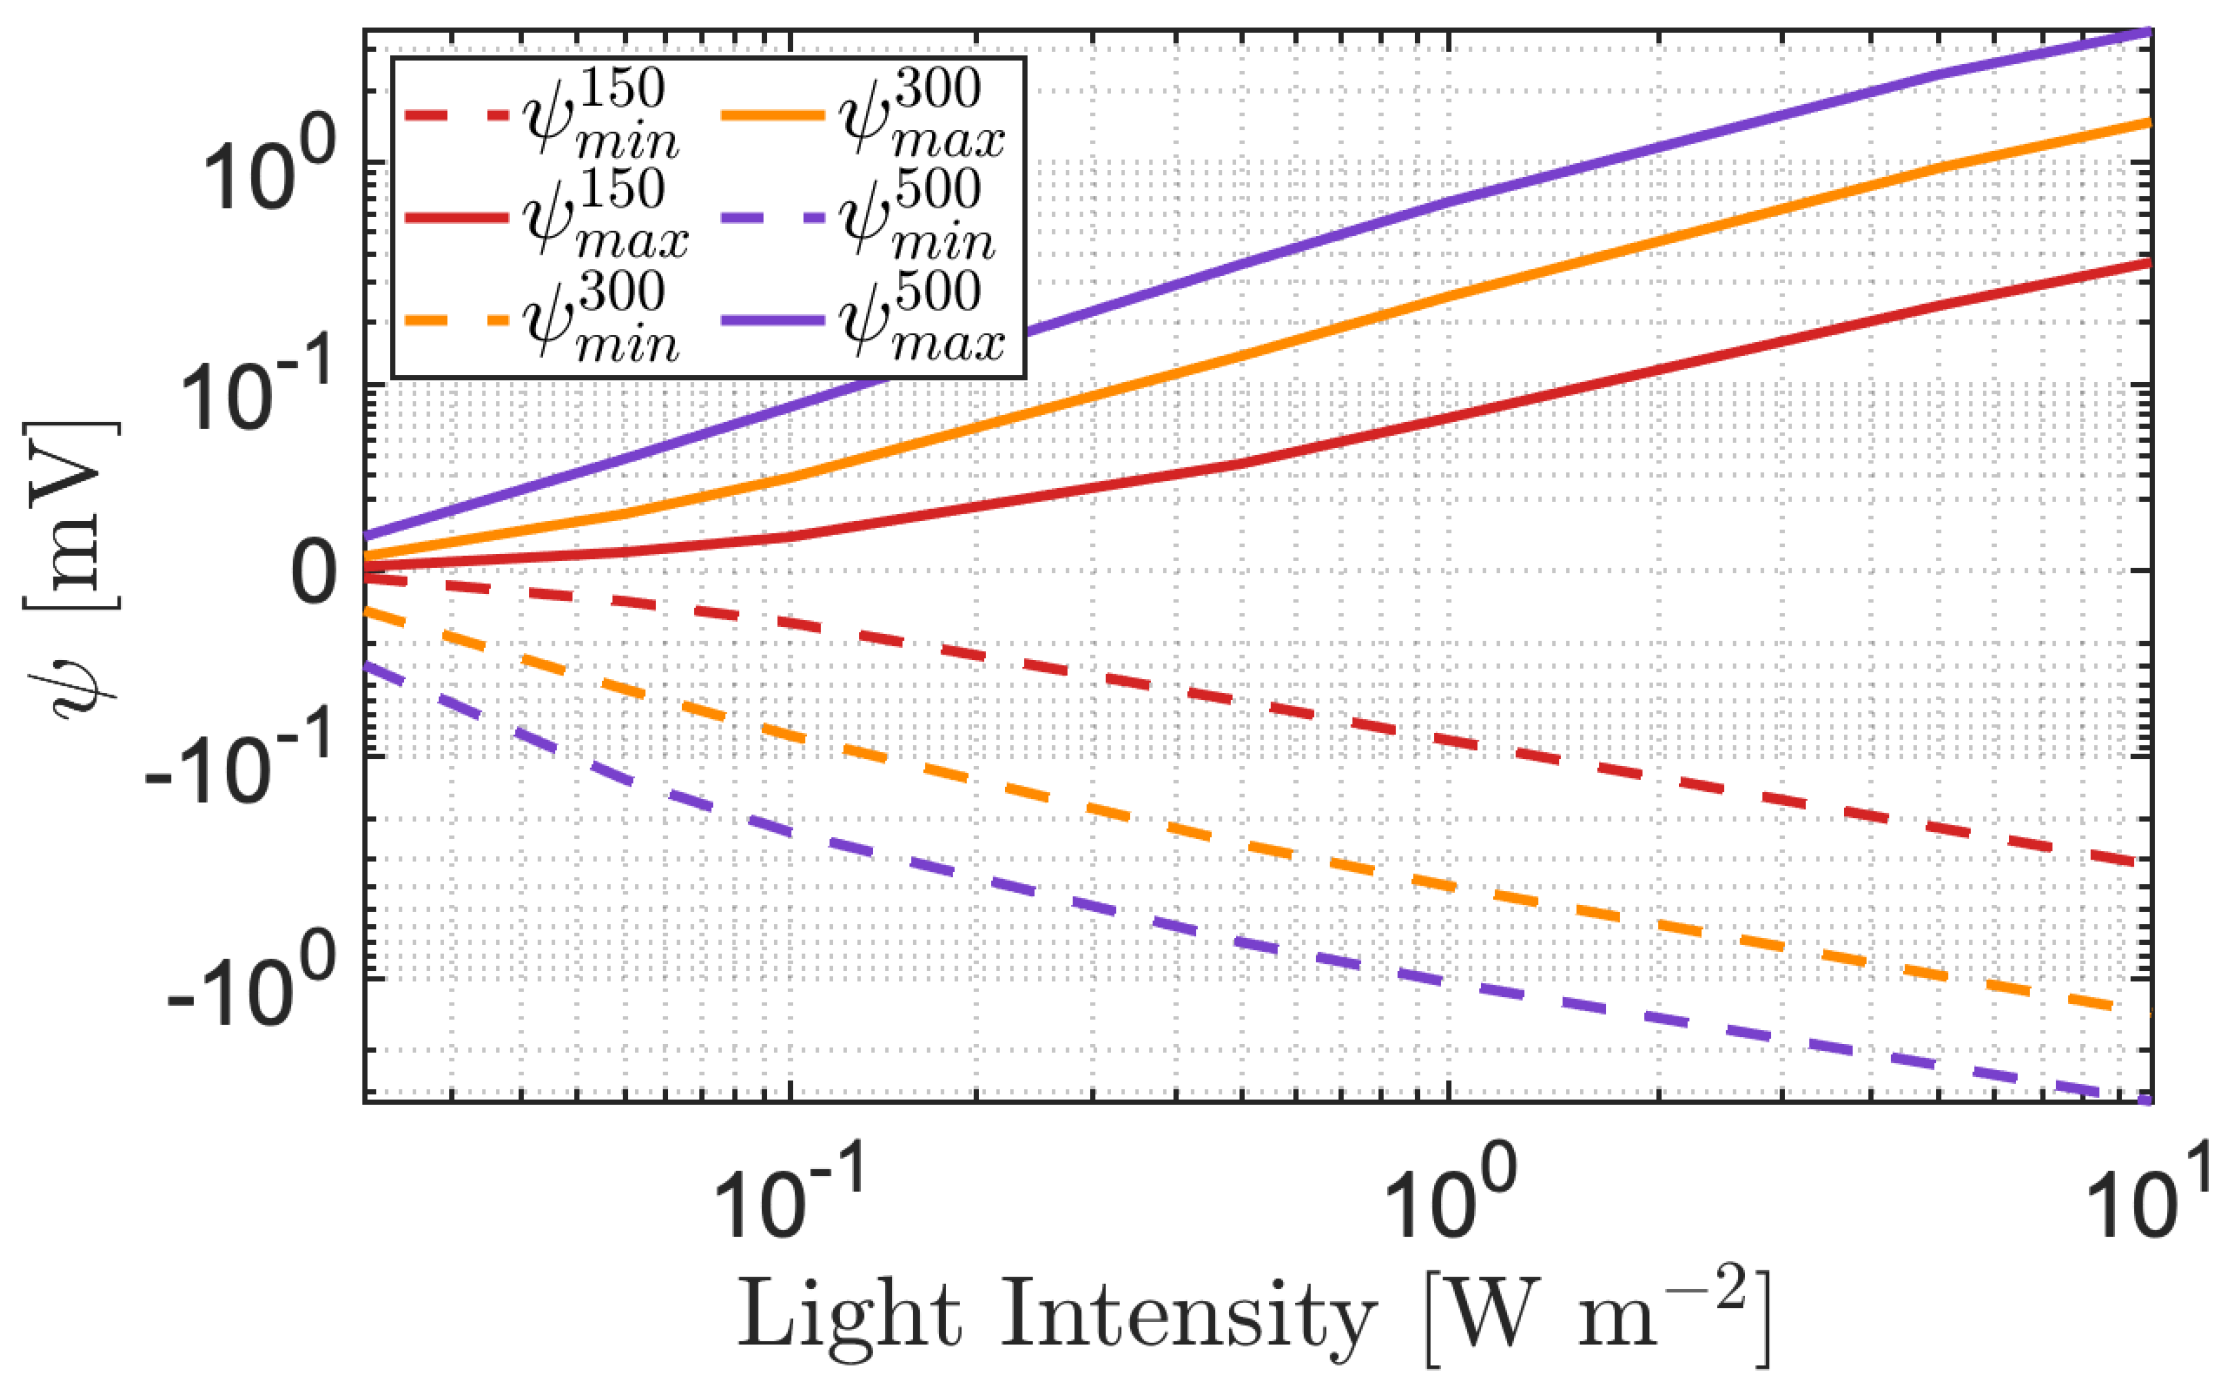
3.1. The Role of Nanoparticle Size

In order to test the effect of size and shape of P3HT-NPs, we have simulated the photo-induced electric potential distribution in response to a light stimulus of 1 W m 2 . Figure 2 shows the results for increasing values of the NP radius R N P , specifically, Figure 2A with R N P = 150 nm, Figure 2B with R N P = 300 nm, and Figure 2C with R N P = 500 nm. In the simulations, light impinges from the bottom. Due to the Lambert–Beer spatial profile of the light source, photo-induced carrier generation decreases as z increases: whereas holes are able to be redistributed across the whole space due to their relatively high mobility ( μ p = 10 8 V m 2 s 1 ), electrons are almost immobile ( μ n = 10 12 V m 2 s 1 ), giving rise to the dipole-like polarization of the NP visible in Figure 2, also known as the Photo-Dember effect [23,24]. Therefore, on the side where light impinges, we observe a negative polarization due to the accumulation of low-mobility electrons, whereas on the opposite side, we observe a positive electric potential due to redistribution of the holes. The charge distribution that produces these effects is displayed in Figure 3. These results are in agreement with those reported in [12], which show the onset of a photovoltage across a thin film of P3HT, secondary solely to the impinging of light. As we increase R N P , the magnitude of the electric potential increases, from the order of a fraction of mV with R N P = 300 nm in Figure 2B and reaching 1 mV in the case of a micrometric NP in Figure 2C.
In Figure 2A, the electric potential across the NP appears to symmetrically range between 0.06 mV and + 0.06 mV. As R N P increases (Figure 2B,C), the positive polarization amplitude is reduced with respect to the negative one, and it relatively decreases as the radius increases. This can be ascribed to the fact that as the radius increases, the ratio between the surface and the volume of the sphere decreases: holes have a relatively higher volume to be redistributed across with respect to the downward-looking surface where electrons are accumulating due to the Lambert–Beer input light profile. Holes can therefore efficiently spread across the NP volume (Figure 3 right), leading to a less effective positive polarization. Simulations also show that the nanoparticle is able to polarize the surrounding medium at higher distances as the radius increases, due to the higher electric potential elicited by the NP. It is interesting to notice that the polarization of the medium appears to be more effective on the illuminated side. This can be ascribed to the production of O 2 at the interface with the nanoparticle, secondary to photocathodic reactions, which are more efficient where electrons are accumulating.
The superoxide current produced at the interface of the NP for an impinging light power density of 1 W m 2 is reported in Table 1. Results indicate that superoxide current increases proportionally with R N P and shows a strong asymmetry with respect to the illumination side. Due to the asymmetric mobilities and distribution of carriers, the side of the NP that is directly illuminated by the light is able to produce the vast majority of O 2 current due to a higher presence of electrons at the illuminated interface (Figure 3). The opposite side of the NP is almost inert to molecular oxygen due to the scarce availability of electrons for the cathodic reaction. The capability of P3HT to produce superoxide anions can lead to the formation of hydrogen peroxide molecules, in proximity to the NP and therefore the neuronal membrane. Hydrogen peroxide is a reactive oxygen species that is known to be responsible for the activation of two main mechanisms at the cellular membrane: the Eu- and the oxidative stress. Depending on the available concentration of these molecules at the membrane, hydrogen peroxide may trigger some signaling pathways (in the range of 100 nM in the extracellular environment) or induce the deterioration of the bio-physical conditions of cells, eventually leading to death (>>100 nM in the extracellular environment) [25]. The activation of signaling pathways at the neuronal membrane is also named the photo-chemical effect, which is, together with the photo-capacitive mechanism, one of the possible coupling effects inducing neuronal firing secondary to light illumination. From our simulations, the sole superoxide current density reaching the membrane appears too small to trigger either a significant electrostatic depolarization at the neuronal membrane or to reach an increase in O 2 concentration of 100 nM in a reasonable amount of time. These photo-cathodic properties of P3HT are well known in the field and are exploited by several groups to try to trigger cellular signaling [26,27,28].
In order to better comment on the quantitative results obtained in terms of the electrostatic effect, in Figure 4, we report the absolute value of the negative and positive polarizations across spherical NPs of different radii for different light intensities. Simulations show a linear increase in the logarithmic scale of the absolute value of the polarization, both minimum and maximum, as a function of light intensities. As the size of the radius increases, the polarization of the NP becomes larger. It is also interesting to notice that the maximum (continuum line in Figure 4) and the minimum (dashed line in Figure 4) electric potential exhibit an almost perfectly symmetric trend. Upon sunlight exposure, the light intensity that is supposed to impinge onto the retina is ≃0.25 W m 2 [29], corresponding to an electrical polarization ranging from 0.01 up to 0.5 mV depending on the radius size. For small NPs, the electric potential induced by a single NP may be too small to directly elicit a neuron depolarization; however, at the neuronal membrane, we estimate that there are many NPs (≃100 [10]), which are expected to act simultaneously and cooperatively. Assuming an amplification factor of 100, the single-NP polarization of fractions of mV may also be responsible for neuronal eliciting. The electric polarization of the NPs secondary to light exposure therefore appears non-negligible and may be able to induce a neuronal electrostatic coupling.

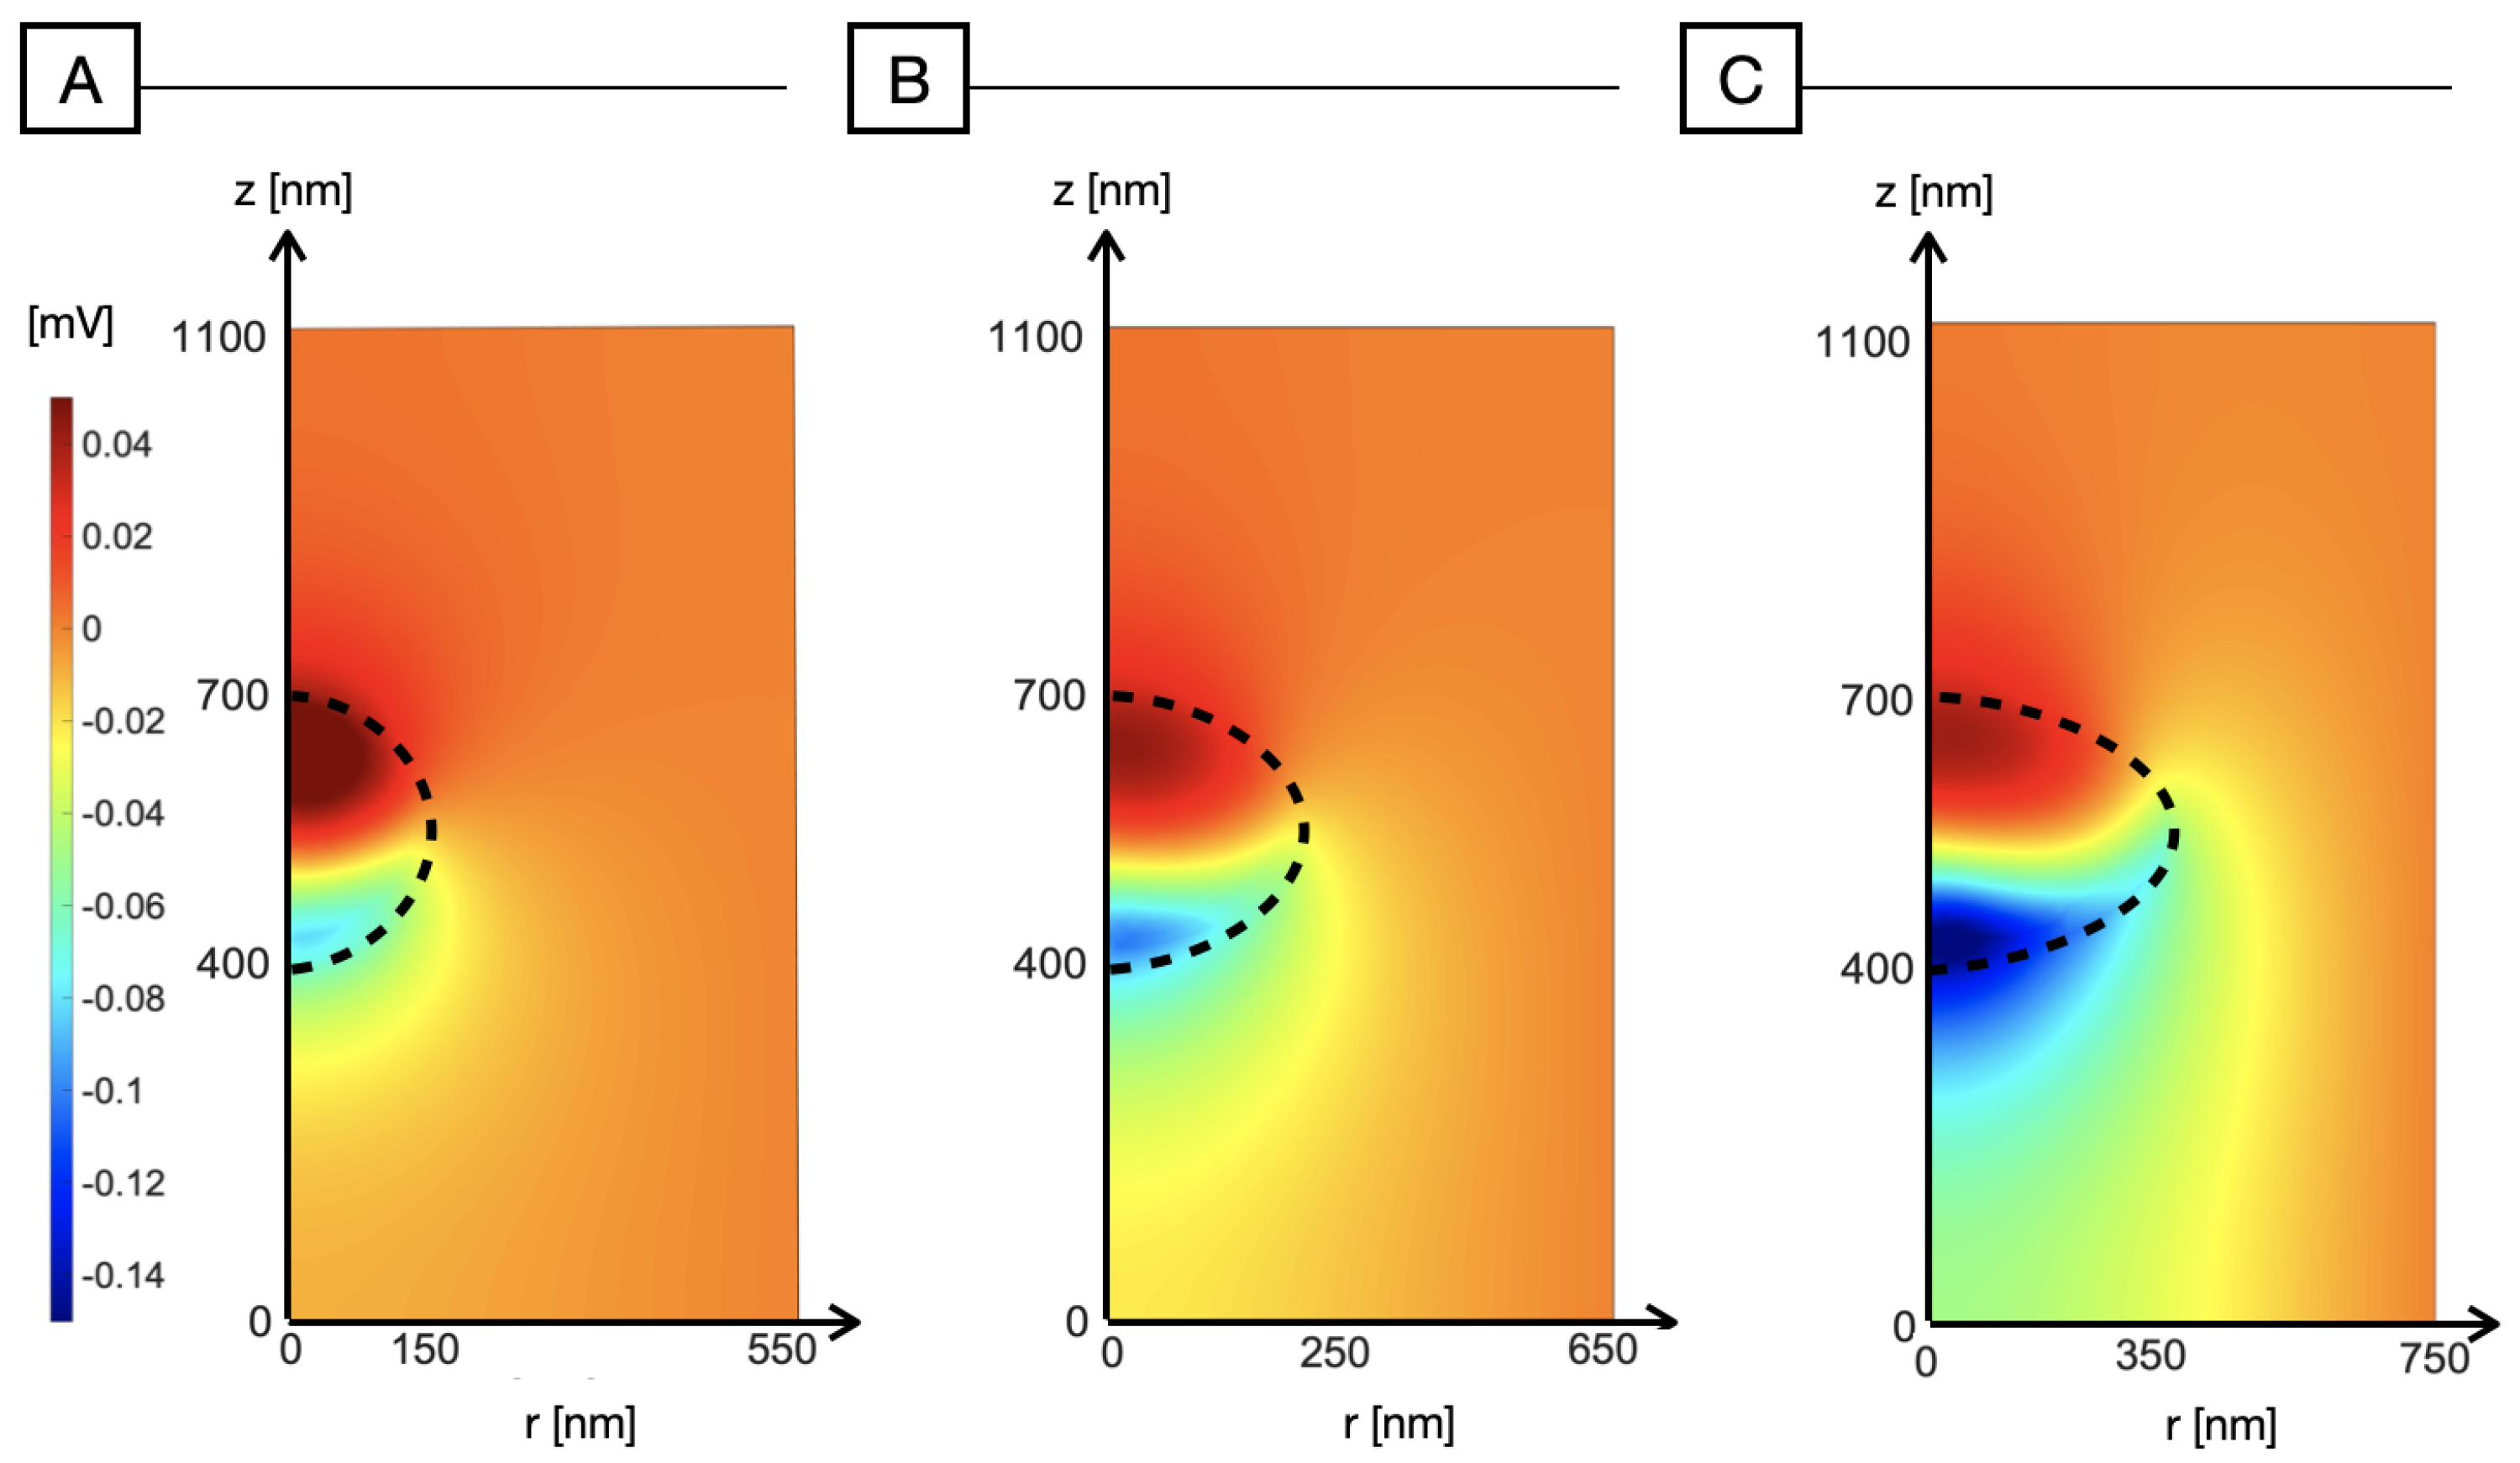
3.2. The Role of NP Ellipticity

In order to also take into account the non-ideal sphericity of the NP, we have performed simulations by assuming an elliptical shape of the NP. In Figure 5, we have increased the NP radius r 2 along the z-axis, parallel to the direction of light, while keeping a constant radius of 150 nm along the r-axis, perpendicular to the light. When we increase r 2 to 250 and 350 nm, Figure 5B,C, the polarization across the nanoparticle decreases uniformly, thus making the photo-induced activation of the NP less effective. This can be ascribed to a shape effect: when decreasing the illuminated surface with respect to the available volume for carrier redistribution, we observe that the polarizing effect decreases.
To verify the physical correctness of our conjecture, we have also increased the radius r 1 perpendicular to light, as shown in Figure 6. The negative polarization peak increases with NP ellipticity and reaches the maximum in Figure 6C, with the highest value of the radius r 1 = 350 nm. Whereas the minimum of the electric potential increases, the positive polarization appears to be hindered by the ellipticity of the NP, reaching the maximum value of ≃0.045 mV corresponding to a spherical NP. The explanation to this effect is similar to what described in Section 3.1 for increasing values of NP radius: the positive polarization becomes increasingly suppressed by the increasing volume available for hole redistribution as a result of a decreasing surface/volume ratio. With the considered shape and orientation, the effect is weaker than in the spherical case but still appreciable. Elliptic nanoparticles are therefore able to elicit an electrostatic signal on the illuminated side, whereas on the opposite side, the polarization is strongly reduced and often even negligible.

3.3. Summary

To give a short summary of the polarization results obtained in the previous subsections, we summarize in Table 2 the electrical potential ranges simulated in the various shape and size conditions. It is interesting to notice that the increase in polarization is super-linear with respect to the increase in size (i.e., if we double the radius, we more than double the absolute value of the polarization). In the case of spherical NPs, simulations suggest that the negative polarization is higher than the positive one and becomes even more relevant when the radius increases. If the NP has a vertical ellipticity, we observe that polarizations even decrease with increasing r 2 , and the values of negative and positive polarization are less diverging than in the spherical case. If the NP has a horizontal ellipticity, we observe that the polarizations increase with increasing r 1 , and similarly to the spherical case, the negative and positive polarization values tend to diverge.

4. Conclusions

In order to assess the effect of the distribution of nanoparticle shape and size, we have simulated various scenarios of light-induced nanoparticle electric potential as a function of radius and ellipticity of the NP. Simulations suggest that an increased radius may trigger a stronger electrostatic signal towards the cell, particularly on the illuminated side. These model predictions suggest that optimally tuning the NP radius to enhance the magnitude of the electrostatic signal is worth considering. Simulations also suggest that the elliptic shape, often encountered in SEM images of injected NPs, can either hinder or enhance the electrostatic signal, depending on the ellipse orientation with respect to the direction of the impinging light. When the light acts parallel to the major radius, as in the case of a “vertically oriented ellipse”, polarization decreases, due to the scarce production of carriers at the small illuminated interface. When the light acts parallel to the minor radius, as in the case of a “horizontally oriented ellipse”, polarization increases, due to the intense production of carriers at the bottom interface. These results suggest that elliptical NPs can also contribute to the electrostatic retinal prosthesis/neuron coupling, particularly when favorably oriented, whereas, if oriented in the wrong direction, they may even not be able to elicit an electrostatic effect. As pointed out in the Discussion section, all the NPs at the neuron membrane may give a cumulative contribution responsible for neuronal triggering in blind rats, as reported in [10], and thus are able to recover the role of the, now dead, photoreceptors, responding to light stimuli and communicating with the neuronal circuitry. As a final comment, it is worth noting that in the proposed model, the polarization of the medium that surrounds the NP is computed by considering the sole role of superoxide ions, neglecting the effect of ionic screening, which would instead be relevant in an electrolytic environment. This assumption is consistent with the presence of a proteinic structure in the intimate neighborhood of the NP: the existence of a highly resistive cleft may promote an electric polarization of the NP surroundings, hindering the ionic screening.

Author Contributions

Conceptualization, G.L. and G.C. and R.S.; methodology, G.C. and R.S.; software, G.C. and R.S.; validation, G.C.; formal analysis, G.C. and R.S.; investigation, G.L. and G.C. and R.S.; resources, G.L.; data curation, G.C.; writing—original draft preparation, R.S. and G.C.; writing—review and editing, R.S. and G.C.; visualization, G.C.; supervision, G.L.; project administration, G.L.; funding acquisition, G.L. All authors have read and agreed to the published version of the manuscript.

Funding

This research was funded by the Italian Ministry of University, Research and Technology. Grant title: “Membrane targeted light driven nanoactuators for neuro-stimulation”; grant number: PRIN 2020XBFEM.

Data Availability Statement

Not applicable.

Conflicts of Interest

The authors declare no conflict of interest.

References

  1. Menéndez-Velázquez, A.; Álvarez, C.N.; del Olmo-Aguado, S.; Merayo-Lloves, J.; Fernández-Vega, A.; Osborne, N. Potential application of photoluminescent filters for use in ophthalmology. Opt. Mater. 2018, 86, 505–511. [Google Scholar] [CrossRef]
  2. Bloch, E.; Luo, Y.; da Cruz, L. Advances in retinal prosthesis systems. Ther. Adv. Ophthalmol. 2019, 11, 251584141881750. [Google Scholar] [CrossRef]
  3. Luo, Y.H.L.; da Cruz, L. The Argus II Retinal Prosthesis System. Prog. Retin. Eye Res. 2016, 50, 89–107. [Google Scholar] [CrossRef]
  4. Lorach, H.; Goetz, G.; Smith, R.; Lei, X.; Mandel, Y.; Kamins, T.; Mathieson, K.; Huie, P.; Harris, J.; Sher, A.; et al. Photovoltaic restoration of sight with high visual acuity. Nat. Med. 2015, 21, 476–482. [Google Scholar] [CrossRef] [PubMed]
  5. Ayton, L.N.; Blamey, P.J.; Guymer, R.H.; Luu, C.D.; Nayagam, D.A.X.; Sinclair, N.C.; Shivdasani, M.N.; Yeoh, J.; McCombe, M.F.; Briggs, R.J.; et al. First-in-human trial of a novel suprachoroidal retinal prosthesis. PLoS ONE 2014, 9, e115239. [Google Scholar] [CrossRef] [PubMed]
  6. Zrenner, E.; Bartz-Schmidt, K.U.; Benav, H.; Besch, D.; Bruckmann, A.; Gabel, V.P.; Gekeler, F.; Greppmaier, U.; Harscher, A.; Kibbel, S.; et al. Subretinal electronic chips allow blind patients to read letters and combine them to words. Proc. R. Soc. Biol. Sci. 2010, 278, 1489–1497. [Google Scholar] [CrossRef]
  7. Palanker, D.; Vankov, A.; Huie, P.; Baccus, S. Design of a high-resolution optoelectronic retinal prosthesis. J. Neural. Eng. 2005, 2, S105–S120. [Google Scholar] [CrossRef]
  8. Manfredi, G.; Colombo, E.; Barsotti, J.; Benfenati, F.; Lanzani, G. Photochemistry of Organic Retinal Prostheses. Annu. Rev. Phys. Chem. 2019, 70, 99–121. [Google Scholar] [CrossRef]
  9. Maya-Vetencourt, J.F.; Ghezzi, D.; Antognazza, M.R.; Colombo, E.; Mete, M.; Feyen, P.; Desii, A.; Buschiazzo, A.; Di Paolo, M.; Di Marco, S.; et al. A fully organic retinal prosthesis restores vision in a rat model of degenerative blindness. Nat. Mater. 2017, 16, 681–689. [Google Scholar] [CrossRef]
  10. Maya-Vetencourt, J.F.; Manfredi, G.; Mete, M.; Colombo, E.; Bramini, M.; Di Marco, S.; Shmal, D.; Mantero, G.; Dipalo, M.; Rocchi, A.; et al. Subretinally injected semiconducting polymer nanoparticles rescue vision in a rat model of retinal dystrophy. Nat. Nanotechnol. 2020, 15, 698–708. [Google Scholar] [CrossRef]
  11. Francia, S.; Schmal, D.; Di Marco, S.; Chiaravalli, G.; Maya-Vetencourt, J.F.; Mantero, G.; Michetti, C.; Cupini, S.; Manfredi, G.; DiFrancesco, M.L.; et al. Light-induced charge generation in polymeric nanoparticles restores vision in advanced-stage retinitis pigmentosa rats. Nat. Commun. 2022, 13, 3677. [Google Scholar] [CrossRef] [PubMed]
  12. Chiaravalli, G.; Manfredi, G.; Sacco, R.; Lanzani, G. Photoelectrochemistry and Drift-Diffusion Simulations in a Polythiophene Film Interfaced with an Electrolyte. ACS Appl. Mater. Interfaces 2021, 13, 36595–36604. [Google Scholar] [CrossRef] [PubMed]
  13. Li, L.; Li, C.; Zhang, Z.; Alexov, E. On the Dielectric “Constant” of Proteins: Smooth Dielectric Function for Macromolecular Modeling and Its Implementation in DelPhi. J. Chem. Theory Comput. 2013, 9, 2126–2136. [Google Scholar] [CrossRef] [PubMed]
  14. Amin, M.; Küpper, J. Variations in Proteins Dielectric Constants. Chem. Open 2020, 9, 691–694. [Google Scholar]
  15. Roosbroeck, W.V. Theory of flow of electrons and holes in germanium and other semiconductors. Bell Syst. Tech. J. 1950, 29, 560–607. [Google Scholar] [CrossRef]
  16. Shockley, W.; Read, W.T. Statistics of the Recombinations of Holes and Electrons. Phys. Rev. 1952, 87, 835–842. [Google Scholar] [CrossRef]
  17. Rubinstein, I. Electrodiffusion of Ions; Society for Industrial and Applied Mathematics (SIAM): Philadelphia, PA, USA, 1990. [Google Scholar]
  18. Gummel, H. A self-consistent iterative scheme for one-dimensional steady state transistor calculations. IEEE Trans. Electron Devices 1964, 11, 455–465. [Google Scholar] [CrossRef]
  19. Markowich, P.A. The Stationary Semiconductor Device Equations; Computational Microelectronics; Springer: Vienna, Austria, 1986. [Google Scholar]
  20. Jerome, J.W. Analysis of Charge Transport; Springer: Berlin/Heidelbrg, Germany, 1996. [Google Scholar]
  21. Sacco, R.; Guidoboni, G.; Mauri, A.G. A Comprehensive Physically Based Approach to Modeling in Bioengineering and Life Sciences, 1st ed.; Elsevier: Amsterdam, The Netherlands; Academic Press: Cambridge, MA, USA, 2019. [Google Scholar]
  22. Scharfetter, D.; Gummel, H. Large-signal analysis of a silicon Read diode oscillator. IEEE Trans. Electron Devices 1969, 16, 64–77. [Google Scholar] [CrossRef]
  23. Goldman, S.R.; Kalikstein, K.; Kramer, B. Dember-effect theory. J. Appl. Phys. 1978, 49, 2849–2854. [Google Scholar] [CrossRef]
  24. Wu, X.; Park, H.; Zhu, X.-Y. Probing Transient Electric Fields in Photoexcited Organic Semiconductor Thin Films and Interfaces by Time-Resolved Second Harmonic Generation. J. Phys. Chem. C 2014, 118, 10670–10676. [Google Scholar] [CrossRef]
  25. Helmut, S. Hydrogen peroxide as a central redox signaling molecule in physiological oxidative stress: Oxidative eustress. Redox Biol. 2017, 11, 613–619. [Google Scholar]
  26. Aziz, I.A.; Malferrari, M.; Roggiani, F.; Tullii, G.; Rapino, S.; Antognazza, M.R. Light-Triggered Electron Transfer between a Conjugated Polymer and Cytochrome C for Optical Modulation of Redox Signaling. iScience 2020, 23, 101091. [Google Scholar] [CrossRef] [PubMed]
  27. Bossio, C.; Aziz, I.A.; Tullii, G.; Zucchetti, E.; Debellis, D.; Zangoli, M.; Maria, F.D.; Lanzani, G.; Antognazza, M.R. Photocatalytic Activity of Polymer Nanoparticles Modulates Intracellular Calcium Dynamics and Reactive Oxygen Species in HEK-293 Cells. Front. Bioeng. Biotechnol. 2018, 6, 114. [Google Scholar] [CrossRef] [PubMed]
  28. Abdullaeva, O.S.; Sahalianov, I.; Ejneby, M.S.; Jakešová, M.; Zozoulenko, I.; Liin, S.I.; Głowacki, E.D. Faradaic Pixels for Precise Hydrogen Peroxide Delivery to Control M-Type Voltage-Gated Potassium Channels. Adv. Sci. 2021, 9, 2103132. [Google Scholar] [CrossRef]
  29. Arnault, E.; Barrau, C.; Nanteau, C.; Gondouin, P.; Bigot, K.; Vienot, F.; Gutman, E.; Fontaine, V.; Villette, T.; Cohen-Tannoudji, D.; et al. Phototoxic Action Spectrum on a Retinal Pigment Epithelium Model of Age-Related Macular Degeneration Exposed to Sunlight Normalized Conditions. PLoS ONE 2013, 8, e71398. [Google Scholar] [CrossRef]
Figure 1. (Left) panel: three-dimensional representation of the bio-hybrid system. (Right) panel: two-dimensional axial symmetric computational domain. The NP region is denoted by Ω 1 . The surrounding region is denoted by Ω 2 .
Photonics 09 00710 g001
Figure 2. Electric potential distribution (mV) across the nanoparticle and the surrounding medium for increasing values of R N P : (A) R N P = 150 nm; (B) R N P = 300 nm; (C) R N P = 500 nm.
Photonics 09 00710 g002
Figure 3. Electron and hole number densities in the case of R N P = 150 nm (left); electrons (m−3) maintain the Lambert–Beer light profile due to their limited mobility, accumulating at the illuminated interface. (right) Holes are (m−3) redistributed across the whole volume of the NP.
Photonics 09 00710 g003
Figure 4. Electric potential minimum and maximum values ( mV ) as a function of the light intensity impinging onto the NP, for different values of R N P : (a) R N P = 150 nm (red); (b) R N P = 300 nm (orange); (c) R N P = 500 nm (purple).
Photonics 09 00710 g004
Figure 5. Electric potential distribution (mV) across the nanoparticle and the surrounding medium for increasing ellipticity of the NP. To enhance ellipticity, we increase the radius r 2 parallel to the z-axis and to the light-impinging direction, while the radius r 1 perpendicular to light is kept fixed at 150 nm. (A) r 1 = 150 nm, r 2 = 150 nm; (B) r 1 = 150 nm, r 2 = 250 nm; (C) r 1 = 150 nm, r 2 = 350 nm.
Photonics 09 00710 g005
Figure 6. Electric potential distribution (mV) across the nanoparticle and the surrounding medium for increasing the ellipticity of the NP. To enhance ellipticity, we increase the radius r 1 perpendicular to the r-axis and to the light impinging direction, while the radius r 2 parallel to light is kept fixed at 150 nm. (A) r 1 = 150 nm, r 2 = 150 nm; (B) r 1 = 250 nm, r 2 = 150 nm; (C) r 1 = 350 nm, r 2 = 150 nm.
Photonics 09 00710 g006
Table 1. O 2 current exiting the nanoparticle from the upper ( I u p ) or bottom half ( I b o t ) and relative percentage as a function of the radius of the NP.
150 nm300 nm500 nm
I t o t [A]1.23 · 10 21 7.57 · 10 21 2.96 · 10 20
% ( I u p ) 12%3%1%
% ( I b o t ) 88%97%99%
Table 2. Electric potential ranges ψ for the different NP shapes.
r = r1 = r2r = 150 nmr = 300 nmr = 500 nm
ψ m i n −0.082−0.398−1.04
ψ m a x 0.0670.2600.676
r 1 = 150 nmr 2 = 150 nmr 2 = 250 nmr 2 = 350 nm
ψ m i n −0.082−0.050−0.035
ψ m a x 0.0670.0370.029
r 2 = 150 nmr 1 = 150 nmr 1 = 250 nmr 1 = 350 nm
ψ m i n −0.082−0.102−0.162
ψ m a x 0.0670.0440.042
Publisher’s Note: MDPI stays neutral with regard to jurisdictional claims in published maps and institutional affiliations.

